introduction to biological research. step-by-step analysis of biological data the statistical...
TRANSCRIPT

IntroductionTo Biological Research
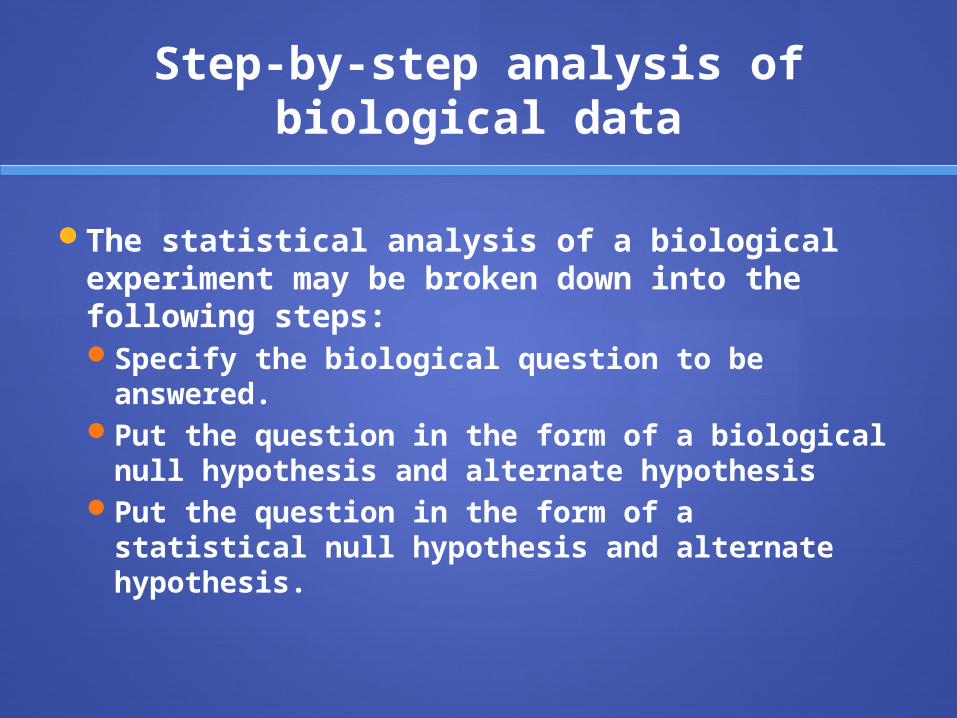
Step-by-step analysis of biological data
The statistical analysis of a biological experiment may be broken down into the following steps:Specify the biological question to be
answered.Put the question in the form of a biological
null hypothesis and alternate hypothesis Put the question in the form of a statistical
null hypothesis and alternate hypothesis.

Null vs. Alternative Hypothesis
A researcher forms two hypotheses for each experiment: a null hypothesis and an alternative hypothesis.
The null hypothesis predicts that the experiment will uphold the status quo or the current theory.
The alternative hypothesis predicts that the experiment will establish a new theory. The alternative hypothesis generally predicts the results expected by the experimenter.
How to Figure Alternative Hypothesis | eHow.com http://www.ehow.com/how_8575517_figure-alternative-hypothesis.html#ixzz296YAjZhH
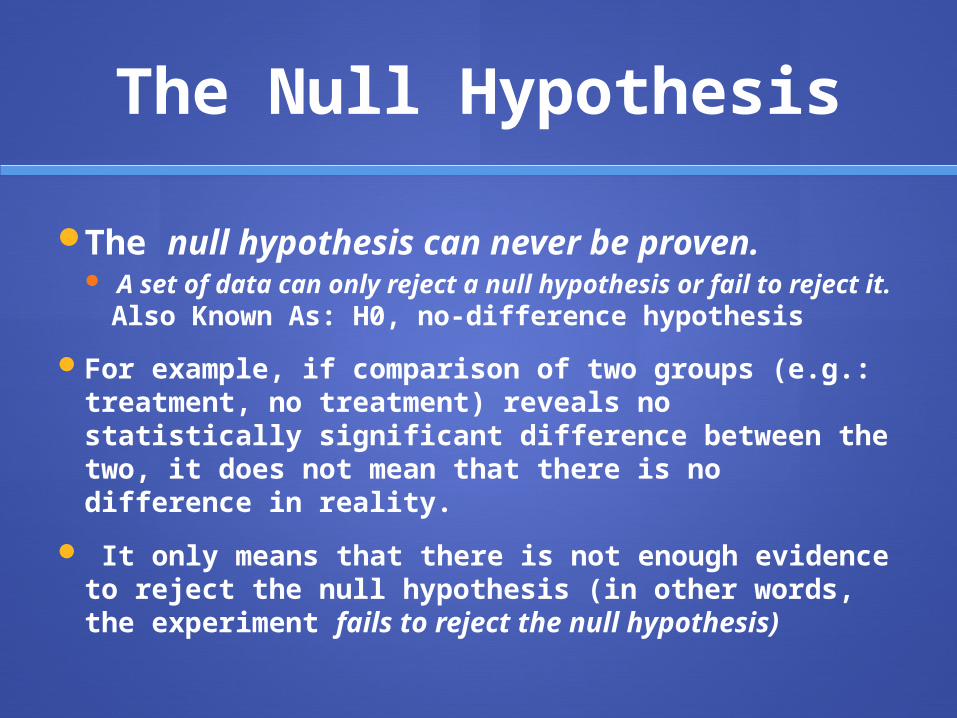
The Null Hypothesis
The null hypothesis can never be proven. A set of data can only reject a null hypothesis or fail
to reject it. Also Known As: H0, no-difference hypothesis
For example, if comparison of two groups (e.g.: treatment, no treatment) reveals no statistically significant difference between the two, it does not mean that there is no difference in reality.
It only means that there is not enough evidence to reject the null hypothesis (in other words, the experiment fails to reject the null hypothesis)
The Null Hypothesis
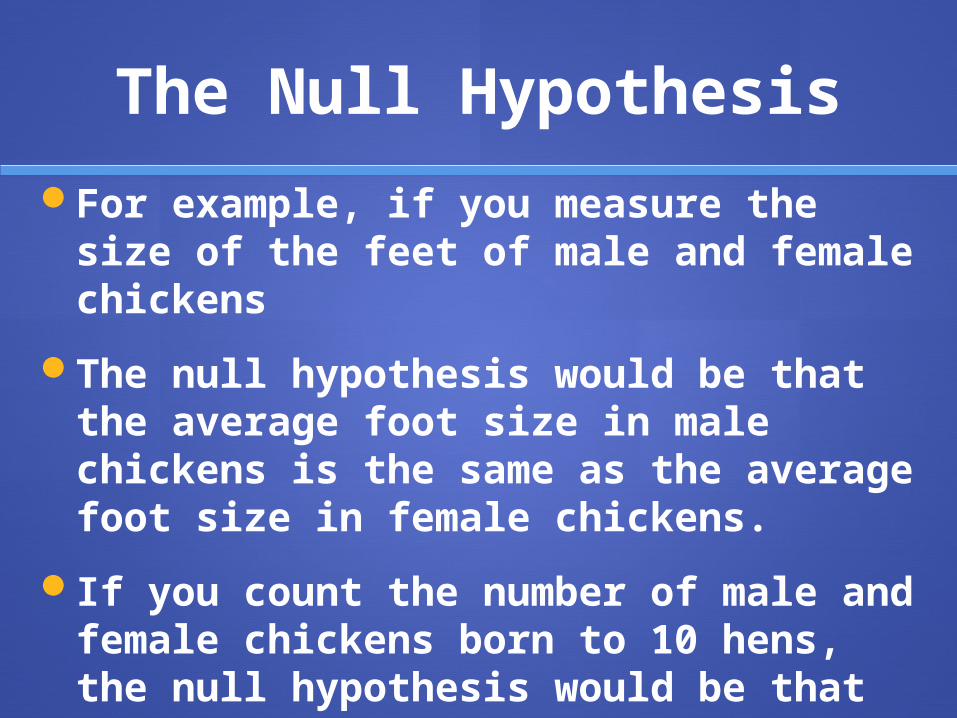
For example, if you measure the size of the feet of male and female chickens
The null hypothesis would be that the average foot size in male chickens is the same as the average foot size in female chickens.
If you count the number of male and female chickens born to 10 hens, the null hypothesis would be that the ratio of males to females is equal to the theoretical expectation of a 1:1 ratio.

Testing the Null Hypothesis
Statistics is designed to measure the extent of apparent departure from the null hypothesis
The primary goal of a statistical test is to determine whether an observed data set is so different from what you would expect under the null hypothesis that you should reject the null hypothesis.
Testing the Null Hypothesis
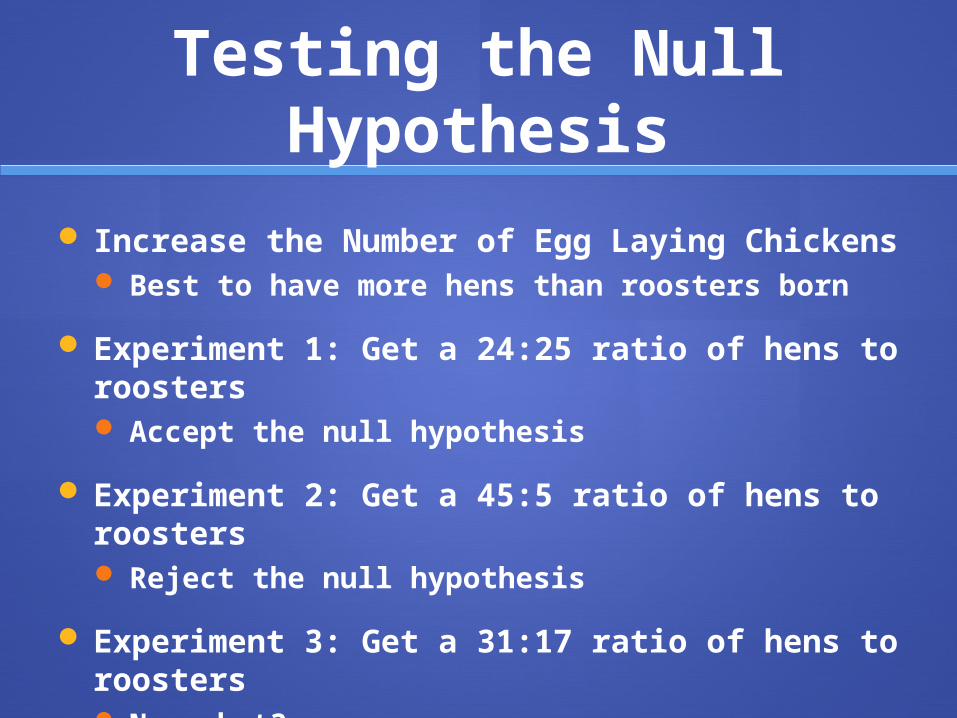
Increase the Number of Egg Laying Chickens Best to have more hens than roosters born
Experiment 1: Get a 24:25 ratio of hens to roosters Accept the null hypothesis
Experiment 2: Get a 45:5 ratio of hens to roosters Reject the null hypothesis
Experiment 3: Get a 31:17 ratio of hens to roosters Now what?
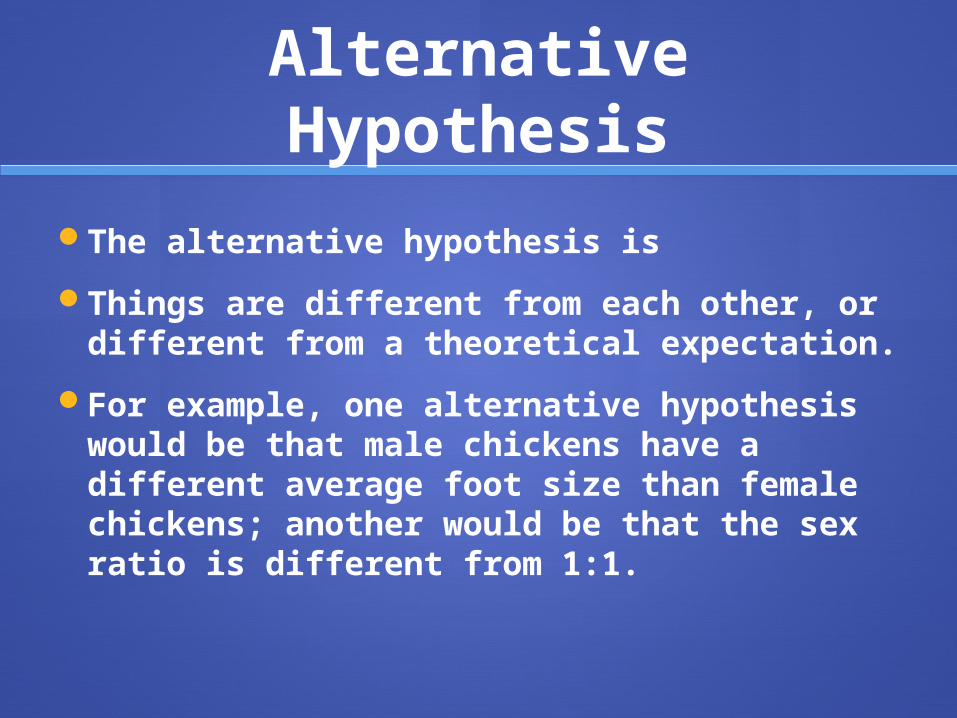
Alternative Hypothesis
The alternative hypothesis is
Things are different from each other, or different from a theoretical expectation.
For example, one alternative hypothesis would be that male chickens have a different average foot size than female chickens; another would be that the sex ratio is different from 1:1.

Step-by-step analysis of biological data
Determine which variables are relevant to the question.
Determine what kind of variable each one is.
Based on the number of variables, the kind of variables, and other information about experiment, choose the best statistical test to use.
Apply the appropriate statistical test, and interpret the result.
Communicate your results effectively, usually with a graph or table.
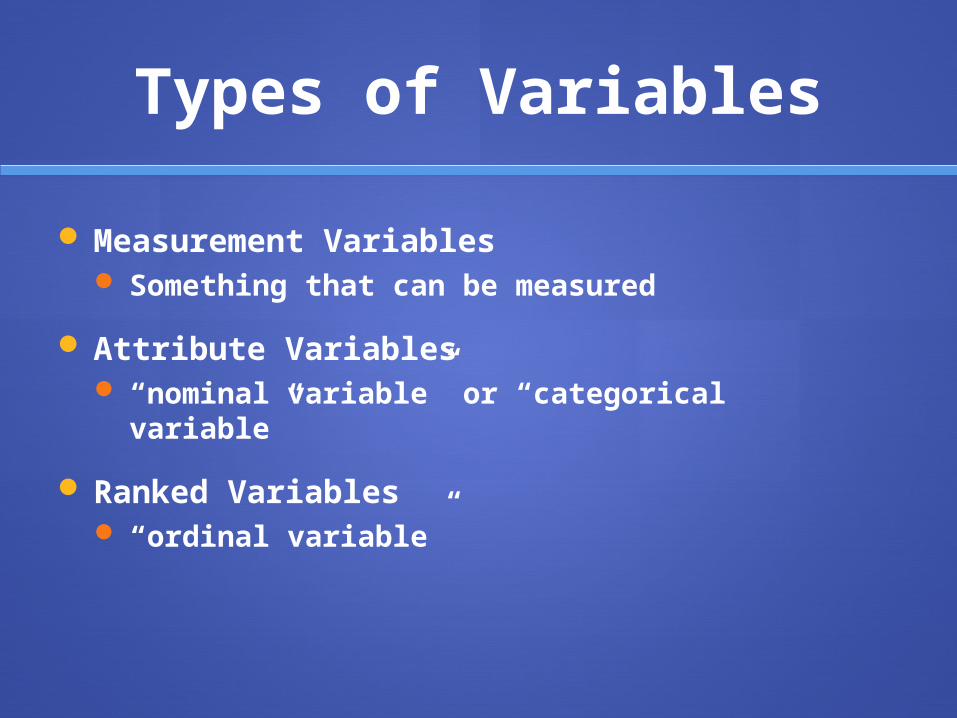
Types of Variables
Measurement Variables Something that can be measured
Attribute Variables “nominal variable” or “categorical variable”
Ranked Variables “ordinal variable”

Measurement Variables
Can measure somethingt-testANOVA

Attribute Variables
Typically a name and not a numberMale v. FemaleFound Subject by trailing v. Did
not find Subject by trailingUse G-test of independence

Ranked Variables
Variables that can be put in order from smallest to largestNon-parametric tests are used
Kruskal-Wallis test

Ambiguous Variables
Two categories Trailed vs. Didn’t Trail Several measurements under each
categoryConsider Dogs trailing as a Attribute
VariableUse a t-test

Ambiguous Variables
For the purposes of this class, use the following rule of thumb: ---a measurement variable with only two values should be treated as an attribute variable; ---a measurement variable with six or more values should be treated as a measurement variable
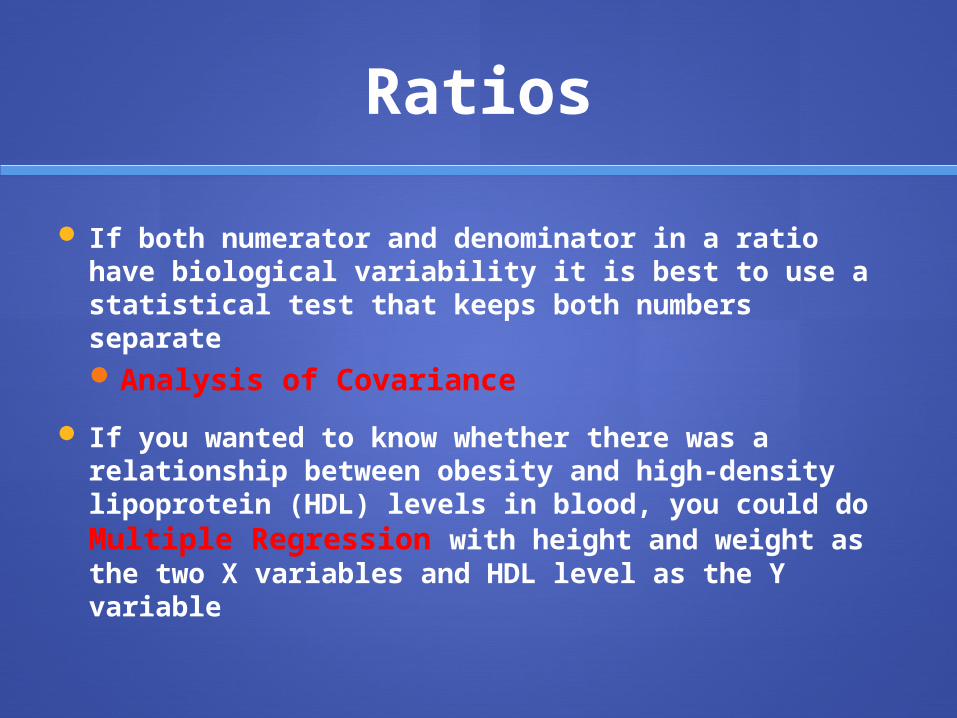
Ratios
If both numerator and denominator in a ratio have biological variability it is best to use a statistical test that keeps both numbers separateAnalysis of Covariance
If you wanted to know whether there was a relationship between obesity and high-density lipoprotein (HDL) levels in blood, you could do Multiple Regression with height and weight as the two X variables and HDL level as the Y variable
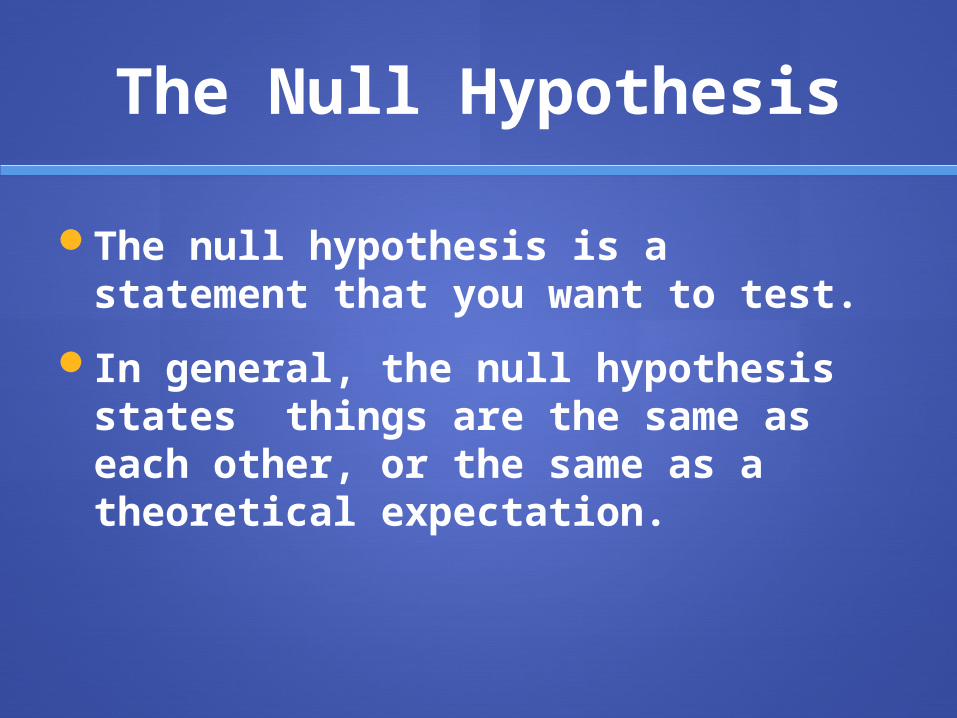
The Null Hypothesis
The null hypothesis is a statement that you want to test.
In general, the null hypothesis states things are the same as each other, or the same as a theoretical expectation.

Probability
The basic idea of a statistical test is to identify a null hypothesis, collect some data, then estimate the probability of getting the observed data if the null hypothesis were true.
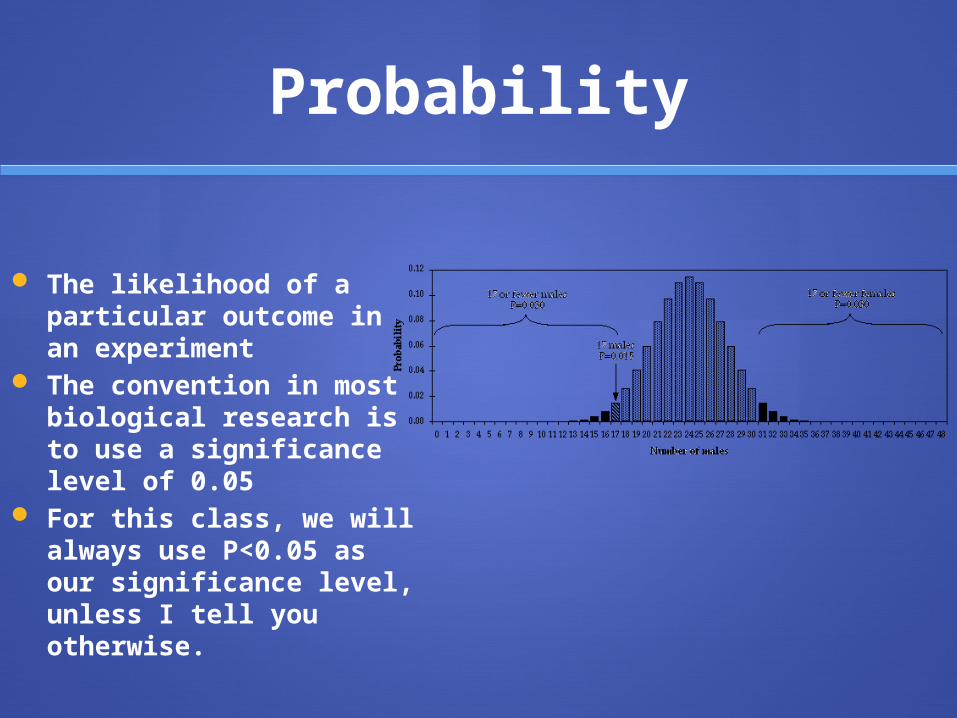
Probability
The likelihood of a particular outcome in an experiment
The convention in most biological research is to use a significance level of 0.05
For this class, we will always use P<0.05 as our significance level, unless I tell you otherwise.

Probability
The probability of sampling a particular kind of individual is equal to the proportion of that kind of individual in the population. For example, in fall 2012 there were 21,121 students at Victor Valley College, and 16,428 of them were over the age of 25. If a single student were sampled at random, the probability that they would be over the age of 25 would be 16,428 / 21,121, or 0.778. In other words, 77.8% of students are over 25, so if I pick one student at random, the probability that they are over 25 is 77.8%.

Type I verses Type II Error
The significance level you use depends on the costs of different kinds of errors.
With a significance level of 0.05, you have a 5 percent chance of rejecting the null hypothesis, even if it is true.
If you try 100 treatments on your chickens, and none of them really work, 5 percent of your experiments will give you data that are significantly different from a 1:1 sex ratio, just by chance.
This is called a "Type I error," or "false positive."
If there really is a deviation from the null hypothesis, and you fail to reject it, that is called a "Type II error," or "false negative.”

Two Tailed Test
For example, we may wish to compare the mean of a sample to a given value x using a t-test.
Our null hypothesis is that the mean is equal to x.
A two-tailed test will test both if the mean is significantly greater than x and if the mean significantly less than x.
The mean is considered significantly different from x if the test statistic is in the top 2.5% or bottom 2.5% of its probability distribution, resulting in a p-value less than 0.05.

One Tailed Test
Our null hypothesis is that the mean is equal to x.
A one-tailed test will test either if the mean is significantly greater than x or if the mean is significantly less than x, but not both

One Tailed
Imagine you have developed a new drug that you believe is an improvement over an existing drug. You wish to maximize your ability to detect the improvement, so you opt for a one-tailed test. In doing so, you fail to test for the possibility that the new drug is less effective than the existing drug.
For example, imagine again that you have developed a new drug. It is cheaper than the existing drug and, you believe, no less effective. In testing this drug, you are only interested in testing if it less effective than the existing drug. You do not care if it is significantly more effective. You only wish to show that it is not less effective.

Two Tailed
For this class, we will always use two-tailed probabilities, unless I make it very clear that only one direction of deviation from the null hypothesis would be interesting.
Reporting
In the olden days, when people looked up P-values in printed tables, they would report the results of a statistical test as "P<0.05", "P<0.01", "P>0.10", etc.
Nowadays, almost all computer statistics programs give the exact P value resulting from a statistical test, such as P=0.0297 That's what you should report in your
publications.

Chi Square Test of Independence
The chi-square test may be used both as a test of goodness-of-fit (comparing frequencies of one attribute variable to the theoretical expectations) and as a test of independence (comparing frequencies of one attribute variable for different values of a second attribute variable).

Chi Square Test of Independence
The chi-squared test of independence is used when you have two attribute variables, each with two or more possible values.
X2