introduction to biological networks. protein-gene interactions protein-protein interactions proteome...
Post on 20-Dec-2015
220 views
TRANSCRIPT
Introduction to biological networks

protein-gene interactions
protein-protein interactions
PROTEOME
GENOME
Citrate Cycle
METABOLISM
Bio-chemical reactions
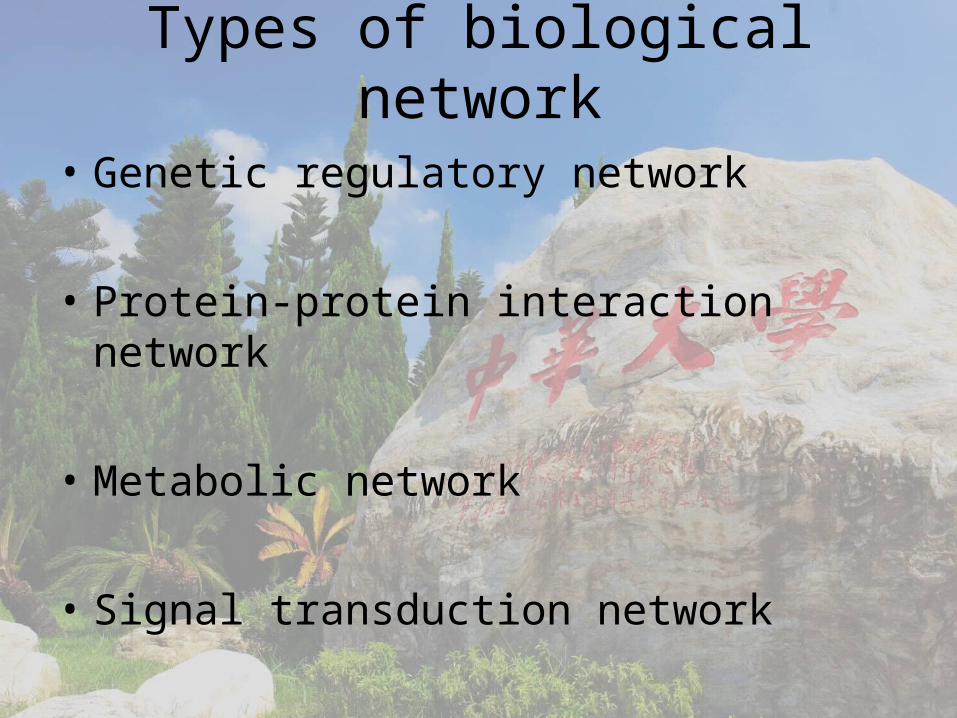
Types of biological network
• Genetic regulatory network
• Protein-protein interaction network
• Metabolic network
• Signal transduction network

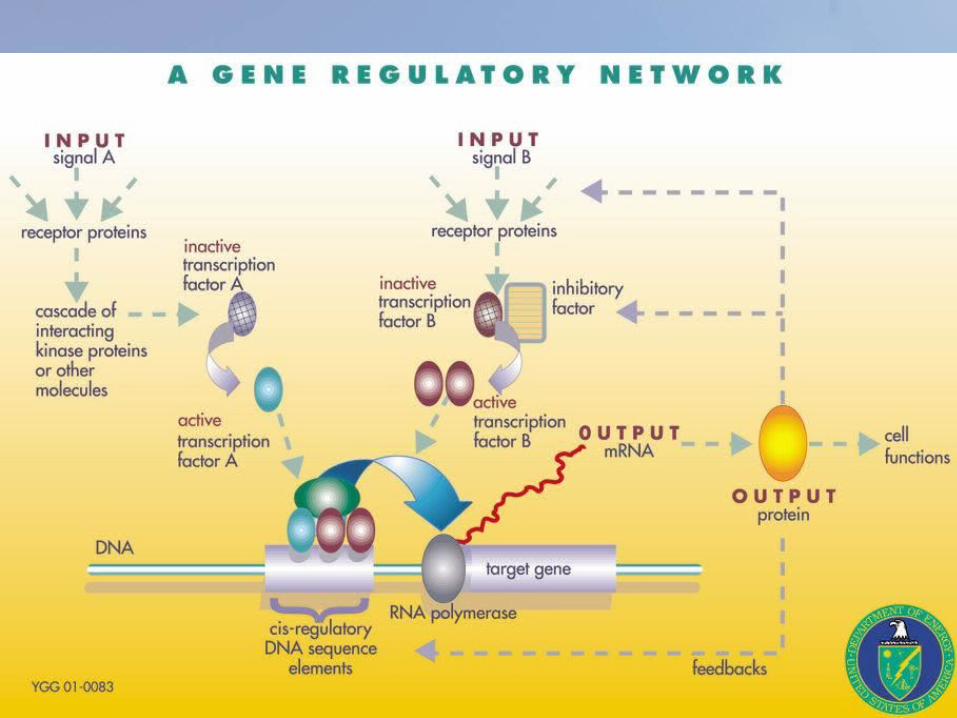
Gene Regulation Network
Regulatory proteins
Promoter 1
Promoter 3
Promoter 2

Transcription network
activator
repressor

Node: protein
Edge: protein-protein interaction
Protein-Protein Interaction Network
Saccharomyces cerevisiae
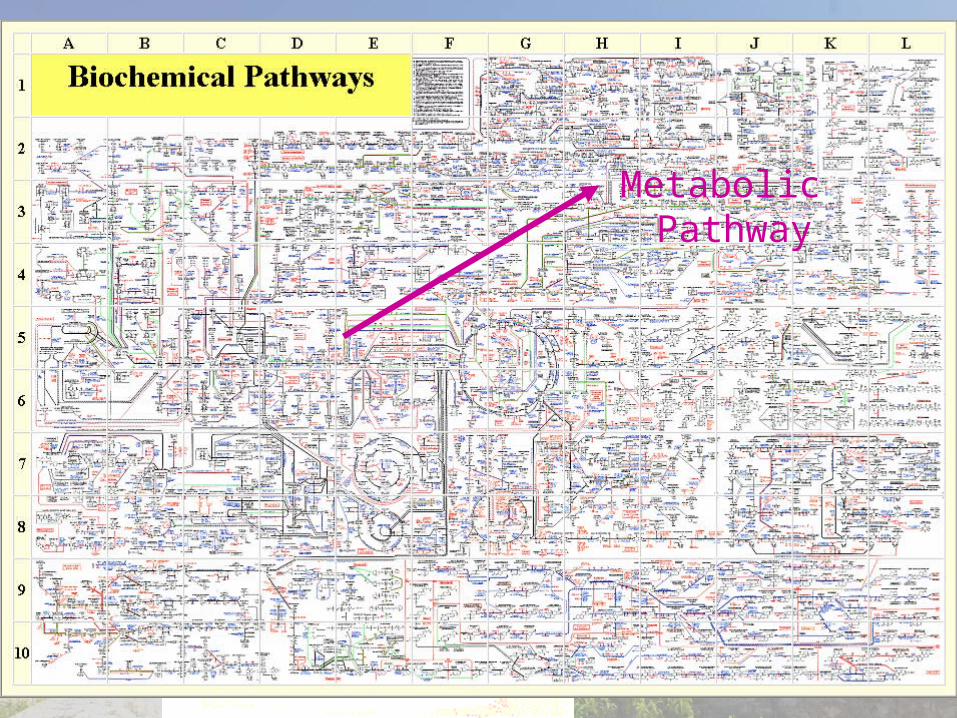
Metabolic Network
Node: Chemicals or Proteins
Edge: Chemical reaction
Metabolic Pathway

cAMP signaling transduction of Dictyostelium discoideum
Dictyostelium discoideum

High throughput experiments to identify interaction in
network
Experiments for Protein-Protein Interaction

Saccharomyces CerevisiaeNature, 415, 180, (2001)
Nature, 415, 141, (2001)
Cellzome is a private Corporation in German
HMS-PCITAP tag

Helicobacter Pylori

Drosophila melanogaster
Science, 5 Dec, 302, 1727, (2003)
Two hybrid

Caenorhabditis elegans (Worm)Caenorhabditis elegans (Worm)

Experimetal Methods • HMS-PCI(High-throughput mass spectro
metric protein complex identification)• TAP (Tandem Affinity Purification)• Yeast two hybrid• Immunoprecipitation• Phage display• Fluorescence resonance energy transfer
(FRET)

TAP tag• TAP tag contains 1. two IgG binding domains of Staphylococcus aureus p
rotein A (ProtA)
2. Calmodulin binding petide (CBP)
3. TEV protease cleavage site
TAP tag Purification


TAP tag
• Advantage: Detects in physiological condition, high-t
hroughput
• Disavantage: Tag may disturb protein interaction
miss the protein complexes that are not present in such condition

HMS-PCI• High-throughput mass spectrometric pr
otein complex indentification
• Use epitope tag

Yeast Two Hybrid Method

• Advantage : In vivo experiment, transient and
unstable interactions could be detected
• Disadvantage: many false positive, only two proteins
were detected at a time it take place in the nucleus, so many
protein interactions are not detected in their native environment

Immunoprecipitation

•Advantages of this approach
This approach can test the protein associations in nature condition in the cell.
The isolated proteins (or
complex) can be used to do other functional assay.
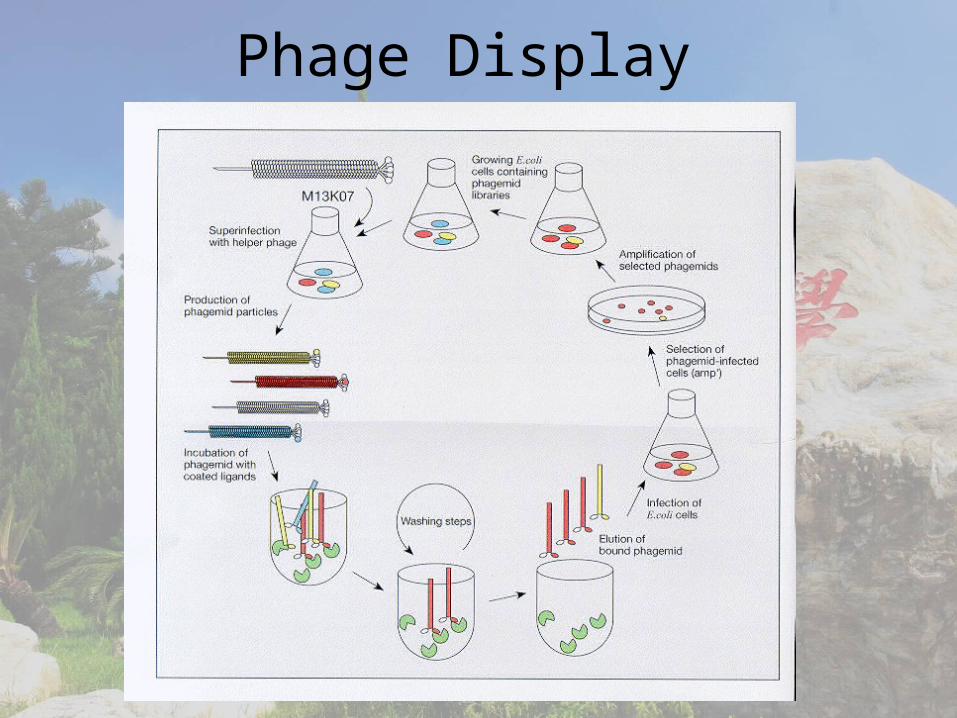
Phage Display

• Advanage:
high throughput
Can be used to elucidate nuclear protein interaction.

When the donor and acceptor come close to 10~100 , the donor will transmit energy to acceptor, we could monotor the protein interaction by fluorescence.
A
Fluorescence Resonance Energy Transfer (FRET)
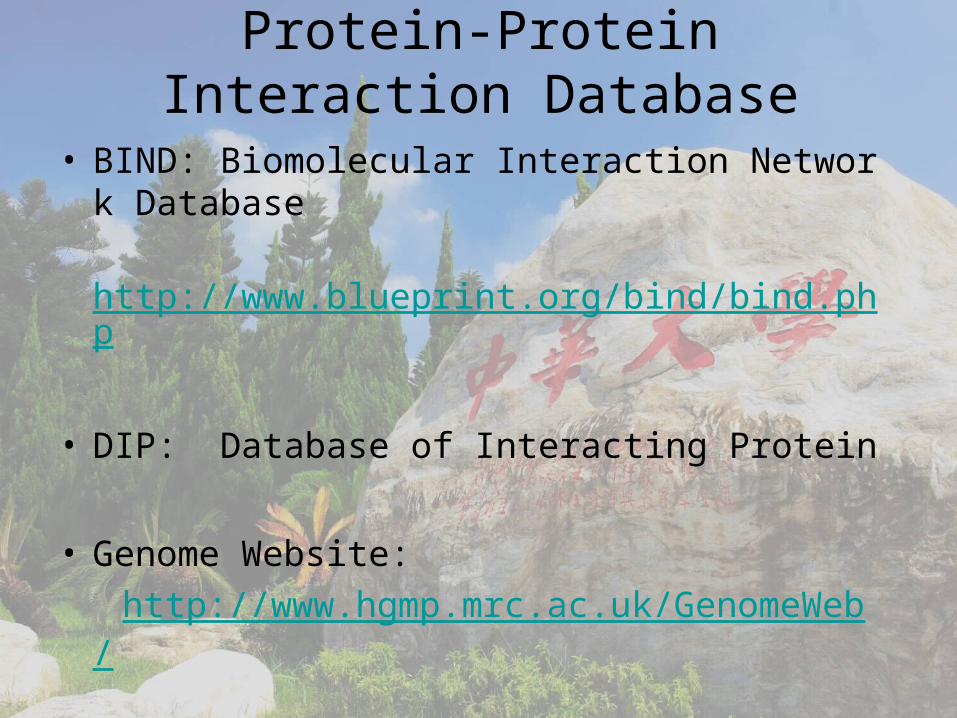
Protein-Protein Interaction Database
• BIND: Biomolecular Interaction Network Database
http://www.blueprint.org/bind/bind.php
• DIP: Database of Interacting Protein
• Genome Website: http://www.hgmp.mrc.ac.uk/GenomeWeb/


☺About 80000 interactions between yeast proteins are available from high-throughput methods.
☺Only ~2400 interactions are supported by more than two methods.
☺Possible reasons are ® the methods may not have reached
saturation ® many methods may produce false
positives ® some methods has difficulties for certain
types of interaction.
Yeast protein-protein interaction

Assign 80000 interactions of 5400 yeast proteins a confidence
value11855 interactions with high and medium confidence among 2617
proteins

Biological significance of protein-protein interaction?
• Assemble proteins together into protein complex
• Bring the proteins(signaling proteins) to its activate or function place
• Binding of one protein to another can induce conformational change that affect activity or accessibility of additional binding domain
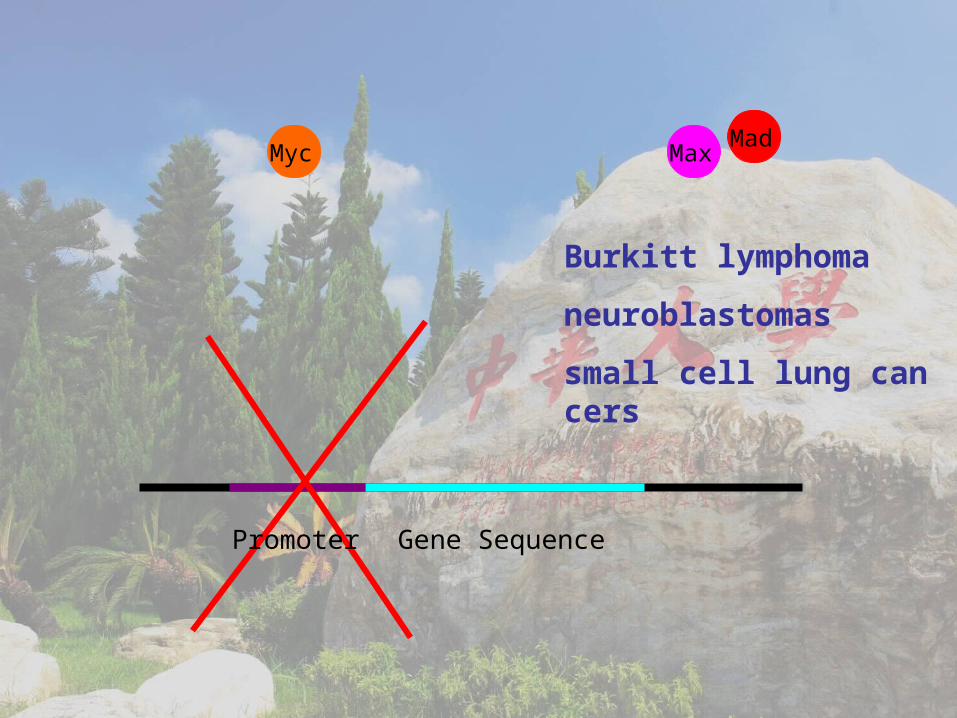
Myc Max
Mad
Promoter Gene Sequence
Burkitt lymphoma
neuroblastomas
small cell lung cancers
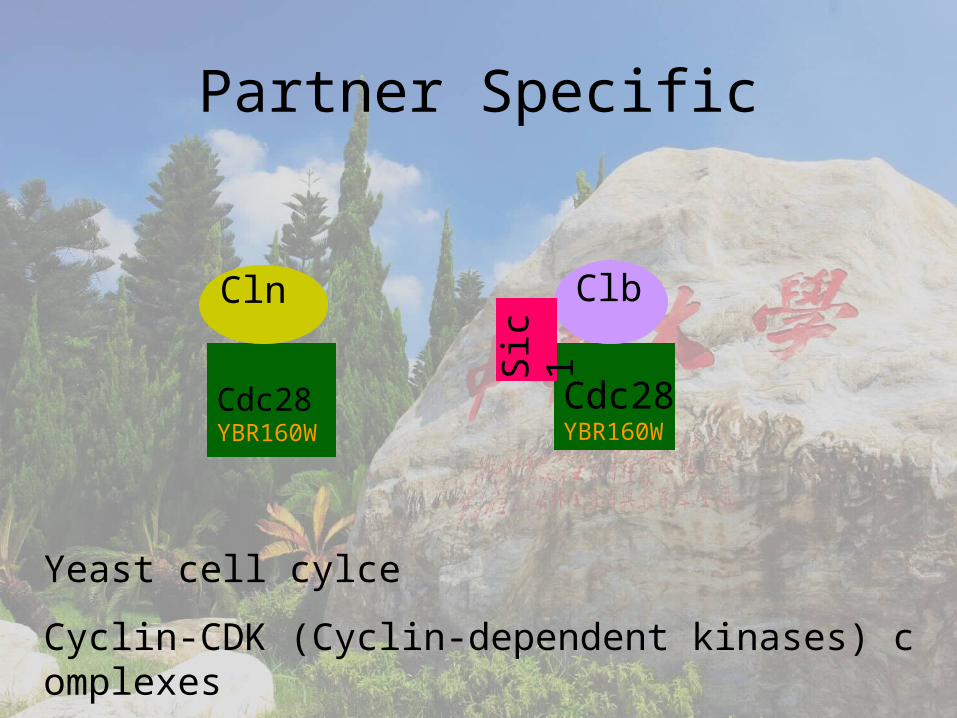
Cdc28YBR160W
Cln
Cdc28YBR160W
Clb
Sic
1
Partner Specific
Yeast cell cylce
Cyclin-CDK (Cyclin-dependent kinases) complexes
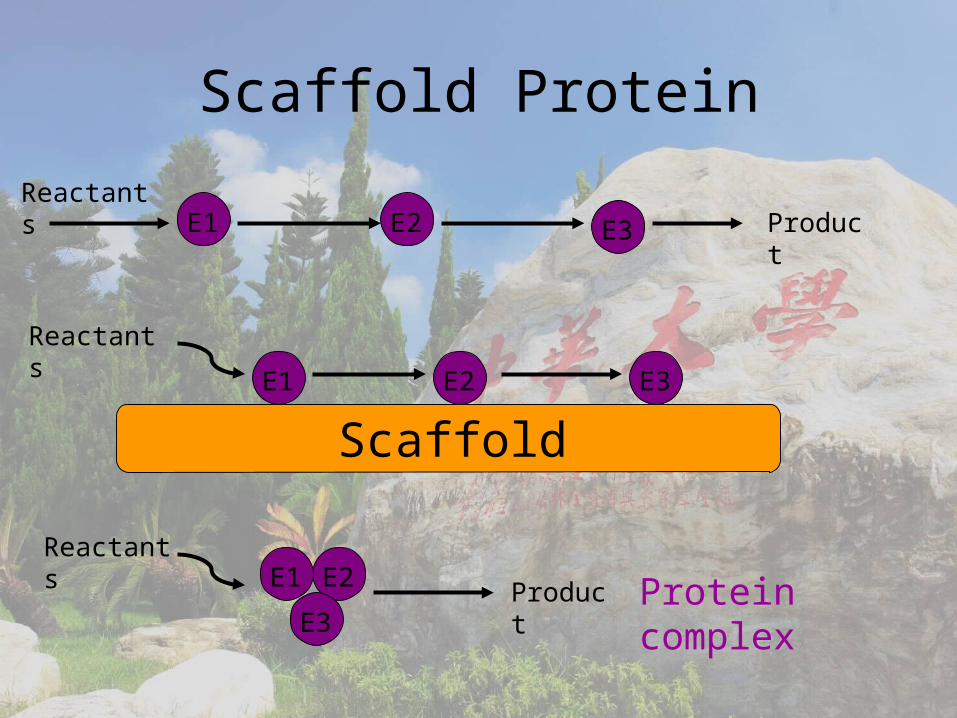
Scaffold Protein
E1 E2 E3 ProductReactants
ScaffoldE1 E2 E3
Reactants
E1 E2
E3
Reactants Product Protein complex

Experiments for genetic regulation interaction
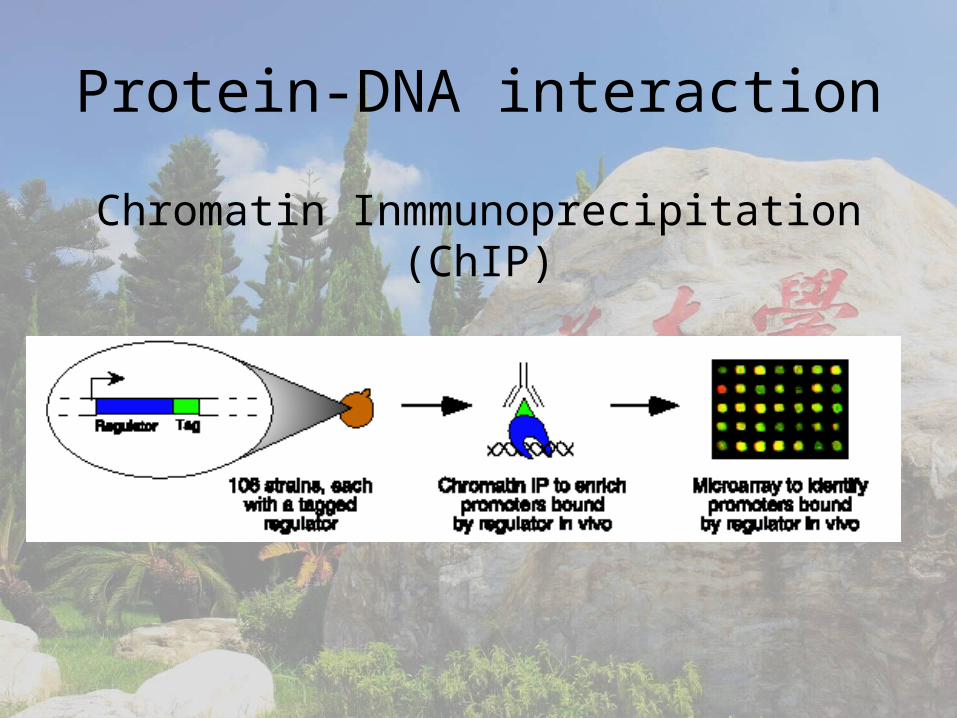
Protein-DNA interaction
Chromatin Inmmunoprecipitation (ChIP)

Science 298, 799, (2002).

Yeast cell cycle regulatory network

Mathematical modeling of biological networks as a
graph
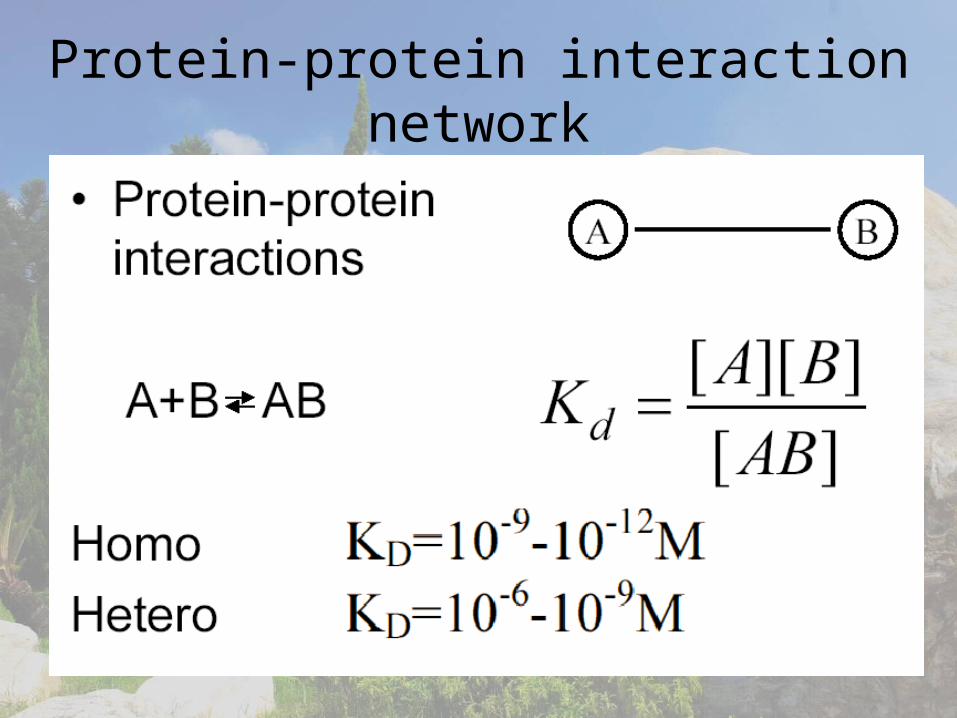
Protein-protein interaction network
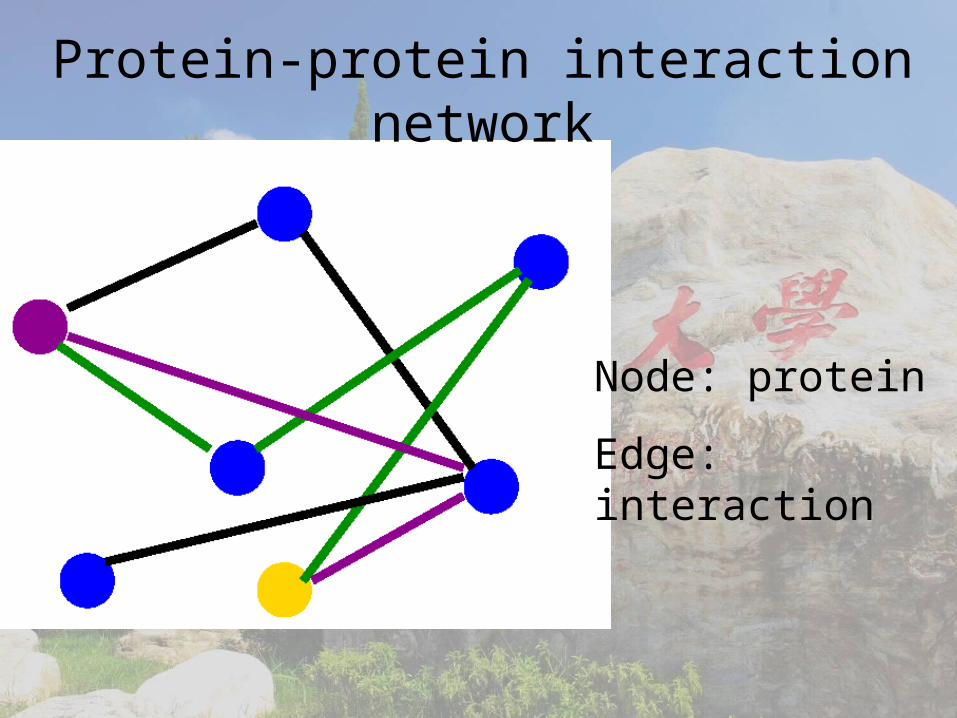
Protein-protein interaction network
Node: protein
Edge: interaction
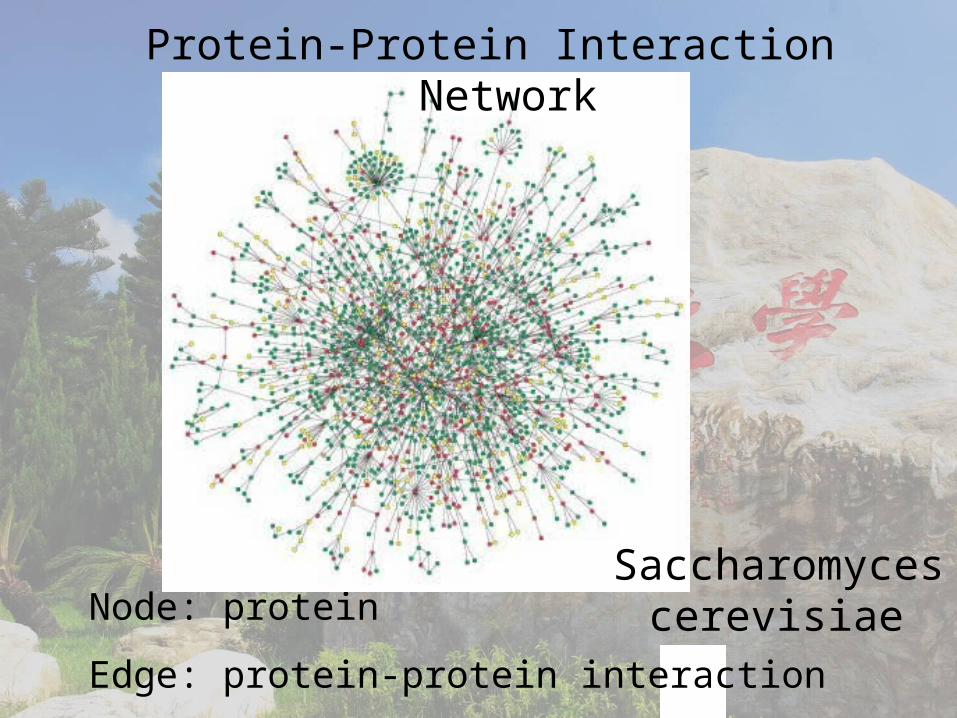
Node: protein
Edge: protein-protein interaction
Protein-Protein Interaction Network
Saccharomyces cerevisiae
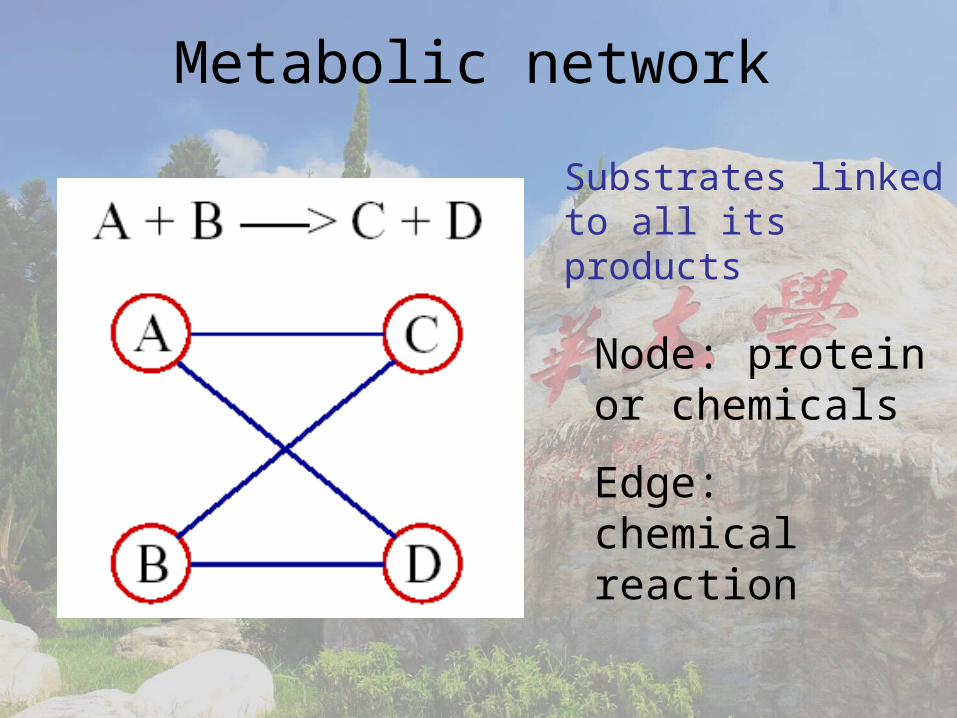
Metabolic network
Node: protein or chemicals
Edge: chemical reaction
Substrates linked to all its products

Biochemical reduction
Pathway map Graph representatio
n
Reduced graph
representation

E. coli metabolic network with biochemical reduction

Topological reductionRemove hair nodes, and replacing arc with single
link

E. coli metabolic network with topological reduction

Both protein-protein interaction network and metabolic network are modeling as undirected
graphs.
Adjacency Matrix
• Aij= 1 if ith protein interacts with jth protein
• Aij=0 otherwise
• Aij=Aji (undirected graph)
• Aij is a sparse matrix, most elements of Aij are zero

Gene Regulation Network
Regulatory proteins
Promoter 1
Promoter 3
Promoter 2
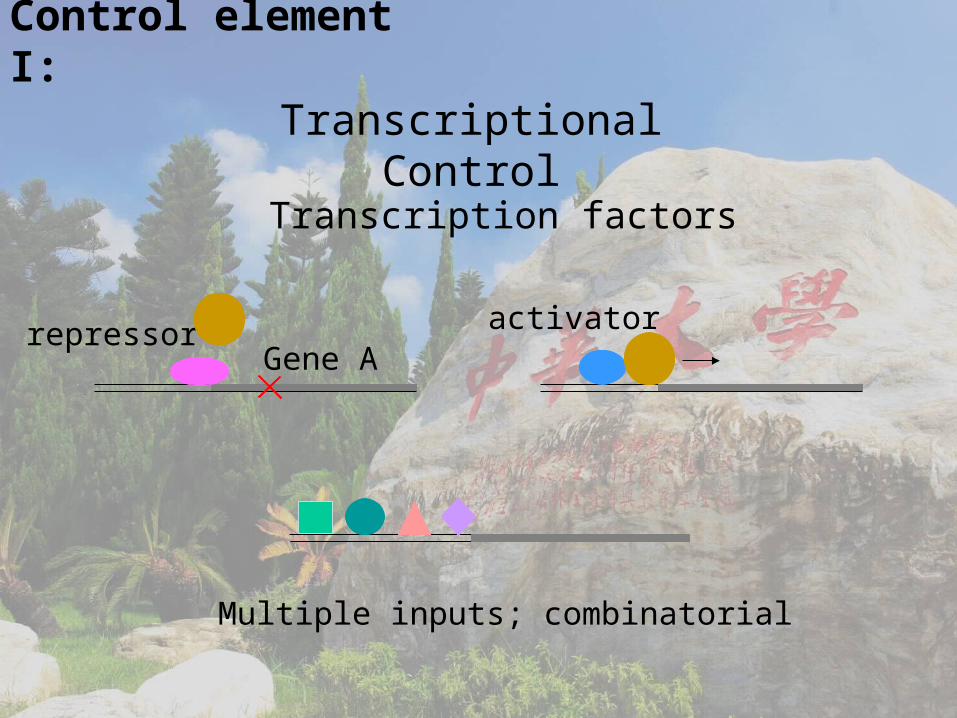
Control element I:
Transcriptional Control
Gene Arepressor activator
Multiple inputs; combinatorial
Transcription factors

Control element IIProtein-Protein Interaction
— kinase and phosphatase
• On-off switch• Multiple sites• Location control (nuclear entry)• Tags for degradation• Signal transduction
P
Pkinase
phosphataseP
Pkinase
phosphatase

Protein interactions
• On-off switching upon binding
• Partner-specific
Cdc28
Cln
Cdc28
Clb
Sic1
— protein-protein binding

Integrated genetic network
A
C
B
A activates B
A inhibits C
A is the activator of B
A is the inhibitor of C

Integrated genetic network
A
C
B
A activates B
A inhibits C
A is the activator of B
A is the inhibitor of C

Integrated genetic network
Green arrow: activate interaction
Red arrow: inhibitive interaction

Adjacency Matrix
• Aij= 1 for activated interaction (green arrow)
• Aij=-1 for inhibitive interaction (red arrow)
• Aij ≠Aij (directed graph)
• Aij=0 otherwise

課 堂 練 習• Write down the adjacency matrix
for the following graph.