introduction to bioinformatics - university of...
TRANSCRIPT
Jianlin Cheng, PhD
Department of Computer Science
Informatics Institute
Introduction to Bioinformatics
2011
Topics
• Introduction
• Biological Sequence Alignment and Database Search
• Analysis of gene expression data

What’s Bioinformatics?
An interdisciplinary science of developing and applying computational techniques to address problems in molecular biology
• Develop bioinformatics algorithms and tools
• Apply bioinformatics tools to address biological problems

History of Bioinformatics
Physics
How does a new interdisciplinary science emerge?
Biochemistry Genetics
Molecular Biology
1950s
Electrical
Engineering
Mathema
tician
Computer and
Information Science
Watson, Crick, Peruz, Kendrew,
Pauling,Sanger…
Von Newman, Shannon
Knuth, Dijkstra…
Natural Sciences Engineering/Math
Experimental Science
Information Science
1960s
1970s
1980s
1990s
2000s Bioinformatics
Comp/Info Approach to Bio

Genome Sequencing

High-Throughput Sequencing
• Transcriptome (EST, RNA-Seq, Chip-Seq)
• Proteomics (Mass Spectrometry)
• Metabolomics


What can we do with these huge
amount of data?
Find buried treasure - Doug Brutlag, 1999.
Typical Bioinformatics Problems
• What family does this gene / protein belong to?
• Are there other known homologous proteins?
• What is the function and structure of this protein?
• What biological pathway does this protein
participate in?
• Is a mutation on a gene / protein related to a
phenotype or disease?
• Is a gene differentially expressed in a biological
condition?

Fundamental Problems:
Sequence Comparison
• Why do we compare sequences?
• What’s similarity between two sequences?
• How to compare sequences?
• Is similarity significant?

Importance of Similarity
Comparison
• Identify evolutionary relationship between
genes and proteins
• Similar genes/proteins have similar function
• Similar proteins have similar structures

Global Pairwise Sequence Alignment
ITAKPAKT-TSPKEQAIGLSVTFLSFLLPAG-VLYHL
ITAKPQWLKTSE-------SVTFLSFLLPQTQGLYHL
Alignment (similarity) score
Three Main Issues
1.Definition of alignment score
2.Algorithms of finding the optimal alignment
3.Evaluation of significance of alignment score

A simple scoring scheme • Score of character pair: S(match)=1, S(not_match)
= -1, S(gap-char) = -1
• Score of an alignment = n
iS1
ITAKPAKTPTSPKEQAIGLSVTFLSFLLPAGWVLYHL
ITAKPQWLKSTE-------SVTFLSFLLPQTQGLYHL
5 – 7 – 7 +10 -4 + 4= 1

Optimization
• How can we find the best alignment to
maximize alignment score?
• How many possible alignments exist for
two sequences with length m and n?

Total Number of Possible Alignments
A G A A T T C A A G G A A A A A T T C G C
AGATCAGAAAT-G
--AT-AG-AATCC
m + n

Total Number of Alignments
Select m positions out of m+n possible positions:
!!
)!(
nm
nm
m
nm
Exponential!
If m = 300, n = 300, total = 1037


Needleman and Wunsch Algorithm
• Given sequences P and Q, we use a matrix M to record the optimal alignment scores of all prefixes of P and Q. M[i,j] is the best alignment score for the prefixes P[1..i] and Q[1..j].
• M[i,j] =
max [
M[i-1,j-1] + S(P[i],Q[j]),
M[i,j-1] + S(-, Q[j])
M[i-1,j] + S(P[i], -)
]
Dynamic Programming

Dynamic Programming Algorithm
•Initialization
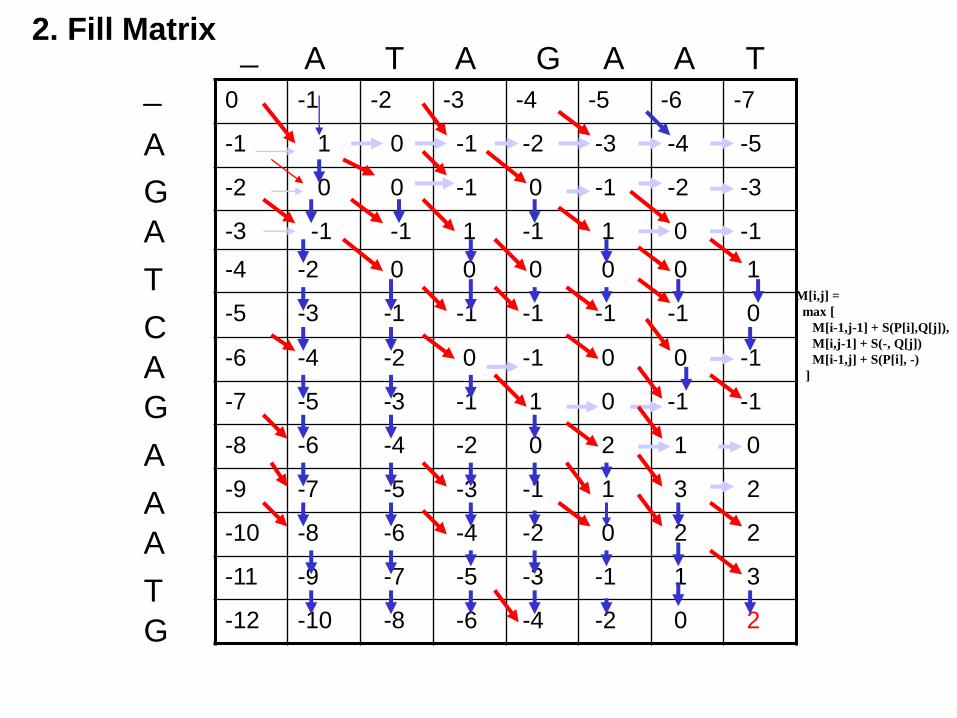
•Matrix fill (scoring)
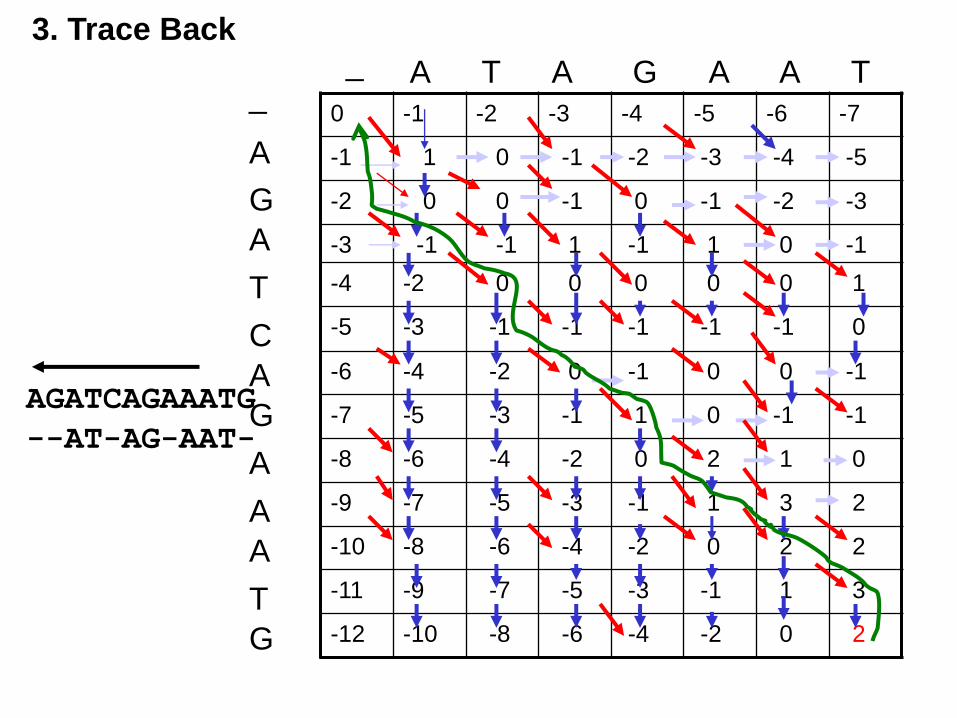
•Trace back (alignment)
Three-Step Algorithm:

0 -1 -2 -3 -4 -5 -6 -7
-1
-2
-3
-4
-5
-6
-7
-8
-9
-10
-11
-12
A T A G A A T 1. Initialization of Matrix M
A
_ _
G
A
T
C
A
G
A
A
A
T
G
i
j

0 -1 -2 -3 -4 -5 -6 -7
-1 1
-2 0
-3 -1
-4 -2
-5 -3
-6 -4
-7 -5
-8 -6
-9 -7
-10 -8
-11 -9
-12 -10
A T A G A A T 2. Fill Matrix
A
_
_
G
A
T
C
A
G
A
A
A
T
G
M[i,j] =
max [
M[i-1,j-1] + S(P[i],Q[j]),
M[i,j-1] + S(-, Q[j])
M[i-1,j] + S(P[i], -)
]

0 -1 -2 -3 -4 -5 -6 -7
-1 1 0
-2 0 0
-3 -1 -1
-4 -2 0
-5 -3 -1
-6 -4 -2
-7 -5 -3
-8 -6 -4
-9 -7 -5
-10 -8 -6
-11 -9 -7
-12 -10 -8
A T A G A A T 2. Fill Matrix
A
_
_
G
A
T
C
A
G
A
A
A
T
G
M[i,j] =
max [
M[i-1,j-1] + S(P[i],Q[j]),
M[i,j-1] + S(-, Q[j])
M[i-1,j] + S(P[i], -)
]
0 -1 -2 -3 -4 -5 -6 -7
-1 1 0 -1 -2 -3 -4 -5
-2 0 0 -1 0 -1 -2 -3
-3 -1 -1 1 -1 1 0 -1
-4 -2 0 0 0 0 0 1
-5 -3 -1 -1 -1 -1 -1 0
-6 -4 -2 0 -1 0 0 -1
-7 -5 -3 -1 1 0 -1 -1
-8 -6 -4 -2 0 2 1 0
-9 -7 -5 -3 -1 1 3 2
-10 -8 -6 -4 -2 0 2 2
-11 -9 -7 -5 -3 -1 1 3
-12 -10 -8 -6 -4 -2 0 2
A T A G A A T
3. Trace Back
A
_ _
G
A
T
C
A
G
A
A
A
T
G
AGATCAGAAATG
--AT-AG-AAT-

Transcription binding site

Smith-Waterman Algorithm
Same dynamic program algorithm as global alignment except for three differences.
1. All negative scores is converted to 0
2. Alignment can start from anywhere in the matrix
3. Alignment can end at anywhere in the matrix
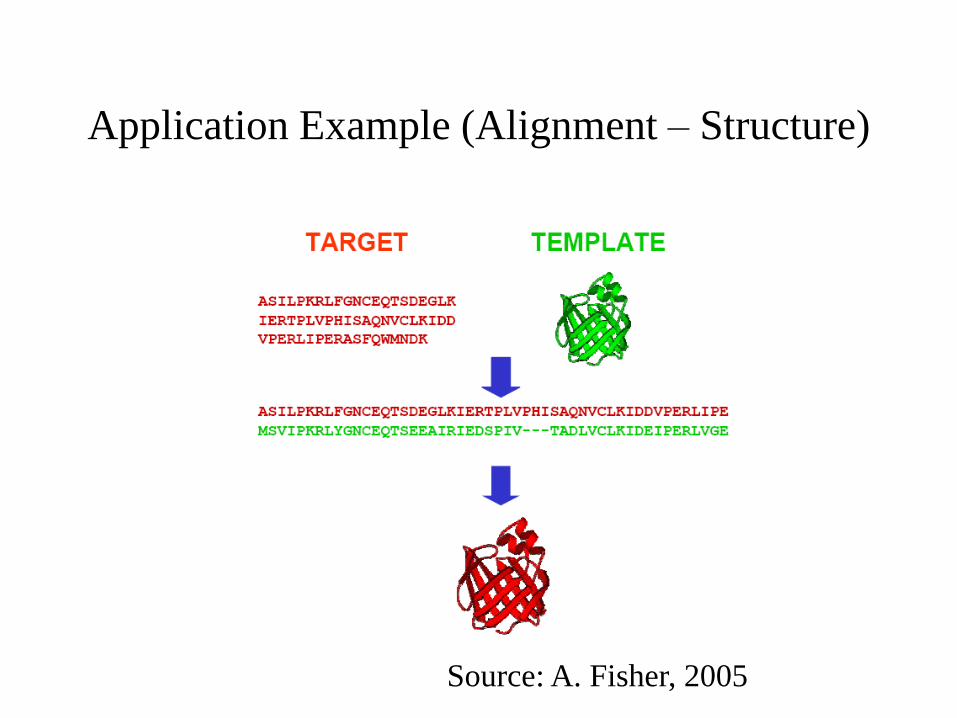
Application Example (Alignment – Structure)
Source: A. Fisher, 2005

Global and Local Alignment Tools
• NEEDLE (global alignment)
http://bioweb.pasteur.fr/seqanal/interfaces/needle.html
• WATER (local alignment)
http://bioweb.pasteur.fr/seqanal/interfaces/water.html

Scoring Matrix
• How to accurately measure the similarity between amino acids (or nucleotides) is one key issue of sequence alignment.
• For nucleotides, a simple identical / not identical scheme is mostly ok.
• Due to various properties of amino acids, it is hard and also critical to measure the similarity between amino acids.

Evolutionary Substitution Approach
• During evolution, the substitution of similar (or dissimilar) amino acids is more (or less) likely to be selected within protein families than random substitutions (M. Dayhoff)
• The frequency / probability one residue substitutes another one is an indicator of their similarity.

PAM Scoring Matrices (M. Dayhoff)
• Select a number of protein families.
• Align sequences in each family and count the frequency of amino acid substitution of each column. The frequency is used to compute the empirical substitution probability of which residue i substitutes residue j (Pij).
• Similarity score is ratio of observed substitution probability over the random substitution probability. S(i,j) = log(Pij / (Pi * Pj)). Pi is the observed probability of residue i and Pj is the observed probability of residue j
• PAM: Point Accepted Mutation

A Simplified Example Chars Prob.
A 6 / 10
C 1 / 10
G 2 / 10
T 1 / 10
A C G T
A 30 6 12 6
C 6 0 2 1
G 12 2 1 2
T 6 1 2 0
ACGTCGAGT
ACCACGTGT
CACACTACT
ACCGCATGA
ACCCTATCT
TCCGTAACA
ACCATAAGT
AGCATAAGT
ACTATAAGT
ACGATAAGT
Substitution Frequency Table
Total number of substitutions: 90
A C G T
A .33 .07 .14 .07
C .07 0 .02 .01
G .14 .02 .01 .02
T .07 .01 .02 0
P(A<->C) = 0.07+0.07=0.14
S(A,C) = log(0.14/(0.6*0.1)) = 0.36

PAM250 Matrix (log odds multiplied by 10)

BLOSUM Matrices (Henikoff and Henikoff)
• PAM matrices don’t work well for aligning evolutionarily divergent sequences.
• BLOSUM: BLOcks SUbstitution Matrix
• PAM based on observed mutations throughout global alignment. BLOSUM based on highly conserved local regions /blocks without gaps.
• BLOSUMn is a matrix calculated from proteins share at most n% identity. BLOSUM62 is the most widely used matrix (BLAST, PSI-BLAST, CLUSTALW)

Block 1 Block2

BLOSUM62 Matrix

Significance of Sequence Alignment
• Why do we need significant test?
• Mathematical view: unusual versus “by
chance”
• Biological view: evolutionary related or
not?

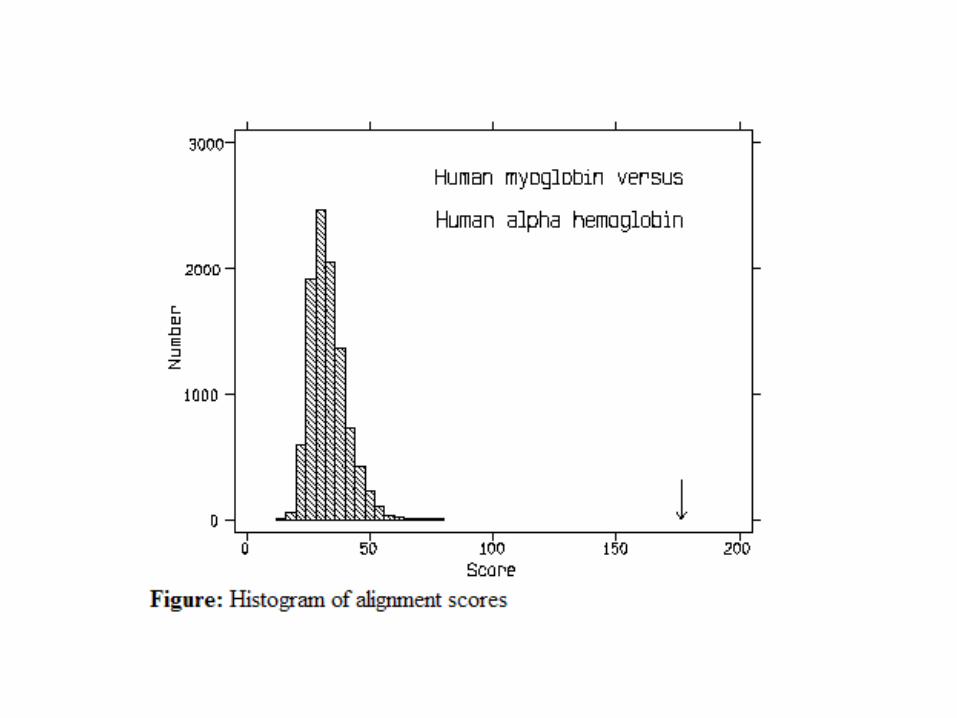
Randomization Approach
• Randomization is a fundamental idea due to Fisher.
• Randomly permute chars within sequence P and Q to generate new sequences (P’ and Q’). Align new sequences and record alignment scores.
• Assuming these scores obey normal distribution, compute mean (u) and standard derivation (σ) of alignment scores

Normal distribution of alignment scores of two sequences
95%
•If S = u+2 σ, the probability of observing the alignment score equal to or more
extreme than this by chance is 2.5%, e.g., P(S>=u+2 σ) = 2.5%.
Thus we are 97.5% confident that the alignment score is significant (not by chance).
•For any score x, we can compute P(S >= x), which is called p-value.
Alignment score

Model-Based Approach (Karlin and Altschul)
http://www.people.virginia.edu/~wrp/cshl02/Altschul/Altschul-3.html
• Extreme Value
Distribution
K and lamda are statistical parameters depending
on substitution matrix. For BLOSUM62, lamda=0.252, K=0.35

P-Value
• P(S≥x) is called p-value. It is the
probability that random sequences has
alignment score equal to or bigger than x.
• Smaller -> more significant.

Problems of Using Dynamic Programming to
Search Large Sequence Database
• Search homologs in DNA and protein database is often the first step of a bioinformatics study.
• DP is too slow for large sequence database search such as Genbank and UniProt. Each DP search can take hours.
• Most DP search time is wasted on unrelated sequences or dissimilar regions.
• Developing fast, practical sequence comparison methods for database search is important.

Fast Sequence Search Methods
• All successful, rapid sequence comparison
methods are based on a simple fact: similar
sequences /regions share some common words.
• First such method is FASTP (Pearson & Lipman, 1985)
• Most widely used methods are BLAST (Altschul et al.,
1990) and PSI-BLAST (Altschul et al., 1997).
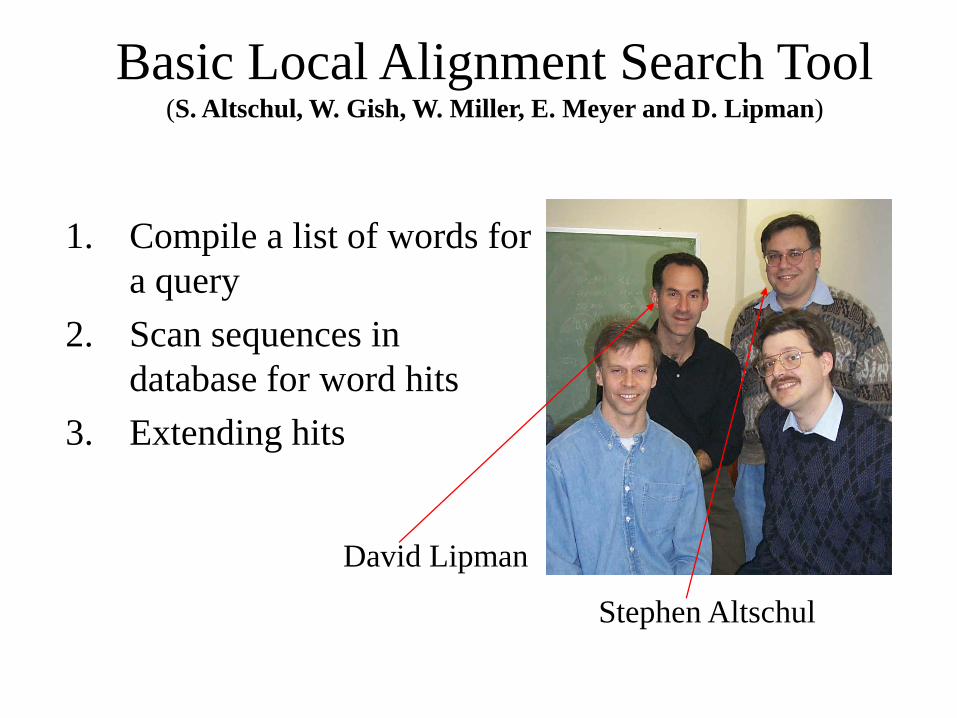
1. Compile a list of words for
a query
2. Scan sequences in
database for word hits
3. Extending hits
Basic Local Alignment Search Tool (S. Altschul, W. Gish, W. Miller, E. Meyer and D. Lipman)
David Lipman
Stephen Altschul

Compile Word List
• Words: w-mer with length w.
• Protein 4-mer and DNA 12-mer
DSRSKGEPRDSGTLQSQEAKAVKKTSLFE
Words: DSRS, SRSK, RSKG, KGEP….
Query:

Words: DSRS, SRSK, RSKG, KGEP….
DSRSKGEPRDSGTLQSQEAKAVKKTSLFE Query:
Database Sequence: PESRSKGEPRDSGKKQMDSOKPD
Example of extension
Maximum Segment Pair: ESRSKGEPRDSG
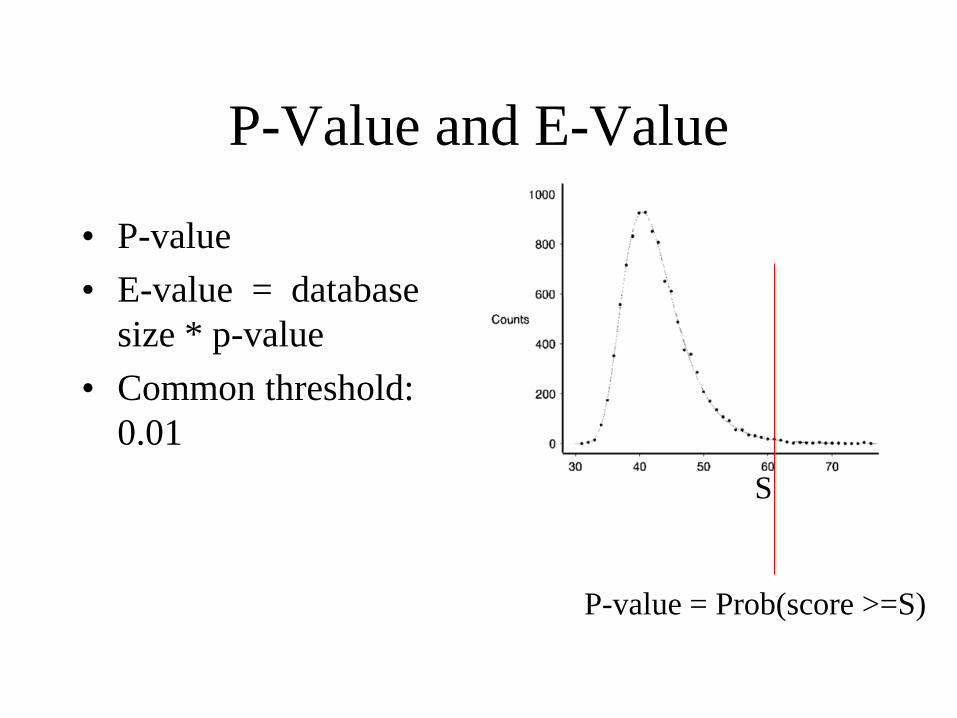
P-Value and E-Value
• P-value
• E-value = database
size * p-value
• Common threshold:
0.01
S
P-value = Prob(score >=S)

Usage of BLAST
• Versions: BLASTP, BLASTN, BLASTX (translated)
• Sequence Databases: NR, PDB, SwissProt, Gene databases of organisms, or your own databases
• Expectation value
• Low complexity
• Similarity matrix (PAM or BLOSUM)
• Output format

NCBI Online Blast
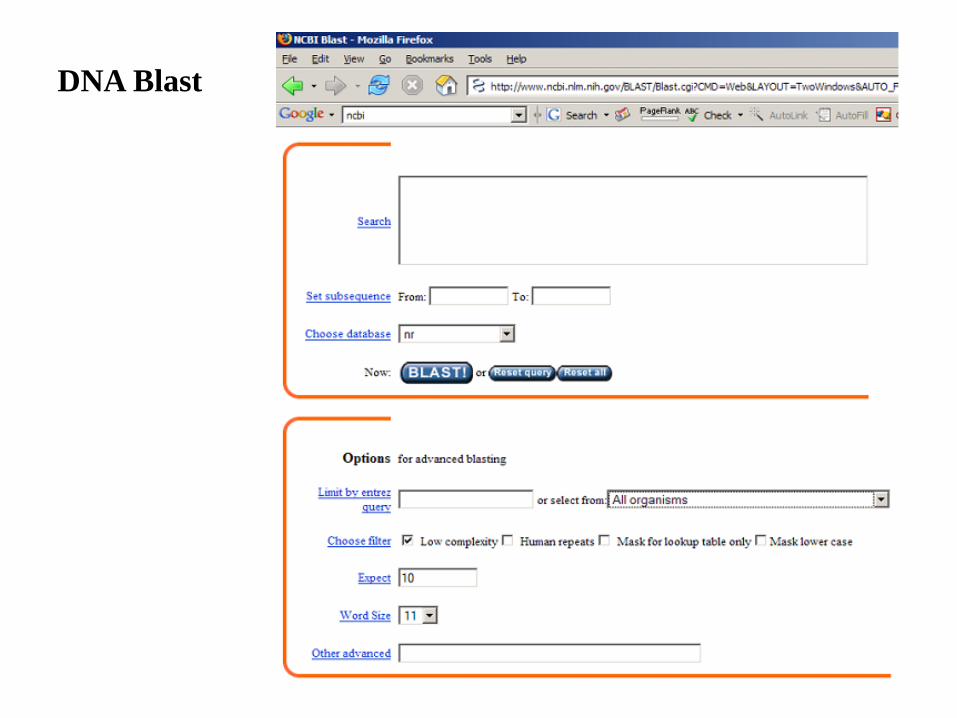
DNA Blast

Protein
Blast

Output
Format
Matched sequences ranked by score and evalue
Significant local alignments

Database Search Using Sequence
Profiles
• Multiple related sequences in protein family and super family (profile)
• More data, more robust, more sensitive
• Consider a group of related sequences (profile) is a POWERFUL idea

Why does a family of sequences
help?
Protein Universe
Step 1

Why does a family of sequences
help?
Protein Universe
Step 1
Step 2
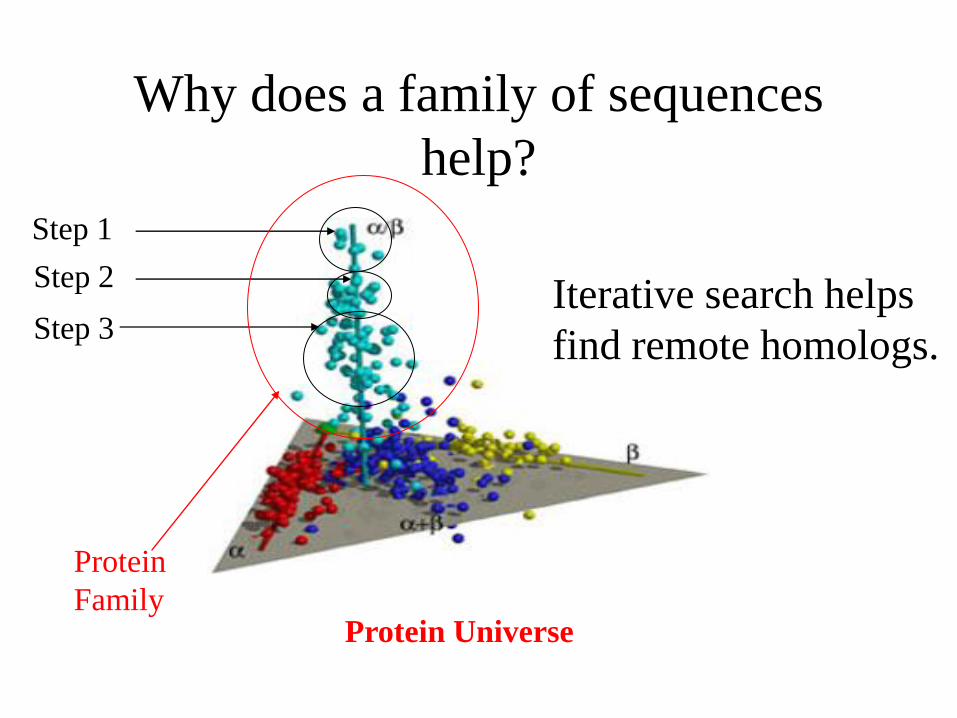
Why does a family of sequences
help?
Protein Universe
Step 1
Step 2
Step 3 Iterative search helps
find remote homologs.
Protein
Family

PSI-BLAST Algorithm
• Use BLAST to search database. Use significantly
matched sequences to construct a profile / PSSM
• Repeat
Use PSSM to search database
Use significant matched sequences to construct a
PSSM
• Until no new sequence is found or reach the
maximum number of iterations.
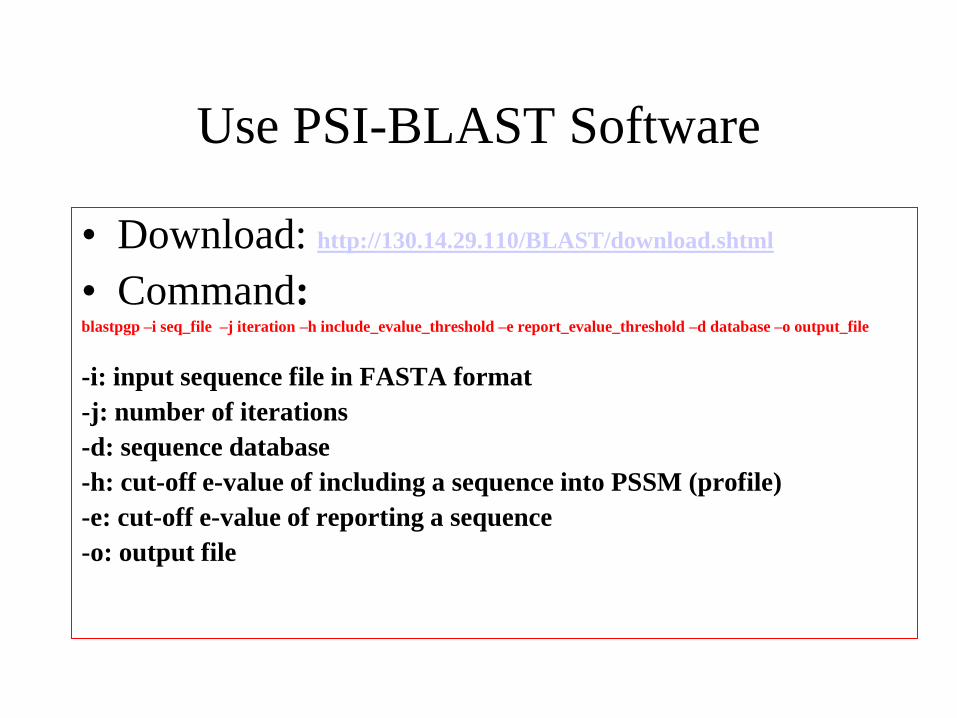
Use PSI-BLAST Software
• Download: http://130.14.29.110/BLAST/download.shtml
• Command: blastpgp –i seq_file –j iteration –h include_evalue_threshold –e report_evalue_threshold –d database –o output_file
-i: input sequence file in FASTA format
-j: number of iterations
-d: sequence database
-h: cut-off e-value of including a sequence into PSSM (profile)
-e: cut-off e-value of reporting a sequence
-o: output file