introduction to batch visualization - westgrid · introduction to batch visualization alex razoumov...
TRANSCRIPT
Intro Remote1 Example1 Remote2 Example2 Cinema
Introduction to Batch Visualization
Alex [email protected]
WestGrid / Compute Canada
copy of these slides at http://bit.ly/batchslides
sample (longer) codes at http://bit.ly/batchcode- will download batch.zip
(WestGrid / Compute Canada) March 24, 2015 1 / 34
Intro Remote1 Example1 Remote2 Example2 Cinema
Batch visualization
BATCH PROCESSING AND VISUALIZATION OF DATAWITH SCRIPTS ON REMOTE CLUSTERS
• Will be given from a WestGrid user perspective, showing examples onparallel.westgrid.ca GPU cluster
• The same ideas (in a simpler form) apply to batch visualization on yourdesktop
• With some work, the examples can be ported to any other cluster inCompute Canada, with or without GPUs
• If you need help with visualization on other systems, please ask us
I local consortia help, e.g. [email protected] or [email protected] Canada-wide visualization support list [email protected]
(WestGrid / Compute Canada) March 24, 2015 2 / 34
Intro Remote1 Example1 Remote2 Example2 Cinema
Why remote visualization?
• Dataset could be too big to download
• Dataset and its analysis workflow cannot fit into desktop’s memory
• Desktop rendering is too slow (limited CPU/GPU power)
• In-situ visualization = instrumenting a simulation code on the cluster tooutput graphics and/or connect to a visualization frontend (ParaView,VisIt) on the fly
• Required visualization software is licensed on Compute Canada systems
(WestGrid / Compute Canada) March 24, 2015 3 / 34
Intro Remote1 Example1 Remote2 Example2 Cinema
Usual benefits of scripting
• Automate mundane or repetitive tasks, e.g., making mutiple frames for amovie
• Do visualization on clusters without any GUI elements, e.g., via a jobscheduled from the command line
Workflow in any Linux-compatible visualization tool with a programminginterface (in a compiled or interpreted language) can be scripted on a cluster
(WestGrid / Compute Canada) March 24, 2015 4 / 34
Intro Remote1 Example1 Remote2 Example2 Cinema
Open-source 3D vis. tools with scripting interfaces
• Many domain-specific packages support scripting, e.g., VMD (VisualMolecular Dynamics) provides Python and Tcl interfaces
I to get batch visualization support for any domain-specific tool, pleasecontact us
• General-purpose tools
I VTK (Visualization Toolkit) library has C++, Tcl/Tk, Java and Pythoninterfaces – can be used as a standalone renderer
I Mayavi2, a serial 3D interactive scientific data visualization package, has anembedded Python shell
I both VisIT and ParaView provide Python scripting (and compiled languageinterfaces for in-situ visualization)
(WestGrid / Compute Canada) March 24, 2015 5 / 34
Intro Remote1 Example1 Remote2 Example2 Cinema
VisIT and ParaView
• Open source, under activedevelopment
• Scalar, vector, tensor fields
• Wide variety of discretizations(structured, unstructured,particles, irregular in 2D/3D)
• Support very large datasets (GBsto TBs)
• Scale to large (103 − 105 cores)systems via MPI
• Nice interactive GUI
• Client-server mode
• Support over 100 input dataformats
• Support parallel I/O
• Huge array of visualizationfeatures
• VTK support
This webinar is an extension of our ParaView training
(WestGrid / Compute Canada) March 24, 2015 6 / 34
Intro Remote1 Example1 Remote2 Example2 Cinema
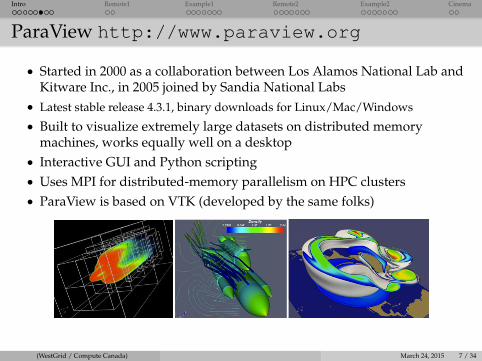
ParaView http://www.paraview.org
• Started in 2000 as a collaboration between Los Alamos National Lab andKitware Inc., in 2005 joined by Sandia National Labs
• Latest stable release 4.3.1, binary downloads for Linux/Mac/Windows
• Built to visualize extremely large datasets on distributed memorymachines, works equally well on a desktop
• Interactive GUI and Python scripting• Uses MPI for distributed-memory parallelism on HPC clusters• ParaView is based on VTK (developed by the same folks)
(WestGrid / Compute Canada) March 24, 2015 7 / 34
Intro Remote1 Example1 Remote2 Example2 Cinema
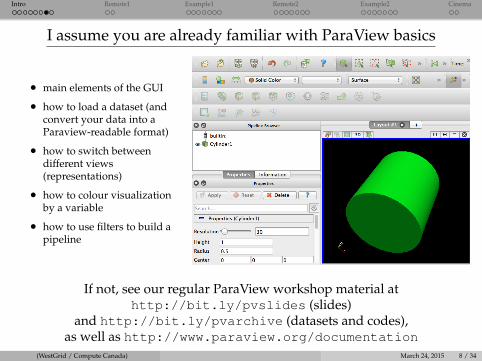
I assume you are already familiar with ParaView basics
• main elements of the GUI
• how to load a dataset (andconvert your data into aParaview-readable format)
• how to switch betweendifferent views(representations)
• how to colour visualizationby a variable
• how to use filters to build apipeline
If not, see our regular ParaView workshop material athttp://bit.ly/pvslides (slides)
and http://bit.ly/pvarchive (datasets and codes),as well as http://www.paraview.org/documentation
(WestGrid / Compute Canada) March 24, 2015 8 / 34
Intro Remote1 Example1 Remote2 Example2 Cinema
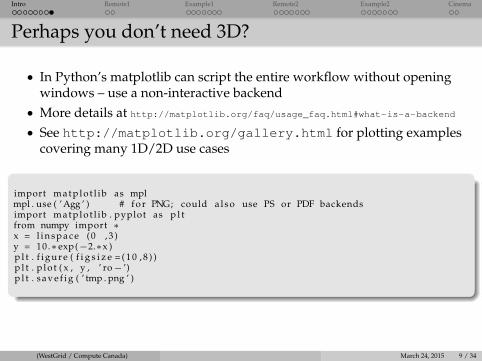
Perhaps you don’t need 3D?
• In Python’s matplotlib can script the entire workflow without openingwindows – use a non-interactive backend
• More details at http://matplotlib.org/faq/usage_faq.html#what-is-a-backend• See http://matplotlib.org/gallery.html for plotting examples
covering many 1D/2D use cases
import m a t p l o t l i b as mplmpl . use ( ’ Agg ’ ) # f o r PNG; could a l s o use PS or PDF backendsimport m a t p l o t l i b . pyplot as p l tfrom numpy import ∗x = l i n s p a c e (0 , 3 )y = 10.∗ exp(−2.∗x )p l t . f i g u r e ( f i g s i z e = ( 1 0 , 8 ) )p l t . p l o t ( x , y , ’ ro− ’)p l t . s a v e f i g ( ’ tmp . png ’ )
(WestGrid / Compute Canada) March 24, 2015 9 / 34
Intro Remote1 Example1 Remote2 Example2 Cinema
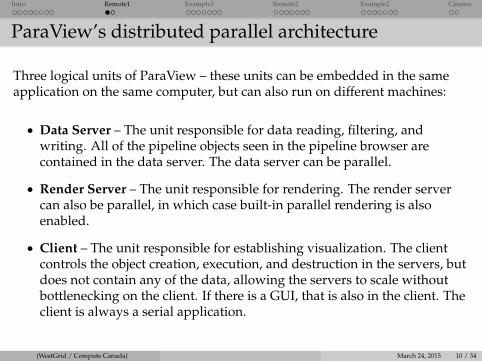
ParaView’s distributed parallel architecture
Three logical units of ParaView – these units can be embedded in the sameapplication on the same computer, but can also run on different machines:
• Data Server – The unit responsible for data reading, filtering, andwriting. All of the pipeline objects seen in the pipeline browser arecontained in the data server. The data server can be parallel.
• Render Server – The unit responsible for rendering. The render servercan also be parallel, in which case built-in parallel rendering is alsoenabled.
• Client – The unit responsible for establishing visualization. The clientcontrols the object creation, execution, and destruction in the servers, butdoes not contain any of the data, allowing the servers to scale withoutbottlenecking on the client. If there is a GUI, that is also in the client. Theclient is always a serial application.
(WestGrid / Compute Canada) March 24, 2015 10 / 34
Intro Remote1 Example1 Remote2 Example2 Cinema
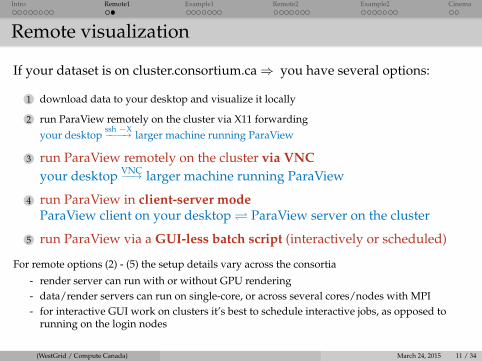
Remote visualization
If your dataset is on cluster.consortium.ca⇒ you have several options:
1 download data to your desktop and visualize it locally
2 run ParaView remotely on the cluster via X11 forwardingyour desktop
ssh −X−−−−→ larger machine running ParaView
3 run ParaView remotely on the cluster via VNCyour desktop VNC−−→ larger machine running ParaView
4 run ParaView in client-server modeParaView client on your desktop ParaView server on the cluster
5 run ParaView via a GUI-less batch script (interactively or scheduled)
For remote options (2) - (5) the setup details vary across the consortia
- render server can run with or without GPU rendering- data/render servers can run on single-core, or across several cores/nodes with MPI- for interactive GUI work on clusters it’s best to schedule interactive jobs, as opposed to
running on the login nodes
(WestGrid / Compute Canada) March 24, 2015 11 / 34
Intro Remote1 Example1 Remote2 Example2 Cinema
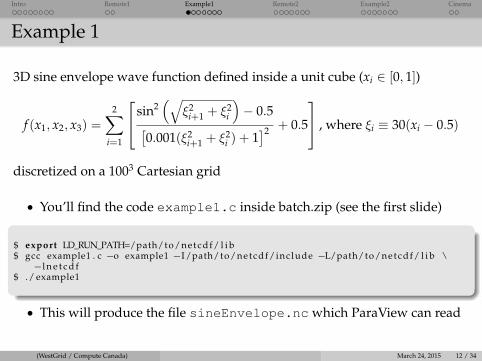
Example 1
3D sine envelope wave function defined inside a unit cube (xi ∈ [0, 1])
f (x1, x2, x3) =
2∑i=1
sin2(√
ξ2i+1 + ξ2
i
)− 0.5[
0.001(ξ2i+1 + ξ2
i ) + 1]2 + 0.5
, where ξi ≡ 30(xi − 0.5)
discretized on a 1003 Cartesian grid
• You’ll find the code example1.c inside batch.zip (see the first slide)
$ export LD_RUN_PATH=/path/to/netcdf/ l i b$ gcc example1 . c −o example1 −I /path/to/netcdf/include −L/path/to/netcdf/ l i b \−l n e t c d f
$ ./ example1
• This will produce the file sineEnvelope.nc which ParaView can read
(WestGrid / Compute Canada) March 24, 2015 12 / 34
Intro Remote1 Example1 Remote2 Example2 Cinema
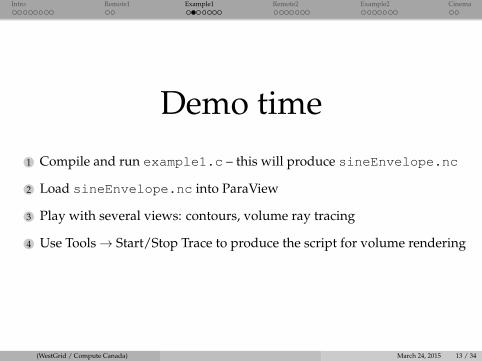
Demo time
1 Compile and run example1.c – this will produce sineEnvelope.nc
2 Load sineEnvelope.nc into ParaView
3 Play with several views: contours, volume ray tracing
4 Use Tools→ Start/Stop Trace to produce the script for volume rendering
(WestGrid / Compute Canada) March 24, 2015 13 / 34
Intro Remote1 Example1 Remote2 Example2 Cinema
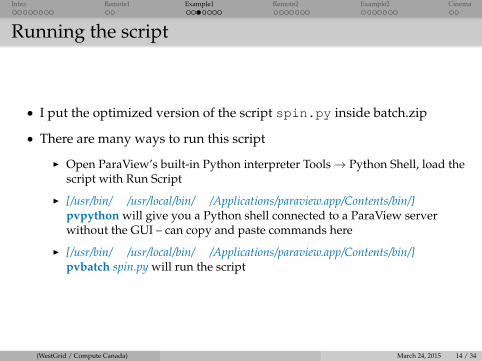
Running the script
• I put the optimized version of the script spin.py inside batch.zip
• There are many ways to run this script
I Open ParaView’s built-in Python interpreter Tools→ Python Shell, load thescript with Run Script
I [/usr/bin/ /usr/local/bin/ /Applications/paraview.app/Contents/bin/]pvpython will give you a Python shell connected to a ParaView serverwithout the GUI – can copy and paste commands here
I [/usr/bin/ /usr/local/bin/ /Applications/paraview.app/Contents/bin/]pvbatch spin.py will run the script
(WestGrid / Compute Canada) March 24, 2015 14 / 34
Intro Remote1 Example1 Remote2 Example2 Cinema
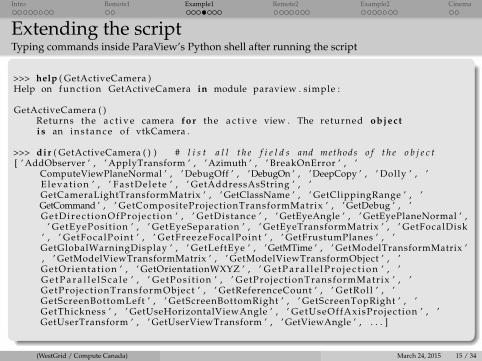
Extending the scriptTyping commands inside ParaView’s Python shell after running the script
>>> help ( GetActiveCamera )Help on funct ion GetActiveCamera in module paraview . simple :
GetActiveCamera ( )Returns the a c t i v e camera for the a c t i v e view . The returned objecti s an i n s t a n c e of vtkCamera .
>>> dir ( GetActiveCamera ( ) ) # l i s t a l l t h e f i e l d s and methods o f t h e o b j e c t[ ’ AddObserver ’ , ’ ApplyTransform ’ , ’ Azimuth ’ , ’ BreakOnError ’ , ’
ComputeViewPlaneNormal ’ , ’ DebugOff ’ , ’DebugOn ’ , ’DeepCopy ’ , ’ Dolly ’ , ’E levat ion ’ , ’ Fas tDe le te ’ , ’ GetAddressAsString ’ , ’GetCameraLightTransformMatrix ’ , ’ GetClassName ’ , ’ GetClippingRange ’ , ’GetCommand ’ , ’ GetCompositeProjectionTransformMatrix ’ , ’ GetDebug ’ , ’G e t Di re c t io nO fP r o j ec t i on ’ , ’ GetDistance ’ , ’ GetEyeAngle ’ , ’ GetEyePlaneNormal ’ ,
’ GetEyePosit ion ’ , ’ GetEyeSeparation ’ , ’ GetEyeTransformMatrix ’ , ’ GetFocalDisk’ , ’ GetFocalPoint ’ , ’ GetFreezeFocalPoint ’ , ’ GetFrustumPlanes ’ , ’GetGlobalWarningDisplay ’ , ’ GetLeftEye ’ , ’GetMTime ’ , ’ GetModelTransformMatrix ’, ’ GetModelViewTransformMatrix ’ , ’ GetModelViewTransformObject ’ , ’GetOrientat ion ’ , ’ GetOrientationWXYZ ’ , ’ G e t P a r a l l e l P r o j e c t i o n ’ , ’G e t P a r a l l e l S c a l e ’ , ’ GetPos i t ion ’ , ’ GetProject ionTransformMatrix ’ , ’GetPro jec t ionTransformObject ’ , ’ GetReferenceCount ’ , ’ GetRoll ’ , ’GetScreenBottomLeft ’ , ’ GetScreenBottomRight ’ , ’ GetScreenTopRight ’ , ’GetThickness ’ , ’ GetUseHorizontalViewAngle ’ , ’ GetUseOffAxisPro ject ion ’ , ’GetUserTransform ’ , ’ GetUserViewTransform ’ , ’ GetViewAngle ’ , . . . ]
(WestGrid / Compute Canada) March 24, 2015 15 / 34
Intro Remote1 Example1 Remote2 Example2 Cinema
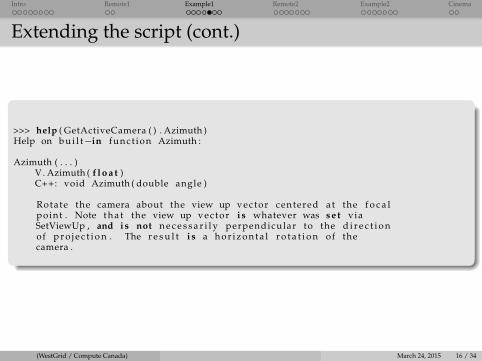
Extending the script (cont.)
>>> help ( GetActiveCamera ( ) . Azimuth )Help on b u i l t−in func t ion Azimuth :
Azimuth ( . . . )V. Azimuth ( f l o a t )C++: void Azimuth ( double angle )
Rotate the camera about the view up vector centered at the f o c a lpoint . Note t h a t the view up vector i s whatever was s e t viaSetViewUp , and i s not n e c e s s a r i l y perpendicular to the d i r e c t i o nof p r o j e c t i o n . The r e s u l t i s a h o r i z o n t a l r o t a t i o n of thecamera .
(WestGrid / Compute Canada) March 24, 2015 16 / 34
Intro Remote1 Example1 Remote2 Example2 Cinema
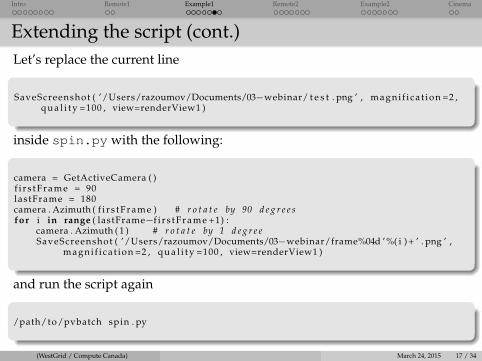
Extending the script (cont.)Let’s replace the current line
SaveScreenshot ( ’/Users/razoumov/Documents/03−webinar/ t e s t . png ’ , magni f i ca t ion =2 ,q u a l i t y =100 , view=renderView1 )
inside spin.py with the following:
camera = GetActiveCamera ( )f i r s t F r a m e = 90lastFrame = 180camera . Azimuth ( f i r s t F r a m e ) # r o t a t e by 90 d e g r e e sfor i in range ( lastFrame−f i r s t F r a m e +1) :
camera . Azimuth ( 1 ) # r o t a t e by 1 d e g r e eSaveScreenshot ( ’/Users/razoumov/Documents/03−webinar/frame%04d ’%( i ) + ’ . png ’ ,
magni f i ca t ion =2 , q u a l i t y =100 , view=renderView1 )
and run the script again
/path/to/pvbatch spin . py
(WestGrid / Compute Canada) March 24, 2015 17 / 34
Intro Remote1 Example1 Remote2 Example2 Cinema
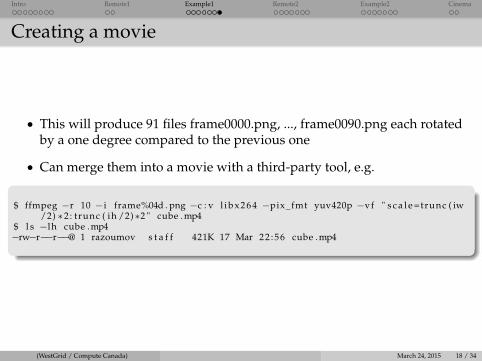
Creating a movie
• This will produce 91 files frame0000.png, ..., frame0090.png each rotatedby a one degree compared to the previous one
• Can merge them into a movie with a third-party tool, e.g.
$ ffmpeg −r 10 −i frame%04d . png −c : v l i b x 2 6 4 −pix_fmt yuv420p −vf " s c a l e =trunc ( iw/2) ∗2 : trunc ( ih /2)∗2 " cube . mp4
$ l s −lh cube . mp4−rw−r−−r−−@ 1 razoumov s t a f f 421K 17 Mar 22 :56 cube . mp4
(WestGrid / Compute Canada) March 24, 2015 18 / 34
Intro Remote1 Example1 Remote2 Example2 Cinema
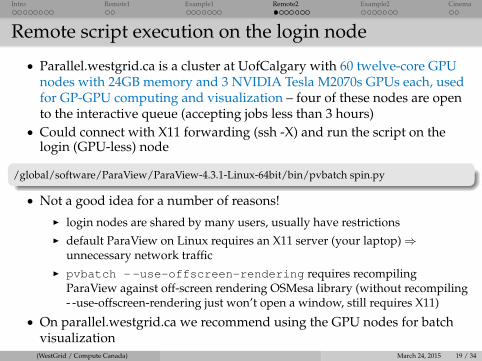
Remote script execution on the login node
• Parallel.westgrid.ca is a cluster at UofCalgary with 60 twelve-core GPUnodes with 24GB memory and 3 NVIDIA Tesla M2070s GPUs each, usedfor GP-GPU computing and visualization – four of these nodes are opento the interactive queue (accepting jobs less than 3 hours)
• Could connect with X11 forwarding (ssh -X) and run the script on thelogin (GPU-less) node
/global/software/ParaView/ParaView-4.3.1-Linux-64bit/bin/pvbatch spin.py
• Not a good idea for a number of reasons!I login nodes are shared by many users, usually have restrictionsI default ParaView on Linux requires an X11 server (your laptop)⇒
unnecessary network trafficI pvbatch --use-offscreen-rendering requires recompiling
ParaView against off-screen rendering OSMesa library (without recompiling- -use-offscreen-rendering just won’t open a window, still requires X11)
• On parallel.westgrid.ca we recommend using the GPU nodes for batchvisualization
(WestGrid / Compute Canada) March 24, 2015 19 / 34
Intro Remote1 Example1 Remote2 Example2 Cinema
Batch script GPU visualization on WestGrid
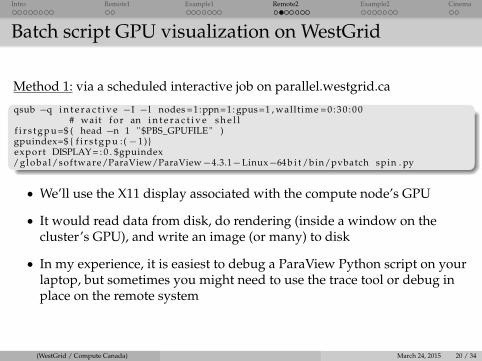
Method 1: via a scheduled interactive job on parallel.westgrid.ca
qsub −q i n t e r a c t i v e −I −l nodes =1:ppn=1: gpus =1 , wallt ime = 0 : 3 0 : 0 0# wait f o r an i n t e r a c t i v e s h e l l
f i r s t g p u =$ ( head −n 1 " $PBS_GPUFILE " )gpuindex=$ { f i r s t g p u : (−1) }export DISPLAY = : 0 . $gpuindex/globa l/software/ParaView/ParaView−4.3.1−Linux−64 b i t /bin/pvbatch spin . py
• We’ll use the X11 display associated with the compute node’s GPU
• It would read data from disk, do rendering (inside a window on thecluster’s GPU), and write an image (or many) to disk
• In my experience, it is easiest to debug a ParaView Python script on yourlaptop, but sometimes you might need to use the trace tool or debug inplace on the remote system
(WestGrid / Compute Canada) March 24, 2015 20 / 34
Intro Remote1 Example1 Remote2 Example2 Cinema
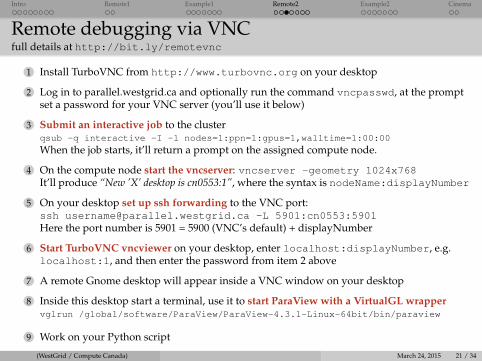
Remote debugging via VNCfull details at http://bit.ly/remotevnc
1 Install TurboVNC from http://www.turbovnc.org on your desktop
2 Log in to parallel.westgrid.ca and optionally run the command vncpasswd, at the promptset a password for your VNC server (you’ll use it below)
3 Submit an interactive job to the clusterqsub -q interactive -I -l nodes=1:ppn=1:gpus=1,walltime=1:00:00
When the job starts, it’ll return a prompt on the assigned compute node.
4 On the compute node start the vncserver: vncserver -geometry 1024x768It’ll produce “New ’X’ desktop is cn0553:1”, where the syntax is nodeName:displayNumber
5 On your desktop set up ssh forwarding to the VNC port:ssh [email protected] -L 5901:cn0553:5901Here the port number is 5901 = 5900 (VNC’s default) + displayNumber
6 Start TurboVNC vncviewer on your desktop, enter localhost:displayNumber, e.g.localhost:1, and then enter the password from item 2 above
7 A remote Gnome desktop will appear inside a VNC window on your desktop
8 Inside this desktop start a terminal, use it to start ParaView with a VirtualGL wrappervglrun /global/software/ParaView/ParaView-4.3.1-Linux-64bit/bin/paraview
9 Work on your Python script
(WestGrid / Compute Canada) March 24, 2015 21 / 34
Intro Remote1 Example1 Remote2 Example2 Cinema
Batch script GPU visualization on WestGrid (cont.)
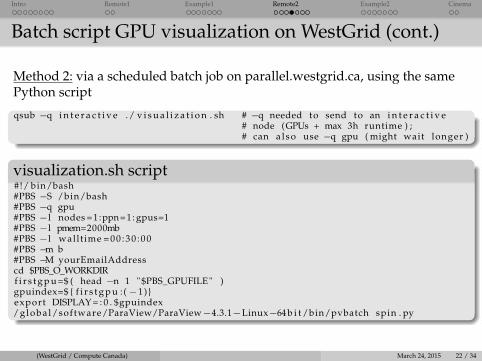
Method 2: via a scheduled batch job on parallel.westgrid.ca, using the samePython script
qsub −q i n t e r a c t i v e ./ v i s u a l i z a t i o n . sh # −q needed to send to an i n t e r a c t i v e# node (GPUs + max 3h runtime ) ;# can a l s o use −q gpu ( might wait longer )
visualization.sh script#!/ bin/bash#PBS −S /bin/bash#PBS −q gpu#PBS −l nodes =1:ppn=1: gpus=1#PBS −l pmem=2000mb#PBS −l wallt ime = 0 0 : 3 0 : 0 0#PBS −m b#PBS −M yourEmailAddresscd $PBS_O_WORKDIRf i r s t g p u =$ ( head −n 1 " $PBS_GPUFILE " )gpuindex=$ { f i r s t g p u : (−1) }export DISPLAY = : 0 . $gpuindex/globa l/software/ParaView/ParaView−4.3.1−Linux−64 b i t /bin/pvbatch spin . py
(WestGrid / Compute Canada) March 24, 2015 22 / 34
Intro Remote1 Example1 Remote2 Example2 Cinema
Batch script GPU visualization on WestGrid (cont.)
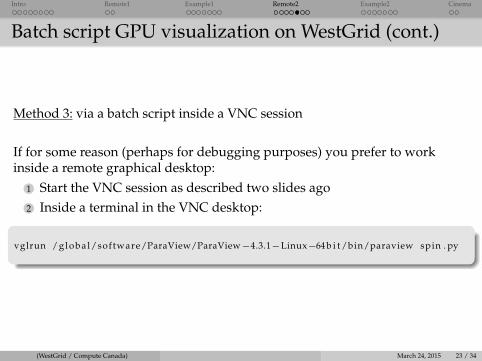
Method 3: via a batch script inside a VNC session
If for some reason (perhaps for debugging purposes) you prefer to workinside a remote graphical desktop:
1 Start the VNC session as described two slides ago2 Inside a terminal in the VNC desktop:
vglrun /globa l/software/ParaView/ParaView−4.3.1−Linux−64 b i t /bin/paraview spin . py
(WestGrid / Compute Canada) March 24, 2015 23 / 34
Intro Remote1 Example1 Remote2 Example2 Cinema
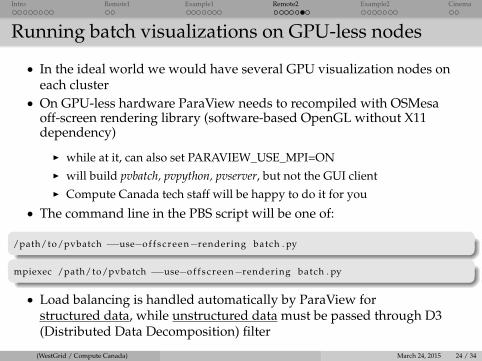
Running batch visualizations on GPU-less nodes
• In the ideal world we would have several GPU visualization nodes oneach cluster
• On GPU-less hardware ParaView needs to recompiled with OSMesaoff-screen rendering library (software-based OpenGL without X11dependency)
I while at it, can also set PARAVIEW_USE_MPI=ONI will build pvbatch, pvpython, pvserver, but not the GUI clientI Compute Canada tech staff will be happy to do it for you
• The command line in the PBS script will be one of:
/path/to/pvbatch −−use−o f f s c r ee n−rendering batch . py
mpiexec /path/to/pvbatch −−use−o f f s c re e n−rendering batch . py
• Load balancing is handled automatically by ParaView forstructured data, while unstructured data must be passed through D3(Distributed Data Decomposition) filter
(WestGrid / Compute Canada) March 24, 2015 24 / 34
Intro Remote1 Example1 Remote2 Example2 Cinema
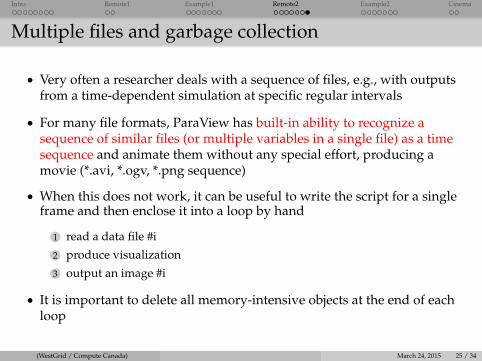
Multiple files and garbage collection
• Very often a researcher deals with a sequence of files, e.g., with outputsfrom a time-dependent simulation at specific regular intervals
• For many file formats, ParaView has built-in ability to recognize asequence of similar files (or multiple variables in a single file) as a timesequence and animate them without any special effort, producing amovie (*.avi, *.ogv, *.png sequence)
• When this does not work, it can be useful to write the script for a singleframe and then enclose it into a loop by hand
1 read a data file #i
2 produce visualization
3 output an image #i
• It is important to delete all memory-intensive objects at the end of eachloop
(WestGrid / Compute Canada) March 24, 2015 25 / 34
Intro Remote1 Example1 Remote2 Example2 Cinema
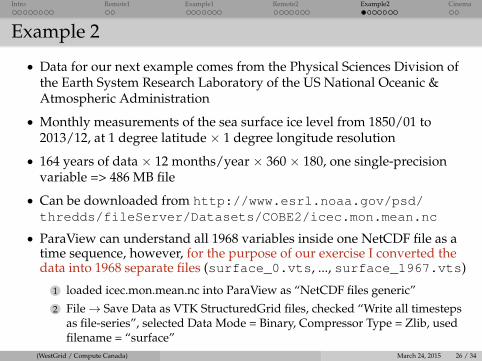
Example 2
• Data for our next example comes from the Physical Sciences Division ofthe Earth System Research Laboratory of the US National Oceanic &Atmospheric Administration
• Monthly measurements of the sea surface ice level from 1850/01 to2013/12, at 1 degree latitude × 1 degree longitude resolution
• 164 years of data × 12 months/year × 360 × 180, one single-precisionvariable => 486 MB file
• Can be downloaded from http://www.esrl.noaa.gov/psd/thredds/fileServer/Datasets/COBE2/icec.mon.mean.nc
• ParaView can understand all 1968 variables inside one NetCDF file as atime sequence, however, for the purpose of our exercise I converted thedata into 1968 separate files (surface_0.vts, ..., surface_1967.vts)
1 loaded icec.mon.mean.nc into ParaView as “NetCDF files generic”
2 File→ Save Data as VTK StructuredGrid files, checked “Write all timestepsas file-series”, selected Data Mode = Binary, Compressor Type = Zlib, usedfilename = “surface”
(WestGrid / Compute Canada) March 24, 2015 26 / 34
Intro Remote1 Example1 Remote2 Example2 Cinema
Demo time
1 Tools→ Start Trace
2 Load surface_0.vts into ParaView
3 Colour by the ice sea level
4 Remove continents (ice level = 1020)
5 Set the range of displayed values to [0,1]
6 Save screenshot
7 Tools→ Stop Trace
(WestGrid / Compute Canada) March 24, 2015 27 / 34
Intro Remote1 Example1 Remote2 Example2 Cinema
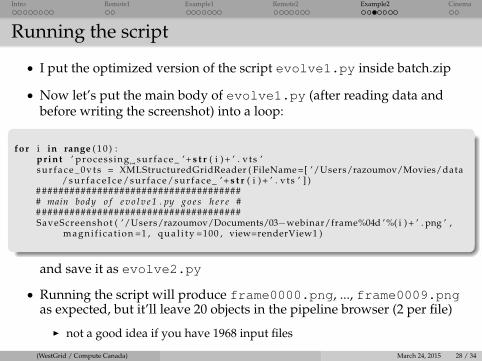
Running the script
• I put the optimized version of the script evolve1.py inside batch.zip
• Now let’s put the main body of evolve1.py (after reading data andbefore writing the screenshot) into a loop:
for i in range ( 1 0 ) :print ’ process ing sur face_ ’+ s t r ( i ) + ’ . v t s ’s u r f a c e _ 0 v t s = XMLStructuredGridReader ( FileName =[ ’/Users/razoumov/Movies/data
/ s u r f a c e I c e /s u r f a c e/sur face_ ’+ s t r ( i ) + ’ . v t s ’ ] )# ##################################### main body o f e v o l v e 1 . py g o e s h e r e ## ####################################SaveScreenshot ( ’/Users/razoumov/Documents/03−webinar/frame%04d ’%( i ) + ’ . png ’ ,
magni f i ca t ion =1 , q u a l i t y =100 , view=renderView1 )
and save it as evolve2.py
• Running the script will produce frame0000.png, ..., frame0009.pngas expected, but it’ll leave 20 objects in the pipeline browser (2 per file)
I not a good idea if you have 1968 input files
(WestGrid / Compute Canada) March 24, 2015 28 / 34
Intro Remote1 Example1 Remote2 Example2 Cinema
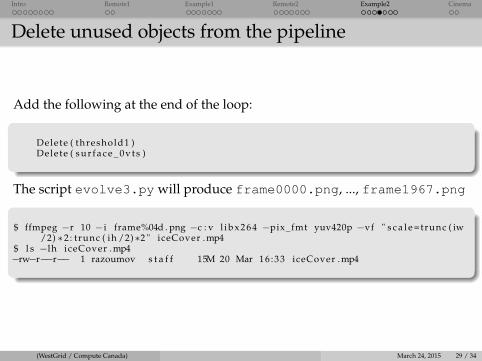
Delete unused objects from the pipeline
Add the following at the end of the loop:
Delete ( threshold1 )Delete ( s u r f a c e _ 0 v t s )
The script evolve3.py will produce frame0000.png, ..., frame1967.png
$ ffmpeg −r 10 −i frame%04d . png −c : v l i b x 2 6 4 −pix_fmt yuv420p −vf " s c a l e =trunc ( iw/2) ∗2 : trunc ( ih /2)∗2 " iceCover . mp4
$ l s −lh iceCover . mp4−rw−r−−r−− 1 razoumov s t a f f 15M 20 Mar 16 :33 iceCover . mp4
(WestGrid / Compute Canada) March 24, 2015 29 / 34
Intro Remote1 Example1 Remote2 Example2 Cinema
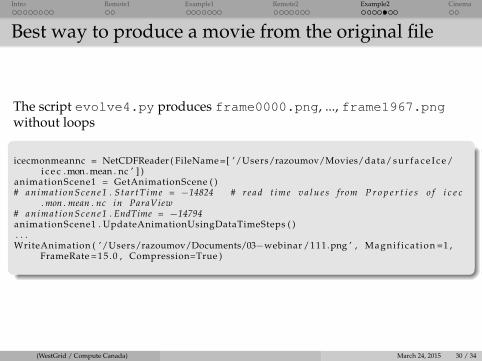
Best way to produce a movie from the original file
The script evolve4.py produces frame0000.png, ..., frame1967.pngwithout loops
icecmonmeannc = NetCDFReader ( FileName =[ ’/Users/razoumov/Movies/data/ s u r f a c e I c e /i c e c .mon. mean . nc ’ ] )
animationScene1 = GetAnimationScene ( )# a n i m a t i o n S c e n e 1 . S t a r t T i m e = −14824 # r e a d t ime v a l u e s from P r o p e r t i e s o f i c e c
. mon . mean . nc in ParaView# a n i m a t i o n S c e n e 1 . EndTime = −14794animationScene1 . UpdateAnimationUsingDataTimeSteps ( ). . .WriteAnimation ( ’/Users/razoumov/Documents/03−webinar /111.png ’ , Magni f icat ion =1 ,
FrameRate =15 .0 , Compression=True )
(WestGrid / Compute Canada) March 24, 2015 30 / 34
Intro Remote1 Example1 Remote2 Example2 Cinema
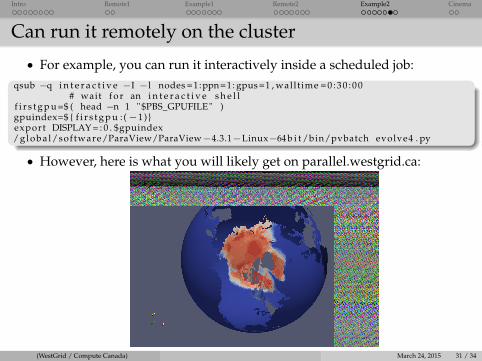
Can run it remotely on the cluster
• For example, you can run it interactively inside a scheduled job:qsub −q i n t e r a c t i v e −I −l nodes =1:ppn=1: gpus =1 , wallt ime = 0 : 3 0 : 0 0
# wait f o r an i n t e r a c t i v e s h e l lf i r s t g p u =$ ( head −n 1 " $PBS_GPUFILE " )gpuindex=$ { f i r s t g p u : (−1) }export DISPLAY = : 0 . $gpuindex/globa l/software/ParaView/ParaView−4.3.1−Linux−64 b i t /bin/pvbatch evolve4 . py
• However, here is what you will likely get on parallel.westgrid.ca:
(WestGrid / Compute Canada) March 24, 2015 31 / 34
Intro Remote1 Example1 Remote2 Example2 Cinema
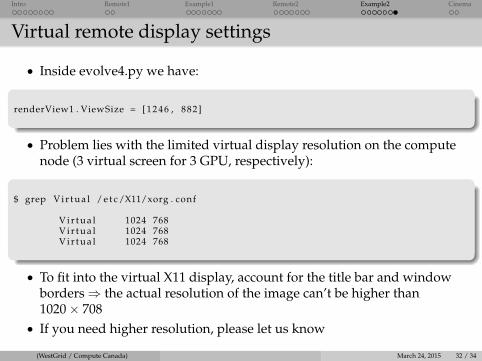
Virtual remote display settings
• Inside evolve4.py we have:
renderView1 . ViewSize = [ 1 2 4 6 , 882]
• Problem lies with the limited virtual display resolution on the computenode (3 virtual screen for 3 GPU, respectively):
$ grep V i r t u a l / e t c /X11/xorg . conf
V i r t u a l 1024 768V i r t u a l 1024 768V i r t u a l 1024 768
• To fit into the virtual X11 display, account for the title bar and windowborders⇒ the actual resolution of the image can’t be higher than1020× 708
• If you need higher resolution, please let us know
(WestGrid / Compute Canada) March 24, 2015 32 / 34
Intro Remote1 Example1 Remote2 Example2 Cinema
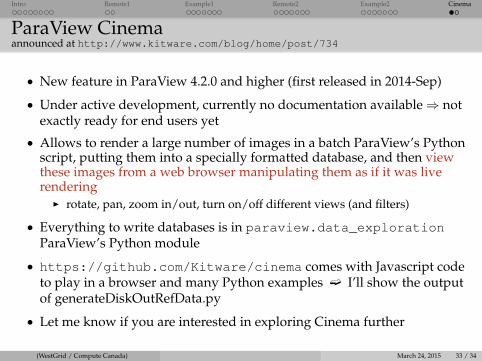
ParaView Cinemaannounced at http://www.kitware.com/blog/home/post/734
• New feature in ParaView 4.2.0 and higher (first released in 2014-Sep)
• Under active development, currently no documentation available⇒ notexactly ready for end users yet
• Allows to render a large number of images in a batch ParaView’s Pythonscript, putting them into a specially formatted database, and then viewthese images from a web browser manipulating them as if it was liverendering
I rotate, pan, zoom in/out, turn on/off different views (and filters)
• Everything to write databases is in paraview.data_explorationParaView’s Python module
• https://github.com/Kitware/cinema comes with Javascript codeto play in a browser and many Python examples ë I’ll show the outputof generateDiskOutRefData.py
• Let me know if you are interested in exploring Cinema further
(WestGrid / Compute Canada) March 24, 2015 33 / 34
Intro Remote1 Example1 Remote2 Example2 Cinema
Questions?
(WestGrid / Compute Canada) March 24, 2015 34 / 34