introduction - the department of economics - umbc · web viewmaster of arts in economic policy...
TRANSCRIPT
Master of Arts in Economic Policy Analysis: Capstone ProjectDepartment of Economics, University of Maryland, Baltimore County
Living in a Food Desert and Health Outcomes
Bryan GaleMay 2016
Abstract: Nearly 45 million Americans live without access to healthy and affordable food. That lack of access may have a negative effect on dietary quality, which could lead to a higher incidence of obesity, diabetes, and hypertension. This study investigated whether living in a food desert has an adverse effect on rates of these diet-related diseases. In addition, an analysis tested whether elderly people are affected differently than people under 65 from living in a food desert. Individual level data from respondents to the Medical Expenditure Panel Survey (MEPS) was merged with the USDA Food Access Atlas at the census tract level. Regression procedures that incorporate matching were conducted to test the above hypotheses. Results show that there is a statistically significant but small effect of living in a food desert on rates of obesity (3.9%-4.2%) and hypertension (3.4%-3.6%), and no consistent effect on rates of diabetes. In addition, there were no significant and consistent effects on DRD prevalence of elderly living in a food desert.
Table of ContentsIntroduction...................................................................................................................................................... 1Background....................................................................................................................................................... 1
What is a food desert?....................................................................................................................................................1General definition..........................................................................................................................................................................1Different analytic definitions of a “food desert”...............................................................................................................2Definition to be used in this study.........................................................................................................................................3
Who lives with low food access?...............................................................................................................................4Theoretical model............................................................................................................................................................4Effect of living in a food desert on diet...................................................................................................................5Effect of living in a food desert on health outcomes.........................................................................................7
Diet related diseases.................................................................................................................................................................... 7Food deserts and diet related disease..................................................................................................................................8Elderly in food deserts and health outcomes....................................................................................................................9What this study adds.................................................................................................................................................................10
Methods............................................................................................................................................................ 11Data sources.................................................................................................................................................................... 11Unit of analysis............................................................................................................................................................... 12Matching methodology...............................................................................................................................................12Analysis.............................................................................................................................................................................. 15
Outcome (dependent) variables...........................................................................................................................................15Indicator variables..................................................................................................................................................................... 15Means comparison..................................................................................................................................................................... 16Regression analyses...................................................................................................................................................................16
Interpretation................................................................................................................................................................. 18Results.............................................................................................................................................................. 18
Descriptive statistics....................................................................................................................................................18Matching results............................................................................................................................................................ 21Means comparisons......................................................................................................................................................24Regression Results........................................................................................................................................................25
Discussion........................................................................................................................................................ 29Implications and Conclusions................................................................................................................... 31References....................................................................................................................................................... 32Appendix: Additional Data/Results........................................................................................................38
2

Introduction
Nearly 45 million low-income Americans live without access to healthy and affordable food.1
That lack of access may have a negative effect on dietary quality, which could lead to a higher incidence
of diet related diseases, like obesity, diabetes, and hypertension. This research investigated whether
living in a food desert has an adverse effect on rates of these diseases. In addition, whether elderly
people are affected differently than people under 65 from living in a food desert was tested. Individual
level data from respondents to the Medical Expenditure Panel Survey (MEPS) was merged with the
USDA Food Access Atlas at the census tract level. Regression procedures that incorporate matching were
conducted to test the above hypotheses.
Background
What is a food desert?
General definition The simplest definition of a food desert comes from the 2008 Farm Bill, which defines a food
desert as an “area in the United States with limited access to affordable and nutritious food, particularly
such an area composed of predominantly lower income neighborhoods and communities” (Title VI, Sec.
7527).2 This definition requires clarification to be useful in quantitative research. Specifically, the
following questions need to be answered:
1) What is the geographic “area” that can be considered a food desert?
2) What is the definition of “limited access”?
3) What is “affordable and nutritious food”?
4) Are there any other criteria besides “lower-income neighborhoods” that are needed for an
1 USDA Food Access Research Atlas Population Estimates. http://www.ers.usda.gov/data-products/food-access-research-atlas/download-the-data.aspx
2 Ploeg, V. M, Farrigan. T., et. al. (2009). “Access to Affordable and Nutritious Food and Understanding Food Deserts and Their Consequences.” United States Department of Agriculture Economic Research Service
3
adequate definition of “food desert”?
Different analytic definitions of a “food desert”One of the best measurements of a person’s access to affordable and nutritious food is the
distance between that person’s house and the nearest place that serves this food. However, since
personal addresses are often unavailable, many researchers use predefined geographical units such as a
ZIP code, census tract, or block as a substitute. Due to the varying size of zip codes and census tracts,
researchers using these units of analysis can either measure from the center of the area, define a
threshold percentage of residents in the area without access to the food source, or determine an
average distance threshold from a resident to food source as counting as a food desert.3 4 A definition
should also account for the differences between urban food deserts and rural food deserts due to the
lack of public transportation and greater spatial dispersion of resources.5 A number of studies set the
threshold for urban and rural food deserts at 1 mile and 10 miles or more, respectively, from a
supermarket.6 7
As shown above, the current field standard for defining access to “affordable and nutritious
food” is distance to a large grocery store or supermarket. This distinguishes these stores from corner
stores, convenience stores, and fast food restaurants, which are more common than large grocery
stores in low-income urban areas and rarely offer affordable and healthy food. 8 Distance to a grocery
store is used as the measure of access to affordable and nutritious food source because it is nearly
certain that grocery stores will carry affordable and nutritious food, while many corner stores may not.
3 Gallagher, M. (2006). Examining the Impact of Food Deserts on Public Health in Chicago, Mari Gallagher Research & Consulting Group.
4 Buczynski, A, Freishtat, H., et. al. (2015) Mapping Baltimore City’s Food Environment: 2015 Report. 5 Kai A., S., Jensen, E. B., & Hinrichs, C. C. (2009). Food Deserts and Overweight Schoolchildren: Evidence from
Pennsylvania. Rural Sociology, 74(2), 153-177.6 Ibid. 7 Morton, L.W., and T.C. Blanchard (2007). “Starved for Access: Life in Rural America’s Food Deserts,” Rural
Realities 1(4): 1-10.8 Giang, T., Karpyn, A., et al. (2008). Closing the grocery gap in underserved communities: the creation of the
Pennsylvania Fresh Food Financing Initiative. J Public Health Manag Pract. 2008;14(3):272-9. doi:
4
According to the Food Bill, a “food desert” is also defined as a “predominantly low-income”
area. Low-income populations are believed to be more ‘vulnerable’ to the effects of low food access
than high-income communities.9 Lower-income urban residents have less money to spend and may
have less time to travel to a grocery store that is not within walking distance. 10 Low-income areas are
often defined as areas with a high proportion of the population below a threshold, usually a percentage
of the federal poverty line. For example, the Baltimore Food Policy Initiative specifies that the median
income should be at or below 185% of the federal poverty line.11 Another component of the definition of
a food desert is vehicle ownership. Dutko, Ploeg, and Farrigan found that those living in urban food
deserts are 24% to 38% less likely to have access to a vehicle than other residents. 12 This compounds the
lack of time and money to travel to get food. One of The Baltimore Food Policy Initiative’s criteria for a
food desert is that 30% or more of the residents have no access to a vehicle. Access to a vehicle makes
grocery stores that are more than a mile away much more accessible and may negate the effects of
living in a food desert. Although there are additional criteria that could be measured, low income and
low vehicle access are the most common.
Definition to be used in this studyThe food desert data that will be used for this study comes from the Unites States Department
of Agriculture (USDA) Food Access Research Atlas. Although this data includes several definitions that
could be used for analysis, the most comprehensive one is called “low income and low access using
vehicle access.” The definition is “a low-income tract in which at least one of the following is true: at
least 100 households are located more than ½ mile from the nearest supermarket and have no vehicle
access; or at least 500 people or 33 percent of the population live more than 20 miles from the nearest
9 Ploeg, V. M, Farrigan. T., et. al. (2009). “Access to Affordable and Nutritious Food Measuring and Understanding Food Deserts and Their Consequences”.
10 Neckerman, K.M., M. Bader, M. Purciel, and P. Yousefzadeh (2009). “Measuring Food Access in Urban Areas,” National Poverty Center Working Paper.
11 Buczynski, A, Freishtat, H., et. al. (2015) Mapping Baltimore City’s Food Environment: 2015 Report. 12 Dutko, P., Ploeg, V. M, & Farrigan. T. (2012). “Characteristics and Influential Factors of Food Deserts”.
5
supermarket, regardless of vehicle availability.”13 A low-income tract is one where “the tract’s poverty
rate is 20 percent or greater; or the tract’s median family income is less than or equal to 80 percent of
the state-wide median family income; or the tract is in a metropolitan area and has a median family
income less than or equal to 80 percent of the metropolitan area's median family income.” 14 This
measure was chosen because it encompasses the distance measure to the nearest supermarket from a
small geographic area, differentiates between rural and urban areas, and incorporates both the low
income and low vehicle access measures. Another measure [Low income and low access at 1 mile
(urban) and 10 miles (rural)] was tested for sensitivity of results, which will be presented later.
Who lives with low food access?Using this definition, the USDA estimates that 44.8 million Americans (14.5% of all Americans)
live in a food desert. In addition, areas with low food access are also more likely to be high-minority
areas than areas with high or medium access.15 16
Food access does not differ for elderly vs. non-elderly people. However, the elderly who are
living in food deserts (approximately 5.5 million people) face additional issues such as mobility and fixed
income that could compound the effects of low food access.17
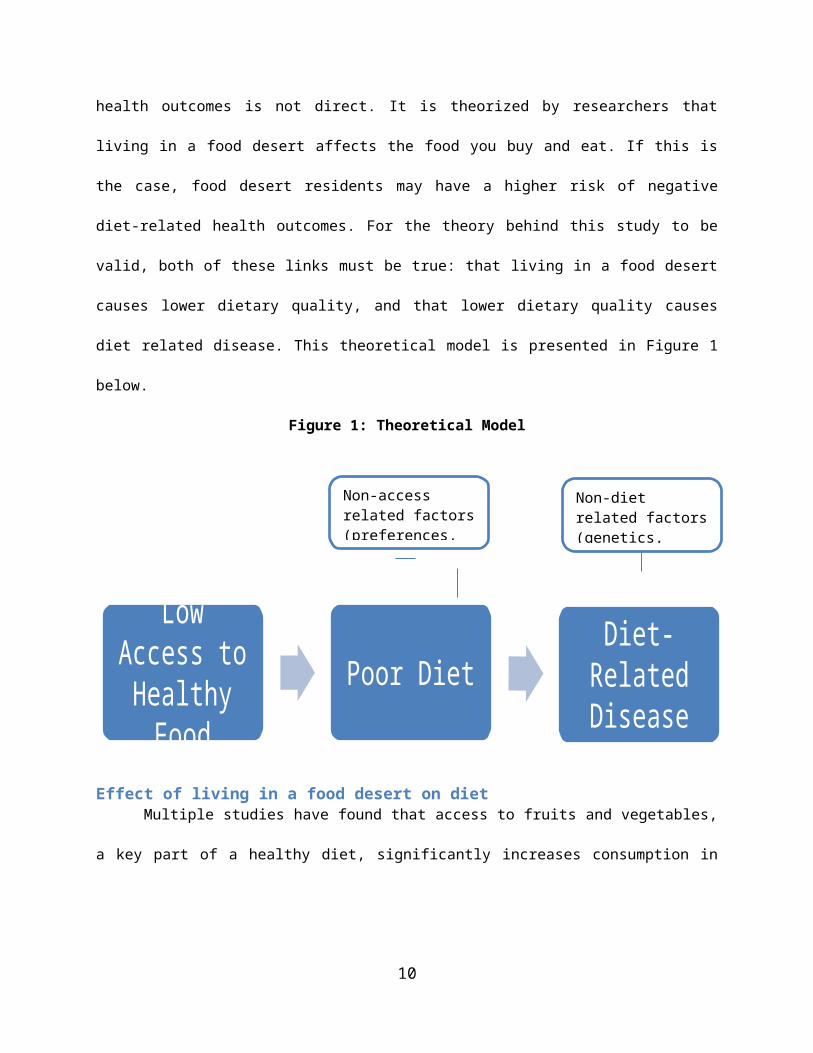
Theoretical modelWhile the purpose of this paper is to determine the health effects of living in a food desert, the
effect of food environment on health outcomes is not direct. It is theorized by researchers that living in a
food desert affects the food you buy and eat. If this is the case, food desert residents may have a higher
risk of negative diet-related health outcomes. For the theory behind this study to be valid, both of these
links must be true: that living in a food desert causes lower dietary quality, and that lower dietary 13 USDA ERS. (2015) Food Access Research Atlas: Documentation. 14 Ibid. 15 Dutko, P., Ploeg, V. M, & Farrigan. T. (2012). “Characteristics and Influential Factors of Food Deserts”. 16 Ibid. 17 Breneman, V., Farrigan, T., Hamrick, K. et al. (2009). Access to Affordable and Nutritious Food: Measuring and
Understanding Food Deserts and Their Consequences. United States Department of Agriculture Economic Research Service.
6

quality causes diet related disease. This theoretical model is presented in Figure 1 below.
Figure 1: Theoretical Model
Effect of living in a food desert on dietMultiple studies have found that access to fruits and vegetables, a key part of a healthy diet,
significantly increases consumption in both children and adults. 18 19 20 However, results are not
consistent. 21 22 In addition to fruits and vegetables, residents are more likely to follow various dietary
guidelines if they have access to a grocery store.23 24
Evaluations of food desert policy interventions have shown that a significant amount of food
18 Neumark-Sztainer D, Wall M, et al. (2003) “Correlates of Fruit and vegetable intake among adolescents. Findings from Project EaT.” Preventive Medicine, 37(3): 198–208.
19 Rose, D. & Richards, R. (2004). “Food Store Access and Household Fruit and Vegetable Use Among Participants in the US Food Stamp Program,” Public Health Nutrition 7(8): 1081-1088.
20 Ploeg, V. M, Farrigan. T., et. al. (2009). “Access to Affordable and Nutritious Food Measuring and Understanding Food Deserts and Their Consequences”.
21 Cummins S, Petticrew M, Higgins C, et al. (2005) Large scale food retailing as an intervention for diet and health: quasi-experimental evaluation of a natural experiment. J Epidemiol Community Health, 59:1035-40.
22 Boone-Heinonen, J., Gordon-Larsen, et al. (2011). Fast food restaurants and food stores: longitudinal associations with diet in young to middle-aged adults: the CARDIA study. Archives of Internal Medicine, 171(13), 1162-1170. doi:10.1001/archinternmed.2011.283
23 Morland K, Wing S, Diez Roux A. (2002) The contextual effect of the local food environment on residents’ diets: the atherosclerosis risk in communities study. Am J Public Health;92:1761–7.
24 Moore, L., Diez Roux, A., et al. (2008) Associations of the Local Food Environment with Diet Quality—A Comparison of Assessments based on Surveys and Geographic Information Systems: The Multi-Ethnic Study of Atherosclerosis. Am. J. Epidemiol. 167 (8): 917-924. doi: 10.1093/aje/kwm394
7
Low Access to Healthy
FoodPoor Diet Diet-Related
Disease
Non-access related factors (preferences, income, etc.)
Non-diet related factors (genetics, exercise, etc.)

desert residents will shift their shopping to a new store if opened, and that a new supermarket has a
positive effect on dietary quality of residents.25 26 27 However, one study could not statistically attribute
the increase in dietary quality to shopping at the new store.28 Interventions aimed at introducing and
marketing nutritious foods in existing stores have also found that sales of these food items increased
significantly.29 30
Some researchers consider access to healthy food less important to dietary quality than access
to unhealthy food. Numerous studies have found that there is greater concentration of unhealthy food
stores in lower-income and high-minority areas, and that greater proximity to these stores decreases
dietary quality.31 32 The presence of these stores may “exert a greater influence on the diets of low-
income families because there are fewer healthy alternatives in their immediate neighborhoods.”33
While both access to unhealthy food and low access to healthy food may affect dietary quality, policy
solutions tend to focus on giving access to positive goods rather than taking away access to negative
goods. In addition, a moral argument could be made that everyone should have a choice between
healthy and unhealthy food, which is not the case in a food desert.
While the research is not definitive, it suggests that the lack of access to healthy foods, coupled
25 Cummins, S., A. Findlay, M. Petticrew, and L. Sparks (2005). “Healthy Cities: The Impact of Food Retail-Led Regeneration on Food Access, Choice and Retail Structure,” Built Environment, Vol. 31(4): 288-301.
26 Wrigley, N., D. Warm, and B. Margetts (2003). “Deprivation, Diet and Food-Retail Access: Findings From the Leeds ‘Food Deserts’ Study,” Environment and Planning A, 35: 151-188.
27 Dubowitz, T., Ghosh-Dastidar, M., Cohen, D., et al. (2015) Diet And Perceptions Change With Supermarket Introduction In A Food Desert, But Not Because Of Supermarket Use. Health Affairs, 34:111858-1868; doi:10.1377/hlthaff.2015.0667.
28 Ibid. 29 Gittelsohn J, Rowan M, Gadhoke P. (2012) Interventions in small food stores to change the food environment,
improve diet, and reduce risk of chronic disease. Prev Chronic Dis;9:110015. DOI: http://dx.doi.org/10.5888/pcd9.110015
30 Ayala, G.X., B. Baquero, et. al (2009). “Working With Tiendas to Promote Healthy Eating,” Presentation at the IOM/NRC Workshop on the Public Health Effects of Food Deserts, January 27, Washington, DC.
31 Larson, N., Story, M., & Nelson, M. (2009) Neighborhood Environments Disparities in Access to Healthy Foods in the U.S. Am J Prev Med, 36(1), 74-81.
32 Ibid.33 Mikkelsen, L. & Chehimi, S. (2007) The Links Between the Neighborhood Food Environment and Childhood
Nutrition. The Robert Wood Johnson Association.
8

with increased access to unhealthy foods, has a negative effect on the dietary quality of food desert
residents.
Effect of living in a food desert on health outcomes
Diet related diseasesThere is a well-established and consistent causal link between consuming certain nutrient-
deficient food and drink and developing chronic diseases.34 Three of the most studied ‘diet-related
diseases’ (DRDs) are: obesity, type-2 diabetes, and hypertension (high blood pressure). These three
diseases accounted for 26% of the deaths in the US between 1990 and 2010, and cost nearly $400 billion
per year in direct and indirect costs.35 36 37 The prevalence of these conditions has been rising for
decades, and is projected to continue rising for at least the next 15 years.38 Other factors can lead to
these diseases, but nearly 80% of the cases are preventable through healthy diet and lifestyle choices.39
Obesity is the disease most directly related to poor diet. Poor diets are low in plant-based food
and grains, and are high in processed foods and soft drinks.40 The most common measure of obesity is
Body Mass Index (BMI), which takes into account a person’s weight and height. This measurement lacks
precision, but it does provide a consistent, easy, and inexpensive measurement.41 Patients with diabetes
exhibit a lack of insulin control, which regulates the amount of glucose in the blood. Type-2 diabetes is a
reduction in insulin production that occurs later in life and is closely associated with poor diet and
34 Fardet, A., & Boirie, Y. (2014). Associations between food and beverage groups and major diet-related chronic diseases: an exhaustive review of pooled/meta-analyses and systematic reviews. Nutrition Reviews, 72(12), 741-762.
35 US Burden of Disease Collaborators. The state of US health, 1990–2010: burden of diseases, injuries, and risk factors. JAMA. 2013;310:591–608.
36 Kung HC, Hoyert DL, XU JQ, Murphy SL. Deaths: Final Data for 2005: National Vital Statistics Reports; vol. 56, no. 10. Hyattsville, MD: National Center for Health Statistics, 2008.
37 Mozaffarian, D., Benjamin, E. J., et al. (2015). Heart disease and stroke statistics--2015 update: a report from the American Heart Association. Circulation, 131(4), e29-e322. doi:10.1161/CIR.0000000000000152.
38 Ibid.39 Willett, W., Koplan, J., Nugent, R. et al (2006). Disease Control Priorities in Developing Countries. 2nd edition.
World Bank: Washington, DC. http://www.ncbi.nlm.nih.gov/books/NBK11795/40 Fardet, A., & Boirie, Y. (2014). Associations between food and beverage groups and major diet-related chronic
diseases: an exhaustive review of pooled/meta-analyses and systematic reviews. 41 Hu, F. (2008) Measurements of Adiposity and Body Composition. In: Hu F, ed. Obesity Epidemiology. New
York City: Oxford University Press; 53–83.
9
obesity.42 43 Hypertension (high blood pressure) is caused by age, genetics, diet, obesity, and diabetes.
Like diabetes, hypertension is treatable but very hard to reverse, and people with hypertension or
diabetes are at higher risk for cardiovascular disease (CVD), stroke and death than those without it.44
Food deserts and diet related diseasePeople living in food deserts may have a higher risk of diet-related diseases due to the lack of
access to healthy food. However, there is not consistent research on this link. Most studies have found a
relationship between lack of access to a supermarket and higher obesity in adults, adolescents and
children.45 46 47 For example, Morland et al. found that the presence of a supermarket in a census tract
correlated with a lower prevalence of obesity in four states.48 However, as noted above, some studies
have not found an association. 49 50
The effect of living in a food desert on the prevalence of diabetes and hypertension is less
studied, perhaps because they are much more difficult to measure reliably than obesity. Two studies
found that proximity to fast food restaurants did not have any effect on diabetes or hypertension. 51 52
However, some studies have found a link between the prevalence of diabetes and hypertension and the
local ‘food balance’ (ratio of the number of fast food restaurants and convenience stores to grocery
42 Your Guide to Diabetes. National Institutes of Health. 43 Fardet, A., & Boirie, Y. (2014). Associations between food and beverage groups and major diet-related chronic
diseases: an exhaustive review of pooled/meta-analyses and systematic reviews. 44 Ibid.45 Larson, N., Story, M. et al. (2009). Neighborhood Environments: Disparities in Access to Healthy Foods in the
U.S. 46 Zick, C., Smith, K. et. al. (2009) Running to the Store? The relationship between neighborhood environments
and the risk of obesity. Social Science & Medicine, 69(10), Pages 1493–150.47 Bodor, J., Rice, J. et al. (2010) The association between obesity and urban food environments. 48 Morland, Kimberly et al. (2006) Supermarkets, Other Food Stores, and Obesity. 49 Block, J. P., Christakis, N. A., O’Malley, A. J., & Subramanian, S. V. (2011). Proximity to Food Establishments
and Body Mass Index in the Framingham Heart Study Offspring Cohort Over 30 Years. American Journal of Epidemiology, 174(10), 1108-1114 7p. doi:aje/kwr244
50 Dubowitz, T., Ghosh-Dastidar, M., Cohen, D., et al. (2015) Diet and Perceptions Change with Supermarket Introduction In A Food Desert, But Not Because Of Supermarket Use.
51 Bodor, J., Rice, J. et al. (2010) The association between obesity and urban food environments. 52 AlHasan, D. M., & Eberth, J. M. (2016). An ecological analysis of food outlet density and prevalence of type II
diabetes in South Carolina counties. BMC Public Health, 161-9. doi:10.1186/s12889-015-2681-6
10

stores in a particular area). 53 54 55 For example, a study in California found that adults in areas with a
balance ratio above three have a significantly higher prevalence of diabetes.56 No other studies were
found testing the effect of local food environment on diabetes and hypertension.
Elderly in food deserts and health outcomesThe effects of living in a food desert on DRDs may be more significant for elderly Americans than
for the non-elderly population. Many elderly people are on a fixed income and have a difficult time
affording consistent and healthy food.57 At least 40% of seniors have limited mobility, which may limit
their ability to cook at home, and walk or drive to the store.58 Elderly people are also more susceptible to
diet related illnesses than younger people due to slower metabolisms and difficulty meeting nutrient
requirements.59 Finally, elderly people move much less often than younger people, which could allow
slow developing diseases like diabetes and hypertension to take hold.60 All of these factors could
compound each other to worsen the health effects of low food access for seniors. However, only one
study was found that tested the effect of living with low food access on diet related diseases in the
elderly. Hanabuchi et al. found no statistical relationship between distance to a supermarket and BMI
among Japanese seniors.61
53 Mari Gallagher Research and Consulting Group (2006). Examining the Impact of food deserts on public health in Chicago.
54 Ibid. 55 Indiana University School of Public Health. (2013) Health Impact Assessment: Development of a Full- Service
Grocery Store Within a Food Desert. 56 California Center for Public Health Advocacy, PolicyLink, and UCLA Center for Health Policy Research (2008).
Designed for Disease: The Link Between Local Food Environments and Obesity and Diabetes.57 Sharkey, Joseph R; Johnson, Cassandra M; Dean, Wesley R (2010). "Food Access and Perceptions of the
Community and Household Food Environment as Correlates of Fruit and Vegetable Intake among Rural Seniors". BMC Geriatrics 10: 32. doi:10.1186/1471-2318-10-32.
58 U.S. Census bureau (2014) Mobility is Most Common Disability Among Older Americans, Census Bureau Reports.
59 Ruxton C. (2011) The role of micronutrients in healthy ageing. Nutrition & Food Science; 41(6): 420–429.60 Ihrke, D. & Faber, C. (2012) Geographical Mobility: 2005 to 2010. U.S. Department of Commerce Economics
and Statistics Administration. 61 Hanibuchi, T., Kondo, K., Nakaya, T. et al. (2011) Neighborhood food environment and body mass index
among Japanese older adults: results from the Aichi Gerontological Evaluation Study (AGES). International Journal of Health Geographics, 10:43.
11

What this study addsThis research tests if there is an effect of living in a food desert on all three of the DRDs. It also
tests whether or not the effect is stronger on elderly food desert residents. This will add to the current
literature on the effect of food access on health outcomes. The four most relevant studies are Morland
et. al., Zick et. al., Bodor et al., and AlHasan et. al., which were cross-sectional studies that examined
sub-national geographic areas. 62 63 64 65 This study is the only cross-sectional study to use a large national
sample and data from the MEPS. Using this large national data source is advantageous because areas
within the U.S. vary widely in geographic and demographic characteristics; therefore, this data set
provides a more representative view of the United States as a whole.
This study is also the only one on this topic that will use matching to better approximate a
random experiment. Most studies on this relationship, including this one, use cross-sectional data,
which makes it more difficult to show a causal relationship than using longitudinal or panel data.
Matching increases the likelihood that results are causal because respondents are matched on all
relevant observable characteristics other than the treatment variable. Analytically, most studies in the
field use linear, generalized linear, or logit regression models. For sensitivity of the analysis, all three of
these regression methods were used in this study after the matching procedures.
This is also the first study to test the effect of living in a food desert on DRD prevalence in the
elderly in the United States. A limitation in this study is a lack of precision in the measurement of a food
desert due to the tract unit of analysis. It does not map each respondent’s specific food environment,
unlike some localized studies. For example, Bodor et al. mapped how far each respondent’s address was
from the nearest food stores in New Orleans.66 Another limitation is that this study will not account for
62 Zick, C., Smith, K. et. al. (2009) Running to the Store? The relationship between neighborhood environments and the risk of obesity.
63 Bodor, J., Rice, J. et al. (2010) The association between obesity and urban food environments. 64 Morland, Kimberly et al. (2006) Supermarkets, Other Food Stores, and Obesity. 65 AlHasan, D. M., & Eberth, J. M. (2016). An ecological analysis of food outlet density and prevalence of type II
diabetes in South Carolina counties.66 Bodor, J., Rice, J. et al. (2010) The association between obesity and urban food environments.
12

access to unhealthy food, only access to healthy food. While access to both is relevant, lack of data
availability and practical concerns prevent this study from utilizing access to unhealthy food sources.
Methods
Data sourcesThis study used two data sources, The Medical Expenditures Panel Survey (MEPS) and the USDA
Food Access Research Atlas, to test if people living in food deserts experience a higher rate of diet-
related diseases than people not living in food deserts. The MEPS, administered by the U.S. Agency for
Healthcare Research and Quality, is a set of large-scale surveys of families and individuals, their medical
providers (doctors, hospitals, pharmacies, etc.), and employers across the United States. The household
component of the survey, which was used in this study, collects nationally representative data on
“demographic characteristics, health conditions, health status, use of medical care services,
charges/payments, access to care, satisfaction with care, health insurance coverage, income, and
employment.”67 Full-year consolidated data files from three years (2010-2012) of MEPS respondents
were pooled to achieve an eligible cross-sectional sample size of approximately 43,000 respondents.
To determine if each respondent is living in a food desert, the census tract where each MEPS
respondent lives was merged with the USDA Food Access Research Atlas. This publically available data
source contains data on all of the approximately 70,000 census tracts in the U.S based on the 2010
Decennial Census, the 2010 list of supermarkets, and the 2006-2010 American Community Survey. 68 The
data contains multiple food access measures, including the food desert definition used in this study
called “low income and low access using vehicle access.” After the merge with the MEPS data, this
dummy variable was used in the analysis to determine the prevalence of DRDs in food deserts in both
the elderly and the general population.
Due to the potentially identifiable nature of the MEPS data, the merge and all data analysis was
67 Medical Expenditures Panel Survey: Household Component. Agency for Health Care Research and Quality. 68 Food Access Research Atlas Overview. United States Department of Agriculture.
13
conducted in AHRQ’s secure data center in Rockville, MD.
Unit of analysisThe unit of analysis for this study is the individual MEPS respondent at the one point in time that
they were surveyed. DRDs develop over many years, so this study cannot prove causality between living
in a food desert and having a DRD. However, using the matching procedures described below, this study
has a stronger case for causality than previous cross-sectional studies on the topic.
Matching methodologyThis study is the first to use matching to examine the food desert-DRD relationship. Matching is
a statistical process used to approximate a Randomized Control Trial (RCT) in observational (non-
randomized) data. The RCT is the ‘gold standard’ of research because participants are randomized into
the treatment or control group before the study, which ensures that there is no selection bias on the
groups. However, randomized controlled trials are expensive and are often not possible to conduct due
to ethical or practical considerations. RCTs also often suffer from issues of generalizability. However, in
this study (much like other observational studies), participants are not randomly selected to live in a
food desert or not. This introduces bias because where they live is likely influenced by personal or
environmental characteristics.69 As a result, the people that live in a food desert are probably different
than the people that do not, which makes it harder to claim that living in a food desert has an objective
effect on DRDs. This difference in characteristics is confirmed in table 3 below, showing the need for
matching. Matching approximates an RCT by matching each treatment (food desert) observation to a
control (non-food desert) observation based on a set of observable characteristics, and omitting all non-
matched observations. By doing this, the treatment and control groups are ‘balanced’ on these
characteristics. If the treatment and control groups are observably the same, the observed outcome
differences are likely to be the result of the treatment, rather than any personal or environmental
69 Austin, P. C. (2014). A comparison of 12 algorithms for matching on the propensity score. Statistics in Medicine, 33(6), 1057-1069. doi:10.1002/sim.6004
14

characteristics.70 However, it is important to note that matching only removes bias from observable
characteristics, whereas an RCT controls for bias on both observable and unobservable characteristics.
Because of this, these analyses improve upon prior analyses, but may still suffer from bias due to
unobservable variables.
In this study, two of the most common types of matching will be conducted: propensity score
matching (PSM) and Mahalanobis distance matching (MDM). After both matching procedures, balance
statistics will be examined to determine which method will be used in the analysis. The ‘treatment’
variable for all matching procedures is whether or not the respondent lives in a food desert as defined
above. PSM, the most common matching method, uses a logit regression to calculate each observation’s
‘probability’ of being treated based on specified explanatory variables. Each treatment case is matched
with a control case with the closest probability of being treated.71 72 MDM is arguably more precise than
PSM because it matches on all explanatory variables individually, rather than taking an average and then
matching.73 Many studies have found that MDM usually produces better variable balance than PSM.74 75
In studies with a large sample size, like this one, it is common to match a treatment case to multiple
control cases to improve the match and increase the sample size. For both matching methods, up to
three control cases (people not living in a food desert) were matched to each treatment case (people
living in a food desert). The psmatch2 package in STATA 14 was used for all matching methods.
The following variables will be used to match food desert observations with non-food desert
observations: gender, race/ethnicity, age, income, education, physical activity, marital status, and
insurance status. If matched observations are the same or very close on all of these variables, this study
70 Ibid. 71 Ibid.72 King, G. & Nielsen, R. (2015) Why Propensity Scores Should Not Be Used For Matching. Presentation at
HMS/BWH Division of Pharmacoepidemiology and Pharmacoeconomics.73 Ibid. 74 Ibid. 75 Austin, P. C. (2014). A comparison of 12 algorithms for matching on the propensity score.
15
argues that any significant variation in outcome means (DRDs) should only be a result of living in a food
desert. However, it is important to note again that this study does not control for bias from
unobservable variables. The means and standardized biases of the matching variables in the matched
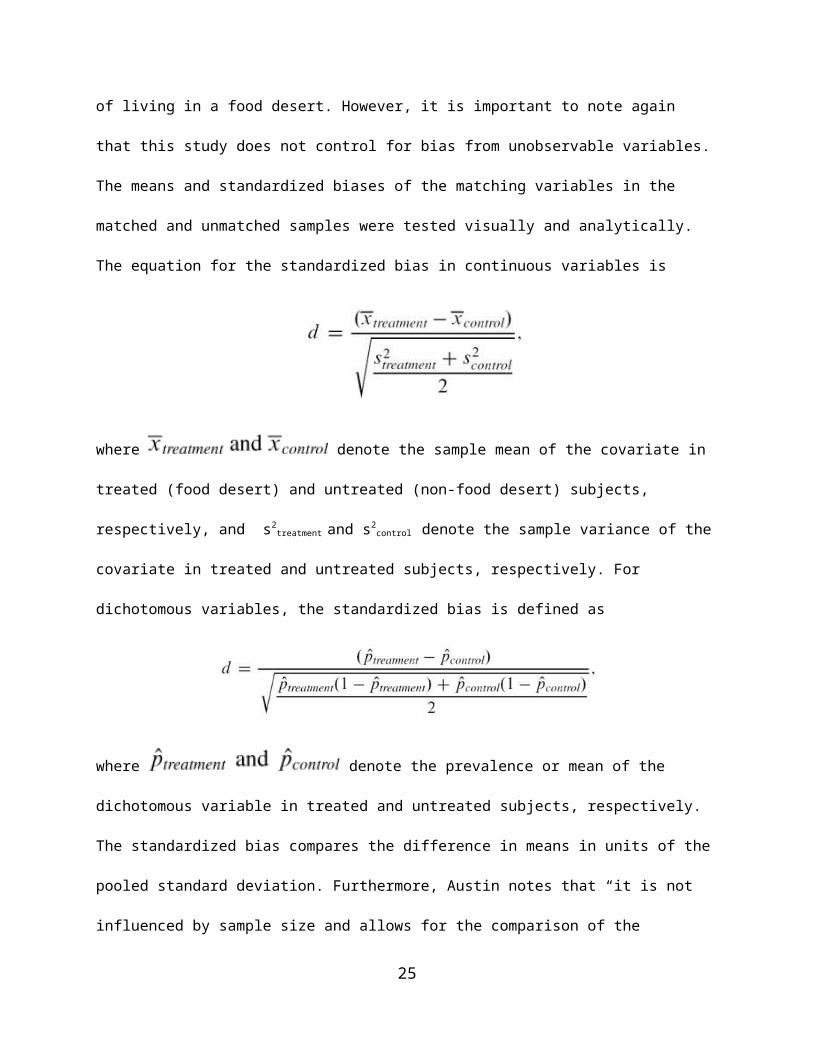
and unmatched samples were tested visually and analytically. The equation for the standardized bias in
continuous variables is
where denote the sample mean of the covariate in treated (food desert)
and untreated (non-food desert) subjects, respectively, and s2treatment and s2
control denote the sample
variance of the covariate in treated and untreated subjects, respectively. For dichotomous variables, the
standardized bias is defined as
where denote the prevalence or mean of the dichotomous variable in
treated and untreated subjects, respectively. The standardized bias compares the difference in means in
units of the pooled standard deviation. Furthermore, Austin notes that “it is not influenced by sample
size and allows for the comparison of the relative balance of variables measured in different units.”76
Analysis
Outcome (dependent) variablesAll three DRDs in this study are represented by questions in the MEPS. The Body Mass Index
76 Austin, P. (2011) An Introduction to Propensity Score Methods for Reducing the Effects of Confounding in Observational Studies. Multivariate Behav Res. 2011 May; 46(3): 399–424.
16
(BMI) variable (BMINDX53) is constructed based on the reported height and weight of all respondents
over age 18, based on the standard BMI formula.77 While the BMI will be tested separately in the means
comparison and OLS regression, all analyses will also be stratified by the standard categories to test the
effect on rates of obesity (BMI>30).78 The diabetes variable (DIABDX) is based on whether each person
(age 18 or older) had ever been told by their health care provider that they have diabetes (excluding
gestational diabetes). Similarly, the hypertension variable (HIBPDX) is if a person (age 18 or older) has
ever been diagnosed with high blood pressure (excluding during pregnancy). Respondents are also asked
later in the survey to confirm their diagnoses of diabetes and hypertension, reducing the chance of
mistaken answering.
Indicator variablesThe two indicator variables to be used in all analyses will be the general food desert dummy
variable and an interaction dummy variable between the food desert variable and a variable for elderly
(age>65). These variables will be in separate regressions to be able to test both if living in a food desert
has an effect on the specified DRD for the entire population, and if being elderly and living in a food
desert has an effect on the specified DRD. In the elderly regression models, the elderly interaction
coefficient will be added to the general food desert coefficient to determine the effect on elderly people
living in a food desert.
Means comparisonAfter the matching procedures, the means of the three outcome variables were compared. In an
RCT, regression models are not necessary to control for other variables because all other relevant
variables are balanced, on average, among participants. Therefore, a comparison of the outcome
variable means between the treatment and control groups is sufficient to show if the treatment had a
significant effect on the outcome. While this study is not a complete RCT, this means comparison is the
77 Calculate your BMI. National Institutes of Health. 78 Ibid.
17

first measure of the effect of living in a food desert on the rates of obesity, diabetes, and hypertension.
Regression analysesAdditional regression analyses were conducted to control for remaining variation between the
two groups that was not accounted for in the matching procedure. Methodologists argue that it is
optimal to use matching methodologies in combination with regression analysis in observational
studies.79 80 These models also provide sensitivity analysis on the findings. The dependent variables for
all models are the same as those listed above.
The matching procedure was incorporated with an importance weight in STATA 14 based on
how many times each observation was matched with another observation (more matches, lower
weight), and non-matched observations were not included. As a sensitivity analysis, I ran the matching
procedure without importance weight and the results were the same.
Independent variablesThe following demographic and socio-economic variables were included in each of the
regression models to control for any residual effects: gender, race, age, poverty level, education,
physical activity, marital status, number of residents in the household, and insurance status. Physical
activity is defined as spending an hour or more doing moderate to vigorous physical activity at least five
times a week. With the exception of marital status, number of residents in the household, and insurance
status, this set of control variables is used in many similar studies.81 82 83 Marital status and size of
household are included based on the possibility that married couples and larger families are more
willing to travel to get food than single people and smaller families. Insurance status is included to
79 Stuart, E. (2010) Matching methods for causal inference: A review and a look forward. Stat Sci. 25(1): 1–21. doi: 10.1214/09-STS313
80 Murnane, R. & Willett, J. (2010) Methods Matter: Improving Causal Inference in Educational and Social Science Research. Oxford University Press.
81 Morland, Kimberly et al. (2006) Supermarkets, Other Food Stores, and Obesity. 82 Bodor, J., Rice, J. et al. (2010) The association between obesity and urban food environments. 83 Mari Gallagher Research and Consulting Group (2006). Examining the Impact of food deserts on public health
in Chicago.
18
capture some of the effect that access to health care has on prevalence of DRDs. It is also important to
note the variables that cannot be controlled for, due to lack of data: family history of disease, diet
composition, and food delivery and preparation services.
Regression modelsThree separate regression models were tested for each of the three DRD outcomes: Ordinary
Least Squares (OLS), Logit, and log-binomial generalized linear model (LB-GLM). These three models
were all used in at least one of the similar studies, so they were all conducted in this study for sensitivity
analyses. As noted earlier, there will be two separate models, one to test the effect on the entire
populations, and one to test the effect on elderly people. The latter regressions will include the elderly
interaction variable (B2 below), and the former will not. While the statistical methods of each model are
different, the structure of all of the equations is the same.
Outcome = Β0 + B1*(Food Desert) + [Β2*(Food Desert*Elderly)] + Β3*(Female) + Β4* (Black) + B5*
(Hispanic) +Β6*(Asian) + Β7*(Poverty level) + B8* (Years of education) + B9*(Physical activity) +
B10*(Married) + B11*(Household size) + B12*(Uninsured) + ε
Both the logit model and the LB-GLM model are designed for modeling dichotomous outcome
variables, like the DRD measures in this study. To be directly comparable to OLS results, the margins
command was used in STATA 14 after both of these regressions. This command outputs the marginal
effects of the right hand side (RHS) variables on the outcome variable.
Interpretation Because of the large sample size (~43,000) in this study, there is a greater chance that the
results will be highly statistically significant, even for small differences in outcomes between the groups.
The smallest effect in similar studies was a 7.2% higher rate of obesity in Bodor, et al. Therefore, I will
use that as a benchmark to help decide if results are of practical significance. I will also consider if results
are consistent at the 1% significance level across the three models, and those that do not change
substantially when using the other matching method, and when using an alternative definition of food
19
desert. If I consistently find a large and significant effect on the food desert variable, I can suggest that
there is a causal relationship between living in a food desert and prevalence of that DRD. Similarly, if
there is a large and significant effect on the food desert variable and the elderly interaction variable, I
can suggest that there is a causal relationship between being elderly and living in a food desert and
prevalence of that DRD. But if some models find a significant effect and others do not, or if magnitudes
are small, I will not be able to conclude that there is an effect of either of these variables on DRD
prevalence. It is also possible that I will find consistent significant effects for some DRDs, but
inconsistent or small results for the other DRDs, in which case, I can suggest a causal relationship
between food deserts and some DRDs, but not all three.
Results
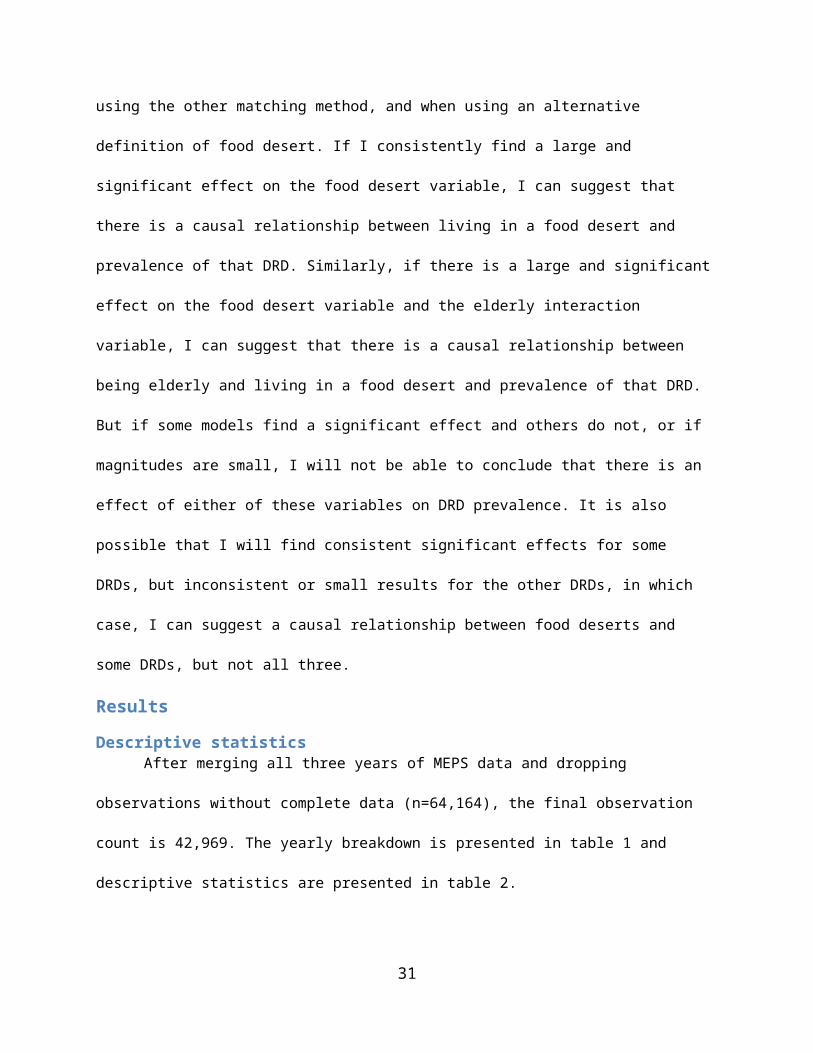
Descriptive statisticsAfter merging all three years of MEPS data and dropping observations without complete data
(n=64,164), the final observation count is 42,969. The yearly breakdown is presented in table 1 and
descriptive statistics are presented in table 2.
Table 1: Number of Observations by YearYear Freq. Percent2010 16,180 37.662011 17,379 40.452012 9,410 21.9Total 42,969 100
Table 2: Descriptive StatisticsMean Standard
DeviationMinimum Maximum Skewness Kurtosis
Food Desert 17.24% 0.38 0 1 1.73 4.01High Blood Pressure
32.09% 0.47 0 1 0.77 1.59
Diabetes 9.81% 0.30 0 1 2.70 8.30BMI 27.95 6.37 8.1 103 1.33 6.95
20

Obese 30.82% 0.46 0 1 0.83 1.69White 38.84% 0.49 0 1 0.46 1.21Hispanic 24.14% 0.43 0 1 1.21 2.46Black 25.90% 0.44 0 1 1.10 2.21Asian 10.63% 0.31 0 1 2.55 7.52
Female 53.49% 0.50 0 1 -0.14 1.02Elderly 15.96% 0.37 0 1 1.86 4.46Uninsured 20.00% 0.40 0 1 1.50 3.25% of Federal Poverty Level
334.03 306.47 0 3095.8 2.19 10.30
Engages in Physical Activity
52.09% 0.50 0 1 -0.08 1.01
Age 45.41 17.70 18 85 0.34 2.23Years of Education
12.69 3.04 0 17 -1.04 5.15
Urban 83.49% 0.37 0 1 -1.80 4.25Married 48.06% 0.50 0 1 0.08 1.01Members in Household
3.01 1.69 1 14 1.06 4.65
Approximately 17% of individuals in the sample live in a food desert as defined above. This is
slightly higher than the estimated 14.5% of Americans that live in a food desert. However, that measure
did not take into account vehicle access and rural/urban differences.84 The rates of obesity, diabetes,
and high blood pressure in the sample (30%, 32%, and 10% respectively) are all very close to the
national averages.85 86 87 All three minority groups (Blacks, Hispanics, and Asians) are overrepresented
compared to national estimates, while women and the elderly are accurately represented.88
Table 3: Variable Means by Food Desert Status
Food Desert
Non-Food Desert Total
Percentage 17.24% 82.76% 100.00%High Blood Pressure 35.59%*** 31.36% 32.09%Diabetes 12.32%*** 9.29% 9.81%BMI 28.83*** 27.76 27.95
84 Dutko, P., Ploeg, V. M, & Farrigan. T. (2012). “Characteristics and Influential Factors of Food Deserts”. 85 2014 National Diabetes Statistics (2014). Centers for Disease Control and Prevention. 86 High Blood Pressure Facts (2015). Centers for Disease Control and Prevention.
87 Adult Obesity Facts. (2015) Centers for Disease Control and Prevention. 88 Quick Facts: United States. (2014) United States Census Bureau.
21

Obese 36.54%*** 29.63% 30.82%White 23.94%*** 41.95% 38.84%Hispanic 26.51%*** 23.65% 24.14%Black 37.51%*** 23.48% 25.90%Asian 11.66%*** 10.42% 10.63%Uninsured 24.69%*** 19.03% 20.00%Female 56.19%*** 52.92% 53.49%Poverty Level 223.51*** 357.06 334.03Engages in Physical Activity 49.17%*** 52.69% 52.09%Age 43.68*** 45.77 45.41
Years of Education 11.88*** 12.86 12.69Urban 88.54%*** 82.43% 83.49%Elderly 14.90%*** 16.18% 15.96%Married 37.02%*** 50.36% 48.06%
Members in Household 2.96** 3.02 3.01*** - P<0.01 ** - P<0.05
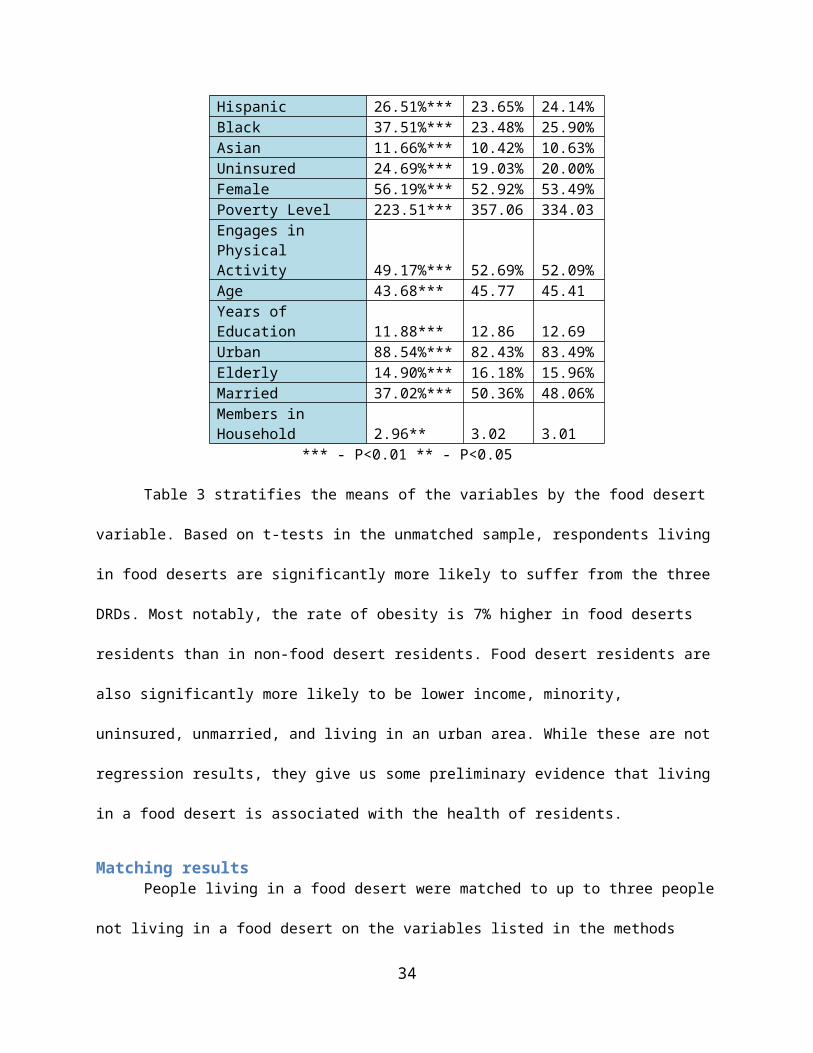
Table 3 stratifies the means of the variables by the food desert variable. Based on t-tests in the
unmatched sample, respondents living in food deserts are significantly more likely to suffer from the
three DRDs. Most notably, the rate of obesity is 7% higher in food deserts residents than in non-food
desert residents. Food desert residents are also significantly more likely to be lower income, minority,
uninsured, unmarried, and living in an urban area. While these are not regression results, they give us
some preliminary evidence that living in a food desert is associated with the health of residents.
Matching resultsPeople living in a food desert were matched to up to three people not living in a food desert on
the variables listed in the methods section above using both PSM and MDM methods. Table 4 below
shows the mean differences of the matching variables in the unmatched sample, after PSM matching,
and after MDM matching. Figure 2 shows this graphically. Table 5 shows the standardized bias in the
matching variables and Figure 3 shows this graphically. A perfect match would be zero mean difference,
no statistically significant difference in means, and zero standardized bias.
Table 4: Matching Mean Balance StatisticsVariable Mean Difference
22
Unmatched PSM MDMObservations 43,930 22,239 19,779Hispanic 2.86%*** -0.39% -0.17%Black 14.03%*** 4.77%*** 5.04%***Asian 1.24%*** -0.159% 0.54%Female 3.27%*** 0.82% 0.77%Poverty Level -133.55*** -30.46*** -23.05***Physical Activity -3.52%*** -0.59% -0.91%Age -2.09%*** -0.45* -0.10%Years of Education -0.97*** -0.250%*** -0.27***Marital Status -13.34*** -4.11%*** 3.83%***Insurance Status 5.66%*** 1.07%* -1.73%***
*** - P<0.01 ** - P<0.05 *-P<0.10
Figure 2: Matching Mean DifferencesVariable Mean Difference (Food Desert – Non-Food Desert)Hispanic
Black
Asian
Female
Poverty Level
Physical Activity
Age
Years of Education
Marital Status
Insurance Status
23
-31 -21 -11 -1 9 19 29
The matching procedures eliminated over half of the sample size, from 43,000 to about 20,000.
Both procedures reduced the mean difference in all the variables, and achieved statistical balance (no
significant difference in means) on five variables. There is no clear advantage in the PSM or the MDM
based on means comparisons; five variables have lower mean differences with MDM, and four have
lower mean differences with PSM.
Table 5: Matching Standardized Biases
VariableStandardized Bias
Unmatched PSM MDMObservations 43,930 22,239 19,779Hispanic 6.6 0.0 -0.6Black 30.8 -1.2 -1.9Asian 4.0 -0.5 5.2Female 6.6 -0.9 -1.8Poverty Level -49.7 -1.5 3.8
Physical Activity -7.1 1.8 -0.2
Age -11.8 0.6 5.6Years of Education -32.8 0.0 -6.5
24
Marital Status 25.4 -0.9 -2.3
Insurance Status 13.7 -1.0 2.9
Psuedo R2 0.062 0 0.003Median Bias 18.8 0.9 3.1Mean Bias 12.8 0.9 2.6
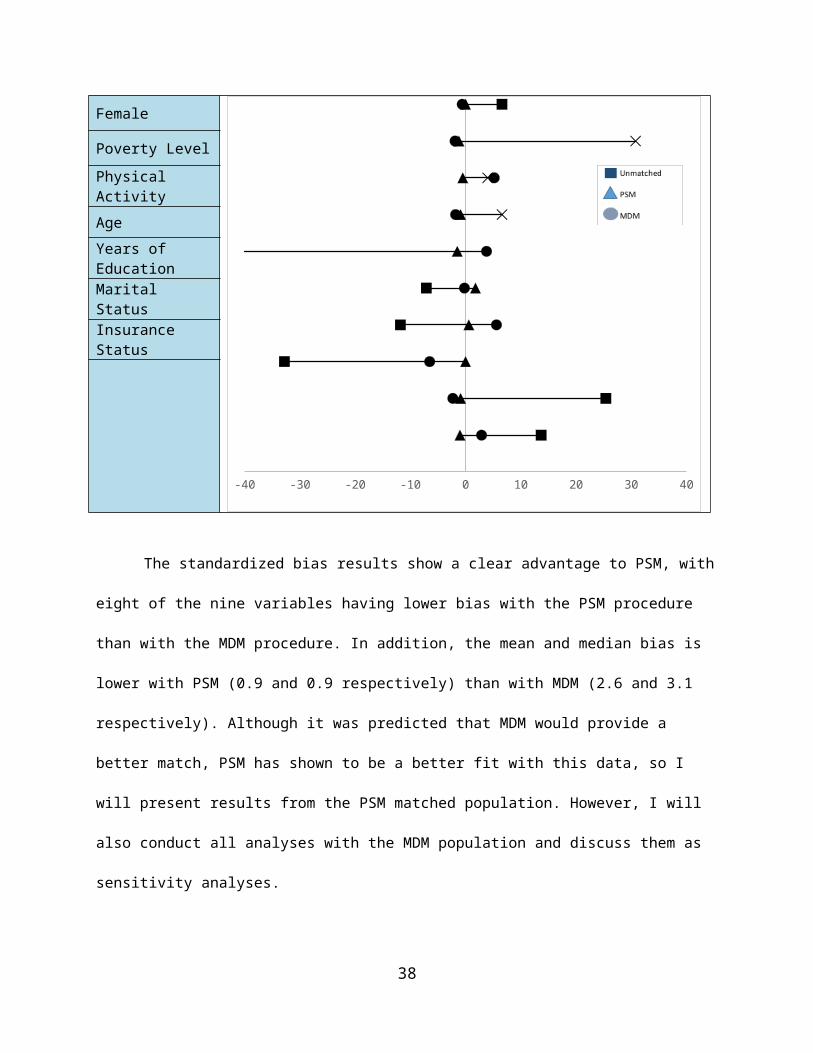
Figure 3: Matching Standardized Biases Variable Standardized Bias
Hispanic
-40 -30 -20 -10 0 10 20 30 40
Black
Asian
Female
Poverty Level
Physical Activity
Age
Years of Education
Marital Status
Insurance Status
The standardized bias results show a clear advantage to PSM, with eight of the nine variables
having lower bias with the PSM procedure than with the MDM procedure. In addition, the mean and
median bias is lower with PSM (0.9 and 0.9 respectively) than with MDM (2.6 and 3.1 respectively).
Although it was predicted that MDM would provide a better match, PSM has shown to be a better fit
with this data, so I will present results from the PSM matched population. However, I will also conduct
all analyses with the MDM population and discuss them as sensitivity analyses.
25
Means comparisonsTable 6 below shows the differences in the means on the food desert variable for the four DRD
variables for the entire population. Table 7 shows the mean differences for the elderly population.
Table 6: Matched DRD Means Comparisons
VariableMean Difference
Unmatched PSM MDMHypertension 4.38% 3.92% 4.46%Diabetes 3.09% 2.33% 2.55%BMI 1.18 0.808 0.702Obese 6.87% 4.84% 4.81%
Note: all differences are statistically significant at the 1% level.
Table 7: Matched DRD Means Comparisons (Elderly)
VariableMean Difference (Elderly)
Unmatched PSM MDMHigh BP 4.77%*** 3.27% 2.71%Diabetes 6.04%*** 3.53% 4.86%*
BMI 0.001* 0 -0.001Obese 1.49% -1.07% -1.89%
Underweight 5.05% 4.23% 1.04%*** - P<0.01 ** - P<0.05 *-P<0.10
For the general population, the matching procedures reduced the effect size of living in a food
desert for all four DRDs, but did not reduce their statistical significance. Just comparing means, living in a
food desert was correlated with a 4% higher chance of hypertension, a 2.3% higher chance of diabetes,
and a 5% higher chance of obesity for all participants. For the elderly population, effects of living in a
food desert on DRD prevalence were significant before matching, but the matching procedures removed
all statistical significance, indicating that the mean differences were largely a result of covariate
differences rather than a result of food desert residency. Regressions are needed to control for any
remaining bias in the results, and the next section will present those results.
26

Regression ResultsResults from the three different regression models (OLS, Logit, and Log-binomial) for the
matched (PSM) sample on the three DRDs without the elderly interaction variable are presented in
tables 7, 9, and 11. Regression results with the elderly interaction variable are presented in tables 8, 10,
and 12. Additional results are presented in the appendix, including regressions using MDM instead of
PSM, using an alternative definition of food desert [low income and low access at 1 mile (urban) and 10
miles (rural)], regressions on an underweight variable, and regressions including interaction terms for
other covariates besides elderly.
Table 7: BMI and Obesity Regression Results
VariableBMI Obesity
Linear Linear LogitLog-binomial
Food desert 0.734*** 0.042*** 0.042*** 0.039***Hispanic 0.291* -0.002 -0.001 -0.003Black 0.807*** 0.057*** 0.055*** 0.054***Asian -0.660*** -0.043*** -0.045*** -0.042***Female 0.242** 0.047*** 0.047*** 0.053***Poverty level -0.002*** -0.000*** -0.000*** -0.000***Physical Activity -1.391*** -0.087*** -0.086*** -0.087***Age 0.074*** 0.004*** 0.004*** 0.004***Years of Education -0.011 -0.003* -0.002* -0.002*Elderly -3.562*** -0.191*** -0.188*** -0.191***Married -0.064* -0.003 -0.003 -0.003Uninsured -0.524*** -0.031*** -0.031*** -0.034***Size of Household <0.001 <0.001 <0.001 0.001constant 26.500*** 0.256***r2 0.051 0.038
bic143181.60
2 28408.975 27074.177 28383.617chi2 840.121 876.826
*** - P<0.01 ** - P<0.05 * - P<0.10
Table 8: BMI and Obesity Regression Results (Elderly)
VariableBMI Obesity
Linear Linear LogitLog-binomial
Food desert 0.839*** 0.049*** 0.048*** 0.044***
27

Elderly*Food Desert -0.704** -0.048** -0.046* -0.035Hispanic 0.293* -0.001 -0.001 -0.004Black 0.811*** 0.057*** 0.056*** 0.054***Asian -0.656*** -0.042*** -0.045*** -0.042***Female 0.240** 0.047*** 0.047*** 0.053***Poverty level -0.002*** -0.000*** -0.000*** -0.000***Physical Activity -1.394*** -0.087*** -0.086*** -0.087***Age 0.074*** 0.004*** 0.004*** 0.004***Years of Education -0.011 -0.003* -0.002* -0.002*Elderly -3.323*** -0.175*** -0.172*** -0.177***Married -0.064* -0.003 -0.003 -0.003Uninsured -0.526*** -0.031*** -0.031*** -0.034***Size of Household -0.001 <0.001 <0.001 0.001constant 26.476*** 0.254***r2 0.051 0.038
bic143184.0
68 28412.223 27077.948 28390.126chi2 846.341 883.245
*** - P<0.01 ** - P<0.05 * - P<0.10
In the entire population, living in a food desert is correlated with a 0.73 point increase in the
respondents BMI (12% of one standard deviation), and elderly living in a food desert had a 0.13 point
higher BMI (2% of one standard deviation) after controlling for the covariates. Living in a food desert
also increased the probability that the respondent was obese by between 3.9% and 4.2% in the general
population across the three models. This difference disappears for elderly living in a food desert, whose
rate of obesity was not different than the rest of population. The results for the entire population were
consistent across all three models, when using MDM instead of PSM, and when using an alternative
definition of food desert. Results for elderly living in a food desert were not consistent during sensitivity
analysis. I also tested if living in a food desert had an effect on elderly being underweight (BMI < 18.5)
and found no significant effect. There were also no significant effects on food desert interactions with
any other covariates including race/ethnicity, gender, physical activity, years of education, poverty level,
and insurance status.
Table 9: Diabetes Regression Results
28
VariableDiabetes
Linear LogitLog-binomial
Food desert 0.021*** 0.022*** 0.020***Hispanic 0.019** 0.025*** 0.026***Black 0.019*** 0.020*** 0.019***Asian 0.018* 0.018* 0.017**Female -0.007 -0.006 -0.010**Poverty level -0.000*** -0.000*** -0.000***Physical Activity -0.034*** -0.032*** -0.035***Age 0.005*** 0.005*** 0.004***Years of Education -0.004*** -0.002** -0.002***Elderly 0.009 -0.061*** -0.038***Married -0.001 -0.004** -0.007***Uninsured -0.034*** -0.038*** -0.040***Size of Household -0.004** -0.003* -0.005***constant -0.009r2 0.103bic 8616.163 12829.103 8834.631chi2 2229.43 2224.933
*** - P<0.01 ** - P<0.05 * - P<0.10
Table 10: Diabetes Regression Results (Elderly)
VariableDiabetes
Linear LogitLog-binomial
Food desert 0.017*** 0.022*** 0.024***Elderly*Food Desert 0.029* -0.001 -0.007Hispanic 0.019** 0.025*** 0.026***Black 0.019*** 0.020*** 0.020***Asian 0.018* 0.018* 0.017**Female -0.007 -0.006 -0.009**Poverty level -0.000*** -0.000*** -0.000***Physical Activity -0.034*** -0.032*** -0.035***Age 0.005*** 0.005*** 0.004***Years of Education -0.004*** -0.002** -0.002***Elderly <0.001 -0.060*** -0.035***Married -0.001 -0.004** -0.007***Uninsured -0.034*** -0.038*** -0.040***Size of Household -0.004** -0.003* -0.005***constant -0.008r2 0.103bic 8620.207 12839.09 8843.433
29

chi2 2229.434 2211.325*** - P<0.01 ** - P<0.05 * - P<0.10
Living in a food desert also increased the probability that the respondent had diabetes by
between 2.0% and 2.2% in the entire population across the three models. There was no significant effect
of elderly living in food desert on rates of diabetes. The results for the entire population were
consistent across three models and when using MDM instead of PSM, but not when the alternative
definition of food desert was used. There were also no significant effects on food desert interactions
with any other covariates including race/ethnicity, gender, physical activity, years of education, poverty
level, and insurance status.
Table 11: Hypertension Regression Results
VariableHypertension
Linear LogitLog-binomial
Food desert 0.036*** 0.034*** 0.034***Hispanic -0.025** -0.028** -0.019*Black 0.057*** 0.056*** 0.052***Asian 0.033*** 0.032*** 0.043***Female -0.009 -0.007 0.001Poverty level -0.000*** -0.000*** -0.000***Physical Activity -0.047*** -0.046*** -0.041***Age 0.013*** 0.012*** 0.012***Years of Education -0.004*** -0.003*** -0.002**Elderly -0.031** -0.084*** -0.142***Married 0.007*** 0.002 <0.001Uninsured -0.057*** -0.054*** -0.074***Size of Household -0.011*** -0.011*** -0.012***constant -0.143***r2 0.283bic 21885.961 21110.218 22596.533chi2 6701.82 6895.991
*** - P<0.01 ** - P<0.05 * - P<0.10
Table 12: Hypertension Regression Results (Elderly)
VariableHypertension
Linear LogitLog-binomial
Food desert 0.035*** 0.035*** 0.044***
30
Elderly*Food Desert 0.004 -0.001 -0.021*Hispanic -0.025** -0.028** -0.019*Black 0.057*** 0.056*** 0.052***Asian 0.032*** 0.032*** 0.043***Female -0.009 -0.007 0.001Poverty level -0.000*** -0.000*** -0.000***Physical Activity -0.047*** -0.046*** -0.040***Age 0.013*** 0.012*** 0.012***Years of Education -0.004*** -0.003*** -0.002***Elderly -0.032** -0.084*** -0.134***Married 0.007*** 0.002 <0.001Uninsured -0.057*** -0.054*** -0.074***Size of Household -0.011*** -0.011*** -0.012***constant -0.143***r2 0.283bic 21895.898 21120.206 22601.651chi2 6701.823 6876.057
*** - P<0.01 ** - P<0.05 * - P<0.10
Finally, living in a food desert increased the probability that the respondent had hypertension by
between 3.4% and 3.6% in the general population across the three models. Similar to the diabetes
results, there was no significant effect of elderly living in a food desert on rates of hypertension. The
results for the entire population were consistent across the three PSM models, when using MDM
instead of PSM, and when using an alternative definition of food desert. There were also no significant
effects on food desert interactions with any other covariates including race/ethnicity, gender, physical
activity, years of education, poverty level, and insurance status.
Discussion
The results presented above suggest that living in a food desert does significantly increase the
chances of respondents in the general population having obesity or hypertension. However, the effect
size on both was relatively small (about 4% for both), in comparison to the smallest effect from similar
studies of 7.2%. Effect size for diabetes was even smaller (2%) and did not stay significant during
sensitivity testing. For elderly people, results are not significantly different for any of the three DRDs, as
31

well as underweight, compared to the non-elderly.
These results add to the existing literature that living in a food desert does have a significant
effect on rates of obesity and hypertension, though the effect sizes are smaller than other studies. In
addition, these results are the first to show that living in a food desert does not have a different effect
on elderly people in the United States. This study improved methodologically on previous studies by
using a large national sample, matching, and extensively testing sensitivity; therefore, these results
better reflect the effect of food deserts on people in the entire United States than previous studies.
However, this study does have a few limitations.89 First, the cross-sectional design of this study
does not allow the establishment of a causal relationship between the local food environment and DRD
prevalence. Second, misclassification may have occurred if the census tract does not represent the area
relevant to the food shopping habits of a particular individual, or if the definition of food desert does not
accurately reflect the difficulty to obtain healthy food (i.e. the definition is too inclusive). While I believe
the definition used is theoretically better than previous definitions, its inclusiveness may have led to the
smaller effect sizes. Third, the possibility that individuals select neighborhoods with certain types of
stores cannot be eliminated, nor can the possibility that market research locates supermarkets in areas
where individuals have lower rates of DRDs. Fourth, other unobserved variables associated with the
presence of different types of stores or the prevalence of DRDs could also account for the findings.
Finally, the availability of a supermarket is a crude estimate for availability and cost of healthy foods
because every individual food store offers a different array of food options.90
Ways to address limitations in future work are to track the DRD status of participants who have
switched between living in a food desert and not, by using the participant’s address, and surveying them
about their shopping habits. Adding access to unhealthy food sources as a covariate will also be an
improvement.
89 These limitations are largely based off the limitations mentioned in Morland et al.90 Morland, Kimberly et al. (2006) Supermarkets, Other Food Stores, and Obesity.
32

Implications and Conclusions
There are other justifications for government intervention to combat food deserts in addition to
effects on DRDs, including that minorities are disproportionately affected by low access and that all
Americans have the right to choose healthy food. But in terms of effects on diet-related diseases, these
results give some support to public investment in food deserts. However, the effects of living in a food
desert on diet-related diseases may not be as large as previous studies have found. More research on
the effects of living in a food desert is needed in order to establish long-term impacts of living in a food
desert. The methodology in this paper improves upon prior research, and research should continue to
examine the causal effect of living in a food desert on diet-related diseases. Finally, we need more
research on the impact of food deserts on vulnerable populations such as children and the elderly.
33
References
1. 2014 National Diabetes Statistics (2014). Centers for Disease Control and Prevention.
http://www.cdc.gov/diabetes/data/statistics/2014statisticsreport.html
2. Adult Obesity Facts. (2015) Centers for Disease Control and Prevention.
http://www.cdc.gov/obesity/data/adult.html
3. AlHasan, D. M., & Eberth, J. M. (2016). An ecological analysis of food outlet density and
prevalence of type II diabetes in South Carolina counties. BMC Public Health, 161-9.
doi:10.1186/s12889-015-2681-6
4. Austin, P. (2011) An Introduction to Propensity Score Methods for Reducing the Effects of
Confounding in Observational Studies. Multivariate Behav Res. 2011 May; 46(3): 399–424.
5. Austin, P. C. (2014). A comparison of 12 algorithms for matching on the propensity score.
Statistics in Medicine, 33(6), 1057-1069. doi:10.1002/sim.6004
6. Ayala, G.X., B. Baquero, et. al (2009). “Working with Tiendas to Promote Healthy Eating,”
Presentation at the IOM/NRC Workshop on the Public Health Effects of Food Deserts, January
27, Washington, DC.
7. Block, J. P., Christakis, N. A., O’Malley, A. J., & Subramanian, S. V. (2011). Proximity to Food
Establishments and Body Mass Index in the Framingham Heart Study Offspring Cohort Over 30
Years. American Journal of Epidemiology, 174(10), 1108-1114 7p. doi:aje/kwr244
8. Bodor, J., Rice, J. et al. (2010) The association between obesity and urban food environments. J
Urban Health; 87(5):771-81. doi: 10.1007/s11524-010-9460-6.
9. Boone-Heinonen, J., Gordon-Larsen, P., Kiefe, C. I., Shikany, J. M., Lewis, C. E., & Popkin, B. M.
(2011). Fast food restaurants and food stores: longitudinal associations with diet in young to
middle-aged adults: the CARDIA study. Archives of Internal Medicine, 171(13), 1162-1170.
doi:10.1001/archinternmed.2011.283
34

10. Breneman, V., Farrigan, T., Hamrick, K. et al. (2009). Access to Affordable and Nutritious Food:
Measuring and Understanding Food Deserts and Their Consequences. United States Department
of Agriculture Economic Research Service.
11. Buczynski, A, Freishtat, H., et. al. (2015) Mapping Baltimore City’s Food Environment: 2015
Report. http://archive.baltimorecity.gov/portals/0/agencies/planning/public%20downloads/
Baltimore%20Food%20Environment%20Report%202015-v1.2.pdf
12. Calculate your BMI. National Institutes of Health.
http://www.nhlbi.nih.gov/health/educational/lose_wt/BMI/bmicalc.htm
13. California Center for Public Health Advocacy, PolicyLink, and UCLA Center for Health Policy
Research (2008). Designed for Disease: The Link Between Local Food Environments and Obesity
and Diabetes.
14. Cummins S, Petticrew M, Higgins C, et al. (2005) Large scale food retailing as an intervention for
diet and health: quasi-experimental evaluation of a natural experiment. J Epidemiol Community
Health, 59:1035-40.
15. Cummins, S., A. Findlay, M. Petticrew, and L. Sparks (2005). “Healthy Cities: The Impact of Food
Retail-Led Regeneration on Food Access, Choice and Retail Structure,” Built Environment, Vol.
31(4): 288-301.
16. Dubowitz, T., Ghosh-Dastidar, M., Cohen, D., et al. (2015) Diet And Perceptions Change With
Supermarket Introduction In A Food Desert, But Not Because Of Supermarket Use. Health
Affairs, 34:111858-1868; doi:10.1377/hlthaff.2015.0667.
17. Dutko, P., Ploeg, V. M, & Farrigan. T. (2012). “Characteristics and Influential Factors of Food
Deserts”. United States Department of Agriculture Economic Research Service
18. Fardet, A., & Boirie, Y. (2014). Associations between food and beverage groups and major diet-
related chronic diseases: an exhaustive review of pooled/meta-analyses and systematic reviews.
35

Nutrition Reviews, 72(12), 741-762.
19. Food Access Research Atlas Overview. United States Department of Agriculture.
http://www.ers.usda.gov/data-products/food-access-research-atlas/.aspx
20. Frisvold, D. (2015) Nutrition and cognitive achievement: An evaluation of the School Breakfast
Program. Journal of Public Economics, Volume 124, April 2015, Pages 91–104.
21. Gallagher, M. (2006). Examining the Impact of Food Deserts on Public Health in Chicago, Mari
Gallagher Research & Consulting Group.
http://www.marigallagher.com/site_media/dynamic/project_files/1_ChicagoFoodDesertReport-
Full_.pdf
22. Giang, T., Karpyn, A., et al. (2008). Closing the grocery gap in underserved communities: the
creation of the Pennsylvania Fresh Food Financing Initiative. J Public Health Manag Pract.
2008;14(3):272-9. doi: 10.1097/01.PHH.0000316486.57512.bf.
23. Gittelsohn J, Rowan M, Gadhoke P. (2012) Interventions in small food stores to change the food
environment, improve diet, and reduce risk of chronic disease. Prev Chronic Dis; 9:110015. DOI:
http://dx.doi.org/10.5888/pcd9.110015
24. Hanibuchi, T., Kondo, K., Nakaya, T. et al. (2011) Neighborhood food environment and body
mass index among Japanese older adults: results from the Aichi Gerontological Evaluation Study
(AGES). International Journal of Health Geographics, 10:43.
25. High Blood Pressure Facts (2015). Centers for Disease Control and Prevention.
http://www.cdc.gov/bloodpressure/facts.htm
26. Hu, F. (2008) Measurements of Adiposity and Body Composition. Obesity Epidemiology. New
York City: Oxford University Press; 53–83.
27. Ihrke, D. & Faber, C. (2012) Geographical Mobility: 2005 to 2010. U.S. Department of Commerce
Economics and Statistics Administration. https://www.census.gov/prod/2012pubs/p20-567.pdf
36

28. Indiana University School of Public Health. (2013) Health Impact Assessment: Development of a
Full- Service Grocery Store Within a Food Desert.
http://www.healthpolicy.iupui.edu/PubsPDFs/Health%20Impact%20Assessment
%20Development%20of%20Full-Service%20Grocery%20Store.pdf
29. Kai A., S., Jensen, E. B., & Hinrichs, C. C. (2009). Food Deserts and Overweight Schoolchildren:
Evidence from Pennsylvania. Rural Sociology, 74(2), 153-177.
30. King, G. & Nielsen, R. (2015) Why Propensity Scores Should Not Be Used for Matching.
Presentation at HMS/BWH Division of Pharmacoepidemiology and Pharmacoeconomics.
31. Kung H., Hoyert D., Xu J., Murphy S. (2008) Deaths: Final Data for 2005: National Vital Statistics
Reports; vol. 56, no. 10. Hyattsville, MD: National Center for Health Statistics.
32. Larson, N., Story, M., & Nelson, M. (2009) Neighborhood Environments Disparities in Access to
Healthy Foods in the U.S. Am J Prev Med, 36(1), 74-81.
33. Mari Gallagher Research and Consulting Group (2006). Examining the Impact of food deserts on
public health in Chicago.
http://www.marigallagher.com/site_media/dynamic/project_files/Chicago_Food_Desert_Repor
t.pdf
34. Medical Expenditures Panel Survey: Household Component. Agency for Health Care Research
and Quality. http://meps.ahrq.gov/mepsweb/survey_comp/household.jsp
35. Mikkelsen, L. & Chehimi, S. (2007) The Links Between the Neighborhood Food Environment and
Childhood Nutrition. The Robert wood Johnson Association.
36. Moore, L., Diez Roux, A., et al. (2008) Associations of the Local Food Environment with Diet
Quality—A Comparison of Assessments based on Surveys and Geographic Information Systems:
The Multi-Ethnic Study of Atherosclerosis. Am. J. Epidemiol. 167 (8): 917-924. doi:
10.1093/aje/kwm394
37
37. Morland K, Wing S, Diez Roux A. (2002) The contextual effect of the local food environment on
residents’ diets: the atherosclerosis risk in communities study. Am J Public Health;92:1761–7.
38. Morland, Kimberly et al. (2006) Supermarkets, Other Food Stores, and Obesity. American
Journal of Preventive Medicine, Volume 30, Issue 4, 333 - 339.
39. Morton, L.W., and T.C. Blanchard (2007). “Starved for Access: Life in Rural America’s Food
Deserts,” Rural Realities 1(4): 1-10.
40. Mozaffarian, D., Benjamin, E. J., et al. (2015). Heart disease and stroke statistics--2015 update: a
report from the American Heart Association. Circulation, 131(4), e29-e322.
doi:10.1161/CIR.0000000000000152.
41. Murnane, R. & Willett, J. (2010) Methods Matter: Improving Causal Inference in Educational and
Social Science Research. Oxford University Press.
42. Neckerman, K.M., Bader, M., Purciel, M., and P. Yousefzadeh (2009). “Measuring Food Access in
Urban Areas,” National Poverty Center Working Paper, www.npc.umich.edu/news/events/food-
access/index.php
43. Neumark-Sztainer D, Wall M, Perry C, et al. “Correlates of Fruit and vegetable intake among
adolescents. Findings from Project EaT.” Preventive Medicine, 37(3): 198–208, 2003.
44. Ploeg, V. M, Farrigan. T., et. al. (2009). “Access to Affordable and Nutritious Food Measuring and
Understanding Food Deserts and Their Consequences”. United States Department of Agriculture
Economic Research Service.
45. Quick Facts: United States. (2014) United States Census Bureau.
http://www.census.gov/quickfacts/table/PST045215/00
46. Rose, D. & Richards, R. (2004). “Food Store Access and Household Fruit and Vegetable Use
Among Participants in the US Food Stamp Program,” Public Health Nutrition 7(8): 1081-1088.
47. Ruxton C. (2011) The role of micronutrients in healthy ageing. Nutrition & Food Science; 41(6):
38
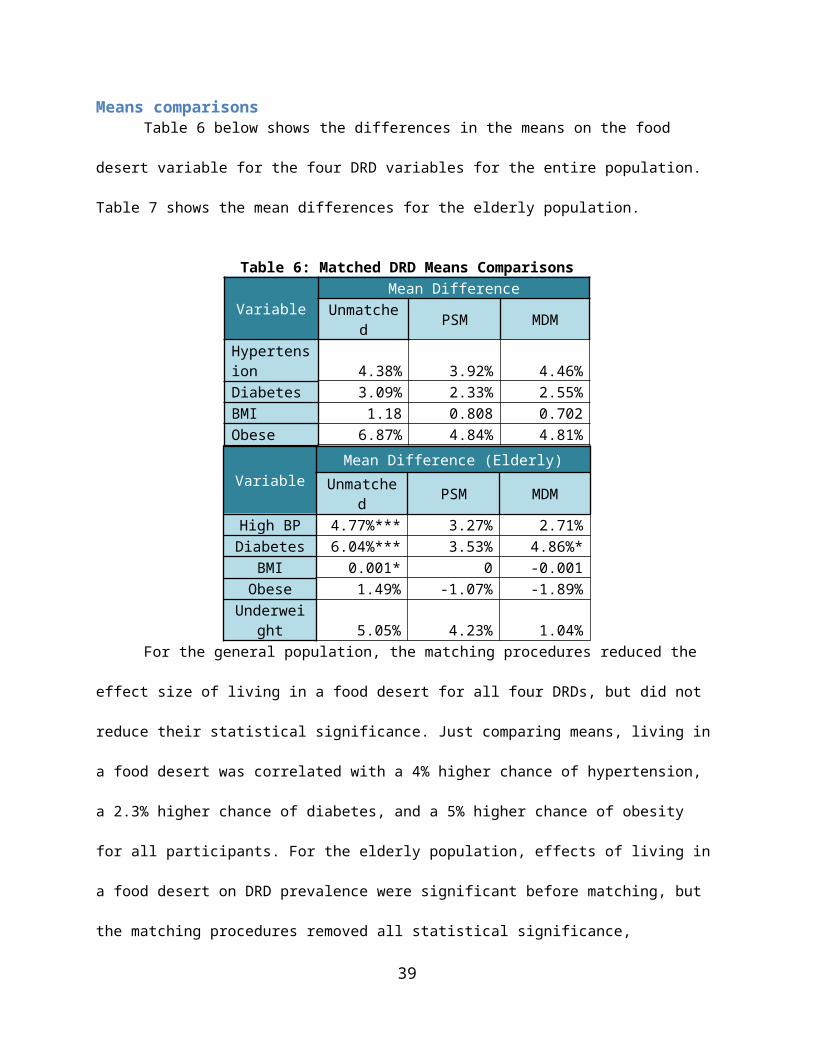
420–429.
48. Sharkey, Joseph R; Johnson, Cassandra M; Dean, Wesley R (2010). "Food Access and Perceptions
of the Community and Household Food Environment as Correlates of Fruit and Vegetable Intake
among Rural Seniors". BMC Geriatrics 10: 32. doi:10.1186/1471-2318-10-32.
49. Stuart, E. (2010) Matching methods for causal inference: A review and a look forward. Stat Sci.
25(1): 1–21. doi: 10.1214/09-STS313
50. U.S. Census bureau (2014) Mobility is Most Common Disability Among Older Americans, Census
Bureau Reports. http://www.census.gov/newsroom/press-releases/2014/cb14-218.html
51. US Burden of Disease Collaborators. The state of US health, 1990–2010: burden of diseases,
injuries, and risk factors. JAMA. 2013;310:591–608.
52. USDA ERS. (2015) Food Access Research Atlas: Documentation. http://www.ers.usda.gov/data-
products/food-access-research-atlas/documentation.aspx#definitions
53. Willett, W., Koplan, J., Nugent, R. et al (2006). Disease Control Priorities in Developing Countries.
2nd edition. World Bank: Washington, DC. http://www.ncbi.nlm.nih.gov/books/NBK11795/
54. Wrigley, N., D. Warm, and B. Margetts (2003). “Deprivation, Diet and Food-Retail Access:
Findings From the Leeds ‘Food Deserts’ Study,” Environment and Planning A, 35: 151-188.
55. Your Guide to Diabetes. National Institutes of Health. http://www.niddk.nih.gov/health-
information/health-topics/Diabetes/your-guide-diabetes/Pages/index.aspx
56. Zick, C., Smith, K. et. al. (2009) Running to the Store? The relationship between neighborhood
environments and the risk of obesity. Social Science & Medicine, 69(10), Pages 1493–150.
39
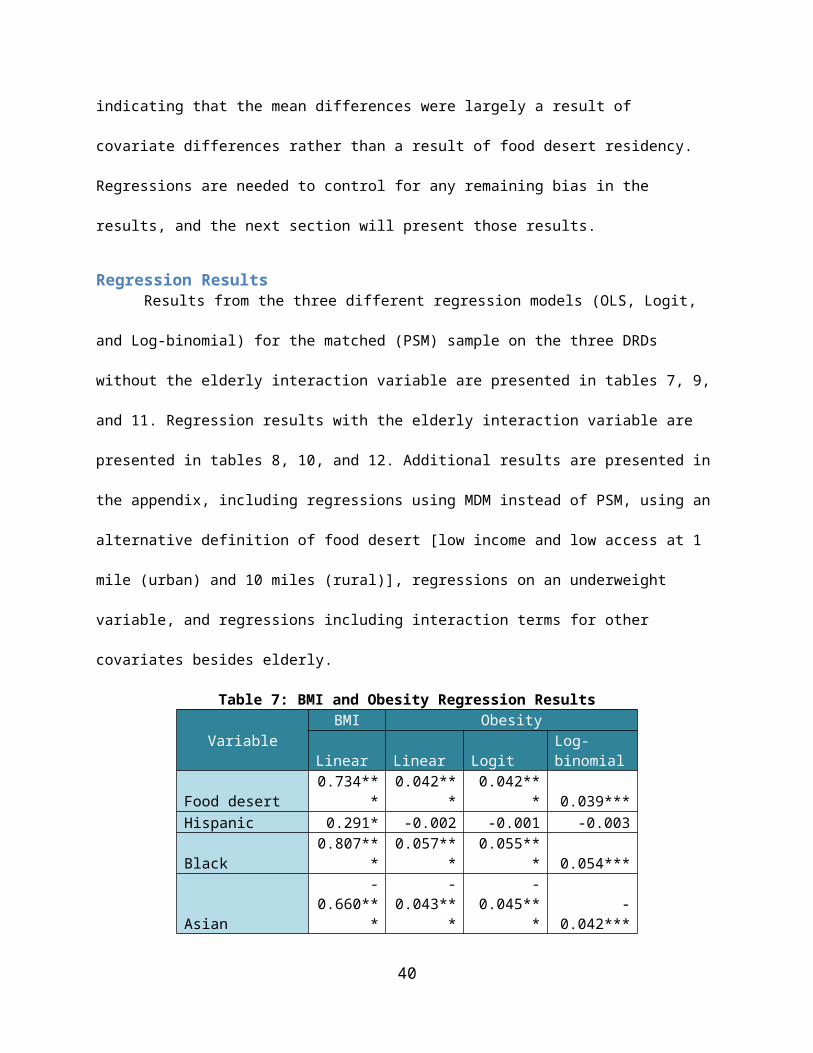
Appendix: Additional Data/Results
Diabetes (Mahalanobis Distance Matching)
Linear LogitLog-binomial
Food desert 0.022*** 0.021*** 0.022***Hispanic 0.015* 0.021** 0.026***Black 0.015** 0.017** 0.017***Asian 0.013 0.015* 0.018**Female 0 0.001 0Poverty level -0.000*** -0.000*** -0.000***Activity -0.026*** -0.024*** -0.025***Age 0.005*** 0.005*** 0.004***Years of Education -0.005*** -0.003*** -0.002***Elderly 0.014 -0.056*** -0.041***Married -0.009 0.003 0.008*Uninsured -0.029*** -0.031*** -0.038***Size of Household -0.003* -0.003 -0.004**constant -0.009r2 0.101bic 7317.318 11433.011 7553.255chi2 1946.661 2011.427
Diabetes (Mahalanobis Distance Matching)
Linear LogitLog-binomial
Food desert 0.019*** 0.025*** 0.029***Elderly*Food Desert 0.016 -0.01 -0.015*Hispanic 0.015* 0.021** 0.026***Black 0.015** 0.017** 0.017***Asian 0.013 0.015* 0.018**Female 0 0.001 0.001Poverty level -0.000*** -0.000*** -0.000***Activity -0.026*** -0.024*** -0.025***Age 0.005*** 0.005*** 0.004***Years of Education -0.005*** -0.003*** -0.002***Elderly 0.008 -0.052*** -0.033***Married -0.009 0.003 0.009*Uninsured -0.029*** -0.031*** -0.037***Size of -0.003* -0.003 -0.004**
40

Householdconstant -0.008r2 0.101bic 7325.507 11441.598 7558.429chi2 1947.968 1987.092
Diabetes (Alternative Food Desert Definition)
Linear LogitLog-binomial
Food desert 0.007 0.007 0.011**Hispanic 0.015* 0.022*** 0.027***Black 0.017** 0.019*** 0.019***Asian 0.015* 0.017* 0.020**Female 0.001 0.001 0.001Poverty level -0.000*** -0.000*** -0.000***Activity -0.026*** -0.024*** -0.026***Age 0.005*** 0.005*** 0.004***Years of Education -0.005*** -0.003*** -0.003***Elderly 0.015 -0.056*** -0.038***Married 0.001 -0.002 -0.005***Uninsured -0.029*** -0.031*** -0.038***Size of Household -0.004** -0.003* -0.005***constant -0.004r2 0.1bic 7342.944 11455 7575.376chi2 1924.673 1966.168
Diabetes (Alternative Food Desert Definition)
Linear LogitLog-binomial
Food desert 0.005 0.006 0.009*Elderly*Food Desert 0.034** 0.012 0.009Hispanic 0.015* 0.022*** 0.027***Black 0.016** 0.018*** 0.019***Asian 0.014 0.017* 0.019**Female 0.001 0.001 0Poverty level -0.000*** -0.000*** -0.000***Activity -0.026*** -0.024*** -0.026***Age 0.005*** 0.005*** 0.004***
41
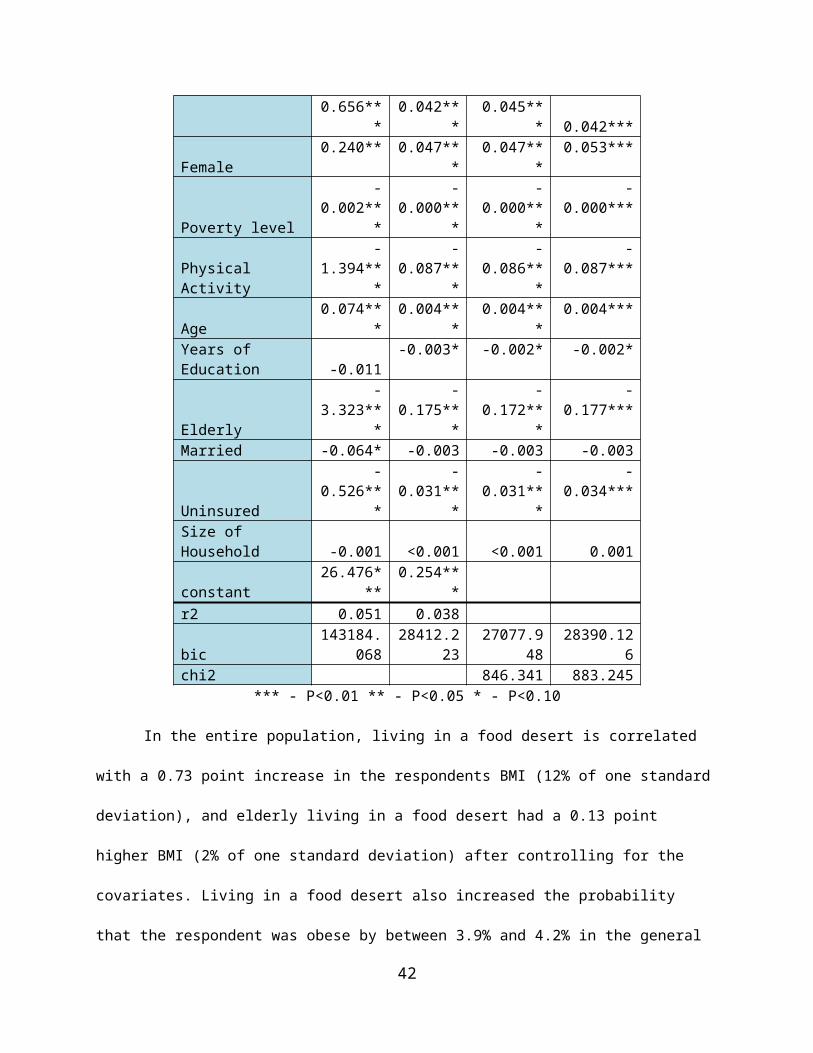
Years of Education -0.005*** -0.003*** -0.003***Elderly 0.003 -0.060*** -0.042***Married 0.001 -0.002 -0.005***Uninsured -0.028*** -0.031*** -0.038***Size of Household -0.004** -0.003* -0.005***constant -0.004r2 0.1bic 7344.613 11462.613 7582.056chi2 1926.952 1979.45
Variable
Diabetes (MDM with interactions)
Linear LogitLog- Binomial
Food Desert -0.045 -0.014 -0.005Elderly*Food Desert -0.044* -0.030* -0.035**Uninsured*Food Desert 0.008 0.017 0.025Age *Food Desert 0.002*** 0.001 0.001*Female* Food Desert -0.014 -0.014 -0.020**Years of Ed*Food Desert 0.001 0.001 0.001Active*Food Desert -0.007 -0.003 -0.005Hispanic* Food Desert -0.014 -0.021 -0.021*Black* Food Desert 0.012 0.006 0.002Hispanic 0.020** 0.029*** 0.033***Black 0.011 0.015* 0.017**Asian 0.014 0.015* 0.018**Female 0.006 0.007 0.009Poverty level -0.000*** -0.000*** -0.000***Physical Activity -0.023*** -0.023*** -0.023***Age 0.004*** 0.005*** 0.003***Years of Education -0.005*** -0.003** -0.003***Elderly 0.031** -0.044*** -0.021*Married 0.001 -0.002 -0.006***Uninsured -0.032*** -0.038*** -0.049***Size of Household -0.004** -0.003* -0.005***constant 0.013r2 0.103bic 7361.449 11494.256 7591.619chi2 1964.555 2040.429
42
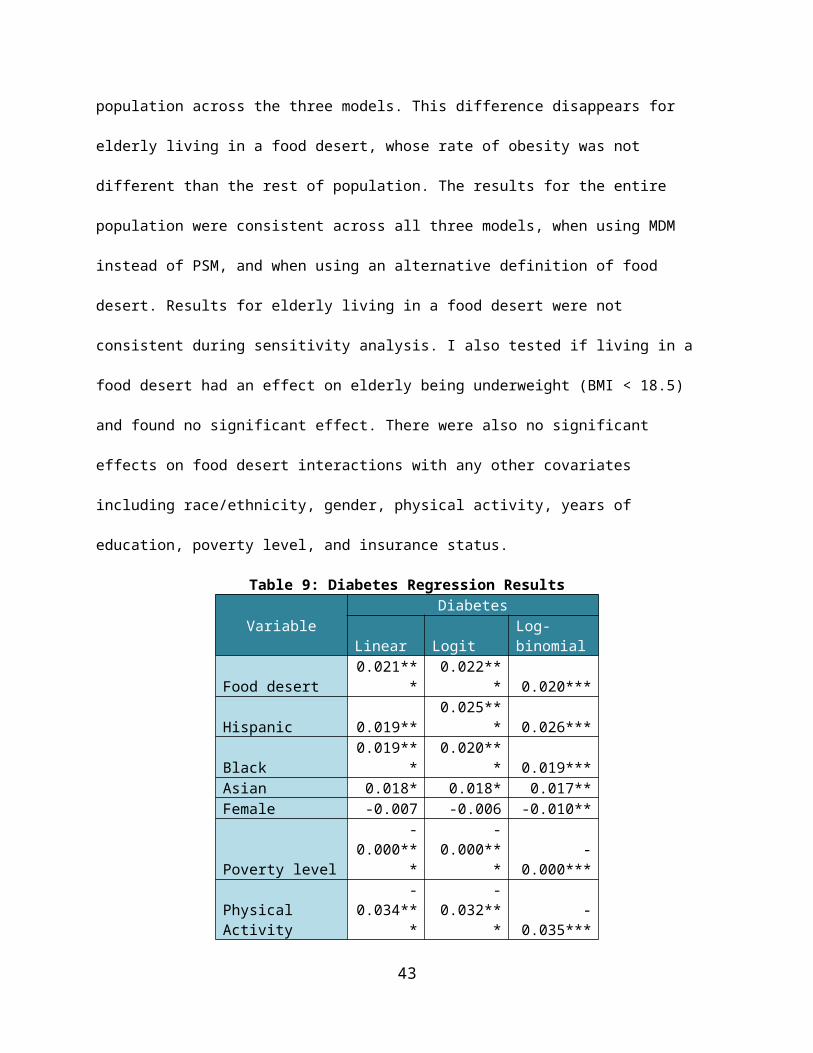
Obesity (Mahalanobis Distance Matching)
BMI Linear Linear LogitLog-binomial
Food desert 0.626*** 0.042*** 0.042*** 0.041***Hispanic 0.193 -0.011 -0.011 -0.012Black 0.901*** 0.059*** 0.058*** 0.056***Asian -0.357* -0.030* -0.031* -0.027*Female 0.238* 0.041*** 0.041*** 0.046***Poverty level -0.002*** -0.000*** -0.000*** -0.000***Activity -1.491*** -0.087*** -0.086*** -0.085***Age 0.071*** 0.004*** 0.004*** 0.003***Years of Education -0.054** -0.006*** -0.005*** -0.005***Elderly -3.348*** -0.177*** -0.174*** -0.173***Married 0.19 0.007 0.009 0.006Uninsured -0.644*** -0.039*** -0.039*** -0.041***Size of Household -0.013 0.001 0.001 0.002constant 27.092*** 0.287***r2 0.048 0.037bic 130447.809 25872.87 24656.603 25863.914chi2 744.444 766.347
Obesity (Mahalanobis Distance Matching)
BMI Linear Linear LogitLog-binomial
Food desert 0.760*** 0.051*** 0.050*** 0.049***Elderly*Food Desert -0.961*** -0.065** -0.064** -0.060**Hispanic 0.198 -0.011 -0.01 -0.012Black 0.907*** 0.059*** 0.058*** 0.056***Asian -0.351* -0.030* -0.030* -0.027*Female 0.237* 0.041*** 0.041*** 0.046***Poverty level -0.002*** -0.000*** -0.000*** -0.000***Activity -1.492*** -0.087*** -0.086*** -0.086***Age 0.071*** 0.004*** 0.004*** 0.003***Years of Education -0.055** -0.006*** -0.005*** -0.005***Elderly -2.999*** -0.153*** -0.150*** -0.148***Married 0.191 0.007 0.009 0.006Uninsured -0.647*** -0.039*** -0.039*** -0.041***Size of -0.013 0.001 0.001 0.002
43

Householdconstant 27.050*** 0.284***r2 0.049 0.038bic 130445.857 25872.001 24656.037 25864.69chi2 754.901 778.354
Obesity (Alternative Food Desert Definition)
BMI Linear Linear LogitLog-binomial
Food desert 0.543*** 0.035*** 0.034*** 0.032***Hispanic 0.232 -0.009 -0.008 -0.008Black 0.932*** 0.061*** 0.060*** 0.059***Asian -0.31 -0.027* -0.027* -0.024Female 0.230* 0.041*** 0.041*** 0.046***Poverty level -0.002*** -0.000*** -0.000*** -0.000***Activity -1.500*** -0.088*** -0.087*** -0.085***Age 0.069*** 0.004*** 0.004*** 0.003***Years of Education -0.056** -0.006*** -0.005*** -0.005***Elderly -3.340*** -0.175*** -0.173*** -0.171***Married -0.058 -0.003 -0.004 -0.003Uninsured -0.642*** -0.039*** -0.039*** -0.041***Size of Household -0.022 0.001 0.001 0.001constant 27.538*** 0.315***r2 0.048 0.036bic 130463.801 25888.868 24672.131 25883.016chi2 728.915 742.987
Obesity (Alternative Food Desert Definition)
BMI Linear Linear LogitLog-binomial
Food desert 0.573*** 0.037*** 0.036*** 0.034***Elderly*Food Desert -0.434 -0.029 -0.028 -0.025Hispanic 0.237 -0.008 -0.008 -0.008Black 0.938*** 0.061*** 0.060*** 0.059***Asian -0.304 -0.026* -0.027* -0.024Female 0.230* 0.041*** 0.041*** 0.046***Poverty level -0.002*** -0.000*** -0.000*** -0.000***Activity -1.501*** -0.088*** -0.087*** -0.085***Age 0.069*** 0.004*** 0.004*** 0.003***Years of -0.057** -0.006*** -0.006*** -0.005***
44

EducationElderly -3.182*** -0.165*** -0.162*** -0.161***Married -0.057 -0.003 -0.004 -0.003Uninsured -0.643*** -0.039*** -0.039*** -0.041***Size of Household -0.022 0 0.001 0.001constant 27.537*** 0.315***r2 0.048 0.036bic 130470.977 25896.399 24679.734 25891.187chi2 731.205 745.159
Obesity (MDM with interactions)BMI Linear Linear Logit Log-binomial
Food Desert -0.582 0.044 0.05 0.059Elderly*Food Desert -1.544*** -0.078** -0.066* -0.05Uninsured*Food Desert 0.218 0.001 0.003 0.01Age *Food Desert 0.016* 0 0 0Female* Food Desert 0.544** 0.029* 0.026 0.023Years of Ed*Food Desert 0.059 0.001 0.001 0.001Active*Food Desert 0.029 -0.012 -0.006 -0.003Hispanic* Food Desert -0.810** -0.052** -0.053** -0.056**Black* Food Desert -0.381 -0.018 -0.022 -0.023Hispanic 0.471** 0.007 0.009 0.01Black 1.035*** 0.065*** 0.066*** 0.066***Asian -0.361* -0.030* -0.031* -0.027*Female 0.034 0.030*** 0.031*** 0.036***Poverty level -0.002*** -0.000*** -0.000*** -0.000***Physical Activity -1.504*** -0.083*** -0.084*** -0.084***Age 0.063*** 0.004*** 0.004*** 0.003***Years of Education -0.077** -0.006*** -0.006*** -0.005**Elderly -2.785*** -0.148*** -0.148*** -0.152***Married -0.067* -0.004 -0.004 -0.003Uninsured -0.730*** -0.039*** -0.040*** -0.045***Size of Household -0.012 0.001 0.001 0.002constant 27.908*** 0.308***r2 0.05 0.038bic 130484.701 25924.414 24709.6 25918.767chi2 770.586 791.399
45

Underweight (MDM)
Linear LogitLog-binomial
Food desert -0.003 -0.003 -0.004*Elderly*Food Desert 0.003 0.003 0.004Hispanic -0.012*** -0.013*** -0.013***Black -0.004 -0.004 -0.004Asian 0.004 0.003 0.003Female 0.011*** 0.012*** 0.010***Poverty level 0 0 0Activity -0.003 -0.003 -0.002Age -0.000*** -0.001*** -0.001***Years of Education -0.001 -0.001 -0.001*Elderly 0.020*** 0.022*** 0.028***Married 0.002* 0.002* 0.001*Uninsured 0.002 0.003 0.004*Size of Household 0 0 0constant 0.045***r2 0.007bic -15566.068 2663.091 -14571.005chi2 94.6 131.813
Underweight (PSM)
Linear LogitLog-binomial
Food desert -0.004* -0.004* -0.005**Elderly*Food Desert 0.009 0.008 0.008Hispanic -0.011*** -0.012*** -0.009***Black -0.004** -0.005** -0.003*Asian 0.006** 0.004* 0.004**Female 0.014*** 0.016*** 0.014***Poverty level 0 0 0Activity -0.003** -0.003** -0.002Age -0.000*** -0.000*** -0.001***Years of Education -0.001*** -0.001*** -0.001***Elderly 0.014*** 0.016*** 0.019***Married 0.002*** 0.002*** 0.002***Uninsured 0 0.001 0.001Size of -0.001 -0.001 0
46

Householdconstant 0.045***r2 0.009bic -50789.954 7643.56 -50849.438chi2 385.179 431.356
Underweight (Alternative Definition of Food Desert)
Linear LogitLog-binomial
Food desert -0.006** -0.006** -0.005**Elderly*Food Desert 0.007 0.006 0.003Hispanic -0.011*** -0.012*** -0.009***Black -0.004** -0.005** -0.004*Asian 0.006** 0.004* 0.004**Female 0.014*** 0.016*** 0.014***Poverty level 0 0 0Activity -0.003* -0.003** -0.002Age -0.000*** -0.000*** -0.001***Years of Education -0.001*** -0.001*** -0.001***Elderly 0.015*** 0.017*** 0.020***Married 0.002*** 0.002*** 0.002***Uninsured 0 0.001 0.001Size of Household -0.001 -0.001 0constant 0.046***r2 0.009bic -50795.646 7637.609 -50846.871chi2 391.13 431.29
Hypertension (MDM)
Linear LogitLog-binomial
Food desert 0.037*** 0.037*** 0.032***Hispanic -0.037*** -0.039*** -0.026**Black 0.054*** 0.054*** 0.053***Asian 0.031** 0.032** 0.049***Female -0.014* -0.012* -0.002Poverty level -0.000*** -0.000*** -0.000***Activity -0.043*** -0.041*** -0.037***Age 0.013*** 0.012*** 0.012***Years of Education -0.006*** -0.005*** -0.003***
47
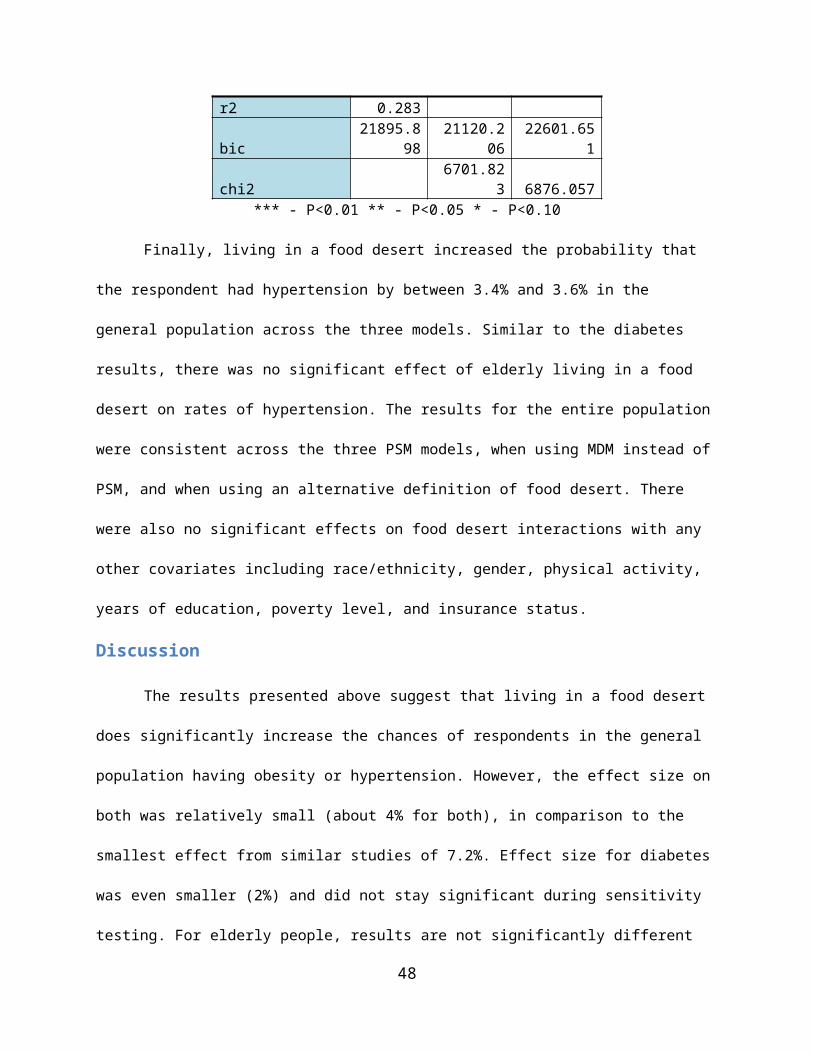
Elderly -0.013 -0.066*** -0.131***Married -0.032*** -0.016* -0.002Uninsured -0.060*** -0.056*** -0.080***Size of Household -0.009*** -0.008*** -0.012***constant -0.080***r2 0.284
bic 19606.86818957.09
9 20225.625chi2 6067.278 6426.119
Hypertension (PSM)
Linear LogitLog-binomial
Food desert 0.041*** 0.041*** 0.052***Elderly*Food Desert -0.025 -0.028 -0.045***Hispanic -0.036*** -0.039*** -0.026**Black 0.054*** 0.054*** 0.053***Asian 0.031** 0.033** 0.049***Female -0.014* -0.012* -0.003Poverty level -0.000*** -0.000*** -0.000***Activity -0.043*** -0.041*** -0.036***Age 0.013*** 0.012*** 0.012***Years of Education -0.006*** -0.005*** -0.003***Elderly -0.004 -0.057*** -0.112***Married -0.032*** -0.016* -0.001Uninsured -0.060*** -0.057*** -0.080***Size of Household -0.009*** -0.008*** -0.012***constant -0.081***r2 0.284
bic 19614.63318963.99
1 20213.968chi2 6070.278 6397.473
Hypertension (Alternative Definition of Food Desert)
Linear LogitLog-binomial
Food desert 0.027*** 0.025*** 0.022***Hispanic -0.036*** -0.038*** -0.023*Black 0.056*** 0.056*** 0.054***Asian 0.033** 0.035*** 0.051***
48

Female -0.012* -0.01 -0.002Poverty level -0.000*** -0.000*** -0.000***Activity -0.043*** -0.042*** -0.037***Age 0.013*** 0.012*** 0.012***Years of Education -0.006*** -0.005*** -0.003***Elderly -0.01 -0.065*** -0.129***Married 0.007*** 0.003 0.001Uninsured -0.059*** -0.056*** -0.080***Size of Household -0.011*** -0.010*** -0.012***constant -0.107***r2 0.283bic 19640.986 18987.94 20250.854chi2 6036.437 6394.157
Hypertension (Alternative Definition of Food Desert)
Linear LogitLog-binomial
Food desert 0.026*** 0.024*** 0.023***Elderly*Food Desert 0.005 0.003 -0.003Hispanic -0.036*** -0.038*** -0.023*Black 0.056*** 0.056*** 0.055***Asian 0.033** 0.034*** 0.051***Female -0.012* -0.01 -0.002Poverty level -0.000*** -0.000*** -0.000***Activity -0.043*** -0.042*** -0.037***Age 0.013*** 0.012*** 0.012***Years of Education -0.006*** -0.005*** -0.003***Elderly -0.012 -0.066*** -0.128***Married 0.007*** 0.003 0.001Uninsured -0.059*** -0.056*** -0.080***Size of Household -0.011*** -0.010*** -0.012***constant -0.107***r2 0.283
bic 19650.7618997.77
9 20260.636chi2 6036.49 6393.196
VariableHypertension (MDM with interactions)
Linear Logit Log-
49

BinomialFood Desert -0.035 0.015 0.024Elderly*Food Desert -0.085*** -0.038 -0.059***Uninsured*Food Desert 0.01 0.015 0Age *Food Desert 0.002*** 0 0Female* Food Desert 0.019 0.02 0.016Years of Ed*Food Desert 0.001 0 0Active*Food Desert 0.009 0.011 0.005Hispanic* Food Desert -0.039* -0.041* -0.044*Black* Food Desert -0.002 -0.005 0.003Hispanic -0.024* -0.025* -0.008Black 0.054*** 0.056*** 0.051***Asian 0.030** 0.032** 0.049***Female -0.019** -0.018* -0.009Poverty level -0.000*** -0.000*** -0.000***Physical Activity -0.046*** -0.045*** -0.038***Age 0.013*** 0.012*** 0.012***Years of Education -0.006*** -0.005*** -0.003**Elderly 0.02 -0.052*** -0.106***Married 0.007*** 0.002 0.001Uninsured -0.063*** -0.062*** -0.081***Size of Household -0.010*** -0.009*** -0.011***constant -0.087**r2 0.285bic 19668.744 19025.882 20268.717chi2 6077.634 6430.265
50