introduction the conceptual framework definition of …
TRANSCRIPT
1
INTRODUCTION
THE CONCEPTUAL FRAMEWORK
Definition of Concepts:
1. Foreign Direct Investment (FDI): FDI is a foreign corporation or company having
essential attributes of a corporation that is chartered under the laws of a state or
government other than that in which it is doing the business (Webster’s Third New
International dictionary, p.889). FDI involves control of a resident entity in one
economy by an enterprise resident in another economy (UNCTAD, 1996, p.20). It is
entry through mergers and acquisitions (UNCTAD, 2000, p.101). The World Bank
defines it as an investment made to acquire lasting management (usually at least 10
% of voting stock) in an enterprise operating in a country other than that of the host
investors (Gillis et al, 2001, p.522).
2. Transnational Corporations (TNCs): TNCs are enterprises that produce in more than
one country and consider overseas’ operations to be central to its profitability (Gillis
et al, 2001, p.524) while Moosa (2002, p.2) defines TNCS as firms that do cross
border activities via subsidiaries, affiliates and join ventures.
3. Distinguishing between FDI and TNCs
Transnational corporations (TNCs) are parent enterprises or foreign affiliates, usually
have some degree of equity stake; usually 10 percent needed for effective voice in
management, While FDI refers to capital flows between parent and subsidiary
enterprises.1 The operational definition considers TNCs and FDI to mean the same.
_________________________ 1http://www.unctad.org/Templates/Page.asp?intItemID=3148&lang=1
2
Operational Definitions:
1. Foreign direct Investment (FDI): This study refers to FDI and TNCs to mean the
same in Uganda’s economy, whether Joint Ventures, Mergers and Acquisitions or
Greenfield, in which foreign investors have greatest share usually 10 percent of the
equity stake and taking full management say and controls.
2. Development Objectives: Development objectives are specific to the generation of
employment and improving household incomes, sustaining regional development, and
technology spillovers, local capabilities in absorbing FDI benefits, building linkages
for enterprise development, and competition in the private sector led economy.
3. Host economy: Host economy refers to the country in which the enterprises are
operating rather than their home economy
Constructs:
Quality FDI attraction means attracting FDI to meet host’s development objectives,
especially in areas of resource capabilities, and location advantages.
Appropriate policy regimes are defined in terms of employing FDI policies which are
relevant to the country’s level of development and priority activities. These include
opening up for FDI, active marketing targeting specific subsets of TNCs for industrial
and export developments. Appropriate FDI incentives mean incentives which have great
impact in the economy in terms of spillovers, such as in priority industries, regional
development, exporting research and development. Significant spillovers mean human
resource development, export promotion, technological transfers, linkages and enterprise
development and restructuring. Spillovers depend on host’s absorptive capacity, level of

3
economic development, degree of education and extent of competition in the host
country. Improving host capabilities to increase absorptive capacity occurs as a result of
spillovers by offering quality education on top of the general education, human resource
development in managerial skills and increased expenditures on infrastructure.
Technological competence depicts the ability of host’s economy to acquire and use the
technological knowledge to promote economic development. It should be relevant to the
host’s stage of development, and injecting competition through avoidance of cartel
practices. The promotion of business linkages is likely to be successful if all systematic
policy approaches to all factors influencing linkages are adopted and could lead to
spillovers. Host country regulations promote domestic development priorities and
linkages to protect public welfare from the negative impact of FDI. Quality of regulations
and good governance improve investor’s perceptions. Host country’s capacity to
influence and control TNCs determines the outcome of FDI.
Based on above concepts and constructs, a simple model is developed to guide a
developing country in maximizing FDI spillovers. This is based on the following
assumptions: first, that government is in a position to strategically attract quality FDI, and
secondly, that government can discretionary apply various policy approaches that suit its
development objectives. Since FDI enters into the host economy through various forms
such greenfield (new investment), mergers and acquisitions, and joint ventures,
government therefore, determines quality FDI to maximize its spillovers. The end result

4
is addressing host development challenges. Hence, economic growth and development
will be achieved and sustained as illustrated below.
Illustration 1: A simple Model for a developing country
using FDI as an alternative development paradigm:
Source: Author’s contribution
Government strategically attracting FDI
Policy
approaches:
Minimalist
Interventioni
st
Selective
Restrictive
Spillovers:
Transfers of technology
Human capital
development
Business competition
Integration and linkages
Enterprise development
and restructuring
Increased growth and productivity in the
host economy
Addressing development challenges of:
1. Unemployment
2. Income poverty
3. Linkages
4. Increased export
5. Income poverty
6. Technological upgrading etc
Nature of FDI
Greenfield
M &As
Joint
Ventures
Economic growth and development
5
Background to the study:
It is important to discuss the best-policy practices that work for development objectives
of host economies. FDI plays a significant role in the development process of host
economies because it acts as a catalyst for obtaining foreign technology and knowledge,
managerial skills and capital. However, policies are required to maximize spillovers from
FDI and minimize the negative externalities fundamentally by determining what role the
government wants FDI to play in its development process as a host economy. The
renewed confidence in the positive benefits of FDI has led many countries that were
restricting FDI in the 1960s, 1970s and 1980s to be more open towards FDI in the 1990s.2
More so, there is an increased recognition that the bundle of assets and capabilities
encompassed in FDI could contribute directly to the growth and development of national
economies,3 declining levels of Official Development Assistance (ODA) have increased
reliance on FDI, and least but not last, is that developing countries have gained
confidence in their ability to maximize benefits and minimize liabilities of Transnational
Corporations (TNCs).4 Host government interventions on the activities of FDI enterprises
may be motivated by two primary types of market failures: 1) coordination failures in
development process; and 2) divergence of private interests of investors and social
interests of the host economies (UNCTAD, 2003a, p.41). In spite the effort in improving
policy environments in sub Saharan Africa (SSA), its share of FDI in developing
countries is declining and its inflows have been characterized by absolute progress but
with a relative decline (Asiedu, 2004, p.41). “It is not enough to improve on one’s policy
environment, but improvements need to be made in both absolute terms and relative
terms”. This signifies the complementary role of FDI to domestic investment as a means
to an end and not the end itself.

6
Uganda demonstrated efforts to achieve economic development by instituting Uganda
Industrial Act of 1963 to promote both private and local investors (Obwona, 2001, p.50;
Obwona & Egesa, 2004, p.5-9) and Foreign Investment Act of 1964 provided for
protection of investors against illegal state’s expropriation. However, the “economic war”
declared by President Amin’s regime in 1972 led to the deterioration of investment
climate in the economy, that was characterized by nationalization, hostility against
foreign investors. This is because he wanted to empower local Ugandans in running the
economy.
To re-build the confidence of foreign investors in the economy, Uganda Investment
Authority (UIA) was created to link up investors into the economy via effective
marketing, and also implemented the privatization program in 1992 (UCTAD, 2000a,
p.3&4; Obwona, 2001, p.52; &MIGA, 2004, p.47) and it is now a model in Africa. This
made Uganda to be ranked among the “forerunners” of FDI in Africa in 1998 (UNCTAD,
2000a, p.3&4). Even total flows of FDI went upwards from US$ 1 million in 1991 to
US$256.4 in 2005.5 Uganda’s GDP (average annual growth) reached 5.6 per cent in
2005. Uganda is now among the newly market oriented economies that employs liberal
policies for attracting FDI to solve the economy’s development challenges.
__________________________ 2 FDI has the objective of obtaining a lasting interest by a resident entity in one economy in an entity
resident in an economy other than that of the investors, with lasting usually defined as a 10 per cent in the
entity (Te Velde, 2001, p.4). 3For a decade, economists became convinced that the key to rapid economic development lay not in a
country's natural resources, physical or human capital, but rather in the set of economic policies that it
pursued (Kobrin, 2001, p. 68) 4Te Velde (2001, p.29) recognized that local capabilities play a dual role of attracting FDI and absorbing
positive spillovers associated with FDI. 5IMF, Balance of payments CD ROM, August 2006 available at
http://www.unctad.org/sections/dite_fdistat/docs/wid_cp_ug_en.pdf

7
CHAPTER ONE
METHODOLOGICAL BACKGROUND
1.1 Problem statement:
Of recent, public debates and criticisms are being directed to the Government of Uganda
about the significance of achieving economic development by attracting FDI. While
government maintains that improving policy environment will attract FDI to finance the
economy without adding further indebtedness, critics justified their arguments based on
the sense that FDI is being attracted into Uganda due to the availability of incentives
(UNIDO, 2002, p.13) and have made little progress in creating economic benefits to
ordinary Ugandans. FDI is oriented into export of traditional products that have limited
linkages in the economy. Geographical position of Uganda constraints FDI ability to
expand the economy through trade and take part in global specialization and Uganda has
to depend on appropriate political and commercial relationships with Kenya and
Tanzania (UNCTAD, 2003b, p.2&3) in order to access sea ports. Uganda has narrow
resource base and domestic market even though it is ranked third in terms of progress in
business environment and number eleven in Africa in terms of FDI attraction (UNCTAD,
1999, p.48&49). This study therefore, evaluates Government of Uganda’s stand on the
importance of using FDI to address the country’s development challenges, based on a
study of the best practiced outcomes related to FDI spillovers and then suggests policy
options for such maximization. This study covers the period from 1990-2006 as a
reflection of the beginning of liberalization and privatization. This range is sufficient for
analyzing the best practiced outcomes related FDI spillovers.

8
1.2 Research question:
To what extent the Government of Uganda supports FDI as an alternative development
paradigm? What are possible strategies for maximizing FDI benefits to meet Ugandan
development objectives?
1.3 Investigative questions:
1. How do macroeconomic and institutional incentives affect FDI in Uganda?
2. What are the basic characteristics of FDI enterprises in Uganda?
3. To what extent has Uganda as a host benefited from FDI spillovers?
4. What are some strategic policies that Uganda has to consider urgently for effective
targeting of FDI?
1.5 Study Scope:
This study covers FDI in Uganda with regards to macroeconomic and institutional
incentives, basic characteristics of investing enterprises, FDI benefits through spillovers
rather than direct effects in countries of low domestic savings and weak financial
intermediation, and looks at the policy options for managing FDI desirability. This study
covers the period from 1990 to 2006 as a reflection of the beginning of liberalization and
privatization policies in Uganda. It is from this time that Uganda started opening up its
economy for private investors and Uganda Investment Authority was created in 1991 to
facilitate investment marketing. This period is considered sufficient to realize results of
FDI policies pursued.
9
CHAPTER TWO
FOREIGN DIRECT INVESTMENT AND DEVELOPMENT IN HOST
ECONOMIES:
THEORETICAL AND LITERATURE REVIEW
2.1 Introduction:
This chapter covers the literature review on FDI in host economies. The various aspects
of FDI discussed include: FDI theories, macroeconomic and institutional incentives, basic
characteristics of FDI enterprises, FDI benefits, and policy options for managing FDI in
host economies. The eclectic theory (OLI) developed by Dunning (1981, 1988, 1995,)
provides a conceptual framework for explaining FDI in Host Economies. The paradigm
states that FDI is a function of three variables: (1) existence of Ownership-Specific
Advantages (O) that is based on firm’s resources and capabilities; (2) host country’s
Location-Specific Advantages (L) comprised of both natural and created resources; and
(3) is the Internalization (I) by which firms combine Ownership Advantages with
Location Advantages to improve their competitiveness. Scholars see the theory as
significance in explaining reasons for ‘why’, ‘how’, and ‘where’ of TNCs production,
whereas others see the explanatory importance of constituting many variables as a source
limitation. Kehal (2004, p.16) found that market size is the most popular factor
influencing a country propensity to attract inward investment, and this was supported by
subsequent empirical literature he reviewed to justify the market size hypothesis. In line
with the above mentioned factors which attract FDI, availability of natural resources in
host economies is the most fundamental factor. Others can include market size and
growth rate, political factors and economic stabilization for poorly resourced economies.
In fact, these factors depend on the nature of host economies.

10
2.2 Macroeconomic and Institutional Reforms in Host
Economies:
This subsection discusses liberalization and privatization programs in host economies
implemented to attract FDI, determinants and motivations of FDI, fiscal incentives,
Investment Promotion Agencies and Export Promotion Zones, performance requirements,
decentralization of FDI process.
2.2.1: Liberalization and privatization:
Official Development Assistance (ODA) declined by the beginning of 1990s (UNCTAD,
1998, p.13) and host economies resorted to different policies of attracting FDI. However,
a low-waged country, even with liberal policies, needed various advantages such as
natural resources and political stability for attracting FDI (Wood, 2001, p.18). African
governments have put efforts in economic liberalization (UNCTAD, 1995, p.95),
addressing investors concerns, privatizing and actively promoting investment
(UNCTAD, 2003, p.36), making a total of 42 regulatory changes to favor FDI by 2005
(UNCTAD, 2006, p.46). But more are yet needed on improving political stability and
privatization through political consensus of transparent policy (UNCTAD, 1995, p.90).
However, political consensus is a nightmare in developing countries where power
distribution is explained well by using elitist theory.
Privatization programs are common in African countries like Angola, Cape Verde, and
among others (UNCTAD, 1998, p. 170). Privatization programs across Africa and
African Growth and Opportunities Act have influenced strategic investors (UNCTAD,
11
2006, p.49). As for the African comparative advantages, the focus must be based on long
term programs that attract FDI into vital sectors like natural resources that needed heavy
investment. However, many with abundant natural resources have not even developed.
In addition, countries in Sub- Saharan Africa (SSA) such as Burkina Faso, Cameroon,
Ethiopia, Ghana, and Madagascar among others have ongoing Integrated Industrial
Development Programs that cover wide range of development issues including major
components relating to FDI and capacity building of local intermediary institutions
(UNIDO, 2002, p.2). Among the new schemes involving many countries include African
Growth and Opportunities Act (AGOA) (UNCTAD, 2003, p.37) and New Partnership for
African Development (NEPAD) that has prospect in infrastructure and energy investment
development and among other priorities. For this case, NEPAD suits SSA as it needs
more of development administration that has been neglected in economic development
paradigm.
2.2.2 Determinants and Motivations of FDI:
Pull factors of FDI to developing countries are favored by growing markets, rising costs
of factor production in home economies, host government policy frameworks, business
facilitation.1
_____________________ 1 Government policies include competition, incentives, transparent governance, investment in infrastructure and property rights and minimal foreign exchange regulations. Macroeconomic and political factors include uncertainty; strong currency, political stability and common monetary area (UNCTAD, 2006, p.157).

12
Similarly, UNCTAD (1999, p.91; 2003, p.85), grouped FDI determinants into host policy
frameworks, economic and business facilitation while Wei and Balasurbramanyam
(2004, p. 178) grouped them into: (1) those related to the objectives of the prospective
investors; and (2) the policy framework of host countries. They argued that non-mineral
countries in Africa would attract FDI through macroeconomic stability. But even the
macroeconomic stability works well only for exploitation of the mineral resources rather
than in non – minerals.
According to Kehal (2004, p.22), locational decisions by TNCs do not only depend on
opening up an economy, but are primarily driven by economic fundamentals including
natural resources, availability of markets and high growth rates. However, Moosa (2002,
p.50) recognized other factors other than locational and market size. These are political
risks and country risks; tax policies; trade barriers; and government regulations. Hence
the importance of market size as a determinant of investment location has diminished;
even a small country can now compete favorably for FDI, given that they can provide
sufficiently attractive conditions for foreign investors.2
__________________________________ 2 Until recently, there was a strong consensus in the literature that FDI is mainly attracted by strong economic fundamentals (UNCTAD, 2003a, 31). These are market size and income level, skills, infrastructure and other resources that facilitate efficient specialization of production, trade policies, and political and macroeconomic stability as other central determinants. Investment incentives were seen as relatively minor determinants of FDI decisions. Globalization has changed this picture and made incentives more important determinant of international investment decisions. More than 100 countries provided various FDI incentives already in the mid-1990s, and dozens more introduced such incentives since the few countries compete for FDI without any form of subsidies today.
13
If the importance of market size has declined, then China case disapproves this
proposition. In fact, market size and natural resource availability are the most important
factors for FDI attraction in host economies. Other factors like subsidies and political
stability are necessary conditions needed for exploitation of natural resources and
production to supply goods and services.
According to UNCTAD (1998, p.106), TNCS are resource-seeking, market-seeking,
efficiency-seeking and strategic asset seeking investment. Therefore, the different
motives could have different impacts in host economies. FDI in SSA are resource seeking
mainly, in fuel, oil and mineral resources. Such investments tend to be less sensitive to
policy environments. For example, Angola, an oil rich country was ranked first in terms
of FDI receipt in 1998 among African countries (UNCTAD, 1998, p.166; 1999, p.46). In
addition to natural resources, FDI in Africa depends on economic infrastructure, and to
lesser extent the size of domestic economy (UNCTAD, 1995, p.85; OECD, 2002, p.8).
In terms of rating; the degree of influence on profitability of investments was seen as the
factor with the highest influence, followed by state physical infrastructure, political and
economic outlook and last is regional markets (UNCTAD, 1999. p.47&50–52). Further
more, the rate of return in Africa was more profitable than in any other developing
countries though the share has been declining. While the returns on investment can be
high in Africa (OECD, 2003, p.7), the effects are more counterbalanced by high taxes and
significant risk of capital losses. Rising corporate profits and high commodity prices
boosted FDI inflows in 2005 to a historical high of $31 billion from $17 in 2004
(UNCTAD, 2006, p.40–44). However, the region continues to exhibit weaknesses that
14
constraints its ability to attract quality FDI. For instance the continent has poor
infrastructure, skills and technical based and general education enrollment.
2.2.3 Fiscal incentives:
a) Tax Incentives:
Tax incentives are more explicit than the implicit tax holidays, and are offered as
investment allowances. There is overwhelming evidence that, relative to other factors,
fiscal incentives are only a minor element in the locational decisions of TNCs
(UNCTAD, 1995, p.298). However, the impact is not negligible: if one country offers
and the other does not, ceteris peribus, foreign investors could be influenced in their
location decisions between countries. Factors such as market size, skills level and
economic stability and regulations remain the most important.
More so, TNC executives now readily admit the increasing importance of tax incentives
in investment decisions (UNCTAD, 2003a, p.31) in the sense that they influence FDI
inflows. It is possible that the competition between potential investment locations within
countries will raise subsidy levels so much that most of the benefits are shifted from host
countries to foreign investors.3 OECD (2005, p.6) further pointed out that investors are
more likely to be attracted to the locations when existing investors give positive advice.
___________________________ 3In addition, costs of subsidization invite rent seeking FDI. For example, tax holidays and tax breaks may appear simple and innocuous forms of incentives, but are likely to lead to transfer pricing and other distortions as firms try to shift as many transactions as possible to activities with tax preferences, or set up new firms as the tax preferences of existing firms expire (UNCTAD, 2003a, p.33).

15
This puts the government in a situation of making already existing investors have positive
perception of the host environments for doing businesses. However, tax incentives are
used as politically ideology to appease people on government’s commitment to promote
development per se. However, tax incentives should be used to attract capital and
technology for required purpose; spur industrial growth in particular geographical
locations where infrastructure is inadequate among others. This is because investment
incentives tend to benefit mostly foot loose industries which operate in short term basis.
They are engaged in producing consumption goods and services, and their costs of
relocation to neighboring countries are low, export oriented investment, in countries or
regions that are similar to neighboring countries and in regions where the business
conditions are favorable.
b) Tax Holiday:
Tax holidays are offered for a specific period of time, to particular types of investments,
that government wants to promote. Investing enterprises pay no taxes specified in
agreements until the grace period ends. Tax holidays are essential in quick capital
recovery and maintain greater liquidity in early years (Seid, 2002, p.40). Thus reducing
risks, provide large benefits as soon as companies begin earning income, and are more
valuable than tax incentive (Bora, 2002, p.280). Tax holidays can further be
counterproductive if they contribute to attracting more investors of the "wrong kind",
which is certainly the case in countries where basic fundamentals are not yet in place.
Even still, a firm at infantry level benefits less from tax holidays and a lengthy exemption
is costly to the host country. However, they primarily benefit short-term investments,

16
which are often taken in so-called footloose industries. Further drawback is that, the cost
of administering incentive regimes result in delays and uncertainty for investors. They
have been also significant sources of corruption, screening out desirable investments, and
detrimental to the process of developing competitive market and sound policy making. 4
Despite the negative situation, many poor African countries rely on tax holiday and
import exemptions, while industrial countries allow investment allowances or accelerated
depreciation. An incentive is correctly targeted if it is invested in capital because it
encourages companies to take long-term planning.
2.2.4 Investment Promotion Agencies and Export Promotion
Zones (EPZs):
Investment Promotion Agencies (IPAs) are more effective in a country with a good
investment climate than only in a poor one, and is the obvious solution for SSA (OECD,
2005, p.6-7). Thus, IPAs role should be in image building under regional promotion since
many prospective investors think regionally. Image building yields result in attracting
FDI, but it is still less in policy advocacy and it is good for countries with good
investment climate, hence, countries with poor investment should not spend too many
resources on IPAs. In addition, Morriset (2003, p.14 quoted in OECD, 2005, p.5) finds
that small agencies are not really effective in attracting FDI, and IPAs which spent more
money on policies were more successful in attracting investors, possibly because of the
role of such advocacy that leads to improvements on investment climate.
____________________________ 4The impact of tax policy may significantly depend on the tax instruments used by the host country. The effectiveness of tax policy and incentives is likely to vary depending on the MNC activities and on its motivation to invest abroad (Bora, 2002, p. 273 – 285)

17
However, one-stop shop becomes more of a one stop, adding a red tape to investors.
Decision-making is in a single authority within single organization and even line ministry
resists ceding their regulatory to another agency.
Most economies have Export Promotion Zones (EPZs) supplied with improved
infrastructure and special incentive packages (Sied, 2002, p.41), however (Hill, 1990,
p.35-36 quoted in Bora, 2002, p.184) pointed out that EPZs though, have marginal impact
on development and sometimes may not sometimes develop linkages within the economy
especially to the new entrants. Foreign exporters have historically found it more
profitable to establish production facilities within the tariff wall than to serve the market
from an overseas location. For examples, the tax concessions to promote upgrading in
R&D in Singapore and Ireland were based on performance requirements of export
promotion, linkages and training schemes. OECD (2005, p.11-12) added that Ireland and
Singapore had successful stories based on three lessons for other economies: a) programs
of linkages are expensive; b) Irish Development Authority had strong powers within the
government to shape and implement policy; c) both countries had large pool of skills and
small investors necessary for linkages development. Hence, host economies seeking FDI
need to develop the local capability needed for exploiting the opportunities brought in by
FDI or else remain in enclaves of export promotion zones that have limited impact.
2.2.6 Performance requirements:
Developing countries have FDI restrictive policy of performance requirements
(UNCTAD, 2003a, p.63), normally done by IPAs (Seid, 2002, p.38), such as purchases of
local capital goods, raw materials, intermediate goods and services, recruitment,

18
employment and training practices, the proportion of output exported, trade balancing,
technological transfer, information provided on intra-firm pricing practices, and types of
production methods utilized. Host economies mainly use them to promote and protect
local industries; provide information on intra-firm practices and prevent pricing abuses
and tax evasion; foster transfer of technology; and also a means of serving national goals.
But, such practices protect inefficient local firms and also exclude investors.
However, the right to regulate (UNCTAD, 2003d, p.216) FDI activities should be
recognized in the interest of host/home countries, traders and investors and be
compatible, though, it has been not as easy as it sounds. Among the measures that will
certainly hurt, not only investors but also long-term interests of host countries are
negative post-investment changes such as expropriation; and insufficient notice when a
new regulation is implemented. Morisset and Neso (2002) examined administrative
barriers to FDI in 32 developing countries. They demonstrated that the quality of
investment climate plays a significant role in the location decision of many investors. The
ultimate case would be where a country has abolished all controls and relies on market
forces and competition to shape investment and prevent abuses (Stoever, 2002, p.50), but
the scenario is neither possible nor desirable.
It is important to note that, performance requirements differ among countries depending
on their level of development, endowments of natural and other resources, market size,
development strategy, among other factors. Hence, the right to regulate in the current
context involves (1) promoting domestic development priorities and linkages; and (2)
protecting the public welfare from possible negative impacts. 5 Even many countries

19
which traditionally maintained an open policy towards FDI now impose restrictions on
flows and activities of FDI, due to the rapid changes in FDI whereby those who used to
be traditional exporters of FDI are increasingly becoming major importers of capital
(Seid, 2002, p.34). This has become a threat to infant industry development and would
reduce host economies to deepen their capacity to produce.
TNCs may want to invest in spite of performance requirements and other restrictions
(UNCTAD, 2003a, p.71). For example, China and India have managed to attract a huge
volume of FDI inflows despite stringent performance requirements enforced with respect
to exports, ownership and local contents. This shows that high levels of economic
freedom are not clearly correlated with high level of FDI. China is the leading destination
of FDI, but ranks (112 out of 155) in the Index of Economic Freedom (World Bank,
2004). Similarly, the benefits accruing to the host country may greatly outweigh the
adverse effects.
2.2.7 Decentralization:
Most countries have centralized process of dealing with investment process (Robinson,
1987, p.26–29). In a decentralized process, technical skills of departments are brought in
for negotiations like for tax expert and finance, laws and labour issues. Agencies monitor
their terms of agreements and administrators learn from the past. However, there is no
evaluation of projects’ benefits to the economy and individual ministries may give little
attention to policy issues and also costly to investors.
_________________________ 5UNCTAD (2003a, p.216) Trade and liberalization can only be achieved in the context of appropriate and effective domestic regulatory environments

20
In a centralized system like IPAs, negotiations are quick and there is high prediction of
outcomes and further, consider the generally impact in the economy. The problem is that,
there is separate negotiation and implementation that remain at the ministry level.
However, corruption arises when passive regulations exist and government officials have
discretion in applying them. It becomes worst when regulations lack simplicity and
transparency. Corruption, combined with administrative weakness, can both undermine
policy reform and repel FDI as Asiedu (2004, p.46) suggests. Too much regulations lead
to delays and add costs to firms. 6
The level of corruption or lack of good governance is
expected to influence the administrative costs. Even the degree of political freedom,
openness, and existing legal framework affects the capacity of bureaucrats or incumbent
enterprises to exploit rents from administrative procedures.
In terms of negative influence; ranked orderly, extortion and bribery deter FDI most and
others are high administrative cost of doing business and access to capital (UNCTAD,
1999. p.50–52). Corruption and poor governance appear to have more significant
deterrent to FDI in Africa than elsewhere (Wei and Balasurbramanyam, 2004, p. 178).
Therefore, combined with inhibiting factors, corruption makes African countries lag
behind other developing countries in terms of attracting FDI.
________________________ 6In countries, some of the operational procedures can also be needed at the entry, such as import and foreign exchange licensing. However, because of trade and financial liberalization efforts, those are less and less frequent (UNCTAD, 2003a, p. 189-192, 211, 213, and 216).

21
In short, most host governments have liberalized and privatized their economies, created
investment promotion agencies and export promotion zones to attract FDI. In addition,
host economies further provided fiscal incentives to make their locations attractive.
However, the determinants and motivations for FDI to invest in host economies depend
on host characteristics like natural resource availability, market size and growth rates,
not only on policy improvements. These are dilemmas to host economies on policies they
would have to implement so as to attract FDI without waste.
2.3 Basic Characteristics of Foreign Direct Investment
Enterprises in Host Economies:
2.3.1 Introduction:
This part gives the different forms of FDI inflows in host economies, the sectoral
orientation in host economies, and entry through greenfield, M&As and joint ventures.
2.3.2 Forms of FDI inflows:
FDI inflows include equity capital, reinvested earnings and intra–company loans
(UNCTAD, 1995, 1996, 1997, & Moosa, 2002, p.2). The equity capital is the foreign
investors’ purchases of share in an enterprise in a foreign country; reinvested earnings are
injected funds on new projects in the host country; and intra-company loans include short
or long term lending between the parent and its affiliates.7
_______________________ 5Indeed, FDI in the host country can be import substituting (production of goods previously imported), export increasing FDI (seeking increase export of raw material and intermediary goods), Government initiated FDI (offer incentives to investors to eliminate B.O.T deficit), trade oriented (generating excess demand for imports and excess exports at the origin term of trade), expansionary FDI exploits firm specific competitive advantage in the host economy (sale growth both at home and abroad). Defensive FDI seeks labor in the host country with the aim of reducing cost of production (Moosa, 2002, p.2).
22
Indeed, different countries often have diverse conventions as to what constitutes the
ownership of the company from both the management and assets point of view (Wood,
200, p.16). For instance, can be 10% or 20 % depending on host measurements of FDI.
FDI intention therefore, relies on having a management voice in enterprises either in
parent or subsidiary enterprises and such intentions is always demonstrated by taking the
majority of the equity share of more than 10 per cent.
2.3.2 Sectoral orientation of FDI:
FDI has now moved mainly to services and technology from primary sector (UNCTAD,
1993, p.61–62) demonstrating the structural changes in economic activities and FDI itself
as a conduit for economic integration. The most attractive industries for FDI were
telecommunications, food and beverages, tourism, mining and quarrying, textiles and
leather (UNCTAD, 1999, p.50). FDI in services is increasing particularly in
telecommunications, electricity and management and trade (UNCTAD, 2004, p.45) due
to the growing importance of services through privatization that has problems without
regulations. This suggests that many African countries receive FDI in non–minerals.
2.3.3 Entry Modes of Foreign Direct Investment:
Entry mode choices of FDI enterprises occur through full equity control of greenfield
(new investment), M&As, and Joint Venture (either greenfield or acquisition) (Bora,
2002, p.10, UNCTAD, 2006, p.110). However, FDI modes of entry between acquisitions
and greenfield are affected by the production and transportation costs, government
policies in the host countries with respect to trade barriers (like import substitution); the
marketing factors to destined markets; and oligopolistic reactions that one firm induces

23
the others to follow suit (Moosa, 2002, p.58). M&As as modes of entry in services lead
over greenfields (UNCTAD, 2005, p.111-113) with $716billion in 2005.
a) Greenfield:
Greenfield refers to the investment in projects that entail new production facilities such
as offices, buildings, plants and factories and movement of intangible capital (UNCTAD,
2006, p.15) and always adds to the production capacity of the host–country through
capital formation and employment, and valued added (Moosa, 2002, p.13). Therefore,
greenfield is suitable for developing economies because it can be directed to specific
sectoral priorities, even in promoting linkages among others.
b) Cross – border Mergers and Acquisitions (Mass):
Cross – border M&As involve a partial or full take over or merging of capital, assets and
liabilities of existing enterprises in a country by TNCs from other countries (UNCTAD,
2006, p.16). Collective investment between private equity firms and the various financial
institutions, involving mutual funds and hedge funds, has become a growing source of
FDI through M&As, and are the popular mode of investment for firms wishing to protect,
consolidate and advance their global competitive positions, by selling off divisions some
parts of divisions that fall outside their scope of core competencies and acquiring
strategic assets that enhance competitiveness (UNCTAD, 1996, p.7-15). They were
rampant in the 1980s through sales and purchases of public enterprises that were loosing
their comparative advantages. The motivations for M&As (UNCTAD, 1999, p. 101;
2000, p. 144 – 149) are due to the privatization of state owned enterprises; globalization;
and economies of scale, as well as, Regional Trade Blocks (Dunning (1998, p.41) to

24
protect positions and market shares which previously come from exports. M&As are
influenced by the speed and access to proprietary assets (UNCTAD, 2000, p.140) and can
be fundamentally classified (UNCTAD, 2000, p.101) into: (a) horizontal – between firms
in the same industry; (b) vertical involving client – supplier of buyer – seller relationships
usually for reducing uncertainty and transaction costs, linkages and economies of scale;
(c) conglomeration – usually between companies in unrelated activities to diversify risks
and economies of scale.
M&As may yield significant economic benefits (Bora, 2002, p.10, UNCTAD, 2006,
p.17) when investors make a long-term commitment to economic restructuring of firms -
acquired, investors are likely to inherit local linkages that may have been established over
a considerable period of time (Enderwick, 2005, p.98), rescuing ailing companies in the
developing countries (UNCTAD, 2006, p. 17). Investors gaining access to markets
(Mossa, 2002, p.13) but host countries prefer to retain local control on domestic markets.
However, M&As can be dubious to development value (Bora, 2002, p.10) if they lead to
changes in ownerships without changing or adding productive capacity, facilitating
transfer pricing, rationalization, and also being practiced on the basis of anti competition
in the host economy.
In fact, the recent trends towards M&As reflect the strategic choice by TNCs and hosts’
privatization programs across the continents during the 1990s. However, these are rather
sellers, than buyers due to changes in national policies.

25
c) Joint Ventures:
Joint Venture (home country and other companies) provides technical knowledge and
ability to raise finance and utilization of the other local knowledge of bureaucracy,
regulations and the laws (Moosa, 2002, p.13). Joint venture has emerged as an alternative
entry mode due to possession of complementary assets; opportunities for collusions; and
barriers to full integration as well as a means of alleviating risks, especially the risks of
take over (Moosa, 2002, p.58). Joint ventures can be useful to foreign investors due to
diversification of risks, providing local partners to mediate with the governments, large
pool of resources and technology and local entrepreneurial class will emerge through the
acquisition of managerial and business skills (Seid, 2002, p.36). The basic motivations
favoring joint ventures alternatively take the form of vertical, horizontal and
diversification based joint venture (Robison, 1987, p.80 – 81). These can be an
alternative strategy for developing countries seeking investment in infrastructure. It
accommodates local development initiatives by governments such as energy
development.
d) Implications:
The implications of the modes entry on development depend on the context in the host
country, M&As and greenfield are rarely perfect substitute for each other (UNCTAD
(2002, p.160). Therefore their degree of success depends on a number of host variables
such as the level of economic development (high level of development favors M&A
while developing countries are more likely to use greenfield); FDI policy of using
greenfield; institutional factors of corporate governance and ownership; and financial
crisis in the host country. Thus every mode of entry has mixed economic effects and TNC
26
characteristics and orientation relate to their impacts. Most developing countries prefer
greenfields FDI over M&As (UNCTAD, 1999, p.102–103) because greenfield adds on
capital investment, a pre–requisite for development, offers technology which local
investors do not have, introduce innovation management and linkages with the local
investors. However, M&As success depends on conditions under which they were
created such as solving financial constraints of performing assets. The underlying
argument for developing countries is that M&A is less beneficial than greenfield
investments unless rescuing the ailing industries. FDI and employment creation
(UNCTAD, 1994, p.166) depends on the types of initial investment (mode of entry) such
as greenfield or M&As. Employment prospect can improve at a later stage as firms adapt
to new competition and introduce new products.
In other words, FDI into host economies take the forms of greenfield, M&As and joint
ventures. However, the recent entry modes favored M&As and mostly in services such as
telecom and financial sector which are essential but the most important because
developing countries could benefit more from FDI in terms of spillovers.
2.4 Benefits of Foreign Direct Investment via Spillovers
in Host Economies:
2.4.1 Introduction:
This subsection emphasizes the benefits of FDI in Host Economies through spillovers
rather than helping the host economy with low saving capacity and weak financial
intermediation. These include the role of FDI in reducing poverty, creating employment,

27
promoting technological transfers, and promoting production linkages. In addition, costs
of FDI are also discussed which occurred during the process of attracting FDI.
Evidence from the FDI related literature (Klein et al, 2001; OECD, 2002; Bende-
Nabende, 2002; Bora, 2002; Asiedu, 2004; Kehal, 2004) demonstrates FDI role in
economic development of host countries; mainly in terms of human development,
technological transfers and capital formation, international trade, and competition and
enterprise development. Effects of FDI in the host country are classified into economic,
political and social effects (Moosa, 2002, p. 69-73) while Enderwick (2005, p.102)
further categorizes the impact of FDI into primary effects by looking at aggregate
benefits and costs that accrue to an economy and secondary impacts that related to the
spillovers from foreign affiliates to local firms. These inflows of FDI into host economies
have implications for economies seeking growth and development (Enderwick, 2005,
p.94), including careful investment in assets and infrastructure, coordinated integration of
policies, and the avoidance of expensive incentive to attract FDI. These can only be
viable to host economies when they design policy that increases the absorptive capacity.
According to OECD (2003, p.14) and Bende-Nabende (2002, p.124), the benefits of FDI
are of two types: (1) saving countries of low domestic savings and weak financial
intermediation, and (2) is spillovers. Spillovers therefore occur in five ways: transfers of
technology, enterprise development and restructuring, integration, bolstering competition
and supporting human capital formation. In this case, FDI policies need to discriminate
between sectors or take certain wastes.

28
2.4.2 FDI role in Reducing Poverty:
While FDI may support development in an aggregate term, more attention should be
focused on the distribution of gains from FDI. This is due to the fact that there is no
direct link between FDI and poverty reduction (Klein et al, 2001. p.2-5; Sida, 2004), but
there are some possible indirect links: (1) if FDI contributes to export growth,
productivity and finances balance of payments; (2) if FDI increases employment it may
move other people out of poverty; (3) foreign firms pay higher wages than local firms for
workers of similar qualifications. Therefore, the evidence that FDI contributes to
economic development is encouraging rather than compelling, because growth itself does
not guarantee poverty reduction because of inequality in redistribution of resources. Te
Velde (2001, p.6-7) added that FDI contributes in raising the tax base in the host
countries, where increased domestic revenue may be used to build infrastructure and can
also be spent on health, education and training. FDI remains one of the most effective
tools in the fight against poverty because net debt flows have become less important
(Klein et al, 2001, p.1-3).
But developing host economies rarely spend money in productive activities that would
greatly reduce poverty instead security sector dominates public expenditures and ranks
high in term of importance. More so, FDI can only benefit host economies if there are
best practices of encouraging linkages since most people might not have the expert they
need in the employment area. This can reduce income poverty.
29
2.4.3 FDI and Employment:
FDI has not had significant impact on employment, skill formation and growth in Africa
as it has had in other areas such as East Asian countries with the exception of Botswana
and Mauritius (Klein et al, 2004, p.9). Still in labor markets, TNCs have often been
accused of “exploiting” labor in developing countries. However, it is generally accepted
that FDI does not permanently change the level of unemployment, but can have a short
run effect and result in permanent changes in real wages (Caves 1996, quoted in Bora,
2002, p.235). However, (Sida, 2004) noted that a great deal in manufacturing is likely to
result in employment of highly skilled labor and thereby only indirect benefit to the poor.
In short, developing host economies need to improve on their skills and general education
so as to gain from TNCs presence in their economies.
2.4.4 FDI and Technology:
The level of technological competence affects firms’ market share by producing product
quality. Technology promotes economic development by increasing factor productivity,
changing exports in favor of research intensive product with higher growth potential.
However, importing and mastering technologies in developing countries is not as simple
due to extensive coordination problems, externalities, missing markets and cumulative
effects. In developing countries, technology transfers occur through TNC affiliates, joint
ventures, franchising capital good sales, licensing, technical assistance, sub-contracting
or original equipment manufacturer (Nabende-Bende, 2002, p.143). However, benefits
from technology transfers by TNCs should not be taken for granted unless: they
economize on the local scarce resources, directly or indirectly contributing to economic
growth; have impact not only on GDP, but also on the livelihood and employment
30
possibilities for the people; integrating the host government development planning
process and strategies, and do not create ‘technological enclaves’ or regional imbalances'
(quoted from Manson, 1994; in Bende-Nabende 2002, p.144).
A local firm may improve on its productivity by copying technology used by TNC
affiliates operating in the local market. TNCs may also facilitate the transfer and
diffusion of technology by signaling to local firms that certain products exist, that there is
a market for them and how to produce them through the so-called ‘demonstration effect’.
The entry of TNCs may lead to technology spillovers through competition that TNCs
may force local firms to search for and implement more efficient technology. TNCs may
need to undertake research and development to adapt parent company technologies for
products to suit the local market and be more readily adaptable to local conditions (Wong
1995 quoted in Bora, 2002, p.237). The importance of technology in developing countries
have made OECD (Moosa, 2002, p.93) to issue guidelines urging TNCs to ensure that
their activities are compatible with the technology plans of the host countries; adopt
practices that allow the transfer and rapid diffusion of technology; address local market
needs in an exercise pertaining technology; license technology on reasonable terms and
conditions; and to develop ties with local university and research.
In sum, the role of governments is to arbitrate technology transfers by developing and
promoting domestic capabilities. This ca de done by having good educational base,
strengthen technological institutions, encourage firms in export sector to employ new
technology that advances their competitiveness.
31
2.4.5 Production Linkages:
Production linkages are direct backward and forward linkages subsumed in economic
development. FDI facilitates linkages between foreign affiliates and local firms, eases
access to larger markets and resilience to shocks (UNCATAD, 1995, p.127). The impact
of inward FDI adds capital stock that increase productivity and induces series of
multiplier effects leading to expansion of indigenous firms (UNCTAD, 1995, p. 202 -
209). Linkages can be done with local suppliers, marketing intermediation and
franchising and licensing. FDI influences growth by raising factor productivity in the
host country mainly through: (1) linkages between FDI and trade flows and (2) spillovers
and other externalities (OECD, 2002, p.8). Developing countries always have poor
technology for the development of linkages. However, they can allow linkages to develop
naturally (OECD, 2005, p.11). Hence backward linkages lead to spillovers while forward
linkages are also seemed important for increasing necessary competition (UNCTAD,
2006b, p. 178). However, the benefits are accepted but the magnitude is less provable
because of weak policies that hold back the benefits.
2.4.6 Costs of Foreign Direct Investment:
The effect of FDI can crowd-out or crowd-in investment by domestic firms (Bende-
Nabende, 2002, p.150-153 &UNCTAD, 1999, p.212-214). Crowd-out may result from
increase in the host country’s interest rates when foreign firms borrow locally under
conditions of scarcity and the use of superior assets thus justifying the need for protection
of infant industry in developing economies. But, crowd-out on inefficient domestic firms
may be desirable in the host country since FDI introduces dynamic competition and
flexibility. However, crowding-in takes place when investment by foreign affiliates

32
stimulates new investment in the downstream or upstream production by other foreign or
domestic producers or increases efficiency of financial intermediaries.
The analysis of economic and non economic costs of FDI have been discussed in the
literature (Caves, 1996; Casey, 2003; Petras, 2005). FDI can substitute good jobs with
bad ones; reduces real wages; facilitates high import propensity; causes deterioration in
the host country’s trade balance; transfers technology back home, compromising the host
technology secrets; “crowding out” local capital and public initiative, and even local
borrowing as well as creating 'boom and bust' in the economy; manipulates prices
through intra-corporate transactions; erodes tax bases of other countries, and distorts
trade and investment patterns and undermines the fairness, neutrality and broad social
acceptance of tax system generally. Also, differences in environmental standards between
countries may influence TNCs to invest in “dirty” industries in countries with low
environmental standards exacerbating environmental degradation that may be already
occurring (Bora, 2002, p.236). This suggests that the environmental policies among
different countries are cost factors that can influence the location of TNC investments in
dirty industries. Moosa (2002, p.73-77) acknowledged that TNCs can lower growth in
developing country if; profits are repatriated rather than reinvested; and investment in
manufacturing is detrimental to developing country's balance of payments because of
high import contents as well as the mechanism of transfer pricing of TNCs. However,
host policies are needed to minimize such practices.
33
In short, host developing economies can benefit well from FDI only if they have
developed the absorptive capacity through training; linkages are needed in attracting
specific kinds of projects. In addition, linkages need favorable conditions in the host
country. These should be resulting from government policy especially in local contents of
significance projects to host economies.
2.5 Policy Options for Managing Foreign Direct Investment
Desirability in Host Economies:
2.5.1: Introduction:
This subsection examines policy options which host economies can use to make FDI
work for the economy’s development objectives. These include privatization and
liberalization, promoting FDI role in infrastructural services, different policy
interventions, regional integration, fiscal incentives, and the role of investment promotion
agencies. Also, examples are drawn from the “emerging giants” and the South East Asian
countries that have successfully managed to benefit from FDI.
2.5.2 Further liberalization and privatization:
The future of FDI policy depends on further liberalization of trade and investment
policies. The state’s role will be based on attracting the Headquarters of FDI (UNCTAD
(1993, p.29&33). Especially in Africa that needs further diversification of the production
structure towards manufacturing and services; ability to enlarge markets and foster high
growth rates; improving on infrastructure including improvements from ODA; and ability
of South Africa to become an investment pole for SSA. These policy factors include
adopting macroeconomic reforms, including alleviating debt burdens, further

34
liberalization of FDI and related regimes, including those in primary and secondary
sectors, introduction and expansion of privatization programs.
However, while pursuing the above, the “dos” in host economies (UNCTAD, 2003a,
p.141) include a non-discriminatory, stable and predictable trade and investment
environment; and a good competition policy. The “don’ts” include avoiding certain
elements in policy approaches such as “subsidy race” being typically both discriminatory
and expensive, lowering of domestic standards to attract investors is a bad solution for
all, and host country rules or regulations that may be risky make investment less effective
are also poor solutions. This is because even if the importance market size may have
become less important as a determinant of FDI location, it remains a key factor.
Therefore, policy implications for investment liberalization include: (1) liberalization of
entry and operation to increase competition; (2) limiting market power inducements; (3)
minimizing anti -competition cartels.
In other words, host economies need stable and predictable policy and macroeconomic
environment. Further liberalization and liberalization should be based on factors
determining FDI attraction in a particularly host economy and the investment
opportunities. This can be in sector where governments have been able to exploit but are
of strategic to the host’s development goals.

35
2.5.3 Foreign Direct Investment Role in Host
Infrastructure:
The role of FDI in infrastructure in developing countries can be channeled through
greenfield. For instance, governments of Vietnam, China and Malaysia used build operate
– transfer scheme (UNCATAD, 1996, p.22). This solves the infrastructure problems in
developing countries. Host economies with a minimum necessary telecommunicating
infrastructure can now leapfrog stages of development by adopting the new technologies
like cellular telephones (Nabende-Bende, 2002, p.143). Host policies related to services
should be used to promote universal access to telecommunications, through targeted
incentives (UNCTAD, 2004, p.201). For landlocked developing countries, UNCTAD
(2003b, p.7-8) pointed out the importance of attracting FDI that is not sensitive to
distances. However, most developing host economies put restrictions on FDI in some
infrastructure services. This is intended to safeguard the welfare of citizens; national
security and price ceiling sometimes make such opportunities not being attractive.
2.5.4 Different Intervention Approaches:
UNCTD (2006b) defines four different intervention approaches: (1) passive open door
policy involving limited policy interventions or no industrial policy; (2) open door policy
involving selective interventions to improve on supply conditions; (3) strategic targeting
of FDI; and (4) restrictive policy. However, Alternburg (2000, cited in UNCTAD, 2006b,
p.8) argues that approaches 1&4 are not sufficient to exploit the opportunities from FDI.
The optimum for many low-income countries will be near the second approach and only
if local capabilities are developed. However, such assertions are disapproved by China,

36
which employed restrictive policy while Singapore and Malaysia targeted specific types
of FDI to deepened linkages in manufacturing rather than only employing open door
policy.
However, UNCTAD (2006b) called the first policy intervention as minimalist approach
which focuses on the basic investment foundations and the second policy as an
encouragement approach focusing slightly on a more of interventionism to solve market
failures. The third is called, selective policies for specific firms or activities of strategic
importance. Lastly, is the restrictive approach, which is a hard policy like market
reservation for certain companies and mandatory local contents. Furthermore, domestic
content is extremely useful to developing countries but question is how governments can
apply is still an interesting point for the discussion. If domestic content is done for
strengthening linkages, then government also needs to the market failure of imperfect
information of the potential suppliers or cheap location (UNCTAD, 2001, p.164). In
short, domestic firms and foreign affiliates should be brought together in the promotion
of specific linkage programs. In fact, there is no single best-practiced strategy within
which policies are framed, but depends partly on pre-conditions in host economies. The
message is simple. FDI policies should be in line with development strategy being
pursued in host economies.
2.5.5 Regional Integration:
Regional integration brings light to the market size (Sida, 2004). It can attract FDI due to
the greater financial stability, better policy coordination, improved infrastructure and a
37
more favorable investment climate that usually accomplished it. Hence, governments’
role is to demonstrate “political will” so as to coordinate regional policies in some areas
and give up certain options for the benefit of regional integration (Bende–Nabende, 2002,
p.187). In fact, regional integration has become a global phenomenon that any country
joining benefit from the alternative it offers rather than relying only on tax incentives.
Hence, regional integration is a catalyst for both industrialization and economic growth.
2.5.6 Giving Fiscal Incentives:
The policy challenge for developing host economies is to attract FDI without financial
incentives, but through competition of providing fiscal incentives usually referred to as
the “dowry chasing” (Robinson, 1987, p.79), the “race to zero” (UNCTAD, 1999, p.290).
Other commentators see fiscal incentives to attract FDI be intended only for correcting
the market failures (UNCTAD, 1995, p.290). Fiscal incentive schemes for TNCs appear
to increase, both in terms of conditions attached to them and the variety of options they
provide. The activities of FDI favored by fiscal incentives include: (1) priority industries;
(2) regional development; (3) exporting; (4) innovation, research and development. For
example, Malaysia used targeted incentive (UNCTAD, 2002, p.206); and setting EPZs
provided with infrastructure, and removing the red tape confines within a limited areas.
But there is one element missing, interests of governments and TNCs are quite different.
Governments provide fiscal incentives to development while TNCs use fiscal incentives
to improve on their competitiveness since costs will be automatically reduced. Hence
targeted incentives minimize the negative consequences of these different interests.
38
2.5.7 The role of Investment Promotion Agencies:
Majority of host economies have moved away from the first generation policy (opening
up an economy to FDI) and second generation (government marketing the locations) to
third generation policy that involves targeting investors (UNCTAD, 2002, p.221). Third
generation policy helps in attracting FDI to host development objectives, makes it
possible to attract export oriented FDI rather resource–seeking FDI and it is cost
effectiveness compared to IPAs which attract many FDI of low quality. The targeting
policy can still be directed to specific industries, activities and companies. Therefore, the
need for an integrated approach to attract FDI in Africa involves improving on the
national and international investment frame works, supporting national investment
promotion efforts, promoting information dissemination and public–private dialogue and
facilitating linkages (UNCTAD, 2003, 37&85). In a different perspective, most IPAs in
Africa generally do investing marketing rather than targeted specific types of FDI that
would change the economic structure, especially in countries with limited natural
resources and small market size. This is because FDI in Africa in mainly attracted in
countries with natural resources and oil deposits and hence the alternative for those
without is only limited to the general marketing and improving on policy environments.
2.5.8 International Experience:
China benefited from FDI because of the rapid expansion of domestic market, gradual
opening of the domestic market to FDI and improve relations with North Korea and
Taiwan (UNCTAD, 1994, p.68 and Kehal, 2004, p.79). FDI policies had been designed
to attract investors to act in the way that enhances the development impact by building
local capacity using local suppliers and also upgrading local skills, technological

39
capabilities and infrastructure through mandatory requirements. Therefore, the vision of
host economies can be drawn from past experiences and should be pursued as a broader
policy to raise productivity.
Hong Kong used passive-open door policy to TNCs and the government did not intervene
to promote industrial development (UNCTAD, 1994, p.72) While Thailand and Malaysia
pursued active industrial policies and promoted local enterprises in certain activities, but
also adopted effectively open door, non interventionist policies in some export oriented
industries. Singapore sought heavy TNCs participation in manufacturing, but intervened
selectively to guide investors in technological activity thought to be desirable for
industrial upgrading through Export Promotion Zones to reduce the transaction costs of
investment (Te Velde, 2001, p.42-47). Republic of Korea and Taiwan maximized
reliance on FDI in the form of technological transfers in the context of comprehensive set
of industrial policies to deepen the manufacturing sector, promoting linkages and increase
local capabilities. Ireland focused on attracting quality FDI rather than upgrading existing
FDI and later emphasized linkages (Te Velde, 2001, p.42-47). While, example Malaysia
and India have educational policy to shape absorptive capacity and SMEs linkages,
appropriate local incentives for local sourcing and give research institutions incentives
for their findings (OECD, 2005, p.11-12 & UNCTAD, 2006b, p.10-13).
Hence, there are five broad categories of lessons which developing host economies can
internalize from managing FDI in East Asia (Indonesia, Malaysia, Thailand and
Philippine) (UNCTAD, 2005, p.57): (a) crowding in requires a proactive macroeconomic

40
environment; (b) liberalization should proceed from a point of strength and be done
strategically; (c) industrial policies matter; (d) strong and capable states are needed to
bargain effectively with the large firms; (e) think regionally. This implies that any policy
to be applied should be subjected to social and cost benefit analysis. Interestingly, the
above experience shows that host economies can benefit from FDI, if it is seen to
supplement home efforts. Hence host success on FDI policy depends on how particular
circumstances and priorities are integrated in host development objectives.
Hence, policy options to managing FDI benefits in host economies are numerous. Further
privatization and liberation in host economies need to directed to areas which diversified
the economic structures, which can shifting from agricultural production to the promotion
on manufacturing and even liberalizing infrastructural services to foreign investors.
More developing host economies need to use targeted policy of attracting FDI instead of
relying only on the minimalist and interventionist policies. This has been proved by the
strategy adopted by the South East Asian Countries.
2.5.9 Summary of the discourse in the literature:
Most of the literature reviewed confirms that the general directions for consensus on
policy positions of most host economies are receptive to FDI. Developing Host
Economies have adopted liberalization, privatized and continued to improve on the
investment climate and others are searching for regional groupings. In addition, host
economies are actively seeking a better understanding on the various elements of FDI
including its determinants, impacts and policy implications. The relative significance of
factors determining the host economy’s propensity to attract foreign direct investment

41
continues to be highly contextual and depends upon the specific types of FDI, motives
and host policies related to FDI. However, lots of uncertainties have been generated in
the literature in developing host economies on the importance of FDI. The literature on
FDI (Te Velde, 2001, Seid, 2002, Bende-Nadende, Kehal, 2004 and among others) has
been concerned with the experience of advanced countries and economies in transitions,
the “emerging giants” (china and India), and in addition to the experience of the East and
South East Asian economies. Findings from these countries can not be applied
simultaneously in all developing host economies, especially in Uganda which has got
different socio-economic and political settings, a newly small emerging market-oriented
economy that seeks to attract FDI. The available literature on FDI in SSA is scanty and
not systematic enough in formulating a turn around strategy needed for Uganda to reap
the potential benefits of FDI. Literature in Uganda (UNCTAD 2000a, Obwona, 2001,
UNIDO, 2002, UN, 2004, Obwona and Egesa 2004) points out the important economic
reforms conducted in the 1990s to attract foreign investors, general impacts of FDI and
constraints in the economy. However, this literature concentrates mostly on the
“Washington Consensus” that takes concern only at the macro policy. This study relates
how the macro reforms have benefited Ugandans through FDI spillovers, and suggests
policy options to be addressed. More so, some of the literature has been written for
business organizations and portrays little evidence necessary for strategizing policy issues
so as to answer questions regarding the achievement of quality and effectiveness in
growth by using FDI as an alternative development paradigm to meet the national
objectives. Moreover, the methodology used in some of the literature on FDI in Uganda
was based more on surveys. However, this study analyzes documents so as to introject

42
out the best practiced issues emerging from investing enterprises in Uganda. Therefore,
this study first analyzed to what extent Government of Uganda supports FDI, by looking
at the macroeconomic and incentives for FDI and how institutional weaknesses
undermine government’s efforts. Secondly, this study looks at the basic characteristics of
FDI enterprises in Uganda. Thirdly, analyzes the benefits of FDI only in terms of
spillovers which have remained scarce in reviewed literature, and lastly, considers
strategic issues which Government of Uganda has to improve on, so as to maximize the
benefits from FDI.
43
CHAPTER THREE
MACROECONOMIC AND INSTITUTIONAL INCENTIVES FOR FOREIGN
DIRECT INVESTMENT IN UGANDA’S ECONOMY
3.1 Introduction
This section evaluates the Government of Uganda’s (GOU) efforts to attract Foreign
Direct Investment (FDI) into the economy since the 1990s. This study looks at the
importance of macroeconomic and institutional incentives in attracting FDI in Uganda,
and compares how institutional weaknesses undermine government’s efforts to use FDI
as an alternative development paradigm. The investment code of 1991 provides pro-
investment incentives and guarantees against state’s expropriation. A turn around strategy
was in 1997 and 2003 to provide generous incentives for capital investment.1
Uganda’s
economic growth appears to be stabilized at a lower rate of 4.7 per cent of GDP by 2003
compared to the period between 1994-2002. Agricultural sector contributes to (34%) of
GDP more than manufacturing (10% of GDP).2 Given the total population of 28.8 million
in 2005, 3
Uganda has been classified among the Heavily Indebted Poor Countries
(HIPCs) by the World Bank.4 Therefore, FDI is seen as a viable strategy by the current
regime to obtain growth without adding further indebtedness, and this has been seen in
the regime’s commitment in adopting macroeconomic stabilization. Hence, inward
inflows of FDI increased from US$ 1million in 1991 to US$ 256.4 in 2005 in Uganda
(IMF, 2006, and details are in appendix C).
______________________ 1UEPB (2004, p.9, 11& 12) 2AfDB/OECD (2004, p.325-327) 3World Development Indicators, April 2006. 4Country analysis briefs at great lakes region country analysis brief.htm
44
3.2 Macroeconomic policy reforms:
3.2.1 Fiscal policy
This study takes an analytical approach to fiscal incentives in attracting FDI in Uganda.
Tax holidays of 1991 were intended to attract foreign investors into the economy, and a
similar reform was initiated in 1997. 5
The new fiscal reform tends to favor new firms
more explicitly than under the gone tax holidays, in which losses may be carried forward
indefinitely and depreciation allowances are generally favourable. However, tax holidays
benefit long term committed investors, and Uganda’s inadequacy in resource
fundamentals such as natural resources, large market size and growth means attracting
mobile TNCs that tend to respond to market signals.
Fiscal incentives are among the groups of factors that have positively lured FDI into
Uganda’s economy, but are not the most important factors for attracting FDI. The Private
Sector Survey of 2003 in Uganda has pointed out that fiscal incentives influence
investment decisions by (51%), trailing behind other variables such as political stability
(72%), domestic market size (65%), regional market (55%) and telecommunication
(55%). 6 Hence, foreign investors in Uganda’s economy are attracted most due to political
stability and economic fundamentals such market size and market growth.
______________________ 5Ritva (1999, p.5&7):Tax systems in Uganda; Initial allowances of 50-70% for investment in machinery and plants in the initial year, the abolition of tax holidays, 20% of annual depreciation allowances to farms works instead of 4% under the previous arrangement. The company income tax is 30 % and firms are allowed to carry their operating losses indefinitely, except those granted tax holidays. The 1997 Income Tax Act stipulates the initial investment allowances and the annual depreciation allowances available to all taxable firms. It never granted initial allowances for industrial buildings and annual depreciation rate is much smaller to 5 % than that of machinery. 6UBOS (2004, p.67) report on interviews of 46 % foreign and 54% domestic firms
45
However, the role of fiscal incentives should not be undermined because Uganda is
comparatively poor in terms of natural resource endowments, and it has not yet
developed fully the basic microeconomic variables necessary to reap the full benefits of
fiscal incentives. For example, SAI and Xpressions flowers’ firms have relocated to
Ethiopia because it offers development funds, training and market research on top of
land, long term loans with low interest rates, support grants, 10 years’ tax holidays, basic
infrastructure and subsidized air freight charges to investors.7 At this point, critics have to
acknowledge that fiscal incentives are necessary evils in Uganda’s economy because they
reduce the cost of doing business.
As noted earlier in the literature that fiscal incentives can lead to delays and corruption,
findings from Uganda’s economy justify the above hypothesis. Foreign investors face
delays and additional costs while determining their eligibility for fiscal incentives from
UIA in order to avoid troubles with the Uganda Revenue Authority (URA). According to
The World Bank Group 2006 data base, the number of procedures needed for starting a
business remained at 17 since 2004, and number of days has been reduced from 36 in
2004 to 30 in 2006. These procedures and days are higher when compared to 6.2 and 16
in OECD respectively. Even the newly introduced VAT created more constraints on
investors by 49.9% and income tax (42.8%), corporate tax by 37.8%. 8 The issue is not
only about fiscal reform, but the conduct of business with regards to tax collection,
whereby investors are considered as customers. If tax incentives are poorly implemented,
management will be failing the already existing foreign investors.
______________________ 7The New Vision, Thursday 14th December, 2006 8The New Vision; Sunday, 21st May 2006: report on Private Capital Survey 2005.

46
Fiscal incentives are effective and necessary, but what matters is the behavioral culture of
the implementing authorities to exhibit acceptable behaviors. For Example, URA which
administers tax concessions was reported in the 1998 Survey as the least popular agency
in tax and custom administration, and is neither improving nor changing in some of its
tax administration because of the excessive bureaucracy, high tax rates, delays in
clearance of document and goods.9 With the recent power crisis in the economy, URA
only managed to be displaced to second position from lists of agencies which negatively
affect investment after UEDCL (22%) because of load shedding and URA (16%).10
Is it
because URA is given too much power? No, power is needed for the efficient tax
collection, but URA should be checked by the ombudsman that reports work abuses
without any compromise because delays and corruption undermine country’s policy
reform.
Similarly, Uganda pursues a relatively tight fiscal policy to promote private sector
development and avoids crowd out effects. The fiscal deficit was reduced from 4.5 per
cent of the GDP in the fiscal year 2001/02 to 3.3 per cent of the GDP in the fiscal year
2002/03, and tax revenue increased from 10.8 per cent of the GDP to 11.9 per cent of the
GDP respectively. 11
This has crowded-in private opportunities in the economy. In fact, as
a pro-Washington consensus, Uganda receives relatively an increased Official
Development Assistance (ODA) to the buy tradables.
_____________________________ 9Duanjie and Ritva (1999, p.12) 10 AfBD/OECD (2004, p.57) 11Basu & Srinivasan (2002, p.33)

47
Hence, stability is being registered at the macro level, which tends to take a long term
approach to redress inequality in development. Moreover, the reduction in the fiscal
expenditure has shown inadequate success in the social sector such as health and rural
infrastructure. Even the private sector which is feared not be overcrowded does not
adequately invest in these areas.
3.2.2 Monetary policy
The adoption of flexible exchange rate and the legalization of the black market in 1990
were intended to stabilize the value of Ushs. Also, current and capital accounts were
liberalized to facilitate free flows of capital. Bank of Uganda (BOU) was boosted to
formulate and implement monetary policy independently through “Bank of Uganda Act
of 1993”.12
Significantly, the annual inflation rate was caped below 5 percent.13
This led
to the reduction of inflation rate from 7.5 per cent in 1996 to 2.5 per cent in 2002, and
interest rate was reduced from 22% in 1996 to 17.5 % in 2002.14
However, Uganda is a price taker at the international market and is pruned to drought.
According to the Foreign Private Capital Survey 2005 report, foreign exchange was the
biggest hindrance with 56.4% because of its volatility, followed by corruption (55.4%),
interest rates (54.8) and power (39.8%). 13
Hence, foreign exchange is the most
constraining factor in the survey of 2005 with corruption taking the second position.
______________________ 12Abdalla and Egesa (2005, p. 10 &11) 13AfDB/OECD (2006, p.510) 14UN (2004, p.13) 15The New Vision; Sunday, 21st May 2006.

48
Monetary policy has a little successful story in attracting FDI into Uganda’s economy,
especially those dealing in financial services, capital assets and export oriented FDI
which makes their products very expensive and not competitive in foreign markets.
The initial success in controlling the exchange rate and inflation rate were due to
increased ODA which reinforced the capacity of Uganda’s economy to buy tradables.
High interest rates limit credit availability and growth to foreign investors which are
needed for the capital investment. More so, the inadequate collateral of private investors
make only big companies to access financial assistance, leaving out SMEs, even though
they are needed for the development of viable private sector led economy.
3.2.3 Trade policy
Uganda has removed bans on imports and eliminated export taxes. 16
Bank of Uganda
provides medium and long term financing to potential export oriented investors, and is
supported by external donors’ agencies. These include Apex Private Sector Loan
Schemes to SMEs, and Export Refinance Fund for working capital in non-traditional
crops.17
___________________________
16MoFPED (2000, p.2) 17Abdalla & Egesa (2005, p.12 &16) discuss numerous categories of exports and guarantee schemes; exports and imports were liberalized apart from agro-chemical and pharmaceutical that needed clearance from National Drug Authority. Manufacturers and exporters of goods and services have access to a duty draw back to enable them compete in foreign markets without
undue hardship arising from costs of imported inputs into the final export price (exporters drawback up to 100%). Exporters in manufacturing have a bound scheme that allow them seek custom licenses to hold and use imported raw materials intended for manufacturing for exports in secured places without payment of taxes.

49
While Uganda has registered success in liberalizing its trade policy, there are weaknesses
in institutional capacity with regards to effective implementation. There are 12
documents needed when exporting and it takes 42 days while importing needs 19
documents and it takes 67 days. 18
In addition, Uganda’s ranking in the 2006 Economic
Freedom Index was very low compared to other FDI competitors in Africa. Uganda (60th)
trailed behind some of the selected countries like Botswana (30th), and South Africa
(50th).
19 This reflects the limited degree of freedom in conducting business by the private
sector in the economy. Financial loans have been limited and benefited only big TNCs.
They find it easier easy to get financial loans compared to domestic investors while at the
same time incur high cost on transport, and delays in cross border trade when importing
inputs, which can even be produced locally by SMEs if funding was at least given
relatively to them.
3.2.4 Political stability and transparency in the institutions:
As a way to reduce political risks, the GOU have recognized the importance of
democratic governance as a prerequisite for political stability. 20
This policy has
positively affected inflows of FDI in the economy (political stability registered 72 % and
availability of local market (65%), regional market and improvement in telecom had 55%
respectively). 21
However, political factor alone is not a necessary condition for sustained
inflows of FDI. Economy has to improve on other non-political factors such as
infrastructural services which reduce the cost of utility.
______________________ 18The WB Group 2006: Economy Rankings - Doing Business - sub Saharan africa.htm 19The Heritage Foundation <Index of Economic Freedom 2006 – countries.htm 20AfDB/OECD (2004, p.335) 21UBOS (2004, p.67) based on the Private Sector Survey 2003

50
More so, the GOU has demonstrated commitment and political will by instituting the
Leadership Code. The objective is to limit the incidence of corruption and promote public
transparency, good conduct and leadership in public agencies. Uganda has got a good
program in creating awareness on best regulatory practices. 22
Unfortunately, there is little
or no value for money gained from this program. Creating awareness among foreign
investors has got negligible impact on improving the locational advantage, even though it
remains a viable option on enlightening foreign investors to resist illegal practices.
UNIDO’s survey of 2003 was replicated in 2005 and the result has shown that investment
perception has slightly worsened more than in the survey of 2003 in Uganda.23
Graft
seems to be unchanging in hindering the operation of business. Uganda was ranked 93rd
out of the 102 countries in the 2003 survey,24
and has featured to number 105 in the
global corruption index ranking of 2006.25
The Private Sector Survey of 2005 ranked
corruption as the second hindrance (55.4%) after foreign exchange volatility (56.4%).
The act of corruption has become a public good whereby investors have to pay
bureaucrats before accessing public utilities such as electricity, water, and
telecommunications among others which preceded actual implementation of projects.
This explains why Uganda has got low actual investment rates when compared to
planned investment rates because corruption frustrates implementation of TNCs’ projects.
______________________ 22Klein (2004) compared 12 African countries by making analysis of public statements, institutions and actions. He rated at a maximum of 24 points. Uganda leads with 20 points beating Kenya that was rated at Kenya 18 points and Ghana 11 points. Others were Tanzania 8 points, Mozambique 8 points, south Africa 6 points, Botswana 4 points, Lesotho and Malawi 3 points, Namibia, Swaziland and Zambia had 2 points. 23UNIDO (2006, p.124) 24World Bank (2004, p.41) 25Transparency International.htm -Berlin, 10th July 2006
51
To prove that this is not based on intuition, The World Bank Survey (2000) disapproves
the success of the Leadership Code, in which more than 80% of business firms reported
paying bribes during a typical business year and the amount of bribes does not correlates
with the favors offered in return:
Most firms reported paying more bribes than on necessities
such as security; 70 % on corporate tax, and 50% reported
larger payment on bribes than total investment. Not paying
bribes will continue to mean loss of business for smaller
companies and big companies can resist such practices. In
a similar study, Ugandan firms typically have to pay bribes
when dealing with public officials whose actions directly
affect firm’s business operations. How much? The more a
firm can, the more it has to pay.28
In analysis, Ugandan small firms are affected most by graft than large firms which have
got the power of neo-corporatism. This practice kills the economy because SMEs are
needed for the development of absorptive capacity that later transfer employment to
ordinary Ugandans, who can not easily be employed directly by the big TNCs because of
low skills. By bureaucrats directly affecting firms’ business operations, means deterrence
of ‘referred investors’ who respond positively to investment opportunities when tipped by
the already existing investors. More so, it can be argued that, it is not firms paying
bureaucrats, but ordinary Ugandans who are consumers bear the actual incidence because
corruption is included in the factor of production, and firms shift the cost to consumers
who bear the real burdens.
Svensson further found that corruption has two adverse consequences: 1) discourages
investment in sector S1 and shifts production to sector S2 and he called it “allocation
effect”; 2) firms will tend to pick a more reversible (but possibly less efficient) capital
stock, and he labeled it “technology effect.” 26
52
These shifts are market failures caused by egoistic bureaucrats who reduce competition,
which affects the welfare of citizens because prices become high as the supply of such
commodities becomes volatile to bribes. Even the adoption of less efficient technology is
a market failure in facilitating technological transfers which the government has ever
talked of through FDI
3.3 The return of Asian investors:
Amin’s government gave an ultimatum of 90 days to all Asians to leave Uganda. Yet
Asians were active in trade and agricultural-based industries like sugar production by the
early 1970s. Historically, Asians were Indians coolies who came to build the East African
Railway at the turn of the early 20th century, and they were about 25,000 to 70,000 strong
communities at the time of independence in 1962. Most of them had British citizenship
while a small number held Indian and Pakistani passports. Amin’s “economic war” was
applied indiscriminately to all Asians irrespective of citizenship or economic
contribution. United Kingdom took 300,000 of them, Canada 15,000 and some returned
to south Asia. The Expropriated Properties Act of 1982 was passed by Obote’s regime to
lure Asian investors back into the economy and this continued during Museveni’s regime,
that actively wooed the Asians and about 5,000 Asians investors have already returned,
others have reclaimed their assets, rehabilitated industries while some have started new
investments.
______________________ 26Svensson (2002 1, 2 &41); he studied the causes and consequences of corruption in Uganda where he collected quantitative data on micro corruption on a cross- section of firms. His study was guided by a simple principal agent model and rested on the assumptions: 1) bureaucrats are profit maximizers; 2) existing firms can avoid bribes; 3) there are many bureaucrats, each being uncertain of remaining in a position to extract rents.
53
The Madhvani Group is among the Asians who have returned and controls significance
enterprises like Kakira Sugar Works and Nile Breweries, and contributes to Government
revenues at 80 billion Ugandan shillings per annum.27
The return of Asian investors is a practical example of a demonstrated political will to
attract Asian investors back into the economy, and build confidence in them that the
Ugandan economic nationalism of 1972 has been shelved by the current leadership. As a
result, Indians in the last five years have created 115 project investments worth Ushs 170
billion plus 7,839 jobs. 28
They are currently actively involved in construction,
agriculture, mining and the financial sector. Their expertise in wholesale and retail
businesses has induced competition and prices have been driven down.
3.4 The Privatization factor:
Uganda implemented the privatization program due to the need to reduce fiscal burden,
develop private sector, broaden ownership, increase economic efficiency, reduce
administrative burden, and develop capital market.29
This was conducted through the
Public Enterprise Reform and Divestiture Statue of 1993, in which 117 enterprises have
been divested and 39 liquidated/strike-offs (appendix A provides some of the remaining
public enterprises not yet privatized). The divestiture started with small enterprises and
the focus is currently on utility and large scale sector.
______________________ 27UN (2004, p.17) 28 The New Vision, Sunday, 19th November, 2006 based on the report by UIA’s executive director Dr. Maggie Kigozi.
54
The privatization program was successful since productive capacity of privatized
enterprises has increased from 11% in 1993 to 51% in 1998. The pace of privatization
process was faster in Uganda, and this facilitated rapid inflows of FDI in the economy.
The divestiture has taken the form of direct sale of government shares, wholly or partly,
in public enterprises, auction of debt/equity swap, joint ventures, and management
contracts.30
Public Enterprise Reform and Divestiture was amended in 2000 to facilitate
privatization process, embedded with the commitment and transparency under the new
Privatization and Utility Sector Reform Project (PUSRP) which was effected from 31st
January 2001.31
______________________ 29Campell and Bhita, 1996, p. 11 & 22 Privatization means transfer of the operational control of an enterprise from the government to the private sector. The operational control to the private sector can be conducted through leases, concessions, or contract management. Controls are always secured through majority ownership. The definition includes equity dilutions -where the government has moved from a majority position to holding minority equity and Joint ventures – where a government holds no more than 50% of the equity and has ceded management to the private holders. Divestiture means any transaction by which the government has transferred title or sold some or all assets or shares in an enterprise. This includes sales of government held shares, transfers of shares or assets, public enterprise mergers, official liquidations or sales of assets through other means. Divestiture is a process to the privatization, but does not mean equity dilutions, joint ventures, leases, concessions, and management contract. Although government has ceded ownership controls under these methods (i.e. sold or parted with, or transferred title to). Transactions mean “deals” reached whether in privatization or step towards eventual privatization. Liquidation relates the closure and winding up of an incorporated enterprise in accordance with procedures under insolvency –full divestiture when the enterprise is wound up. Lease – in return for an agree fee (rent), a private operator is given the custody for a specific period of time of some or all of these assets of a public enterprise to employ them a in productive manner. Ownership of the assets remains with the enterprise, and the ownership of the shares remain unchanged – temporary privatization of the business takes place and lasts as long as the lease arrangement.
Concession is a contractual arrangement whereby, in return for a negotiated fee, a selected
private operator is awarded a license to provide specified services over a period of time.
Ownership of the principal assets remains with the enterprise, and ownership of shares
remains unchanged – temporary privatization of the service takes place and lasts for as
long as the concession lasts. Concession is awarded on a competitive tendering. 30
Basu and Srinivasan (2002, p.36) 31
MoFPED (2003, p.1&2)
55
This study focused on how privatization process has positively influenced inflows of FDI
in Uganda’s economy. For example, in November 1999 GOU and UEB executed
contracts with AES Nile Power for the development of 200MW Bujagali private sector
hydropower project worth US$ 500m.32
South African power Company, Eskom, was
awarded 20 years concession to operate the Jinja stations in November 2002.33
Umeme
Ltd in 2004 took the distribution role of power for a concession of 20 years. These
arrangements improved on the management of power sector. However, there are other
things government do better than the private sector, especially in the energy development
which has got high sunk cost, long gestation periods, plus heavy capital investment in
which the cost of power, if rendered by the private sector, becomes very expensive for
citizens.
The monopoly of Uganda Posts and Telecommunications Corporation was abolished.
The Uganda Telecommunications Limited (UTL) was created to compete favorably with
new foreign telecoms. These include MTN, Celtel, Mango, and the new Warid. MTN
joined Ugandan market in 1998 and currently operates countrywide.34
MTN has successfully created a “public good,” that is cell phones, which was
characterized by market failures of coverage, imperfect competition and monopoly. This
has built confidence in foreign investors because utility costs are driven down and
businesses can be conducted smoothly.
_______________________ 32 MoFPED (2000, p.9) 33 UN (2004, p.19) 34 MoFPED (2000, p.14)

56
In the financial sector, Uganda Commercial Bank was privatized in 2002 and finally
merged with the Stanbic Bank of South Africa. This contributed positively, especially in
stabilizing the financial sector with multiple commercial banks spurring up the expansion
of financial intermediation which increases confidence of foreign investors. The
privatization program is the most important factor that facilitated inward FDI. Other
cases include: Rwenzori Highland Tea Company Ltd bought by Finlays Group, British
American Tobacco (BAT) sold to BAT, Blenders Uganda Ltd sold to Unilever, Kakira
sugar works, Kibimba Rice Co. Ltd, Uganda Tea Corporation.35
Details on Uganda’s
privatization programs are in appendix B.
3.5 The Creation of Uganda Investment Authority (UIA):
The 1991 investment code resulted into the creation of UIA that handles process of
investment proposals, giving assistance and advice to potential investors.36
UIA in 1999
changed its role from general marketing to targeting of FDI into priority sectors such as
horticulture, food processing, tourism, textiles, packaging, livestock, and mining, where
Uganda has a competitive advantage.37
Marketing strategies have been via direct mails
to potential investors, use of both Ugandan embassies and consulates abroad and foreign
embassies accredited to Uganda and other agencies as key avenues.
______________________ 35ibid9 p.9-10 36 UNCTAD WID – Country Profile: Uganda Nov. 2006 37UIA Annual Report (1999/2000, p.9), priorities countries were grouped into economic zones: Zone 1 constitutes South Africa, Kenya, and Mauritius. Zone 2 constitutes Egypt and the Gulf States. Zone 3 Constitutes United Kingdom and France. Zone 4 Constitutes India, China, USA and Italy. In Zones 1-3, UIA contracts International Investment Promotion Service providers to assist in targeting investors in the respective zone such as www.aaitpc.com supervised by UNIDO. UIA staff handles the investment promotion activities for countries in zones 4.
57
The Mission to India and Malaysia in April 2000 was for palm oil growing, milling and
refining in preparation for the implementation of Oil Palm in Kalangala. 38
This mission
yielded a positive outcome. BIDCO Company currently runs a palm oil plantation project
in Kalangala district.
In addition, UIA provides investment facilitation and “after care” by organizing meetings
with investors to identify investors’ problems and handle investors on case by case basis
at different levels of authorities, and liaisons with relevant line agencies and ministries to
provide services to all prospective and already existing investors.
After looking at the UIA as one of the means the GOU is supporting FDI as an alternative
development paradigm, it is important to consider whether its role in promoting FDI has
been adding value for money. A follow-up assessment of the UIA project activity
concluded that $830 million was invested as a result of these components, amounting to $
1,000 for every $ 1 spent. A detailed analysis confirmed that investors’ projects are
closely linked to the outward and inward missions. Up to 500 of 1800 existing investors
contacted received “after care” through site visits.39
In addition; the BIDCO Palm oil
project in Kalangala has been as a result of outward mission to Malaysia in 2000. More
so, over 710 (about 20%) investment projects licensed since 1991 have taken off
according the report by UIA.40
______________________
38 UIA Annual Report (1999/2000, p. 10, 11, 14, 16 & 17) 39MIGA, 2004, p.53 40The New Vision, Tuesday, 16th January 2007

58
In critical perspectives however, UIA has registered great impact on the promotional role
and its performance has been evaluated by TNCs at above 85 % in line with their
expectations in the UNIDO’s survey of 2003 (p.78). However, it has attracted more of
‘quantity rather than quality’ of foreign investors competing for domestic market
especially in the production of non tradables. The UIA has also done little in directing
investments in order to spur regional development because the greatest percentage of
investments is in the central region.
In line with the above mentioned point, it is advisable for the UIA to focus currently on
land as a factor of production, UIA has achieved less especially in securing land for
commercial investment which can generate spillovers in the economy. Land in Uganda is
leasehold land rather than freehold to foreign investors. 41
Hence, the role of UIA is still
limited to stakeholders’ management on land issues. Land is really scarce to potential
investors in Uganda because of the political economy involved in it. For example,
BIDCO is a greenfield palm oil project in Kalangala district, approved by the GOU in
2004 and started with $ 150m. The GOU is expected to provide 26,500 hectares of land,
25 years corporate tax holidays and VAT deferral for plantation projects. Only 5,500
hectares of land have been provided, and 3,500 hectares have been utilized for palm trees
project. However, the project has got opposition from environmentalists and Members of
Parliament because of the ecological consequences and fiscal losses.42
_____________________________ 41Games (2004, p.71): In addition, lists of lands available to foreign investors in Uganda are Sembabule (4.5 square miles) lease hold, Kiryangdongo (9 square miles) freehold, Masindi (20 square miles) lease hold, Kasangati (20 acres) lease hold, Pain Upe (1700 square miles) untitled, Luzira (26 hectare miles) freehold, Nalumunye (137.5 hectares) mailo land, Pallisa (Un-surveyed), Bweyogere (35 acres) freehold (UIA Monthly Report for August 2004). 42The New Vision, Sunday, 24th September 2006

59
The Sugar Corporation of Uganda (SCOUL) has got land problem. SCOUL needs about
7,100 hectares of land for increasing the production of sugar in order to meet the national
target. SCOUL also pays annually about Ushs13.3billion in taxes, employs 6,760 people,
in addition to 1,000 out growers. 43
In Northern Uganda, the political risk is high for
foreign investors because of continuous pronouncements of economic nationalism by
area representatives:
I will spear to death any investor who dares to step in my
constituency, I am warning the minister that we shall spear
any investor who claims to be investing in our land or any
body who dares to plough it because land is the only asset
we are left with, said Aruu representative.44 If the
government tries to take our land, there will be more
atrocities than those committed by the LRA rebels, said
Acholi Parliamentary Group Chief.45
These complicate the role of UIA which liaison between potential investors and land
owners. Its role is constrained by the political economy in areas that are cynical of the
land question, seeing government’s efforts to acquire land for commercial investment as
‘state alliance of neo-corporatism’ to grab their land in the name of promoting
development. Land has become a public good for politicians in Northern Uganda. It is
supposed to be preserved for future generations and this necessitates its capitalization in
the quest for a political alternative. People in Northern Uganda have low awareness on
how they can benefit from foreign investors and UIA has also done little in creating
awareness to an average communal person in the North. Hence, the issue is whether UIA
decentralizes its land role and the local finalizes deals on land arrangements with the
potential investors who shall be renting from the local community rather than being sold?
_____________________________ 43The New Vision, Monday 16th October 2006: Metha wants 7,100 Hectares. 44The New Vision, Thursday, 16th November 2006: Otto warns investors 45The New Vision, Friday, 17th November 2006: Acholi MPs warned on land statements
60
3.6 The Medium Term Competitive Strategy (MTCS):
MTCS is a multi-sectoral government program which aims at improving the private
sector competitiveness by increasing investment in basic infrastructure and improving
institutional capacity of various ministries and line agencies. 46
It is based on the
philosophy that strong economic growth would eradicate poverty, given the high level of
private sector investment. However, the actual experience from relating findings shows
that achieving MTCS is far from an easy task. The Private Investment Survey of 1998
revealed that on average, firms lose an estimated $90m of operating days a year due to
power cut, which later translates into high cost of production. This therefore, reduces the
competitiveness of private firms in Uganda, even though, 77 percent of large firms, 44
percent of medium-size firms, and 16 percent of small firms own power generators.47
The impact of MTCS is insufficient in attracting the heavy manufacturing FDI because
existing TNCs operate below capacity. It was not surprising when the hydro electricity
capacity of 380 mega watts on River Nile reduced in the financial year 2005/06 to 135
MW because of the extended regional drought. 48
Amidst power shortages, Electricity
Regulatory Authority has approved new tariffs increment that took place on 1st November
2006 to 41% and 55% for commercial and large scale industries respectively. Hence,
Uganda Manufacturers Association (UMA) boss had to respond to such policy:
______________________ 46UEPB (2004, p.7): Annual Report 47MoFPED (2000, p.3): Medium Term Competitive Strategy for Private Sector 2000-005) 48The New Vision, Thursday, 4th May 2006:
61
The power tariff hike slapped on the industry, which is
already overburdened with high production costs, is
devastating. Many of the industries will close or relocate
to the nearby countries49
Hiking the power tariff adds cost of doing business in Uganda. Heavy industry
automatically reduces production and this affects consumption level in the economy.
More so, prospective investors are deterred from entering Uganda’s economy due to the
high cost of utility. Especially, footloose industries relocate to other countries because
they (foreign investors) tend to be more responsive to policy environment.
Being a landlocked country (Uganda), transport is expensive to manufacturing firms and
its infrastructure suffers from negligence and poor management.50
It is 1,200 km through
the northern corridor to the port of Mombassa, in Kenya, or 1,600km through the central
corridor to the port of Dar-es-Salaam in Tanzania. High transport costs are estimated at
about 35 percent of the total value of exports.51
The transport cost of raw material from
Mombassa had gone up by more than 50 per cent, and the rail cost of 20ft container in
November 2004 was US$ 1600, while in September 2006 rated at +$2500 and road
transport has gone up from US$ 2400 to US$ 3500 per 20 fit FCL. It takes less than 12
days to 30 days by rail and there are no return journeys of the export trucks.52
_____________________________ 49The New Vision, Wednesday, 1st November 2006: Industries risk closer over high power tariffs 50AfDB/OECD (2006, p.513): African Economic Outlook. Paris 51Games (2004, p.70): The experience of South African firms in doing business in Africa. A preliminary survey and analysis 52PSF (2005, p.1): Cost of Doing Business in Uganda. Policy Advocacy Unit 2005

62
To export oriented foreign investors, MTCS has not yet made any differences and this
explains why Uganda’s economy has more domestic market-oriented FDI than
regionally-oriented FDI which could generate significant impact in the economy. More
so, even those already operating in the economy do not compete comparatively because
of high cost of transport and the trends are changing towards merchandise businesses
than in key production areas.
3.7 The “Big Push” Strategy
The Big Push Strategy aims to promote competition, improve efficiency, spur
innovation, encourage inter-firm learning, establish forward and backward linkages in
production, and subsequently improves quality for firms to become competitive.53
It
came to exist after the 1998 joint analysis by the GOU, UNCTAD and UNDP; where
fundamental decisions were reached to embark on the major push for investment
promotion.54
Sectors selected included: agriculture/cotton, banking and insurance, air
cargo and inland port, education, Multi-Facility Economic Zones (MFEZ),
information/communication technology, medical facilities and printing and publishing.
This resulted into the creation of EPZs and Free Trade Zones in Entebbe. In addition,
GOU is working on New Industrial Park at Namanve and Luzira .55
_______________________ 53 United Nations (2004, P.11): An Investment Guide to Uganda Opportunities and conditions, New York. 54UIA Annual Report (1999/2000, p.15) 55UIA News Letters April-June 2006 Quarterly reports
63
However, this program is just at an initial phase, involving planning and site construction.
It has got little impact in attracting export oriented FDI that would generate exports,
increase employment and facilitate domestic linkages, instead it has attracted FDI only in
construction especially those from South Africa. Hence, the government’s effort in
promoting FDI through Multi-facility Economic Zones is far from its realization.
3.8 Regional Initiatives:
Uganda is a member of East Africa Community (EAC), African Union, NEPAD and
COMESA. It is also a member of African, Caribbean and Pacific Countries partnership,
Cotonou agreement for the renegotiation of the preferential trade and aid links with the
EU and is eligible for “EU Everything But Arms initiative” and the “United State’s
market access initiative” for sub-Saharan Africa (AGOA). It is a member of the WTO
and is a signatory to the International Center for the settlement of Investment Disputes
and Multilateral Investment Guarantee Agency.56
EAC is a custom union that would lead
Common External Tariffs on imported goods. 57
It is moving along the continuum from
custom union to full economic integration.58
______________________ 56UNCTAD WID – Country Profile: Uganda Nov. 2006 57 United Nations (2005 p.513): An Investment Guide to the EAC: opportunities and conditions. New York The EAC member countries are Kenya, Tanzania and Uganda as per the protocol for the establishment in March 2004 and effected from 1st Jan. 2005. Burundi and Rwanda joined later in 2006. The member countries of COMESA Include Angola, Burundi, Comoros, Egypt, Eritrea, Ethiopia, Kenya, Madagascar, Malawi, Mauritius, Namibia, Rwanda, Seychelles, Sudan, Swaziland, Zambia and Zimbabwe 58 The Implementation of the customs Union Protocol in January 2005; creation of a single regional air space in August 2005; setting up of a regional Capital Markets Authority in December 2005; setting up of a Common Market in December 2007; adaptation of a single regional currency in September 2009; swearing-in of the President of a transitional Federation of East Africa in January 2010; drawing up of regional constituencies and swearing-in of a transitional Federation Parliament in 2010-2012; and Elections for an East African President and Government in March 2013 (United Nations, 2004, p.9)

64
The regional and international market access has had positive effect on location of FDI in
Uganda, that is, 39 per cent on foreign investors and 33 per cent on domestic investors.59
This is an important opportunity for Uganda to justify the promotional role to attract
regionally oriented FDI in order to reduce its expenses on transport cost in accessing
markets in the EU and other western countries.
In the project of AGOA, GOU pays up to Ushs 800m per year for its operations. These
include: transport, training of girls, office rent, officer’s allowances, travels, and fuel and
vehicle maintenance. Apparels Tri-Star is the Uganda’s company exporting garments to
the US market under the project of AGOA since Dec. 2000. 60
The case of AGOA is almost the new strategy of financial subsidies GOU has started
offering to the Apparels Tri-Star company. Legislatures disagreed with the GOU on this
position because GOU is going too far with the allocation of money to private
proprietors. However, strategically, GOU is right to offer financial assistance. The project
has good impact on the economy, employing unemployed young girls countrywide, by
exporting textiles to the USA means linkages with rural farmers in cotton production.
Hence, the problem of financial management was at the company’s level, not the
responsibility of the Government of Uganda.
____________________ 59UBOS (2004, p.53): Private Sector Investment and Investment Perception in Uganda Report 2003 60The New Vision: Friday 3rd November 2006: Now MPs want TriStar’s Kananathan arrested
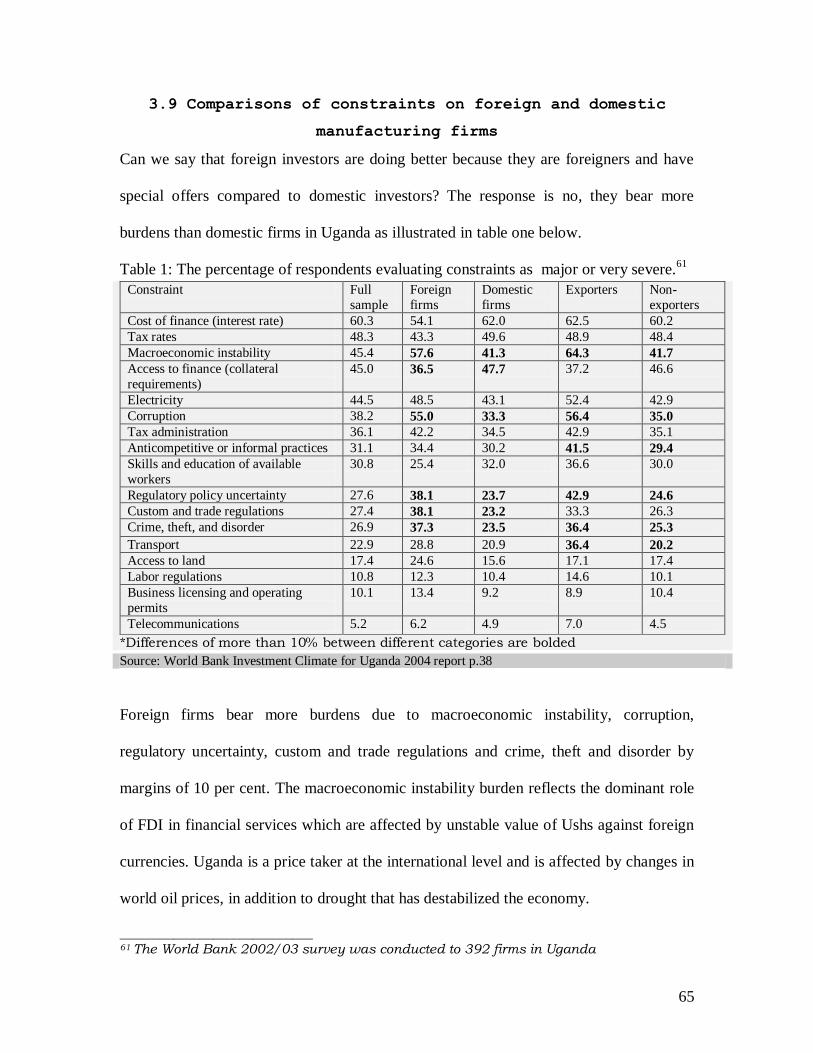
65
3.9 Comparisons of constraints on foreign and domestic
manufacturing firms
Can we say that foreign investors are doing better because they are foreigners and have
special offers compared to domestic investors? The response is no, they bear more
burdens than domestic firms in Uganda as illustrated in table one below.
Table 1: The percentage of respondents evaluating constraints as major or very severe.61
Constraint Full
sample
Foreign
firms
Domestic
firms
Exporters Non-
exporters
Cost of finance (interest rate) 60.3 54.1 62.0 62.5 60.2
Tax rates 48.3 43.3 49.6 48.9 48.4
Macroeconomic instability 45.4 57.6 41.3 64.3 41.7
Access to finance (collateral
requirements)
45.0 36.5 47.7 37.2 46.6
Electricity 44.5 48.5 43.1 52.4 42.9
Corruption 38.2 55.0 33.3 56.4 35.0
Tax administration 36.1 42.2 34.5 42.9 35.1
Anticompetitive or informal practices 31.1 34.4 30.2 41.5 29.4
Skills and education of available
workers
30.8 25.4 32.0 36.6 30.0
Regulatory policy uncertainty 27.6 38.1 23.7 42.9 24.6
Custom and trade regulations 27.4 38.1 23.2 33.3 26.3
Crime, theft, and disorder 26.9 37.3 23.5 36.4 25.3
Transport 22.9 28.8 20.9 36.4 20.2
Access to land 17.4 24.6 15.6 17.1 17.4
Labor regulations 10.8 12.3 10.4 14.6 10.1
Business licensing and operating
permits
10.1 13.4 9.2 8.9 10.4
Telecommunications 5.2 6.2 4.9 7.0 4.5
*Differences of more than 10% between different categories are bolded
Source: World Bank Investment Climate for Uganda 2004 report p.38
Foreign firms bear more burdens due to macroeconomic instability, corruption,
regulatory uncertainty, custom and trade regulations and crime, theft and disorder by
margins of 10 per cent. The macroeconomic instability burden reflects the dominant role
of FDI in financial services which are affected by unstable value of Ushs against foreign
currencies. Uganda is a price taker at the international level and is affected by changes in
world oil prices, in addition to drought that has destabilized the economy.
_____________________________ 61 The World Bank 2002/03 survey was conducted to 392 firms in Uganda
66
Local firms are mainly dominant SMEs in agriculture, whole sales, and construction and
services, hence, scoring low in the comparison. Corruption is high among foreign firms
because they are foreigners, financially loaded, and they have low level of awareness
business procedures when accessing public utilities. They become the prime target of
bureaucrats unless they want to receive the utility of ‘come tomorrow’ which is tactical.
Customs and trade regulations having severe constraints on foreign investors reflect the
traditional dominant role of FDI in the economy in production of raw materials to supply
their home countries. The existence of regional export oriented FDI, long procedures and
number of days for importers and exporters, and also reflect the high number of TNCs in
Uganda which outsourced inputs from outside the economy.
However, foreign investors have fewer constraints in accessing finance compared to local
investors. This reflects the big size of TNC investments in the economy, which makes it
easier for banks to grant foreign investors loans compared to local investors which have
small size investment, making interest rates on borrowed loans very high because of high
risk of paying back. Exporters face high degree of constraints on macroeconomic
instability, corruption, informal practices, regulatory policy uncertainty, transport and
crime, theft and disorder by margins of 10 per cent compared to the non-exporters.
Ugandan products become expensive at the international market because inflation pushes
up prices of factor of production. Corruption is high during the clearance to avoid delays,
while informal practices such as smugglings reduce firms’ revenues and competitiveness
due to the availability of cheap good and services. Transport cost is high to the sea while
67
non-exporters only concentrate on the domestic market, thus reducing their degree of
exposure to such practices.
To sum up this chapter, the Government of Uganda has employed various macro policies
to support FDI in the economy, including fiscal incentives, liberalized both exchange and
capital markets, privatized most of its public enterprises, created promotional agency and
recalled back the economic engineers chased during Amin’s regime. Uganda is currently
moving towards micro policies to reduce the cost of doing business. These can be seen in
the adoption of MTCS and the Big Push strategy.
Fiscal incentives positively affect FDI location decisions in Uganda, but are not the most
important factors compared to political stability and economic fundamentals such as
domestic market and regional market. The provision of fiscal incentives by state
authorities adds delays and costs to firms due to the ineffectiveness in administering, and
has given bureaucrats the opportunity to do corruption.
The monetary policy has performed poorly in Uganda’s economy. The exchange rate
volatility and high interest rates negatively affect FDI when it comes to capital loans.
Uganda has liberalized trade, but non-tariff barriers remain active in frustrating foreign
investors in the export sector. Uganda’s role in building transparent business operations,
which is free from corruption, has remained unchanged in spite the adequate awareness.
68
The privatization program has positively affected inflows of FDI. The productivity of
privatized enterprises has increased by a difference of 40 percent (an increment from
11% in 1991 to 51% in 1998). Any discussion beyond this role is exogenous to the thesis
argument. Calling back historical investors into the economy has been one of the
significant reforms. Asians have rehabilitated their former enterprises which were
nationalized and others have opened new ones.
The role of UIA has been very effective in general marketing to attract FDI, but not much
in targeting specific types of FDI which could turn around the economy and in managing
land owners who leased land to foreign investors. Uganda’s economy has stagnated for
the last 9 years with no improvement in terms of attracting FDI. Uganda was ranked in
the 11th position in 1998 in terms of attracting FDI (UNCTAD, 1999, p.49) in Africa. The
recent ranking by the World Bank 2006 is still in the 11th
position. The FDI tends to
respond to economic fundamentals (natural resources and market size and growth) more
than the general improvement in policy (fiscal incentives, political stability, and good
regulation).

69
CHAPTER FOUR
BASIC CHARACTERISTICS OF FOREIGN DIRECT INVESTMENT
ENTERPRISES IN UGANDA’S ECONOMY
4.1 Introduction:
This section discusses the basic characteristics of FDI enterprises in Uganda’s economy.
It looks at the sectoral orientation of FDI enterprises, the country of origin, entry mode
choices, and the regional distribution of FDI enterprises. Emphasis is taken in relating
characteristics to the need of the host economy. Bank of Uganda defined FDI as
reflecting the objective of a lasting interest by a resident entity in one economy (direct
investor) in an entity resident in another economy (direct entity). FDI comprises of three
components: new equity investment, re-invested earnings and inter-company loans.1
FDI
flows to Uganda’s economy increased from US$1 million in 1991 to US$ 258.5 million
in 2005. Equity investment increased from US$1 million in 1991 to US$155.9 in 2005
(details in appendix C). These are due to changes in national policies such as
privatization via M&As, and purchases of the existing projects which later helped in
restoring the economy at the macro level, especially in agriculture, mineral, finance and
real estate development.
FDI enterprises have reinvested their earnings in Uganda. Reinvestment in earnings
increased from US$5.0 million in 1993 to US$70.7million in 2005. This is a good-
practiced issue emerging from FDI because of re-investment in new projects within the
host economy, which is a precondition for achieving economic development and building
linkages within the economy. On top of this, reinvested earnings in the host economy is a
70
way of paying back to the economy because of its multiplier effects compared to profit
repatriations and transfer pricing. Reinvesting in earnings also builds the national
confidence in the performance of foreign firms which would act as an incentive for policy
reform on equal treatment with local enterprises. However, reinvesting in earnings does
not automatically mean benefits to the host economy unless it is in line with its economic
interests and development strategy, and directed to sector of national priorities other than
only in corporatists’ interests.
As often emphasized, FDI can deepen the absorptive capability of SMEs by assisting
them through financial obligations. Uganda’s economy has got good examples in which
inter-company loans transfer increased from US$22.1 million in 1997 to US$31.8 in
2005. Inter-company loans are given to local affiliates, but more financial loans should be
given to local suppliers of inputs plus local distributors of TNC products. This can
alternatively be a development point, where good local entrepreneurs are able to access
real financing from financial intermediaries.
4.2 Sectoral Orientation of FDI Enterprises:
A survey by UBOS in 2003 shows that foreign enterprises’ activities in Uganda are
concentrated mainly in manufacturing (29.1 per cent), wholesales and catering and
accommodation (20.6 per cent), and finance services (16.8 per cent).
_______________________ 1UNCTAD WID – Country Profile: Uganda p.4 Nov. 2006

71
Table 2: The principal private enterprises’ activities in Uganda.2
Sector Domestic Foreign Total
No % No % No %
Agriculture, hunting, forestry and fishing 42 10.2 30 8.5 72 9.4
Mining and quarrying 1 0.2 5 1.4 6 0.8
Manufacturing 135 32.9 103 29.1 238 31.1
Electricity, Gas and water 4 1.0 3 0.9 7 0.9
Construction 15 3.7 26 7.3 41 5.4
Wholesale/retail, catering/accommodation 88 21.5 73 20.6 161 21.5
Transport, storage and communication 31 7.6 24 6.8 55 7.2
Financing/insurance, real estate/services 49 12.0 58 16.8 107 14.0
Community, social and personal services 14 3.3 10 2.8 24 3.1
Activities not covered in the above 31 7.6 23 6.5 54 7.1
Total 410 100.0 355 100.0 765 100.0
Source: Private Sector investment and Investment Perception in Uganda report 2003, published by UBOS
2004, p.16
The recent growth in manufacturing, wholesale, catering and accommodation plus
finance sector shows investment opportunities in the economy because Uganda mainly
depends on traditional crops (coffee, tea, cotton and tobacco) mostly from European
investors. Manufacturing sector is the highest because of the new strategic market
available in the Eastern Democratic Republic of Congo, Rwanda and Burundi as well as
the new market in Southern Sudan where the factor of production had been non-
operational for the last two decades due to wars. Also, when we look at the data from the
manufacturing sector and finance, both foreign investors and private domestic investors
have high levels of involvement. By implication, these necessitate opportunities for
forward and backward linkages, learning from foreign affiliates’ technology and
management skills, and even setting up research and development center for product
development and innovation, which will enhance products’ quality and competitiveness
on top of deepening the absorptive capacity of the economy.
______________________ 2UBOS (2004) reports on the surveyed 765 investing enterprises in Uganda in 2003
72
To illustrate further, the financial sector leads in the actual investment with an investment
of US$339.7 (23.5%), followed by manufacturing US$335.3 (23.2%), electricity
US$20.6 (1.4%) and mining is the least with US$6.2 (0.4%). 3
In the financial and real
estate services, privatization program has opened entry into the economy to rescue the
ailing companies which were controlled by the government through M&As and Joint
Ventures. More so, Uganda has inadequate, poor financial and real estate developers
prompting foreign investors to exploit lucrative opportunities. Furthermore, the trend
towards services is not sensitive to distance, and it is needed for the economic integration.
Uganda is experiencing high growth of FDI in financial services and real estate
development, but manufacturing sector continues to dominate. It deems fit for the
government to reinforce the recent development in services. These are non-tradables
meant for domestic demands. Deepening the key productivity using the ‘best-practiced
policy’ of targeted subsidy to promote production oriented firms in a particular industry
is needed on top of relying on the general subsidy which has got little incidence, by
attracting FDI in non-tradables.
Investors’ participation in utility sector has been minimal since the 1990s. Private
investments in energy increased from US$18 million in 2003 to US$124 million in 2005,
and investment in telecom increased from US$4 million in 1994 to US$77 million in
2005. Hence, totaling to 10 projects; 5 in electricity, telecom 3, water and sewage 2.4
___________________________ 3UBOS (2004, p.22): Private Sector Investment and Investment Perception in Uganda Report 2003 4The World Bank Group 2006: Private Participation in Infrastructure Projects Database

73
However, investment in the energy sector should not only be seen as a response to the
current drought in the economy which has reduced the power production capacity of the
Owen Falls Dam, but should be seen as a strategic point of entry into the economy given
the available resources for energy development including solar, biomass, and Fall sites.
Such best-practiced policy would be to the interest of the GOU that is eagerly promoting
the rural electrification, but it is constrained by limited resources. Private developers can
complement government’s production rather than being only consumers of energy.
Foreign investors have recently invested in the energy sector to avoid load shedding
which affects firms’ productivity and competitiveness. The recent development in
telecom is due to the liberalization and removal of antitrust law that inhibits new entrants
in the sector because of the agreement signed between MTN and Uganda Telecom in
1998. This has helped in creating a public good (information and communication) across
the country, unlike before under the monopoly of Uganda Post and Telecommunication
Limited, which had been characterized by limited coverage, and lack of competition.
4.3 Country of Origin of FDI Enterprises in Uganda:
United Kingdom invests in Uganda more than any other country with a total of 287
licensed projects; U.S.A came second with 50 licensed projects (high capital value of
investment), Kenya in the third position with a total of 219 licensed projects. Others
countries are Canada with 82 licensed projects, South Africa had 31 projects, India had
178 projects, Egypt had 11 projects, Japan had 34 projects, Norway had 1 project, and
Singapore had 5 projects. 5
________________________________ 5United Nations (2004, p.15) listed the top ten investing countries in Uganda covering the period between 1999 -2002.
74
European investors are mainly found in agriculture, basic chemicals, pharmaceuticals,
nonmetallic mineral products and financial intermediation, and they are absent in the
wearing- apparel sector. African investors are strongly present in textile, wearing apparel,
metallic products and manufacturing sector. Asian investors are particularly strong in
wearing-apparel sector.6 Uganda is mostly dominated by the small, recently established
foreign enterprises from the south with a strong concentration in the service sector having
the highest density.7
Europeans’ dominancy in the agricultural sector has a lot of implications. One is due to
the need for raw materials in home countries, which is cognizant with the locational
advantage theory. Secondly, the market access granted under the “Everything But Arms”
in the European Union and AGOA reflects the behavior of legislatures in opening up
markets for their investors operating overseas as the primary objective, serving the
interests of organized corporatism. This is because access is made for goods which are
not produced in home countries and mostly intermediate agricultural inputs instead of
manufactured products. Their roles in chemicals and pharmaceuticals reflect the high
expertise and capitals that are needed, and African investors have limited access to
capitals. Therefore, Uganda can even improve on by attracting FDI from the South rather
relying only on Northern investors.
______________________
6 UNIDO (2003, p.13): African Investment Survey: Motivations, operations and future; Implications for investment promotion, Vienna. 7 UNIDO (2006, p.20): African Investment Survey 2005; Understanding the contributions of different categories to development implications for targeting strategies, Vienna.
75
Their concentration in textiles, apparel, metal products and manufacturing sector relieves
the economy of transport costs, reinforces backward linkages with local entrepreneurs,
diversifying export development necessary for economic integration, plus creating more
jobs in more dynamic sense rather than in a static sense that is evident in agriculture
products.
This concurs with the view presented in UNCTAD (1994, p.33), that South Africa has a
critical success factor for the investment pole in Sub-Saharan Africa. Cases from Uganda
justify the proposition. UIA has a joint venture with South African companies including
JHI Real Estate, iProp, engineering Companies BKS Global and ADS developers at
Kampala Industrial in the construction of Business Park at Namanve.8 South Africa
invested $17 million in Uganda and has become among the top ten countries in Uganda,
established 32 companies mainly in tourism, mining, energy, construction, agriculture,
trade, and services. Its total planned of investment in Uganda has reached US$222.79,
and has created 3, 583 jobs. Fifteen Companies are wholly foreign to Uganda, while 17
are Joint Ventures. South Africa dominates in the infrastructure sector in Uganda. For
examples, Umeme and Eskom are in the power sector and MTN in telecom. MTN is the
most powerful investment which begun in 1998 and holds 67% of the Mobile and 57% of
the overall telecommunication markets including 207,000 lines in the 34 districts.9 In fact,
Uganda has benefited from the commitment of South African investors in the provision
of “public goods” especially utility services which European investors have neglected.
______________________ 8Games (2004, p.17, 66, 68&69): The Experience of South African firms in doing business in Africa, The South African Institute of International Affairs. 9The New Vision, 3rd May, 2006: South Africa companies dominate infrastructure sector
76
This has helped the economy in reducing utility costs, improved productivity,
employment and leapfrogging technology of cellular phones, affordable by an average
Ugandans. More so, many telephone outlets are operating countryside and local
entrepreneurs act as agents to MTN showing the good-practiced policy.
4.4 Entry Mode Choices:
As noted earlier in the literature, FDI enters into the host economy through greenfield,
M&As and joint ventures. UNIDO’s survey of 2003 found out that Joint Venture
enterprises are 20%, new greenfiled enterprises are 67% and M&As are 13 %.10
Similarly, the Private Sector Survey report 2003 shows that 521 enterprises (68.1%) in
Uganda are greenfield investments, 81 (10.6%) are due the expansion of existing
projects, 31 (4.1%) are purchased through privatization and 49 (6.4) are purchased of
existing project, 53 (6.9%) are others and 30 (3.9%) are not indicated.11
Uganda receives high number of FDI in greenfield as stated in the 2 surveys, and these
have positive implications in the economy in terms of adding investment capital, offering
new technology, introducing innovation management and linkages with the economy.
However, high number of greenfield investments does not guarantee high employment
and values added unless the government has high bargaining powers in inducing the
behavioral and corporate strategy of TNCs in supporting linkages with domestic
investors.
______________________________ 10UNIDO (2003, p.32) 11UBOS (2004, p.17) 12The New Vision: Wednesday 15th November, 2006

77
For example, BIDCO is a greenfield in palm oil project in Kalangala district. It currently
employs 1,500 people who work for eight hours a day for 2000 Ushs (appro.US$1).12
However, this kind of greenfield increases the quantity of employment, but not the
quality because of the poor working environment which is characterized by exploitation
of rural people. How can someone work (physical work) for eight hours at a rate Ushs
2000 (approximately US$1)? This has got nothing to do with employment apart from
giving free labor to foreign investors because the government wants to show people that
they are creating employment. Such kind of employment is just subsidizing foreign
investors by the poor on top tax concessions granted to foreign investors.
Uganda has registered significance numbers of Cross-Border M&As through sales and
purchases of public enterprises between 1996 and up to date. Entry through sales worth
US$55.4 million in 1996, 29 million in 1997, 11 million in 1998 and 32 million in 2000.
Entry through Purchases was registered in 1999 worth US$ 406.1 million.13
Among the
largest M&As in the industrial section include Uganda Breweries from Kenya employing
16,000, Nile Breweries from UK employing 634, BAT from UK employing 600, Uganda
Grain Milling from Kenya employing 500, Hima Cement from France employing 350,
monitor publications from Kenya employing 300, Unilever Uganda from UK employing
160. In the finance sector include: Standard Chartered Bank Uganda from South Africa
employing 113, Stanbic Bank Uganda Limited from South Africa employing 99,
Barclays Bank of Uganda from UK employing 146, Bank of Baroda India employs 180,
and DFCU from Germany employing 95.14
______________________________ 13UNCTAD (2002, p.106) 14ibid1 p.13
78
In fact, the philosophy beyond M&As in Uganda was facilitated by privatization,
globalization, and regional blocks for the strategic oriented investors. For example,
industries such as Hima Cement, Nile Breweries, Stanbic Bank among others have
improved on their performance. However, as noted earlier in the literature that M&As are
undesirable if they are accompanied by rationalization. The case of “Nile Breweries”
laying off 28 permanent employees as part of the second internal restructuring is part of
the bad practices.15
It followed the laying off 15 staff by the “Uganda Breweries” to cut
the cost of doing business. However, given the fact that restructuring is inevitable, Nile
Breweries had the best practiced policy in which the first restructuring staff laid off
underwent training in entrepreneurship. This however, mostly depends on the motivation
of TNCs towards training of employees, and not all TNCs do it.
For joint ventures, as pointed out earlier in the literature, are driven by the need for
technical knowledge, raise finance, utilize local knowledge of bureaucracy and alleviate
risks. Madhvani has a joint venture in Nile Independent Power Consortium with the
initial investment plans of $400m. Also, Arabian International Construction Ltd., wholly
owned by Egyptians has got $600 million in the “Kalangala Falls project”.16
Madhvani
Group Crown Corks has entered a 50/50 joint venture with Coleus Packaging of South
Africa to become the biggest Corks Company in the region. 17 “
Made In Africa
Exploration” has a joint venture with “Kilembe Mines Limited” worth US$20 million.18
_______________________________
15Daily monitor Wednesday, May 3, 2006 16 (UNCTAD, 2000a, p.5&7) 17The New Vision, Wednesday, 25th October, 2005

79
As for the above scenarios, joint ventures in energy and mineral exploration can be
regarded as positive moves in Uganda because they are meant to reduce risks and costs in
the energy sector, acquire technology and managerial skills, local partnership and
entrepreneurial class within local firms. This reinforces the capacity to produce additional
power needed for the production process. However, the limited entry in the utility sector
shows risks borne by the private sector’s participation in energy, including risks in heavy
capital investment and sunk costs, government caps on prices and the political economy
embedded in it.
The 50/50 joint venture between the Madhvani Group and Coleus Packaging of South
Africa to become the biggest Corks Company in the economy is a bad-practiced issue
emerging from FDI. This is an oligopolistic reaction meant to reduce competition which
is associated with market failure. Similarly, the recent development in the financial sector
is worst from the host’s perspective because of it is more of the corporate governance and
ownership. For example, Crane Bank has taken over Stanhope and Nile Bank, and Allied
Bank International buyout by Bank of Africa-Kenya, AUREOS East Africa Fund LLC
and Central Holdings. This reduces the development of financial intermediaries that
would drive interest rates down, which in turn increase credit accessibility to SMEs that
would steer a dynamic economy.
______________________
18Daily Monitor, Saturday 6th May 2006

80
4.5 Regional Distribution of FDI Enterprises:
The distribution of FDI enterprises has economic impact in the host economy. Table 3
below illustrates the regional distribution of FDI enterprises in Uganda.
Table 3: Distribution of enterprises by region, actual investment and employment
Region Location of number of enterprises Actual investment Actual employment
Domestic Foreign Total % Amount US $ m % Number %
Central 281 315 596 77.7 1,032.8 71.4 61,890 73.8
East 63 31 94 12.5 272.2 18.8 12,601 15.0
West 57 8 65 8.5 136.0 9.4 8,836 10.5
North 9 1 10 1.3 5.1 0.4% 570 0.7
Total 410 355 765 100.0 1,446.1 100.0 100.0
Source: Private Sector Investment Survey Report 2003 published by UBOS 2004, p.14
Actual investments are concentrated in the central region (71.4%) as illustrated in table 3
above. The rest of the regions have got little investments even though government
invested in regions before liberalization. These scenarios have implications on economy
in terms of regional imbalances because the government uses corporatist strategy in
resource allocations to improve on utility and infrastructural services where foreign
investors dominate in order to beat off competition from its counterparts. The central
location and heavy investment of FDI enterprises are pull factors, which negatively
affects the long term development planning proposed in PEAP framework, which
provides for the private sector’s participation in poverty reduction strategies of increasing
household incomes. For instance, 73.8 % of enterprise employment in the central region
means a lot in terms of improving income poverty, and also, high possibility of being
employed than the 0.7 percent in the North. More so, these regions with less investments
are supply points for industrial inputs in the central region, and firms incur high cost in
transporting raw materials.

81
To call off this chapter short, there are good-practiced issues from FDI in Uganda,
including re-investment of earnings into new projects within the economy, which is a
precondition for achieving the economic development. There is a sign towards the
development of manufacturing sector which has the highest concentration of TNC
activities in the economy, though agriculture traditionally dominates. However, the
financial sector leads in actual investments than manufacturing. Investors’ participation
in utility sector has been minimal, and if so then it has been motivated by the energy
crisis in the economy, not a deliberate participation. European countries (UK, USA and
Canada) top investment lists in the economy, while African countries including Kenya
and South Africa are also increasing their market shares. South Africa has a long term
interest in the economy. Its involvement in the infrastructure sector has been of
significance in reducing the cost of utility in the economy.
As a developing country, this study found out that Uganda receives the highest number of
TNCs in greenfield more than through M&As and Joint Ventures which is consonant
with its level of development. However, the regional distribution of FDI in the economy
is uneven, and is associated with the mass urbanizing region (central) which is contrary to
the government’s position of promoting FDI to solve the economy’s development
challenges. The Government will fail to address the development goal of improving
household incomes as they might have projected.
82
CHAPTER FIVE
FOREIGN DIRECT INVESTMENT SPILLOVERS IN UGANDA’S ECONOMY
5.1 Introduction:
Spillovers are defined as benefits of FDI that occur through positive externalities such as
transfers of technology, enterprise development and restructuring, integration, bolstering
of business competition and supporting human capital formation. This subsection
emphasizes only benefits of FDI through its spillovers in Uganda’s economy.
5.2 Export Development and Market Access:
Agricultural exports stood at 68 per cent of the total exports in 2004, manufactured
exports showed positive growth of 23 per cent, and minerals contributed 9 percent of the
total exports.1 The number of exporting companies in Traditional exports increased from
89 in 2004 to 127 in 2005 while exporting companies engaged in non-traditional
sectors, excluding manufactures increased from 354 in 2004 to 414 in 2005.2
Traditional exports as share of total exports continued to decrease for the last five
consecutive years since 2001 because of the increase in the number of investing
companies in non traditional crops as seen in table 4 below.
_________________________ 1UEPB annual report (2004 p.19) 2Traditional exports in Uganda include coffee, cotton, tea, and tobacco. The Non Traditional exports include fish and fish products, floriculture, cereals and products, horticulture (fruits and vegetables), cocoa and products, spices, mining, gold, animals and products.

83
Table 4: The recovery of non traditional exports over traditional exports in per cent
Year 1998 (%)
1999 (%)
2000 (%)
2001 (%)
2002 (%)
2003 (%)
2004 (%)
Non Traditional Exports
34 29 47 62 61 61 62
Traditional Exports 66 71 53 38 39 38 38
Total 100 100 100 100 100 100 1000
Source: UEPB Annual report 2004, p.4 and UEPB Aug 2004 p.14, increasing growth through exports.
Non Traditional Exports since 2001 have surpassed traditional exports, contributing to 62
per cent of the total export earnings. Floriculture is one of the leading non traditional
exports and the average annual growth from 1998-2002 was valued at 28 percent, and
Uganda is ranked number 28th among the world exporters.
More companies in non-traditional crops disapproved critics’ view that FDI in Uganda is
attracted fundamentally in traditional export oriented products. Also, the non-traditional
performance justifies the need for ‘performance incentives’ to reduce the cost of
operation and make TNCs competitive. Especially, to flowers’ companies (including
Pearl Flowers in Ntungamo district among others) which are exploiting demands in the
EU and other western countries. This is because non-traditional sector rescues the
economy by utilizing alternative means of marketing like air transport.
Large companies in Uganda account for 18 per cent of the export enterprises and
contribute to 89% of the total export earnings; medium companies take 21% of the
exporting enterprises and contribute to 8% of the total export earnings. Small companies
account for 50 % but contribute only to 3% of the total export earnings. 3 Hence, large
companies benefit more from export earnings than medium and small enterprises.

84
This reflects the background of the economy that is agricultural based in coffee, tea,
tobacco and cotton. Also, big enterprises are well established and resilience to economic
vulnerabilities compared to medium and small enterprises that are more affected by the
microeconomic variables such as non tariff barriers, inadequate governance, red tape,
energy crisis, low standard labor and capital. The increasing numbers of foreign
companies in non traditional crops have made Uganda’s economy to benefits from the
market access in the regional blocks than ever before as illustrated in table five below.
Table 5: Uganda exports by regions in per cent Regions 2002 (%) 2003 (%) 2004 (%) 2005 (%)
COMESA 24 28 26 31
Other Africa 8 8 6 5
EU 35 28 27 31
Other Europe 18 16 17 10
North America 2 3 3 2
Middle East 2 3 6 11
Asia 8 8 3 8
South America 0 0 0 0
Rest of the world 3 7 0 0
Source: UEPB 2004, p.8 and UEPB 2006: Export Performance Analysis 2005
European Union leads on average as the market destination for Ugandan exporters since
2002 because of the free market access under the Everything But Arms initiative. AGOA
initiative in USA offers duty free market to 1830 products, textiles and apparels. Fish
exports to USA in 2003 were valued at US$3.5 Million. Cut flower exports grew from
US$1.4 to US$3.8 million in 2003.4 Generalized System Preference to Uganda is offered
by countries like Canada, Japan, China, Switzerland, Russia, Turkey, Morocco and
Norway. Ugandan exporters started accessing the market duty and quota free in EAC
with the effect from 1st January 2005, and 80 % tariff reduction in COMESA.
_________________________ 3UEPB (Aug. 2003, p.28)

85
Uganda has signed multiple agreements with many countries such as South Africa, Libya,
Iran, China and Pakistan. Other countries on the list include: Rwanda, Sudan, Kenya,
Tanzania, Burundi and Egypt.5
EU averagely leads as the export destination of Uganda’s export not only because of the
availability of EBA initiative plus other bilateral agreements, but as a reflection of the
dominant numbers of foreign investors in the economy that hail from the region. They are
engaged in traditional crops to supply their home countries, though others are engaged in
non traditional crops. Also, sanitary and phytosanitary requirements limit Uganda’s
exports to the EU, especially in non traditional crops not only because of hygienic factor,
but due to the need of protecting domestic firms.
5.3 Human Capital Development:
Investing firms in Uganda play outstanding role in the development of human capital.
The percentages of firms offering formal training are 29.67 percent, to permanent skilled
workers are 25.69 per cent and employment growth over the last 3 years is 12.22 per
cent.6 Trainings offered by firms should be seen not only in terms of the interest of
corporatists, but most fundamentally in the development of local managerial skills that is
needed for the local entrepreneurship.
______________________ 4UEBP (Aug. 2004, p.16) 5UEPB (Sep. 2004, p.10) 6The World Bank Group 2006: Economy Rankings - Doing Business - sub saharan africa.htm>

86
In addition, training is one of the ways of deepening the root of TNCs into the economy
because new entrants find skilled man power trained already by the other TNCs and
could be the benchmark for coordination in activities that they offer, hence the good
outstanding practice.
Employment growth over the last three years has been at 12.2 percent. However, this is
not adequate enough for the fight against income poverty that has gained momentum at
38 percent of the GDP. Moreover, the employment growth is shown in gross percentage
which does not signify how many Ugandans benefit from the increase.
With respect to the sectoral employment; manufacturing employs 26,875 workers
accounting for 33 per cent of the employment; agriculture employs 16,076 workers
(19%), financing employs 12,101 workers (14%), electricity has 402 (0.2%), construction
has 10 per cent, wholesale 11 percent, transport and community both at 4 per cent, and
others had 4 per cent.7
Although manufacturing sector leads in employment, report on the size and capacity of
TNCs engaged in the sector is not economically viable though it is a good start for the
economy like Uganda which had been dominated by the agricultural sector. Most of the
manufacturing firms are small and medium size enterprises from the South with limited
scope of employment especially to the best talent available. They also operate below
optimality to champion development in export sector.
______________________ 7UBOS, 2004, p.21

87
The total numbers of planned employment between the year 1991 to 2002 reached
189,727 and 97,877 jobs were actually realized at the rate of 52 per cent as shown in
Table 6 below.
Table 6: FDI Employment in Uganda between the year 1991-2002
Year Investment (US $ millions) Employment (No. of jobs)
Planned Actual Realization rate (%) planned Actual Realization rate (%)
1991 16.03 16.43 102.5 514 514 57.0
1992 374.43 331.55 88.5 11,480 13,953 121.5
1993 581.62 741.83 127.5 23,967 26,957 112.5
1994 399.57 273.61 68.5 30,783 13,201 42.9
1995 642.07 451.25 70.3 24,380 11,197 45.9
1996 680.80 350.68 51.5 25,368 9,666 38.1
1997 533.93 453.61 85.0 17,271 8,440 48.9
1998 361.15 271.42 75.2 8,715 4,661 53.5
1999 625.30 98.88 15.5 6,371 2,933 46.0
2000 296.70 7.20 2.4 9,158 5,565 60.8
2001 273.69 18.49 6.8 16,650 n/a n/a
2002 916.67 3.96 0.4 15,070 1,011 6.7
Total 916.67 3,016.91 53.0 189,727 97,877 52.0
Source: MIGA 2004 p.66: Investing in Developing Series. Washington D.C
The highest actual realization rates of employment were only recorded between 1992 and
1993 of 121.5% and 112.5% respectively because of high inflows of FDI at the beginning
of liberalization with more greenfield investments that were labor intensive. The recent
trends towards services reduce realization rates because services are more capital
intensive. Through M&As, TNCs demand for highly skilled workers to fill in the
technical and few clerical positions. These are also accompanied by restructuring and
rationalization to maximize productivity.
There is an outstanding issue pertaining ‘workforce diversity’ practiced by TNCs in
Uganda.
Table 7 below represents different job categories offered by investing
enterprises in the economy.
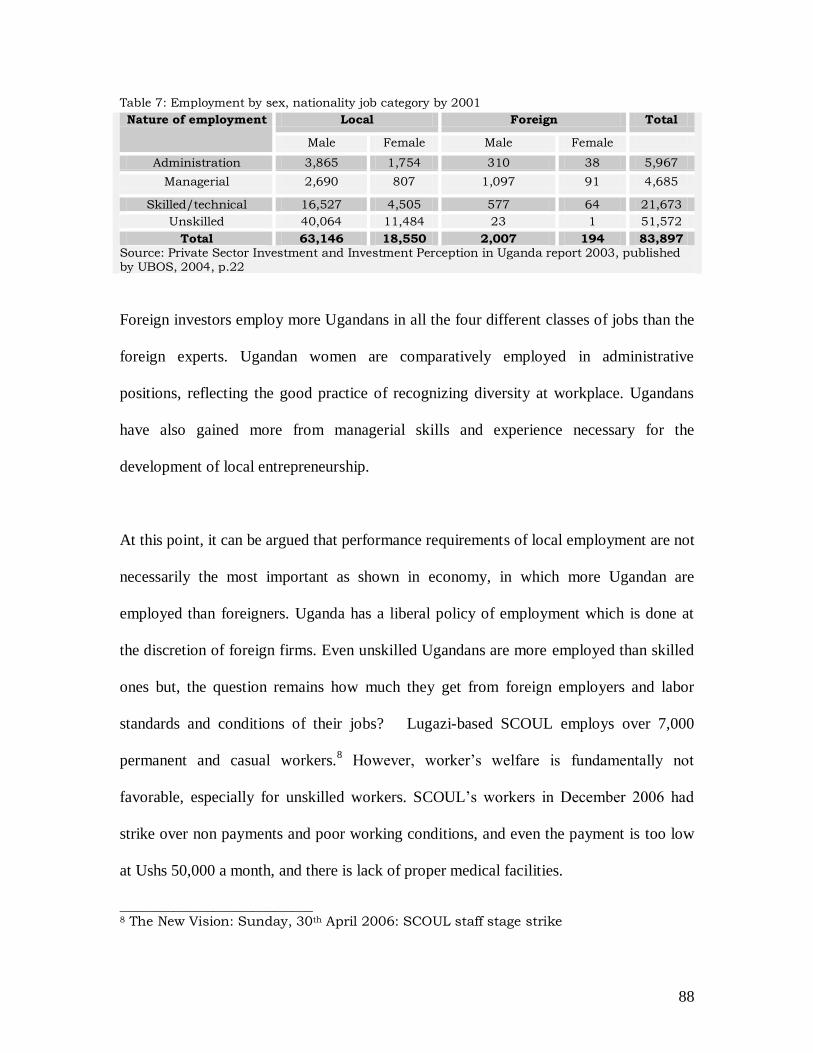
88
Table 7: Employment by sex, nationality job category by 2001
Nature of employment Local Foreign Total
Male Female Male Female
Administration 3,865 1,754 310 38 5,967
Managerial 2,690 807 1,097 91 4,685
Skilled/technical 16,527 4,505 577 64 21,673
Unskilled 40,064 11,484 23 1 51,572
Total 63,146 18,550 2,007 194 83,897 Source: Private Sector Investment and Investment Perception in Uganda report 2003, published by UBOS, 2004, p.22
Foreign investors employ more Ugandans in all the four different classes of jobs than the
foreign experts. Ugandan women are comparatively employed in administrative
positions, reflecting the good practice of recognizing diversity at workplace. Ugandans
have also gained more from managerial skills and experience necessary for the
development of local entrepreneurship.
At this point, it can be argued that performance requirements of local employment are not
necessarily the most important as shown in economy, in which more Ugandan are
employed than foreigners. Uganda has a liberal policy of employment which is done at
the discretion of foreign firms. Even unskilled Ugandans are more employed than skilled
ones but, the question remains how much they get from foreign employers and labor
standards and conditions of their jobs? Lugazi-based SCOUL employs over 7,000
permanent and casual workers.8 However, worker’s welfare is fundamentally not
favorable, especially for unskilled workers. SCOUL’s workers in December 2006 had
strike over non payments and poor working conditions, and even the payment is too low
at Ushs 50,000 a month, and there is lack of proper medical facilities.
_____________________________ 8 The New Vision: Sunday, 30th April 2006: SCOUL staff stage strike

89
Uganda continues to receive spillovers of FDI through employment. The former victims
of economic war are creating value for money in promotional efforts as reported by the
UIA’s executive director: “Indians have created 7,839 jobs in the last five years through
115 project investments amounting to Uganda shilling 170 billion”.9 In addition, “73,000
people are employed in tourism sector with hospitality sub-sector employs about 57,000
people and transport accounting for 16,000 jobs”, according the PSFU.10
The telecom
sector has created 290,000 jobs directly or indirectly, 11
SMEs comprise 90% of private
sector in Uganda and employ 1.9 million people.12
However, 1.9 million employments are inadequate as many Ugandans are unemployed.
The private capacity to employ Ugandans is still low as many graduates are unemployed,
thus necessitating attracting FDI through targeting. These figures are only stated at macro
levels without references to who are those employed, regional locations, and more so, are
just for building public confidence in FDI as a development alternative amidst smart
state’s withdrawal from economic activities, even in areas that Uganda has good
competitive edge and could complement the private employment.
5.4 Backward and Forward linkages in the economy:
As noted earlier in the literature that linkages depend on how TNCs obtain inputs,
transfer technology, train, share information and provide financial support. This study
analyses whether such good practices have been developed in Uganda’s economy.
_________________________________
9 The New Vision, Sunday, 30th April, 2006: Indians create 7,800 jobs 10 The New Vision, Sunday, 7th May, 2006: 73,000 employed in tourism 11 The New Vision, Wednesday, 27th December 2006: Telecom sector creates 290,000 jobs 12 The New Vision, Sunday, 19th November, 2006: Small, Medium enterprises employ 1.5m

90
Small-scale farmers in Uganda have benefited from financing, technical inputs and
assured market at some reasonable prices from activities generated by TNCs. TNCs give
loans to farmers to enable them acquire seeds, chemicals, fertilizers and pesticides and
guidance on proper harvesting methods. 13
These are key milestones because farmers
have no collaterals needed to obtain business loans. In addition, guidance on proper
harvest complements government’s efforts in the Plan for Modernization of Agriculture.
TNC serves as buying agency of primary commodity in Uganda. Kyagalangi Coffee Ltd
is a joint venture between a Ugandan entrepreneur (20%) and a Swiss Volcafe Ltd (80%),
which is the second biggest coffee trading company in the world. Kyagalangi is one of
the 18 export subsidiaries under Volcafe Group, and it is linked to other Volcafe
importing/trading companies such as Rothfos/Halsen of Bremen, Geramny; Volcafe Ltd.,
Winterthur, Switzerland and Volcafe Ltd, Osaka, Japan. Kyagalangi enters into the most
competitive market in the world and exported about $60million worth of coffee between
1995/1996.14
Volcafe Ltd. has therefore, integrated a local company (Kyagalangi) into the global
economy through sharing skills and utilizing quality technologies, market intelligence
and market outlets necessary for forward linkages with coffee farmers within the
economy.
_____________________________
13UNCTAD, 2000a, p.8 14ibid13 p.13

91
A related example is that of North Bukedi Cotton Co., that was rescued through a
strategic alliance of joint venture between the local North Bukedi Co-operative Union
and foreign African Resources Ltd of South Africa to minimize challenges in cotton
growing and marketing. The Co-operative Union mobilizes farmers and other extension
services while foreign partner provides assured market through their global networks.
The company currently exports to USA, Middle East and Europe.15
The alliance is of great importance to the new company because it involves sharing
technical knowledge in marketing which had been an obstacle to the former North
Bukedi Co. Ltd. In addition, African Resource Ltd has also benefited from the local
knowledge in mobilizing farmers that would not have worked well if it was to be taken
by The African Resource Limited due to differences in cultures, that might require local
modes of communication to farmers.
Britania Products Ltd from India is linked with the local suppliers in Uganda. It engages
in manufacturing and distribution of confectionary products. It has 14 product brands,
employs 600 people, and it has got 200 agents countrywide and over 600 retailers. It gets
inputs from local suppliers. It also exports to the DRC, Rwanda, Southern Sudan and
Northern Tanzania.16
_____________________________
15 UNCTAD (2000a, p.13) 16UNCTAD (2000a, p.14)
92
While its role is prominent in creating employment, forward linkages, diversified
products, networking with local agents and retail traders, and promoting exports, the
company can still relieves itself from the distribution role through outsourcing local
transporters and then concentrate on increasing its production capacity.
Amfri Farm Ltd is involved in the growing and exports of organic fruits and vegetables.
It started in 1990 with 25 individual out growers and cooperative farms by a Swiss
engineer with an initial investment of $20,000, using self-developed energy technology
for processing fruits and vegetables. The company now has got 82 out-growers. Major
developments have been in the certification by the Swiss Institute for Market Ecology
(IMO) to process and market organic products in compliance with the EU Regulation
(EEC) No. 2092/91; advising and supporting out grower farmers with techniques in
organic and sustainable farming; development of company-owned farm in organic
production and a pack house facility; development of continuous improvement of solar
driers to increase efficiency; certification (in May 2003) by USDA AMT CFR part 205,
National Organic Program.
The company handles a wide range of products, both fresh (pineapples, apple bananas,
ginger, passion fruit, baby aubergines, okra, matoke and hot pepper) and dried
(pineapples, apple bananas, papaya, and mangoes). It owns a farm of 1,500 acres in
Luwero, 450 acres of which are certified as organic. At the moment, 90% of the produce
comes from the out growers but future plans are to increase company farm production so
that 40% of the export produce come from the farm. The company has 25 permanent and
93
75 casual workers and owns 50 drying units. The project uses a vacuum gauging
machine, the only of its kind in Uganda. Exports of 1-2 tons of fresh fruit started in 2000
but by the end of 2002, over 282 tons of fresh and dried fruits and vegetables were
realized, earning $35,000 for the company. In the past, the main market was Switzerland,
but now the market has expanded to include Canada, Norway, Germany, and the United
States.17
In fact, targeted incentives should be given to Quality Company like this because of its
innovativeness in the use of alternative source of energy, research and development,
acquiring 90% of its produce from out growers and expanding market in EU. Such
outstanding practices promote export competitiveness, diversify products and improve on
the income level of the poor employed in small and medium farming via forward
linkages.
Backward and forward linkages have only developed naturally in Uganda’s economy,
and are in the best interest to the economy because of creating competitive environment
for local firms and integration into the world economy, and creating employment within
local enterprises. However, small and medium enterprises needed for the linkage
development are still small and weak; there is a slow response rate because of lack of
technical and financial capacity to implement urgently the required changes in their
managerial systems and technological base needed for the development of local
absorptive capacity.
______________________ 17UN (2004, p.34)

94
SMEs account for 90 % of non-farm employment and local enterprises own around 38%
of investment projects licensed by the UIA between 1991 and 2000. 18
It is importance to
note that TNCs are motivated by profits that take into consideration the capacity of local
enterprises to deliver quality inputs so as to minimize the cost of doing business.
5.5 Technological spillovers:
The role of FDI in telecom sector has been highly recognized in solving the country’s
technology problems. MTN Uganda Ltd joined business in Uganda since 1998 through a
concession of 20 years for the provision of telecom services. It is now the leading mobile
industry in the economy with over 70% of 350,000 lines. In addition, Celtel Uganda has
got 60,000 lines, Uganda Telecom has a network of 140,000 lines, and 40,000 lines rest
in the hand Mango telecom–Uganda.19
Leapfrogging in the telephone industry has filled in the information gap, Ugandans have
ever longed for via greenfield investments from MTN, Celtel, Uganda Telecom and new
entrant Warid Telecom from Abu Dhabi. Leapfrogging has got multiplier effects of
attracting prospective investors because competition drives the cost of utility down and
improves on TNC competitiveness. Uganda’s economy has benefited more from the
technology transfer in telecom sector, and has helped in building the confidence in
foreign investors.
______________________ 18UN (2005, p.29) 19 www.ugandainvest.com
95
Ugandan firms have benefited from technology transfers and received the highest rating
of 3.95, out of a maximum weight of 5.00 in 1998 UNCTAD’s survey. However, field
visits revealed low level of technology. Machinery tends to be old and lacks
reinvestment. Technology upgrading requires technical and engineering skills.
Uganda’s satisfaction is far from the comparative position. Uganda’s technical
enrollment index is 2.06 and engineering enrollment index is 1.78 compared Mauritius
with 7.16 technical index enrollment and 6.8 engineering index. South Africa has got
technical enrollment index of 23.61 and engineering enrollment of 17.32 that is necessary
for technological competency.
However, the low enrollment index in Uganda is not a guarantee that foreign firms
employ all the technically qualified people. Uganda’s firms prefer employment few
technical people and use unskilled ones because they pay low wages. Enrollment in
technical education sometime is not only about government’s policy towards it, but the
marginal return to trainees motivates others to join the industry. For example, a survey of
121 firms carried out by UIA Technology Consultant Survey in 1998 showed that, out of
121 firms surveyed; only 115 engineers and 240 technicians were employed.20
Suggesting
that firms would employ one to two respectively, and this shows how firms minimize
costs on trained employees, but employed more unskilled people to work in tiles, paints,
fabrication, footwear, plastics and timber, did not employ qualified engineers or
technicians.
________________________ 20UNCTAD (2000a, p.9)

96
The argument is that it depends on the kind of corporate interests and the type of TNCs
government attracts in the sector, but not only on the high technical enrollment rates. In
addition, linkages between foreign and local enterprises in Uganda are still at the infant
phase that limits technological spillovers. However, training of employees by TNCs
enhances the possibility of acquiring technological skills.
A survey by UNIDO in 2006 shows that out of 48 enterprises that were interviewed in
Uganda, 30 enterprises (62.5%) provided training and only 18 enterprises (37.5) had no
training for their employees.21
Training develops the absorptive capacity in the host
economy and strengthens host’s capabilities to adopt the technological competency.
5.6 Enterprise Development and Restructuring:
Uganda has registered successful stories of enterprise development and restructuring.
Hima Cement was privatized in December 1994 and was incorporated into a new
company called Hima Cement (1994) Uganda Limited, and later taken by Bamburi
Cement. Bamburi Cement, a subsidiary of Lafarge together with Lafarge itself acquired
100% shares from the previous owners.22
The company was renamed Hima Cement Ltd
and now owned by Bamburi Cement and eventually Lafarge which is the world biggest
building materials company.
Under Hima Cement Ltd, production had increased to 170,000 tons per annum because of
improved efficiency by 1999. New investors (Lafarge) have increased the plant’s
production capacity to 305, 000 tons per annum. Investment since May 1999 reached
US$ 13 million in plant modernization, quality, safety and training programs reflecting

97
market growth internally and in the neighboring countries. Hima Cement currently
employs 393 staff (329 permanent + 64). In terms revenues to the government, Hima
Cement paid annually Ushs 4.1 billion in direct taxes (corporate tax) and Ugandan
shillings 8.6 billion in indirect taxes (excise, VAT, duties).
In building its image in the economy, Hima supports corporate social responsibility
principles in the community in the areas like health, education, shelter and the
environment. Hima’s support include: Universal Primary Education (constructed Hima
Primary School in Kasese); constrction of pit latrines in schools and reforestation in
Kasese.
Hima commits US$ 50,000 every year for Corporate Social Responsibility and US$ 40,
000 is spent annually on women and men sports. Hima plans to invest US$95m for its
expansion in factory, mining project at Dura and construction of grinder at the Kampala
Business Park in the year 2007. Also, Hima recognizes government’s policy of levying
Ushs 500 on each bag of cement for infrastructure.23
_____________________________ 21UNIDO (2006, p.92) 22Privatization and Utility sector Reform Project –Uganda at http://www.perds.go.ug/ 23The New Vision, Sunday, 5th November 2006
98
Hima has the “best practiced outcome” from foreign investors by engaging in contract
services with local firms in Uganda such as in transportation, maintenance, and security
provision among others. Even in implementing the principles of corporate social
responsibility, Hima is acting as a good example for the prospective of implementing the
Global Compact in Uganda.
Another case in enterprise development is Rwenzori Highland Tea Company Limited.
Government sold its remaining 6.8 percent shares in Rwenzori Highland Tea Company
Limited at Ugandan shillings 1.48 billion with additional Ushs 250 million fee for
settlement of outstanding dividends. RHTCL is owned by Finlays Group, which in turn
owned by the Swire Group UK and since its establishment in 1994, the company is now
Uganda’s single largest producer of black tea, accounting for quarter of country’s tea
exports. The company invested US$ 45 million since 1994 and tea estates have been
rehabilitated, factory upgraded, machines replaced and Ugandan managers trained. 24
In a
similar way, the company added value by investing in capital and training employees.
5.7 Competition:
The investment code of 1991 allows foreigners to invest in all activities, except those
related to national security or requiring ownership of land. Uganda imposes no limit on
equity ownership, and foreign ownership can be 100%. Foreign investors are free to bring
in and take out capital.25
As a result; there is productive competition in the financial
sector, manufacturing and the telecom sector.
_________________________________ 24 UNCTAD (2000a, p.7) 25UNCTAD (2000a, p.51)
99
Standard Chartered Bank of Uganda, Stanbic Bank Uganda, Barclays, Bank of Baroda,
DFCU Bank and Aon Bank are the biggest competitors in the financial sector.
Uganda has a liberal (open) competition policy and prices are determined by market
forces. There are few state monopolies remaining and most of them have started
outsourcing managerial functions to steer competition, including the Electricity
Company. There are numbers of independent power generating firms after liberalization
of the energy sector. These include: Vital Peaks from Malaysia and China Shan Sheng
industry among others, which can reduce the monopoly of Umeme Company Ltd that has
a concession of 20 years in power distribution.
Competition in telecom services is of beneficial to the economy. In December 2006,
Uganda Telecom Commission has awarded the local arm of Adu Dhabi based Warid
Telecom a license to operate phone services; 26
becoming the forth mobile network
operator in Uganda after MTN, Celtel and Uganda Telecom. This is meant to allow
market forces play the role in pricing. According to ICT minister; “Private investment in
the sector since January 2004 December 2006 was about US$180m compared to US$
15m between 1999 and 2000”. “Since 2004, there has been tremendous development in
the sector. The tele-density (number of phones per 100 people both mobile and fixed
lines) has improved from 2.4 % in 2004 to 6.5 % in 2006”. “The network coverage is in
745 sub-counties of the 926 sub counties, which amounts to 80% of geographical
coverage and 10,000 public pay phones installed”.
______________________ 26 The New Vision, Friday, 8th Decemder, 2006:

100
However, there are currently no laws governing competition between firms. The recent
takeovers by big companies are aimed at reducing the number of companies. For
example, in financial sector, Barclays Bank of Uganda Buys out Nile Banks and Crane
Bank takes over Standhope, these moves reduce competition in the financial sector. This
is because there are no anti-trust laws regulating investment environment.
To sum up this chapter, Uganda has benefited more from FDI spillovers. In export
development and market access, the total share of Traditional Exports continues to
decrease consecutively since 2001 because of the increase in the number of investing
companies in non traditional crops, and Uganda is able to access markets in the regional
blocks than ever before.
In paving the way for human capital development, findings show that TNCs offer both
formal and on job training and employment growth is more than 10 per cent over every
three years. However, high actual employment rates were only recorded in two peaks of
1992 and 1993 during the initial period of liberalization, and have dramatically been
reduced because of the recent growth of FDI through Mass, and trends towards services.
Even without performance requirements, TNCs recognized work force diversity. Women
are employed in administrative positions, and more Ugandans are employed in
managerial positions compared to foreign counterparts. However, unskilled laborers
benefit from FDI, but have poor job context and low motivation.
101
Linkages have developed naturally between TNCs and SMEs without performance
requirements in Uganda. There are some registered outstanding cases that are beneficial
to the economy: Kyagalangi Coffee Ltd. buys coffee (forward linkages) from Ugandan
farmers and has integrated the economy into the global economy, North Bukedi Cotton.
Ltd markets Ugandan cotton in North America, Middle East and Europe. Britania
Products Ltd is linked up with the local suppliers in Uganda while Amfri Farm Ltd is
known for promoting out growers and using alternative source of energy. In spite of
these, linkages are still at the infant phase in Uganda.
Creating public value in telecommunication sector has been the most significant benefits
from TNCs in Uganda. Leapfrogging in telephone industry has filled in information gaps
by companies like MTN Uganda, Celtel Uganda and the new entrant Warid telecom from
Abu Dhabi, a move from a monopolistic market to oligopolistic market. With regards to
enterprise development and restructuring, the economy has benefited most in terms of
improving performance of enterprises after privatization. Hima Cement Ltd production
capacity has doubled after restructuring; its market has expanded at the regional level.
Similarly, Rwenzori Highland Tea Company has been rehabilitated, and currently is the
single biggest producer and exporter of black tea. Hence, productive competition has
been generating by TNCs in the economy including the financial, manufacturing and
telecom, but the recent development in the financial sector in terms of take over is
intended to avoid competition; moreover, Uganda has no anti-trust laws regulating
investment environments.

102
CHAPTER SIX
STRATEGIC POLICIES FOR IMPROVING FOREGIN DIRECT INVESTMENT
DESIRABILITY IN UGANDA’S ECONOMY
6.1 Introduction:
This section discusses possible strategies for maximizing benefits of FDI in Uganda’s
economy. For the government to succeed in achieving its development objectives through
FDI, it has to consider different stakeholders’ groups, and their interests and expectations.
International experiences are also internalized into the discussion. Strategic issues facing
the economy are identified; why they are strategic? What are the consequences of not
addressing the issues? This study answers the question of why the Government of
Uganda is facing opposition now when it tends to adopt micro policies, than ever before
when it implemented macro policies. This study ends by discussing alternative strategies
to be pursued by the Government of Uganda.
6.2 The stakeholders’ Analysis:
Developing strategic issues needs understanding of stakeholders that affected or are
affected by FDI policies, criteria they use to assess the performance of FDI and how well
the Government of Uganda performs against those criteria. In analyzing how various
stakeholders influence FDI in Uganda, this study uses Power versus Interest grid analysis.
This analysis accommodates political issues at hand, and stakeholders that affect FDI in
the future. Four categories of stakeholders are identified: 1) players are those who have
significant interest and power, 2) subjects are those who have power but little interest, 3)
context setters are those that have power but little direct interest, and 4) members of the
‘crowd’ are those with little interest and little power as done in illustration 2 below.

103
Hence, this analysis identified key players in the economy, those people whose power
must be taken into consideration, the need for collaboration in creating strategic issues.
This study looks at what the Government of Uganda needs from each group. In the
section of players, which include the president, executive and heads of department, they
are supposed to be initiators and champions in instilling the spirit of developing
alternative strategies in order to maximize benefits from FDI. These include pushing for a
breakthrough into the creation of regional integration (East African Community),
maintaining good political relations with Kenya and Tanzania, seeking funding from
Subjects
Foreign investors
Donors
TNC agents
Trade associations
Private sector Fondtn
Players
President
Executives
Ministries (finance and
trade and tourism, etc)
Heads of departments
Crowd
Property owners (land
etc)
Consumers
Society
Civic society
Farmers
Context setters
Legislatures
Local government
land board
Local councils
Neighboring countries
Traditional leaders
Environmentalists
Low
High
Inte
rest
Illustration 2: Power versus Interest
Grid Analysis
Low High
Power
Source: Eden and Ackermann, 1998.p.122, adapted in Bryson 2004 p.338. Strategic Planning in Public and Non-for Profit Organizations, Jossy –Bass Publication.

104
NEPAD and Donors to upgrade railways and road networks to the sea. Internally, they
are supposed to work together with traditional leaders, communal land owners, and
political parties. Players are satisfied when TNCs promote growth and economic
development.
Subjects also need attention from the Government of Uganda. TNCs need cheap transport
to the sea, low cost of utilities, domestic confidence, and not economic nationalism, as
well as land for large scale production. Donors would like to see a private sector led
economy, less corrupt government, reduction in regulations, and reduced cost of doing
businesses in the economy. TNC agents, including those who have developed linkages
naturally with TNCs expect greater utilization of their inputs by TNCs. Trade unions
want good labor standards, and safe working environments. Importers and exporters want
the number of procedures reduced, and improved infrastructural services.
Context setters are really very important for developing collaboration strategy.
Legislatures from Northern Uganda want to maintain the communal property right
ownership of land to their constituencies, and ready to go for war if players proceed to
allocating land to foreign investors. Environmentalists want preservation of natural
forests and forest reserves, which the Government of Uganda is giving to foreign
investors to be withheld.
The crowd including land owners wants to keep land for future generations. Society
expects corporate social responsibility from TNCS, while civil society emphasizes TNCs’
105
fair business practices, respecting the country’s cultural values and redistribution.
Farmers expect TNCs to buy their products.
This study prioritizes stakeholders that have to be involved in strategic planning if
Uganda’s economy is to benefit from FDI. These include all the major players listed
above, TNCs and donors, legislatures, local councils and environmentalists, land owners
and civil society organizations.
6.3 Applying SWOC Analysis:
The acronym SWOC means strengths and weaknesses which are related to internal
environment, opportunities and challenges relate to the external environment. SWOC
analysis of Uganda’s economy is presented in appendix D, provides benchmark for
identifying strategic issues. Although, Uganda’s economy has achieved strong
macroeconomic stability that is needed for exploiting numerous opportunities that exist in
the economy, these are static benefits at macro levels. Translating benefits to nearly all
the population would allow the economy, not only to win the confidence of foreign
investors, but also domestic confidence, which is a dynamic approach that corrects
weaknesses and challenges in the economy.
6.4. Identifying strategic issues facing Uganda’s Economy:
This study focuses on what the Government of Uganda is expected to do, but not what
government should do. What government should do is usually based on intended
objective of changing the way government runs FDI related activities (set of criteria
which the economy must meet), but what government is expected to do only brings in

106
ideas that might be useful for exploiting benefits from FDI if other things are improved
on. This study also internalizes the international experience of countries that have
strategically succeeded in adopting FDI policies to answer some of policy questions:
1. How can Government of Uganda address the energy crisis in the economy?
There is a natural barrier in this sector that creates monopoly, which is characterized by
heavy capital investment and sunk costs. This makes entry into the sector limited. Even if
it is opened to private developers, the marginal cost of providing it to additional
consumers is low, and this leads to under consumption. There is always political
economy of regulation through price ceiling.
2. How can Government of Uganda improve on its cheap transport to the sea?
There are long delivery periods and delays to Uganda’s exporters that reduce the
competitiveness of manufacturing enterprises, coupled by the persistent high cost of
transport to the sea.
3. How can land be made available to foreign investors?
The constitution of Uganda does not allow investors to own land, unless it is organized
through joint ventures with local investors, yet the acquisition of land is a key milestone
to the implementation of any planned project.
4. How can Government of Uganda support and deepen linkages between foreign and
domestic enterprises?
Linkages have only developed naturally between few TNCs and SMEs. There is poor
development of local enterprises to benefit from spillovers in terms of employment, local
skills, technological coping from TNCs, and solving limited market for their products.

107
5. How can uneven regional distribution of FDI be minimized?
There is regional concentration of TNCs in the central. Also, there is poor infrastructural
development in regions with few or inadequate FDI.
6. How can Government of Uganda tackle persistent corruption?
Foreign firms in Uganda pay bribes when seeking public utilities and this has affected
their operations.
7. How can Government of Uganda improve on low purchasing power in domestic
market? There is high income poverty in Uganda which affects the market-oriented
foreign investors due to low demand.
6.4.1 Prioritizing strategic issues:
This study subjects the above seven strategic issues to litmus test. 1 The following issues
are prioritized accordingly:
1. Addressing the energy crisis in the economy comes first because it determines
productivity and competitiveness in the manufacturing sector. The high cost of
production affects locational decisions of already existing and prospective TNCs. In
addition, there is under productivity of non tradables because the economy can not
meet production targets.
2. Improving on access to the sea comes second. This is needed to ease exporters’
accessibility to regional markets, and reduce costs and delays to the sea. It involves
political negotiations and compromises to finalize the materialization of East African
Community, plus donor‘s assistance in funding infrastructural projects.
108
3. Land availability to foreign investors comes third reflecting the recent lead trend in
entry mode through greenfield that are needed in commercial agriculture, and
increasing production capacity of essential investments like sugar industry. Also,
foreign investors will be driven more towards services which tend to be market
oriented, rather than in the primary sector where most of the poor are employed.
Failures to manage politicians and communal land ownership means continuity in the
subsistence production with no linkages to the supply resourced-oriented FDI.
4. Supporting and deepening linkages between domestic and foreign enterprises comes
fourth. Linkages are needed in building a dynamic private sector led economy, which
is characterized by positive externalities capable of achieving development objectives
of reduced poverty, sustained employment, business competition among others.
5. Tackling persistent corruption comes fifth. It will allow the SMEs grow, and investors
will also respond positively to investment opportunities in Uganda’s economy.
6. Last is the regional distribution of FDI enterprises which are needed for the balanced
development in underdeveloped regions.
_________________________ 1Litmus test identifies and frames strategic issues, categorizes whether the issue is operational or strategic. Issues which require significant policy board involvement; very challenging that needed different stakeholders than a single party; requiring changes in objectives, development of new program and funding plus long effects on the economy are strategic While issues which do not require significant policy board involvement; not very challenging in management of stakeholders a single party; do not require changing objectives, and do not need the development of new program and funding plus long no effects on the economy are operational (Bryson2004, p.95: strategic planning in public organizations, Jossey-Bass Publication).

109
6.5 How Can the Government of Uganda Formulate and adopt
strategic plan for FDI attraction?
1. What is required?
The plan the government of Uganda can pursue is the grand strategy, especially in the
energy development, improving access to the sea, land development, linkages and
regional distribution of foreign investors. In this strategic plan, the Government of
Uganda always responds to the environment in a crisis planning rather than a deliberate
plan. While the deliberate strategy in energy development, cheap access to sea, land
development, deepening linkages and regional distribution remains fundamentally
essential, things don’t always work as planned, crisis planning should be maintained on
energy sector that depends on nature (volume of water in Lake Victoria) characterized by
period of drought as well as improving access to sea, and involves political compromise
in policy development and implementation of agreements between Uganda, Kenya and
Tanzania.
2. What action steps government has to pursue?
a) In the energy sector: TNCs operate below capacity due to inadequate power and load
shedding. Hence, further liberalization and privatization is expected to encourage private
investments in dams through greenfield and joint ventures. Also, it has to maximize the
window opportunity of donor’s support to the private sector led economy to finance
energy development, plus the NEPAD’s support in energy development. Government of
Uganda can use the system of build-transfer-operate scheme as practiced in China,
Vietnam, and Malaysia. 3 This transfer system of power production to private sector

110
minimizes management costs; reduces corruption that is rampant during utility
connections.
Furthermore, doing it the south-south way is very important. Government of Uganda has
to target South African investors because of their long term commitment in the energy
sector. With the already existing investors such as Eskom and Umeme companies Ltd,
targeted incentives can be used to exploit the opportunity rather than relying only donor
funded projects, through Joint ventures and franchise rights. Also, a more operational
goal is to use energy saving bulbs and solar panels.
b) On easing access to the sea: Uganda is a landlocked country, and its infrastructure
suffers poor maintenance and negligence. Government of Uganda is expected to promote
FDI in infrastructure development, through joint development funds for infrastructure
upgrading between Kenya and The Republic of Tanzania. Illustrative case can be seen in
Kazakhstan’s role in overcoming the “tyranny of geography.” 4
It is 2000 Km from the
sea, but received $2.6 billion of FDI in 2002, the highest among all landlocked
developing countries. Its uniqueness is that major investors do not originate from
neighboring countries, but from USA that leads, followed by UK, Canada and Italy.
However, comparatively, Uganda is only 1,200 Km to the sea, though it is not that rich in
natural resources like oil deposits and natural gas, but can internalize the collaboration
strategy with foreign companies, that have been the central resource development in
Kazakhstan, especially, in the pipeline, distribution of power, gas and water,
characterized companies’ role in easing the cost of doing. Hence, it is possible to
overcome geographical constraints when supported by policy makers in any host
111
economy. GOU has to improve on the utilization capacity of ODA in infrastructural
development and upgrading of road and railways. This is evident from the experience of
the fastest- growing economies (Malaysia, South Korea, Hong Kong and Taiwan) before
financial crises of 1990s. It is important to invest in capital rather consumption.
More importantly is the continuous maintenance of political support and acknowledging
the significance of political compromises in regional initiatives. For example, China
benefited much from FDI by improving its relations with North Korea and Taiwan.
Bolivia and Paraguay are good examples of landlocked developing countries that have
enhanced their ability to overcome geographical limitations via regional integration.
Bolivia belongs to Latin American Integration Association (LAIA) and the Andean
Community, and has a free trade agreement with MERCOSUR (The Southern Common
Market). Paraguay is a member of MENSOCUR, and has a special status with Adean
Community. Moreover, these regional blocks have some negotiating power with other
trading blocks, including Free Trade Areas of America (FTAA).
In a similar line of thinking, the inland location of Uganda provides an easy access to
East African Countries that have become the hub of regional activities to serve the entire
region, thus it is an opportunity because neighboring countries have become trading
partners, and this opens up the gate for Uganda to attract the Headquarters of TNCs. In
further respond to FDI and geography, creating competitiveness in areas that are less
sensitive to transport costs, development of needed skills and technology are viable

112
strategies. Uzbekistan success in attracting FDI in its telecommunications industry
provides an example that accounted for 1/3 of FDI stocks in 1997.
c) Addressing land question: The constitution of Uganda does not allow investors to own
land; instead land belongs to the community. Hence, there is need for political
compromise and transparent land policy of the affected community. Hence, transition
from communal ownership to private ownership takes time as peasantry gets absorbed in
the capitalist world. For instance, most of the countries that emerged out of feudalism to
private ownership did it through political strategy of concessions rather than for the sake
of market oriented economy. In Uganda, where most of the land ownership is defined by
the customary arrangements, no force is necessary because Uganda is a signatory of
United Nations (equal access to property rights is the fundamental right of humankind).
Stakeholders should be involved in the strategic investment planning to facilitate land
accessibility to prospective investors. Even districts should avail lists of lands available to
investors, including those for sales and leasing through concessions. Private investors
should deal with land owners directly to facilitate land leasing. These arrangements
reduce the problem of relying only on UIA for land acquisition.
d) On supporting and deepening TNC-SME linkages. There is poor development of local
enterprises to benefit from spillovers. Hence, TNCs are expected to outsource local firms
in construction, professional services, and non core services such as cleaning. Giving
SMEs the distributional role of their products remains a viable option. More loans to
manufacturers are needed because they dominate FDI activities, plus an integrated
113
funding to SMEs from development banks. UIA is expected to target specific subsets of
TNCs, on top of providing information on new suppliers. For example, Malaysia used
targeted incentives for specific subsets of TNCs.5 TNCs then transferred technology to
local firms, training suppliers and agents, sharing information and financial support.
The role UIA is to focus on skills enhancement, which is needed to shape the absorptive
capacity, in addition to attracting lead firms for future specialization. The promotion of
business linkages is likely to be successful, only if a systematic policy approach is
adopted for all factors influencing linkages, and can lead to spillovers. We can learn from
the examples of Thailand, Ireland, Singapore and Taiwan.6 Ireland focused on attracting
quality FDI rather than upgrading existing FDI, and then later emphasized on linkages.
Similarly, Singapore had been having industrial strategy in promotional-seeking of FDI
through EPZs to reduce transaction costs to foreign investors, and employed relevant
skills upgrading on top of industrial policies, macroeconomic and infrastructure support.
As noted earlier on that the country’s capability to maximize FDI spillovers depends on
the absorptive capacity in the host economy, Malaysia and India have good educational
policy to shape absorptive capacity and SMEs linkages, appropriate local incentives for
local sourcing and give research institutions incentives for their findings. Malaysia is one
of those countries with a relatively clear policy focus, with FDI explicitly playing a
prominent role within its industrialization strategy.7 Malaysia and Thailand pursued
active industrial policies and promote local enterprises in certain activities, but adopted
effectively open door, non interventionist policies in some export oriented industry.

114
Singapore sought heavy TNCs participation in deepening manufacturing, promoting
linkages and increasing local capabilities, based on strong selective aspects to practically
all interventions. These are wealth of experiences that can be internalized according to
development needs of the economy like Uganda that needs to deepen SMEs linkages.
e) Tackling persistent corruption: Government of Uganda is expected to tackle
corruption seriously. The Sector Survey of 2005 ranked corruption as the second most
hindrance after volatile exchange rate. Foreign firms in Uganda pay bribes when seeking
public utilities and this has affected their operations. Government of Uganda needs to
institute ombudsman that is powerful, to check on the unethical behaviors of bureaucrats.
They should be given the authority to report independently, propose dismissals of public
officials caught in the act. More so, an independent court should be instituted for trying
those who are involved, especially in the commercial courts of justice.
e) On uneven regional development: Uganda’s government is facing opposition from
communal land owners, because land belongs to the community not government.
Government of Uganda is expected to provide incentives for regional development so as
to correct the market failure in allocation, and up country incentive rate should be
increased from 75% to 100% to spur industrial growth in the regions where infrastructure
is inadequate to influence locational decisions of TNCs. In addition, UIA should be
targeting specific activities to exploit regional advantages.
_____________________ 3UNCTAD (1996, p.22) 4UNCTAD (2003b, p.4-5, 8&11) 5UNCTAD (2002, p.206)
6Te Velde (2001, p.29 &42-47) 7OECD (2005, p.11-12) & UNCTAD (2006b, p.10-13)

115
CHAPTER SEVEN
RECOMMENDATIONS AND CONCLUSIONS
7.1 Introduction and Major Suggestions:
This section highlights recommendations to identified strategic issues, conclusions,
limitation of the study, and the future research agenda. Government of Uganda needs to
liberalize the energy sector, not only by allowing TNCs rely on their self-provided
generators. Opening up the energy sector will provide alternative sources of energy, in
which private developers can have joint ventures with government and other
development partners to develop dams. This relieves the economy’s reliance on Owen
Falls Dam as the only main source of power. Hence, establishing low-cost operating
environment, including power development and employing the latest technology reduces
risks in the economy of relying on hydro as the only source of power.
Easing access to the sea needs provision of political risk incentives to targeted investors.
Political risk incentives will encourage private developers to inject money in transport
development that tends to be characterized by oligolispolistic conditions. This results
from heavy capital investment, high risk of political interferences and sunk costs. This
study recommends the need to use ODA in capital investment for upgrading railways
lines and roads to the sea, in addition to maintaining good political relations with Kenya
and Tanzania.
Encouraging Corporate Social Responsibility in social and infrastructural services
reduces poor perception on FDI role as a development alternative. This improves on the
116
domestic confidence, and communal land ownership can lease their land to TNCs. Ease
restrictions on land ownership by managing stakeholders.
Enhancing FDI spillovers remains the sole role the GOU has to pursue, through targeting
specific industries of potential success is needed for promoting development of TNC-
SME linkages, which have only evolved naturally in Uganda. Cases from Malaysia,
Singapore and Ireland have shown that deliberate linkages have greater impact on host
economies; hence developing economy like Uganda needs to target specific industries.
Furthermore, policies for long term financing are viable options for strengthening SMEs
in export development. The approach to Multi-Facility Economic zones need to be
speeded up, in order to realize increased exports and linkage developments. Quality
government information is also useful for developing good TNC-SME linkages,
especially, on area of technological transfers and sourcing. This information shows the
need for particular types of technology that is relevant to the host’s capabilities and
development. Hence, training is expected to be extended to SMEs for strengthening their
capability, and more so to particular areas where spillovers effects from TNCs.
In addition, Government of Uganda’s role in minimizing uneven regional distribution of
TNC activities is very essential in realizing the Poverty Reduction Action Plan of
increasing household incomes. Hence, government can target specific sets of FDI to
invest in different regions in the economy by using of targeted subsidies.
117
In conclusions, fiscal incentives are necessary evils for Uganda’s economy which has not
yet evolved truly in laying the basic foundations for a viable private sector led economy.
Third generation policy helps in attracting FDI to host development objectives, makes it
possible to attract export oriented FDI rather resource–seeking FDI. The role of UIA has
been very effective in general marketing to attract FDI, but not much in targeting specific
types of FDI which could turn around the economy, where direct marketing works well
rather than using embassies for distributing investment materials, and managing land
owners who leased land to foreign investors. FDI alone is not a necessary condition for
economic development unless it is complemented by the host policies in increasing the
absorptive capacity for its spillovers. Hence, deliberate strategy avoids pursuance of
isolationism in national development objectives. This is because FDI benefits are not
automatic, and sometimes it tends to benefits few individuals and TNCs, hence deliberate
policy will direct host’s interest.
7.2 Limitation of the study:
This study only evaluated Government of Uganda’s efforts to use FDI as an alternative
development paradigm, based on benefits of FDI through spillovers, and policy options
for maximization. Taking empirical perspectives of foreign direct investors would be a
future gap to be filled.
7.3 Research Agenda for the future:
Based on the findings of the current thesis, the researcher was able to identify several
areas for potential future research as follows:

118
A thematic analysis of the role of President Museveni in making policy with regards
to FDI as an alternative development paradigm in Uganda’s Economy.
How regionalism impact on FDI into Uganda.
The role of FDI in reducing poverty in Uganda.
FDI and Official Development Aid, which does what and to what extent?
The Political Economy of land and FDI in Uganda.
Examining causes and the nature of corruption on TNCs in Uganda.

119
REFERENCES
Abdalla A Yusuf and Kenneth A Egesa (2005), TRADE AND GROWTH IN
AGRICULTURE: A Case Study of Uganda’s Export Potential within the Evolving
Multilateral Trading Regime. Bank of Uganda Working Paper 05/01.Bank of Uganda,
Kampala February 2005.
Bryson M. John (2004), Strategic PLANNING IN PUBLIC AND NON-PROFIT
ORGANIZATION: A Guide to Strengthening and Sustaining Organizational
Achievement, 3rd Edition, Jossey –Bass Publication
AfDB/OECD (2004), AFRICAN ECONOMIC OUTLOOK: Uganda Paris
AfDB/OECD (2006), AFRICAN ECONOMIC OUTLOOK: Uganda Paris
Asiedu Elizabeth (2004), POLICY REFORM AND FOREIGN DIRECT INVESTMENT IN
AFRICA: ABSOLUTE PROGRESS BUT RELATIVE DECLINE. Overseas Development
Institute, Volume 22, Number 1, January 2004, pp. 41-48(8)
Basu Anupam and Srinivasan (2002), FOREIGN DIRECT INVESTMENT IN AFRICA:
SOME CASE STUDIES. International Monetary Fund Working Paper WP/02/61.
Bende-Nabende Anthony (2002), GLOBALIZATION, FDI REGIONAL INTEGRATION
AND SUSTAINABLE DEVELOPMENT; THEORY, EVIDENCE AND POLICY. The business
school, The University of Birmingham, UK
Blomstrom M. and Kokko A. (2003), THE ECONOMICS OF FDI INCENTIVES,
Working Paper 168 January 2003.
Bora Bijit (2002), FDI RESEARCH ISSUES. Routledge publication
Campell White Oliver and Bhitia Anita (1996), DIRECTION IN DEVELOPMENT:

120
PRIVATIZATION IN AFRICA. The World Bank, Washington DC
Country Analysis Briefs: THE GREAT LAKES REGION COUNTRY ANALYSIS Feb 2004:
At <great Lakes Region Country Analysis Brief.htm>
CPI table - CPI 2006 - in focus - news room - home - Transparency
International.htm.
Duanjie Chen and Ritva Reinikka (1999), BUSINESS TAXATION IN A LOW – REVENUE
ECONOMY: A study on Uganda in Comparison with Neighboring Countries. The
World Bank Group, African Region Working Series No. 3
Dunning J.H (1981), TOWARD AN ECLECTIC THEORY OF INTERNATIONAL PRODUCTION,
Unwin Hyman, London
Dunning J.H (1995), REAPPRAISING THE ECLECTIC PARADIGM IN THE AGE ALLIANCE
OF CAPITALISM
Dunning H. John, 1998, GLOBALIZATION, TRADE AND FOREIGN DIRECT INVESTMENT.
Pergamon
Enderwick Peter (2005), TRANSACTIONAL CORPORATIONS; ATTRACTING DESIRABLE
FDI, THEORY AND EVIDENCE. UNCTAD New York and Geneva. Final report of the
eastern ministerial conference on the New Partnership for Africa’s Development
(NEPAD) Kampala, Uganda 13th
March 2002
Fredriksson Torbjorn (2003, p.1-8), TRANSACTIONAL CORPORATIONS; FORTY YEARS
OF UNCTAD RESEARCH ON FDI. Volume 12, No. 3, UNCTAD (December 2003).
Games Dianna (2004), THE EXPERIENCE OF SOUTH AFRICAN FIRMS IN DOING
BUSINESS IN AFRICA: A preliminary Survey and Analysis. The South African Institute
of International Affairs, Business in Africa Report No.1

121
Gekis Anastasia (2004), SOUTHERN AFRICAN DEVELOPMENT COMMUNITY ECONOMIC
IMPACT ASSESSMENT STUDY: Background Study: The Manufacturing Sector in
Southern Africa, The Services Group 8th January 2004
Gillis Malcolm, Roemer Michael, Radelet Steven, and Perkins Dwight (2001),
ECONOMICS OF DEVELOPMENT: Fifth Edition, Publisher: W. W. Norton & Company
Kehal H.S (2004), FDI IN DEVELOPING COUNTRIES. University of Sydney,
Australia. Palgrave Macmillan
Klein Michael (2004), BUILDING THE INVESTMENT CLIMATE PRACTICE, PSD Forum
April 20.
Klein Michaeal, Aaron Carl, and Hadjimichael Bita (2001), FOREIGN DIRECT
INVESTMENT AND POVERTY REDUCTION. World Bank, Washington D.C.
Kobrin J. Steven (2005), TRANSACTIONAL CORPORATIONS, Vol. 14, No. 1 (April,
2005)
MoFPED (2000), MEDIUM TERM COMPETITIVE STRATEGY FOR PRIVATE SECTOR
(2000-2005): Making Institutions support Private Sector Growth. July 2000 Kampala
_______ (2003), STATUTORY REPORTS TO PARLIAMENT ON PUBLIC ENTERPRISE REFORM
AND DIVESTITURE
MIGA (2004), INVESTING IN DEVELOPMENT SERIES. Washington D.C.
Moosa Imad (2002), FDI THEORY, EVIDENCE AND PRACTICE. Palgrave
Macmillan
Morriset and Olivier Neso (2002), TRANSACTIONAL CORPORATIONS, ADMINISTRATIVE
BARRIERS TO FOREIGN INVESTMENT IN DEVELOPING COUNTRIES, Vol. 11, No. 2 (August
2002)

122
Over Development Institute (2002), FOREIGN DIRECT INVESTMENT: WHO GAINS?
Briefing Paper April 2002. <www.odi.org.uk > 28th May 2006
OECD (2002), FDI for Development: MAXIMIZING BENEFITS, MINIMIZING COSTS:
Overview. Paris, France
______ (2003), CHECKLIST FOR FDI INCENTIVE POLICIES Available at
www.oecd.orgn 16th Dec. 2006
______ (2005), INVESTMENT FOR DEVELOPMENT: MAKING IT HAPPENS. 25-27 October
2005, Rio de Janeiro, Brazil. Published by Brazilian Government.
Petras James (2005), SIX MYTHS ABOUT THE BENEFITS FOREIGN INVESTMENT.
http://www.global policy.org/socecon/ffd/fdi/2005/0702sixmyths.htm 28th May 2006.
Private Sector Foundation (2005), COST OF DOING BUSINESS IN UGANDA. Policy
Advocacy Unit 2005
Privatization and Utility Reform Project - Uganda available at
http://www.perds.go.ug/ 16th Dec. 2006
Robinson D. Richard (1987), FDI: COSTS AND BENEFITS. Praeger Publishers, NY
USA
Seid H. Sherif (2002), GLOBAL REGULATION OF FDI. Ashgate Publishing Ltd,
England
Sida (2004), FDI IN AFRICA- DO THEY REDUCE POVERTY? Paper presented at AERC
senior policy seminar VI in Kampala, 2-4 March, 2004.
Stoever A. William (2002), TRANSACTIONAL CORPORATIONS; ATTEMPTING TO THE
ATTRACTION-AVERSION DILEMMA: A STUDY OF FDI POLICY IN KOREA. Published by
UNCTAD, Vol. 2, No. 1 April 2002

123
Te Velde (2001), POLICIES TOWARDS FOREIGN DIRECT INVESTMENT IN DEVELOPING
COUNTRIES: Overseas development institute, London March 2001
The Heritage Foundation <Index of Economic Freedom 2006 – countries.htm>
UBOS (2004), PRIVATE SECTOR INVESTMENT AND INVESTMENT PERCEPTION IN
UGANDA REPORT 2003. June 2004
UEPB (2004), Annual Report April 2003
______ (2004), INCREASING INCOME THROUGH EXPORTS. August 2004
______Annual Report 2004
______ (2006), EXPORT PERFORMANCE ANALYSIS 2005 – Uganda July 2006
Uganda Investment Authority 1999/2000 Annual Report and Accounts
UNCTAD (1992), World Investment Report: TNCS AS ENGINES OF GROWTH, New
York and Geneva.
________ (1993), World Investment Report: TRANSNATIONAL CORPORATIONS AND
INTEGRATED INTERNATIONAL PRODUCTION, New York and Geneva.
________ (1994), World Investment Report: TRANSNATIONAL CORPORATIONS,
EMPLOYMENT AND THE WORKPLACE, New York and Geneva
________ (1995), World Investment Report: TRANSNATIONAL CORPORATIONS AND
COMPETITIVENESS, New York and Geneva
________ (1996), World Investment Report: Investment, Trade and International
Policy Arrangements, New York and Geneva
________ (1997), World Investment Report: TRANSNATIONAL CORPORATIONS, MARKET
STRUCTURE AND COMPETITION POLICY, New York and Geneva
________ (1998), World Investment Report: TRENDS AND DETERMINANTS, NY/Geneva

124
________ (1999), World Investment Report: FDI AND DEVELOPMENT, NY, United
Nations
________ (2000), World Investment Report: FDI AND THE CHALLENGE OF
DEVELOPMENT, New York and Geneva
_______ (2000a), UGANDA INVESTMENT POLICY REVIEW, New York and Geneva.
________ (2001), World Investment Report: PROMOTING LINKAGES. New York and
Geneva
________ (2002), world Investment Report: TRANSNATIONAL CORPORATIONS AND
EXPORT COMPETITIVENESS, New York and Geneva
________ (2003a), Development Dimension of FDI: POLICY AND RULE-MAKING
PERSPECTIVES; Proceedings of the expert meeting held in Geneva from 6 to 8
November 2002, United Nations, New York and Geneva
________ (2003b), FDI IN LANDLOCKED DEVELOPING COUNTRIES AT A GLANCE,
NY/Geneva
________ (2005), Economic Development in Africa: RETHINKING THE ROLE OF
FOREIGN DIRECT INVESTMENT (p.64-83). United Nations, New York and Geneva.
________ (2006), World Investment Report: FDI FROM DEVELOPING AND TRANSITION
ECONOMIES: Implications for Development
________ (2006a), GLOBALIZATION OF R&D AND DEVELOPING COUNTRIES, NY/GEneva
________ (2006b, PROMOTING TNC-SME LINKAGES TO ENHANCE THE PRODUCTIVITY
CAPACITY OF DEVELOPING COUNTRIES' FIRMS, Geneva, 21-24 February 2006 tenth
Session by trade and development board
UNCTAD WID – Country Profile: Uganda Posted date: November 2006

125
UNIDO (2002), FD INVESTOR PERCEPTION IN SUB SAHARAN AFRICA: UNIDO Pilot
Survey in Ethiopia, Nigeria, Uganda, Republic of Tanzania
_______ (2003), AFRICAN FOREIGN INVESTOR SURVEY: MOTIVATIONS, OPERATIONS AND
FUTURE PLANS - IMPLICATIONS FOR INVESTMENT PROMOTION. Vienna.
______ (2006), AFRICA FOREIGN INVESTOR SURVEY 2005: UNDERSTANDING THE
CONTRIBUTIONS OF DIFFERENT INVESTOR CATEGORIES TO DEVELOPMENT IMPLICATIONS
FOR TARGETING STRATEGIES. Investment and Technology Branch, Vienna
United Nations (2004), AN INVESTMENT GUIDE TO UGANDA OPPORTUNITIES AND
CONDITIONS. NY
____ (2005), AN INVESTMENT GUIDE TO THE EAC: OPPORTUNITIES AND CONDITIONS.
New York and Geneva, July 2005
USAID (2002), The PATH FORWARD FOR UGANDA’S COTTON AND TEXTILE SECTOR.
Svensson Jacob (2000), WHO MUST PAY BRIBES AND HOW MUCH? EVIDENCE FROM
CROSS -SECTION OF FIRMS. The World Bank Development Research Group
Macroeconomic and Growth November 2000. Policy Research Working Paper 2486
Wei Y.N and Balasubramyam (2004), FOREIGN DIRECT INVESTMENT SIX COUNTRY
CASE STUDIES. Center for international business studies, university of Leeds, UK
Wood David (2001), ‘THE NEXT CRISIS’, DIRECT AND EQUITY INVESTMENT IN
DEVELOPING COUNTRIES. Zed Books, London and New York.
World Bank (2004), COMPETING IN THE GLOBAL ECONOMY: An Investment
Assessment for Uganda
World development indicators, April 2006
http://devdata.worldbank.org/external/CPProfile.asp?CCODE=UGA&PTYPE=CP
17th Dec. 2006
www.monitor.co.ug/ business news
www.vision.co.ug/business news
www.ugandainvest.com accessed on 16th December 2006
126
APPENDICES
A. Lists of public enterprises not yet privatized – Uganda
1. Diary Corporation Ltd
2. Kinyara sugar works Ltd
3. Uganda seeds Ltd
4. Housing Finance Company of Uganda
5. National Social Security Fund
6. Post Bank Uganda Ltd
7. Uganda Development Bank
8. National Insurance Corporation (Privatization quite advanced)
9. Kilembe Mines Ltd
10. Uganda Development Corporation (Lake Katwe Project)
11. Uganda Posts Ltd
12. New Vision Printing and Publishing Corporation
13. National Housing and Construction Corporation
14. Mandela National Stadium
15. Uganda Railway Corporation
16. National Water and Sewage Corporation
__________
United Nations (2005, p. 96): An Investment Guide to the EAC: Opportunities and Conditions. New York
and Geneva, July 2005

127
B. List of completed privatization Transactions in Uganda
as per 1st December 2002
No
.
Enterprise Buyer Date Participa
nt
Method Amoun
t (Ushs)
1 Acholi Inn MS Laoo Ltd May 1995 Ugandan Sale of assets 235 m
2 African Ceramic Co. Muhindo Enterprise Ltd May 1996 Ugandan Sale of assets 0.270 bn
3 African Textile Mills P/S Patel May 1996 Uganda Share sale 1.4 bn
4 Agip (U) Ltd Agip Petrol International May 1996 Foreign Share sale 1.675
bn
5. Agricultural Enterprises
Ltd
Common Development Corp Oct 1993 Foreign Join Venture US$12.
7m*
6 Apollo Hotel
Corporation Ltd
MIDROC Ethiopia p/c March
2001
Foreign Sale of share US$18
m*
7 Bank of Baroda Bank of Baroda (India) June 1999 Foreign Shares/pre-
emptive rights
2.5 bn
8 Barclays Bank of
Uganda Ltd
Barclays P/c Oct 1998 Foreign Shares/pre-
emptive rights
5 bn
9 BAT BAT Investments Ltd Sep 1999 Foreign Shares/pre-
emptive rights
US$ 7m
10 BAT Various
June 2000 Ugandan Initial public
offering -USE
Shs
1,000
per
share
11 Blenders (U) Ltd Unilever Overseas Holding BVC Aug 1994 Foreign Share sale US$531
,586
12 Comrade Cycles (U) Ltd Uganda Motors Ltd Jan 1997 Ugandan Share sale n/a
13 East African Distilleries International distillers and vintners Nov 1992 Foreign Share sale US$ 600,000
14 Government Central
Purchasing Corp.
Management and employees July 2000 Ugandan Management
buyout
1.09bn
15 Hilltop Hotel Three Links Ltd May 1995 Ugandan Sale of assets 35 m
16 Hotel Margherita Reco Industries Ltd Aug 1994 Ugandan Sale of assets US$
400,000
17 ITV sales ROKO construction Dec 1996 Foreign Sale of assets 0.32bn
18 Kakira Sugar Works East African Holdings Ltd July 2000 Foreign Shares/pre-
emptive rights
3.5bn
19 Kampala Auto
Centre(Gomba Motors
Ltd)
Management Nov 1995 Ugandan Auction 0.110bn
20 Kibimba Rice Co. Ltd Tilda holdings Sep 1996 Foreign Share sale 1.607bn
21 Lake Victoria bottling
Co. Ltd
Crown Bottlers (U) Ltd Feb 1993 Ugandan Share sale 6.46 bn
22 Lake Victoria Hotel Windsor Ltd Aug 1995 Foreign Share sale 3.06 bn
23 Lango Dev. Co Sunset International Ltd May 1998 Ugandan Share sale 0.1bn
24 Lira Hotel Showa trade Com. Ltd Jan 1995 Ugandan Sale of assets 250m
25 Masindi Hotel Ottoman Engineering Feb 2000 Ugandan Sale of assets US$500
,000
26 Motorcraft and sale Ltd Andami Works Ltd Sep 1996 Ugandan Share sale 0.200bn
27 Mt Elgon Hotel Busigu Cooperative Union May 1995 Ugandan Sale of assets 650m
28 Mt. Moroto Hotel Kodet International Nov 1995 Ugandan Sale of assets 40m

128
29 Mweya Safari Lodge Madhani Group Aug 1995 Ugandan concession 1.821bn
30 NEC Pharmaceuticals Ltd
Haupt Groupe Dec 1999 Foreign Joint venture US$1.5m
31 Printpak (U) Ltd New Printpak (U) Ltd May 1996 Uganda Management
buyout
0.9bn
32 Republic motors Rafiki trading com. Dec 1995 Ugandan Auction 0.395bn
33 Rock Hotel Swisa Industries Ltd Nov 1994 Ugandan Sale of assets 300m
34 SAIMMCO Still Rolling Mills Ltd Sep 1999 Ugandan Share sale 202m
35 Second National
Operator
MTN March
1998
Foreign concession US$5m
36 Shell (U) Ltd Shell Petroleum Co. Ltd Dec 1992 Foreign Debt/equity
swap
12.79bn
37 Soroti Hotel Speedbird Aviation services Ltd Jan 1995 Ugandan Sale of assets 150m
38 Stanbic Bank (U) Ltd SBIC Africa Holdings Ltd Dec 1996 Foreign Share sale 6.75bn
+150m
39 Steel Corporation of
Africa Ltd (SCEA)
Muljibhai Madhvani and Co. Ltd Jul 2000 Foreign Shares/preemp
tive rights
0.32bn
40 Total (U) Ltd Total Outre Mer March
1996
Foreign Share sale 5.7bn
41 Transocen 1998 (U) Ltd Coin Ltd Jul 2001 Ugandan Share sale 361m
42 TUMPECO GM Company Ltd Aug 1994 Ugandan Share sale US$700
,000+U
shs
429m
43 Uganda American
Insurance Company
American Life Insurance
Company
Nov 1992 Foreign Repossession n/a
44 Uganda Cement Industry- Hima
Rawals Group of Industries Dec 1994 Foreign Sale of assets US$20.5m
45 Uganda Cement
Industry – Tororo
Corrugated sheets Ltd Oct 1995 Foreign Sale of assets 5.75bn
46 Uganda Clays Ltd Various Oct 1999 Ugandan Initial Public
Offering -USE
Ushs
4,000/
share
47 Uganda Fisheries Ltd Nordic-African Fisheries Co. Ltd May 1995 Foreign Share sale US$1.1
m
49 Uganda Garment
Industries Ltd
Phoenix Logistics (U) Ltd Aug 2000 Ugandan Sale of assets US$0.5
m
50 Uganda Grain Milling
Co.
Calebs International Dec 1996 Ugandan Share sale 5.3bn
51 Uganda Hardwares Ltd Management Oct 1995 Ugandan Management
buyout
0.298bn
52 Uganda Hire Purchse
Co.
Tadeo Kisseka Nov 1999 Ugandan Auction 0.00024
bn
52 Uganda Industrial
Machinery Ltd
F.B Lukoma May 1997 Ugandan Share sale 7m
53 Uganda Leather and
Training Industry(ULTI)
IPS (U) Ltd Jul 1995 Ugandan Sale of assets 1.71bn
54 Uganda Meat Packers
Ltd (Kampala Plant)
Uganda meat Industries Ltd Aug 1995 Ugandan Sale of assets 0.7bn
55 Uganda Meat Packers –
Soroti
Teso Agricultural Industrial Co.
Ltd
Nov 1997 Ugandan Sale of assets 0.3bn
56 Uganda motors Ltd Management Nov 1995 Uganda Management 0.803bn

129
buyout
57 Uganda Pharmaceuticals Ltd
Vivi Holdings Jul 1996 Foreign Share sale 1.501bn
58 Uganda Securiko Ltd Securiko (U) Ltd Aug 1993 Foreign repossession n/a
59 Uganda Tea Corporation Mehta Group May 1994 Ugandan Repossession n/a
60 Uganda Telecom Detecom Jul 2000 Foreign Share sale US$33.
5-*
61 White Horse Inn Kabale Dev.Co.Ltd Aug 1994 Ugandan Sale of assets 600m
62 White Rhino Hotel Dolma Associates Ltd May 1995 Ugandan Sale of assets 200m
63 EUGCL Eskom Enterprises Nov 2002 Foreign Concession
64 Rwenzori Highland Tea
Company Ltd
Finlays Group May 2002 Foreign Share
sale/preemptiv
e rights
1.45bn
65 Kiryara Ranch Ziwwa Ranchers May 2002 Loca concession 0.800bn
Source: UNCTAD Data Base –Uganda
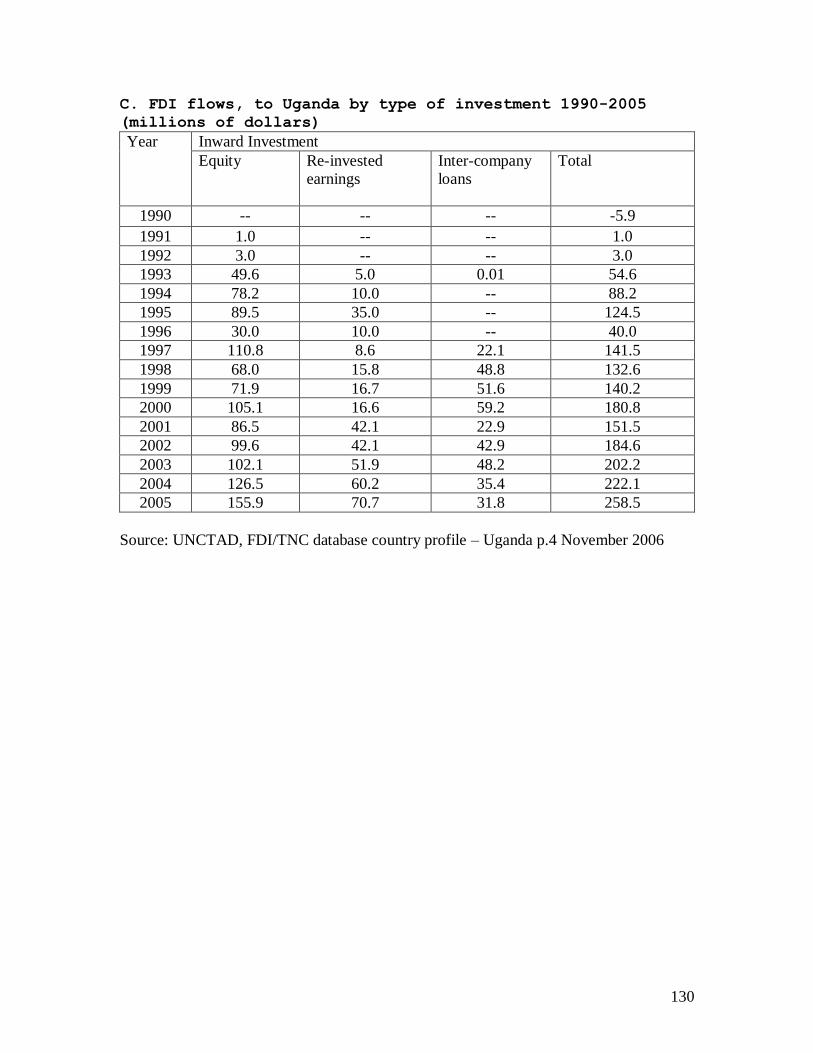
130
C. FDI flows, to Uganda by type of investment 1990-2005
(millions of dollars)
Year
Inward Investment
Equity Re-invested
earnings
Inter-company
loans
Total
1990 -- -- -- -5.9
1991 1.0 -- -- 1.0
1992 3.0 -- -- 3.0
1993 49.6 5.0 0.01 54.6
1994 78.2 10.0 -- 88.2
1995 89.5 35.0 -- 124.5
1996 30.0 10.0 -- 40.0
1997 110.8 8.6 22.1 141.5
1998 68.0 15.8 48.8 132.6
1999 71.9 16.7 51.6 140.2
2000 105.1 16.6 59.2 180.8
2001 86.5 42.1 22.9 151.5
2002 99.6 42.1 42.9 184.6
2003 102.1 51.9 48.2 202.2
2004 126.5 60.2 35.4 222.1
2005 155.9 70.7 31.8 258.5
Source: UNCTAD, FDI/TNC database country profile – Uganda p.4 November 2006
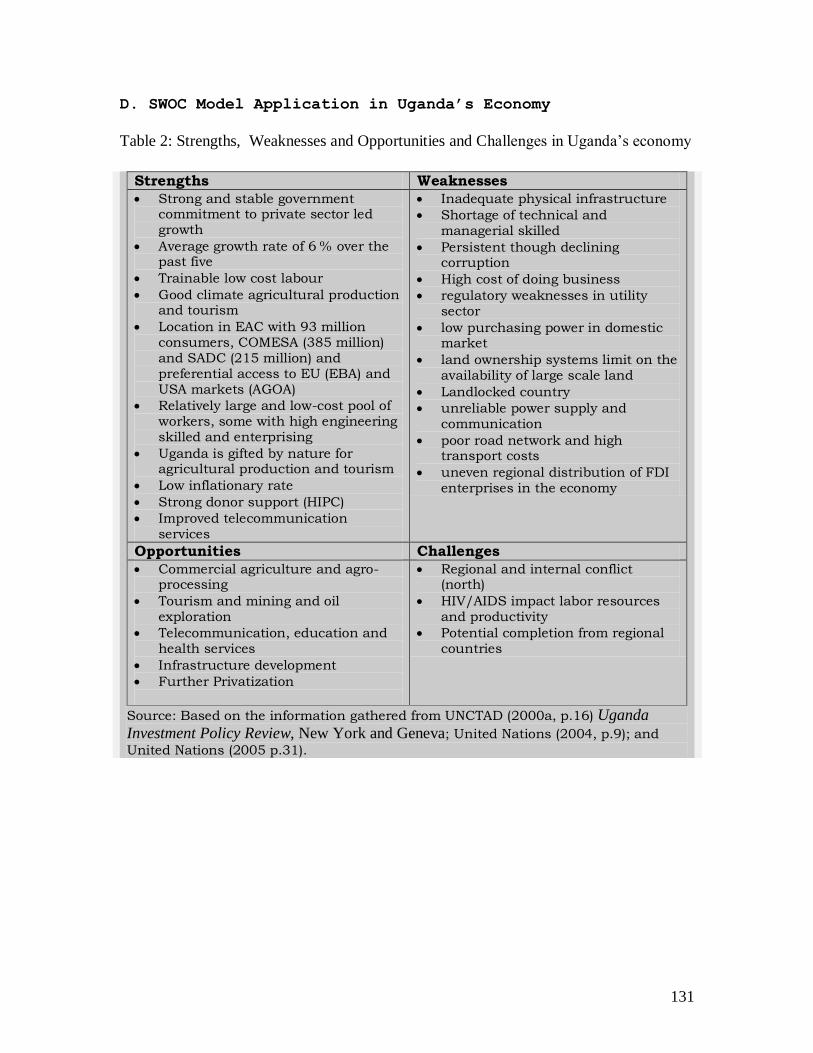
131
D. SWOC Model Application in Uganda’s Economy
Table 2: Strengths, Weaknesses and Opportunities and Challenges in Uganda’s economy
Strengths Weaknesses
Strong and stable government commitment to private sector led growth
Average growth rate of 6 % over the past five
Trainable low cost labour
Good climate agricultural production and tourism
Location in EAC with 93 million consumers, COMESA (385 million) and SADC (215 million) and preferential access to EU (EBA) and USA markets (AGOA)
Relatively large and low-cost pool of workers, some with high engineering skilled and enterprising
Uganda is gifted by nature for agricultural production and tourism
Low inflationary rate
Strong donor support (HIPC)
Improved telecommunication services
Inadequate physical infrastructure
Shortage of technical and managerial skilled
Persistent though declining corruption
High cost of doing business
regulatory weaknesses in utility sector
low purchasing power in domestic market
land ownership systems limit on the availability of large scale land
Landlocked country
unreliable power supply and communication
poor road network and high transport costs
uneven regional distribution of FDI enterprises in the economy
Opportunities Challenges
Commercial agriculture and agro-processing
Tourism and mining and oil exploration
Telecommunication, education and health services
Infrastructure development
Further Privatization
Regional and internal conflict (north)
HIV/AIDS impact labor resources and productivity
Potential completion from regional countries
Source: Based on the information gathered from UNCTAD (2000a, p.16) Uganda
Investment Policy Review, New York and Geneva; United Nations (2004, p.9); and
United Nations (2005 p.31).