introduction, technology, selection criteria installation...
TRANSCRIPT

Qatar Workshop on Measurement/Reporting
of Flare Gas
Doha, Qatar 8th and 9th May 2011
Facilitated by Lex Scheers Hint Services BV
Content 1 - Overview of Flare Gas Flow Meters Introduction, Technology, Selection Criteria
2 - Overview of Flare Gas Flow Meters Installation, Operation and Maintenance
3 - Gas Balancing and Gas Allocation
4 - Estimation of Errors and Uncertainty in Volume Measurement
6 - Advice on Improving/Redesigning Gas Measurement System in Qatar
5 - Methods for Estimating Flare and Vent Volumes

Qatar Workshop on Measurement/Reporting
of Flare Gas
Doha, Qatar 8th and 9th May 2011
Facilitated by Lex Scheers Hint Services BV
Overview of Flare Gas Flow Meters Introduction Technology - Flow Rate Measurement - Composition Measurement Selection Criteria

Qatar Workshop Doha, 8-9 May 2011 3
GAS
OIL
WATER
RESERVOIR GAS
WATER
WATER
DISPO
SAL
SALES GAS (Fiscal / Custody Transfer)
SALES OIL (Fiscal / Custody Transfer)
FLARE GAS, OWN USE
$
$ $
$
$
$
$ $ $
PRODUCTION FACILITY for each phase
Sin = Sout
The Product Balance
(Fiscal ???)

Qatar Workshop Doha, 8-9 May 2011 4
Fiscal/Sales Allocation • Taxation / royalty / sales • Production allocation to partners in joint pipelines
Reservoir Management • Maximize hydrocarbon recovery at prevailing economic and
technical conditions, e.g. • Planning primary, secondary and tertiary development • Depletion policy, Injection/production balance • Production forecast and future project ranking
Operational Control • Well surveillance • Artificial lift optimisation • Process and equipment performance • Flaring and Venting monitoring/reporting • Production targets and constraints • Allocate bulk measurements to individual wells or reservoir
Introduction - Production Measurements

Qatar Workshop Doha, 8-9 May 2011 5
For any production measurement device (incl. MPFM’s, VMS) we have to compare/consider
1) Costs (OpEx and CapEx), 2) Accuracy 3) “Value of Information”
4) Legislation 5) Reputation to select the optimum solution Production Measurement
Costs, Accuracy and Legislation are known
Determination of the “Value of Information” is more challenging
Reputation ???
The Value Loop
Interpretation &
Modeling
Data Gathering
Hydrocarbon Assets
Introduction - Costs, Accuracy and “Value of Information”
Qatar Workshop Doha, 8-9 May 2011 6
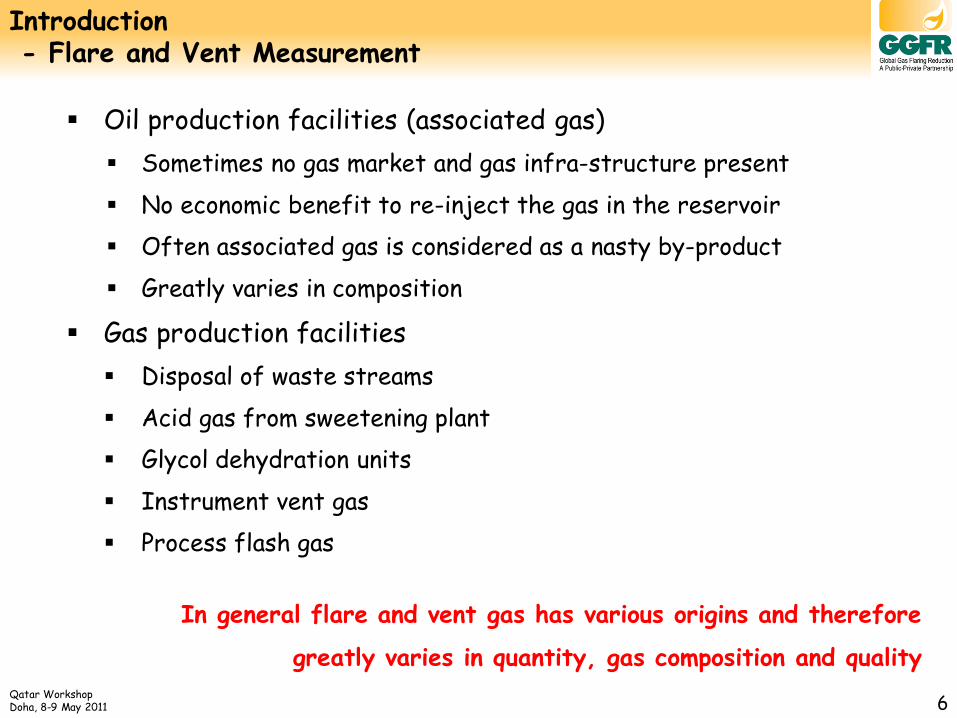
Introduction - Flare and Vent Measurement
Oil production facilities (associated gas)
Sometimes no gas market and gas infra-structure present
No economic benefit to re-inject the gas in the reservoir
Often associated gas is considered as a nasty by-product
Greatly varies in composition
Gas production facilities
Disposal of waste streams
Acid gas from sweetening plant
Glycol dehydration units
Instrument vent gas
Process flash gas
In general flare and vent gas has various origins and therefore
greatly varies in quantity, gas composition and quality

Qatar Workshop Doha, 8-9 May 2011 7
Tolerant to wet and dirty gas streams
Large turndown
Small waste streams during normal operations
Large streams during blow down, depressurization and emergengies
Independent of fluid properties (composition)
Installation without a facility shut-down
Full bore measurements
Accuracy of just a few percent
No upstream or downstream pipe requirements
Flow regime independent
On-site and simple calibration Hence, the ideal Flare Gas Meter
does not exist !!!
Introduction - What is the ideal Gas Flare/Vent Meter ?

Qatar Workshop Doha, 8-9 May 2011 8
Graphical Representation of a Flare Flow Measurement System
To Flare
Pressure (PT)
Analyzer (AT)
Temp (TT)
Flow (FT)
FE
Primary Devices
Pressure (PI)
Analyzer (AI)
Temp (TI)
Flow (FI)
Tertiary Devices (Indicators or DCS)
PE TE AE
Secondary Devices (Transmitters)

Qatar Workshop Doha, 8-9 May 2011 9
Specifications of a Flare Flow Measurement System
Uncertainty (at 95% confidence interval) 1 to 5% Repeatability 1% Turn-down ratio (Rangeability) 1:100 to 1:1000 Resolution 0.05% Pressure Drop low Design T & P Operating T & P Point, Multipoint, Path or Full Bore Measurement Protection/Safety
Mechanical Electrical
Others Weight Power Size (Dimensions) Data Processing Communication
Preference

Qatar Workshop Doha, 8-9 May 2011 10
v1, A1, P1 v2, A2, P2 Flow
v is fluid velocity A is area P is pressure.
At the same height in the flow: 2
221
2
2
121
1 vPvP
From continuity:
2211. AvAv
Combining:
2
1
2
22
221 1
A
AvP
Need to know the density
Bernoulli’s Equation - Application to the Orifice/Venturi/Pitot devices
!!!

Qatar Workshop Doha, 8-9 May 2011 11
Venturi tube
Type of Measurement p (Bernoulli)
Measurement point/path Cross Sectional Area
Diameter 2 to 48”
Rangeability 10:1
Straight pipe req’ments 6-20 D upstr. 2-40 D downstr.
Total pressure loss 10-20% of the p
P and T required ActVol = Yes, StdVol = Yes, Mass = Yes
Uncertainty approx. 1-3% full scale
Composition dependent Yes, need density
Suitable in wet/dirty gas Yes, small amounts
Other comments Eliminate pulsation

Qatar Workshop Doha, 8-9 May 2011 12
Type of Measurement p (Bernoulli)
Measurement point/path Cross Sectional Area
Diameter 1 to 72”
Rangeability 5:1
Straight pipe req’ments 6-20 D upstream, 2-40 D downstream
Total pressure loss High
P and T required ActVol = Yes, StdVol = Yes, Mass = Yes
Uncertainty approx. 2-4% full scale
Composition dependent Yes, need density
Suitable in wet/dirty gas Yes, small amounts (drainhole)
Other comments Pulsation
Orifice plate

Qatar Workshop Doha, 8-9 May 2011 13
(Averaging) Pitot tube
Type of Measurement p (Bernoulli)
Measurement point/path Point or Multipoint averaging
Diameter 1 to 72” (insertion)
Rangeability 3:1
Straight pipe req’ments 8-10 D upstream, 3 D downstream
Total pressure loss Low, Nil
P and T required ActVol = Yes, StdVol = Yes, Mass = Yes
Uncertainty approx. 1-5% full scale
Composition dependent Yes, need density
Suitable in wet/dirty gas Limited
Other comments Positioning critical
Endress & Hauser DP61D
Endress & Hauser DP62D
Qatar Workshop Doha, 8-9 May 2011 14
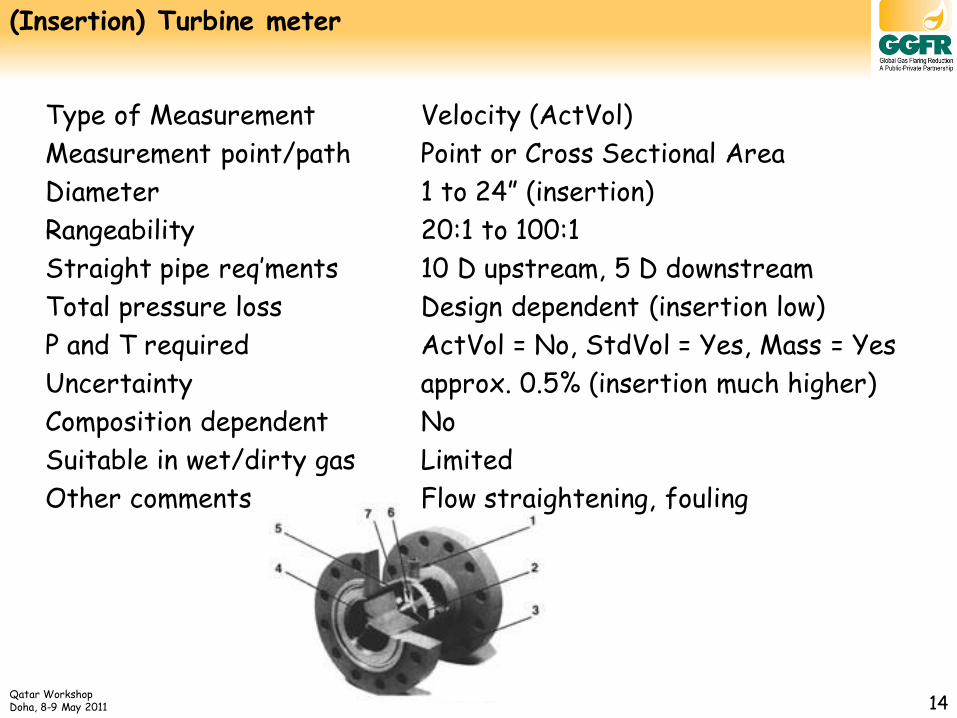
(Insertion) Turbine meter
Type of Measurement Velocity (ActVol)
Measurement point/path Point or Cross Sectional Area
Diameter 1 to 24” (insertion)
Rangeability 20:1 to 100:1
Straight pipe req’ments 10 D upstream, 5 D downstream
Total pressure loss Design dependent (insertion low)
P and T required ActVol = No, StdVol = Yes, Mass = Yes
Uncertainty approx. 0.5% (insertion much higher)
Composition dependent No
Suitable in wet/dirty gas Limited
Other comments Flow straightening, fouling

Qatar Workshop Doha, 8-9 May 2011 15
Vortex flow meter
Type of Measurement Velocity (ActVol)
Measurement point/path Cross Sectional Area
Diameter 1 to 24”
Rangeability 30:1
Straight pipe req’ments 10-20 D upstream, 5 D downstream
Total pressure loss Design dependent
P and T required ActVol = No, StdVol = Yes, Mass = Yes
Uncertainty approx. 2%
Composition dependent No
Suitable in wet/dirty gas Limited
Other comments Flow straightening, pulsation
Qatar Workshop Doha, 8-9 May 2011 16
m
BAAB
m
m
BA
m
AB
vD
Q
tt
Lv
vC
Lt
vC
Lt
.4
.
11.
)cos(.2
)cos(.
)cos(.
2
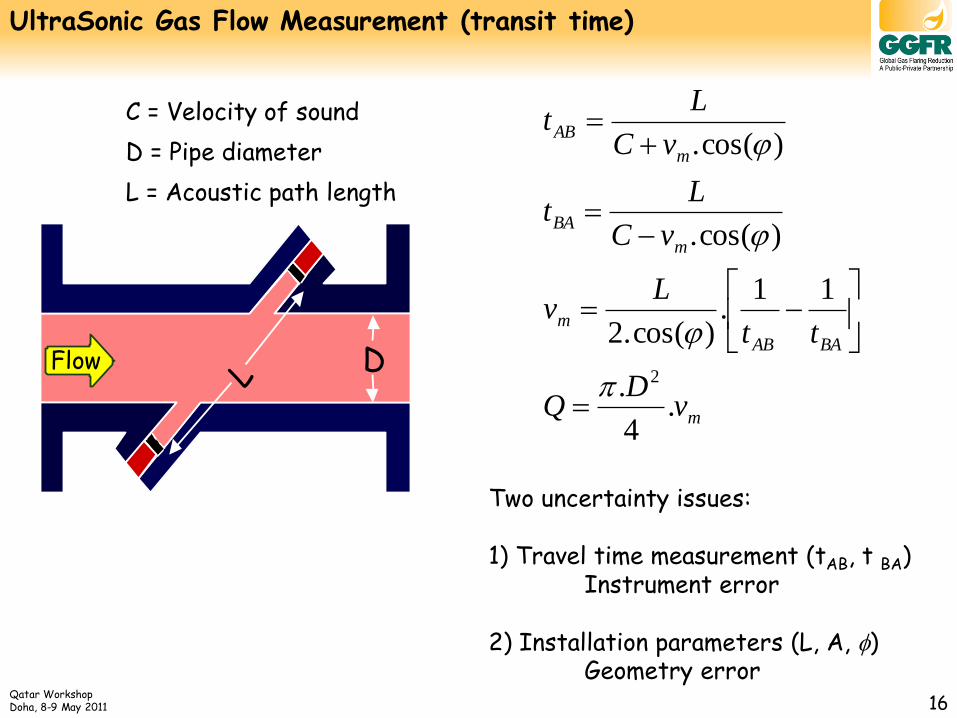
C = Velocity of sound
D = Pipe diameter
L = Acoustic path length
Flow D
UltraSonic Gas Flow Measurement (transit time)
Two uncertainty issues: 1) Travel time measurement (tAB, t BA) Instrument error 2) Installation parameters (L, A, f) Geometry error

Qatar Workshop Doha, 8-9 May 2011 17
UltraSonic Gas Flow Measurement (transit time)
Type of Measurement Velocity (ActVol)
Measurement point/path Path or multi-path
Diameter > 3”
Rangeability up to 2000:1
Straight pipe req’ments 10-30 D upstream, 5-10 D downstream
Total pressure loss Nil
P and T required ActVol = No, StdVol = Yes, Mass = Yes
Uncertainty approx. 1-5% (no of paths)
Composition dependent No
Suitable in wet/dirty gas Moderate (LVF < 0.5%)
Other comments Elimination of swirl
Note : Speed of sound (also measured) is related to density

Qatar Workshop Doha, 8-9 May 2011 18
Downstream Transducers
Upstream Transducers
Press
ure T
rans
mit
ter
Temperature Transmitter
Preamplifier
Digital Analog and Alarm Output
Inside view of a bias 90 flare gas installation
GE Sensing GF 868 Flare Gas Meter

Qatar Workshop Doha, 8-9 May 2011 19
Transducers
Fluenta FGM 160 Flare Gas Meter
Qatar Workshop Doha, 8-9 May 2011 20
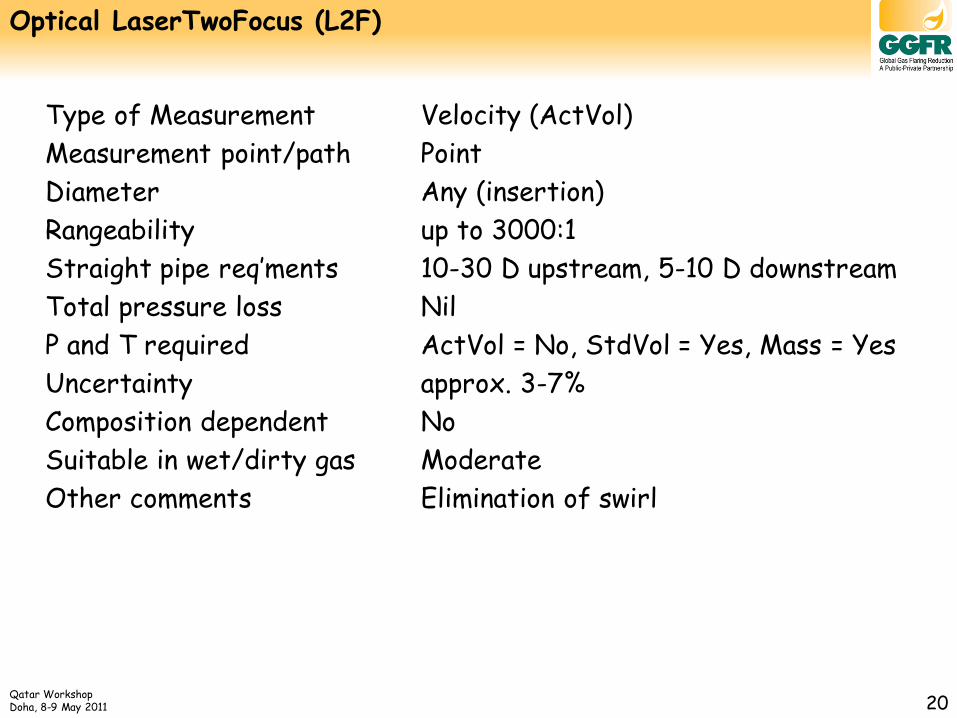
Type of Measurement Velocity (ActVol)
Measurement point/path Point
Diameter Any (insertion)
Rangeability up to 3000:1
Straight pipe req’ments 10-30 D upstream, 5-10 D downstream
Total pressure loss Nil
P and T required ActVol = No, StdVol = Yes, Mass = Yes
Uncertainty approx. 3-7%
Composition dependent No
Suitable in wet/dirty gas Moderate
Other comments Elimination of swirl
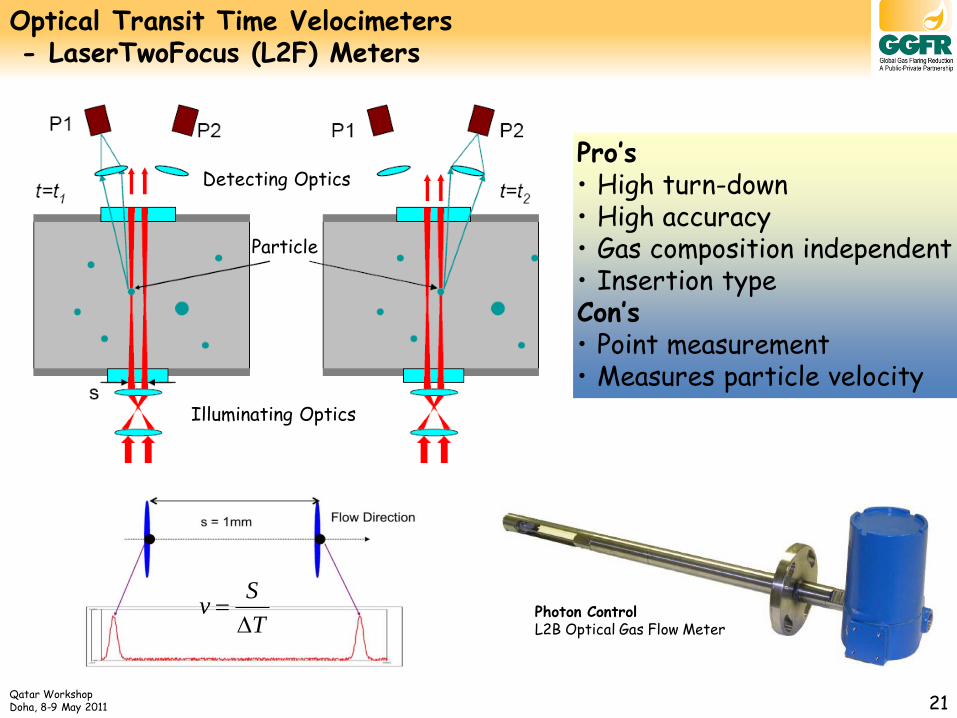
Optical LaserTwoFocus (L2F)
Qatar Workshop Doha, 8-9 May 2011 21
Particle
Illuminating Optics
Detecting Optics Pro’s • High turn-down • High accuracy • Gas composition independent • Insertion type Con’s • Point measurement • Measures particle velocity
Photon Control L2B Optical Gas Flow Meter
Optical Transit Time Velocimeters - LaserTwoFocus (L2F) Meters
T
Sv

Qatar Workshop Doha, 8-9 May 2011 22
Type of Measurement Mass
Measurement point/path Point
Diameter Any (insertion)
Rangeability 1000:1
Straight pipe req’ments 8-10 D upstream, 3 D downstream
Total pressure loss Nil
P and T required ActVol = Yes, StdVol = No, Mass = No
Uncertainty approx. 1-3%
Composition dependent Yes, need thermal conductivity
Suitable in wet/dirty gas No
Other comments Positioning, fouling,
Thermal Mass Flow meter (Hot wire anemometer)
Endress & Hauser, t-mass 65I Size : 2.5-60” Turndown : 100:1 Accuracy : 1%

Qatar Workshop Doha, 8-9 May 2011 23
Composition Monitoring
Some FlowMeters are composition dependent
e.g. p-Meters, Thermal Mass Flow Meters,
Is relationship composition <> correction known
Is sensitivity to composition high or low
Convert volumetric flowrate to mass or energy flowrate (or vv)
Determine heating value of the gas
Emission measurement, e.g. H2S, SO2 or GHG reporting
Ways to monitor composition:
1) Spot sampling and off-line analyses
2) Flow proportional sampling and off-line analyses
3) Continuous on-line analyzers
Qatar Workshop Doha, 8-9 May 2011 24
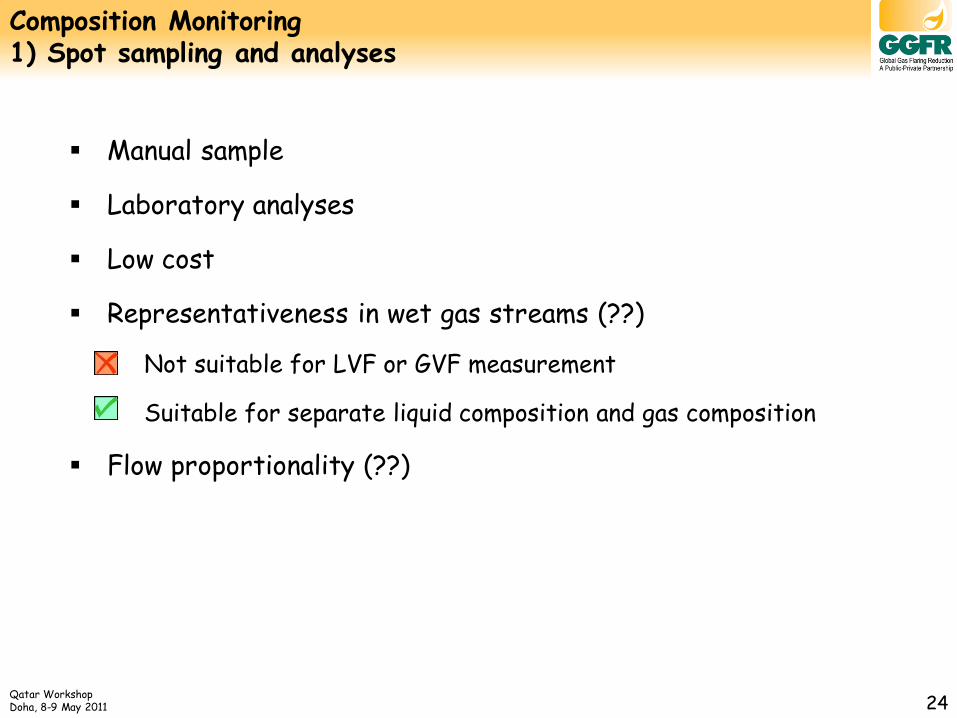
Composition Monitoring 1) Spot sampling and analyses
Manual sample
Laboratory analyses
Low cost
Representativeness in wet gas streams (??)
Not suitable for LVF or GVF measurement
Suitable for separate liquid composition and gas composition
Flow proportionality (??)

Qatar Workshop Doha, 8-9 May 2011 25
Composition Monitoring 2) Flow proportional sampling and off-line analyses
Flow –proportional auto-sampler
Laboratory analyses
Medium
Representativeness in wet gas streams
Not suitable for LVF or GVF measurement
Suitable for separate liquid composition and gas composition

Qatar Workshop Doha, 8-9 May 2011 26
Composition Monitoring 3) Continuous on-line analyzers
Only applicable for clean/processed gas
Need for conditioning units (sample train)
Higher maintenance
Higher costs
Often used in “custody transfer”,
not so much in flare measurement
Daniel® Model 500 Gas Chromatographs

Qatar Workshop Doha, 8-9 May 2011 27
Technology Actual Volume qv
Standard Volume Qv
Mass qm
UltraSonic (V) Output
Vortex Output
Optical Output
UltraSonic (M)
(VoS)
Output
Thermal Output
ffb
bbf
vvZTP
ZTPqQ
..
..
b
mv
fvm qq .
fvm qq .
fvm qq .
ffb
bbf
vvZTP
ZTPqQ
..
..
ffb
bbf
vvZTP
ZTPqQ
..
..
f
mv
bvm Qq .
Flowrate conversions Actual Conditions <> Standard Conditions
bbf
ffb
vvZTP
ZTPQq
..
..
Note : f and b are flowing (actual) and base density
Qatar Workshop Doha, 8-9 May 2011 28
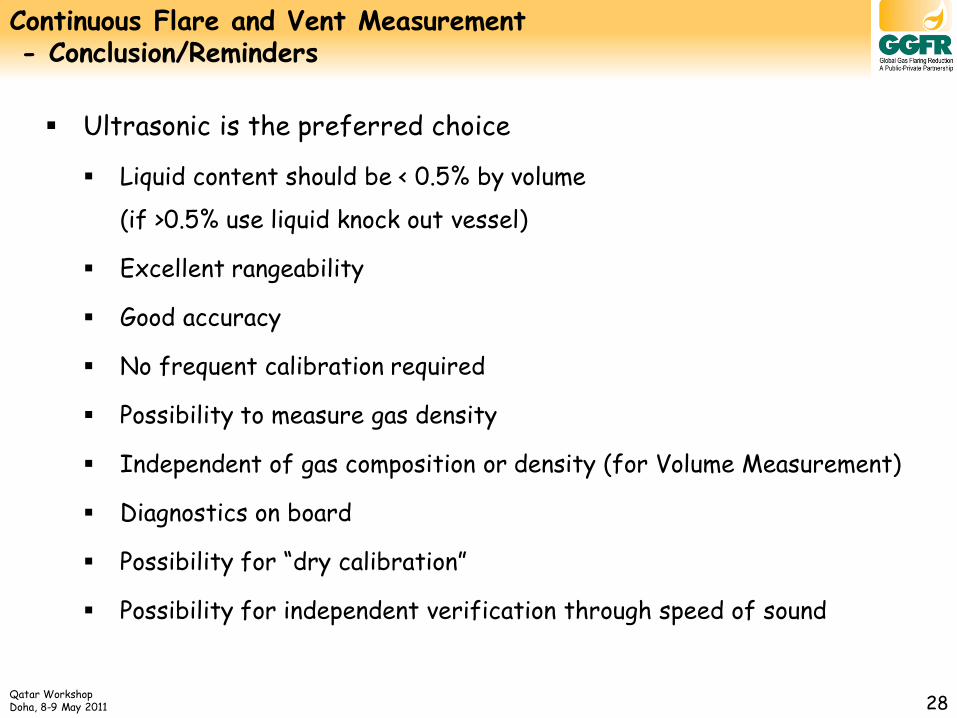
Ultrasonic is the preferred choice
Liquid content should be < 0.5% by volume
(if >0.5% use liquid knock out vessel)
Excellent rangeability
Good accuracy
No frequent calibration required
Possibility to measure gas density
Independent of gas composition or density (for Volume Measurement)
Diagnostics on board
Possibility for “dry calibration”
Possibility for independent verification through speed of sound
Continuous Flare and Vent Measurement - Conclusion/Reminders

Qatar Workshop on Measurement/Reporting
of Flare Gas
Doha, Qatar 8th and 9th May 2011
Facilitated by Lex Scheers Hint Services BV
Overview of Flare Gas Flow Meters Installation Operation Maintenance

Qatar Workshop Doha, 8-9 May 2011 30
Objectives in each project phase for Metering and Allocation
1 Concept/select phase Review the existing contractual documents, governmental regulations and check on technical feasibility Develop a high level metering and allocation philosophy High level metering and allocation philosophy
2 Define/Design phase Develop detailed engineering specifications for metering and allocation Final Metering and Allocation design
3 Execute phase Detail the requirements needed for procurement and construction Detail Metering and Allocation Manual
4 Operate phase Ensure systems are in place for sustainable operation Update Philosophy and Manual (Logbooks)
Qatar Workshop Doha, 8-9 May 2011 31
Design, Installation, Operation of Flare Gas Measurement Systems
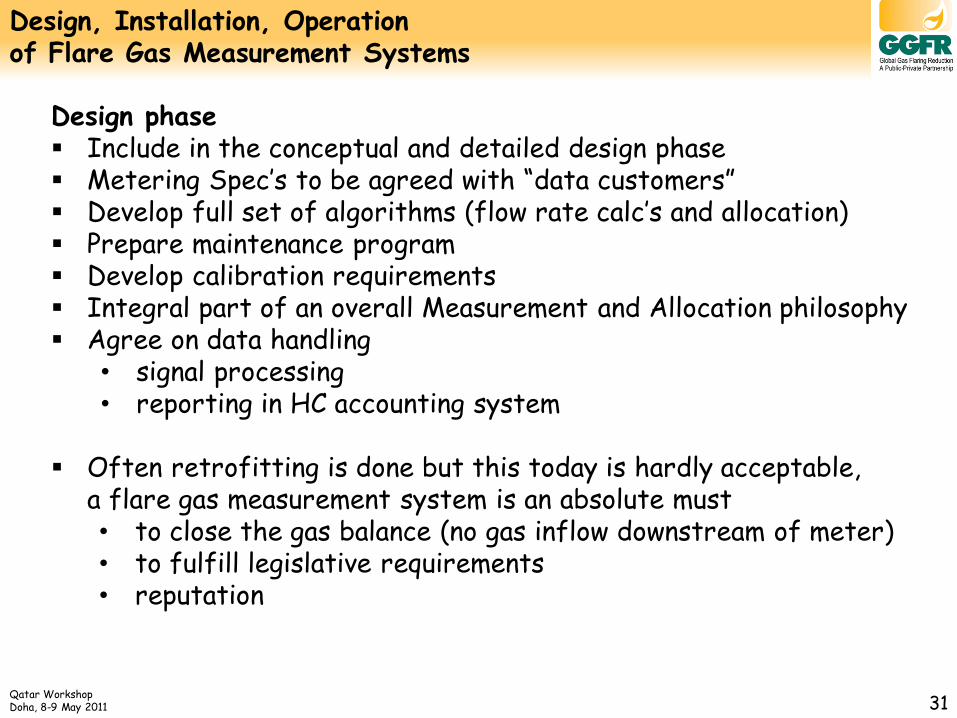
Design phase Include in the conceptual and detailed design phase Metering Spec’s to be agreed with “data customers” Develop full set of algorithms (flow rate calc’s and allocation) Prepare maintenance program Develop calibration requirements Integral part of an overall Measurement and Allocation philosophy Agree on data handling
• signal processing • reporting in HC accounting system
Often retrofitting is done but this today is hardly acceptable,
a flare gas measurement system is an absolute must • to close the gas balance (no gas inflow downstream of meter) • to fulfill legislative requirements • reputation

Qatar Workshop Doha, 8-9 May 2011 32
Safety Staff Equipment
Location Knock-out drums needed Accessibility Single or Multiple meters
Piping Flow profile Straight runs up- and downstream Flow conditioners Sampling arrangements
Process conditions P and T measurement Composition measurement
Requirements Accuracy Availability Continuous measurement
Flare Gas Meter Min/Max flowrate Min/Max gas velocity Rate of change Typical gas composition Change of gas composition Effect of fouling Pressure range Temperature range Ambient temperature Sensitivity to liquids Gas density (z-factor) Gas flowrate calculations Meter output Diagnostics software Signal processing
Competence Service of vendor Training own staff
Design, Installation, Operation of Flare Gas Measurement Systems

Qatar Workshop Doha, 8-9 May 2011 33
Path Averaging Multi-Point Point
Velocity profile and velocity integration [1]

Qatar Workshop Doha, 8-9 May 2011 34
Ref : API MPMS 14.10 [2007]
Velocity profile and velocity integration [2]

Qatar Workshop Doha, 8-9 May 2011 35
Flare Meter Datasheet - Ref MPMS API 14.10

Qatar Workshop Doha, 8-9 May 2011 36
Qualitative Rating of Options for Flare Gas Meters [1]
Technology Sensitivity
to Mist/Liquid
Sensitivity to Fouling
Ability to Detect Fouling
Installed Costs
P/T Req’ed
p Orifice Venturi
Moderate Physical
Inspection Low/High Yes
Thermal Mass Flow
High High Physical
Inspection Low
Yes (Am3)
No (mass)
Optical Moderate High Diagnostics High No (Am3)
Yes (mass)
UltraSonic Low
< 5% liquid High Diagnostics Low/High
No (Am3)
Yes (mass)
Vortex Low Moderate Physical
Inspection High
No (Am3)
Yes (mass)

Qatar Workshop Doha, 8-9 May 2011 37
Qualitative Rating of Options for Flare Gas Meters [2]
Technology Composit. Dependent
Flow Capacity
Range-ability
Accuracy Calibrat. Frequency
p Yes High Low High High
Thermal Mass Flow
Yes High High Moderate Low
Optical No High High High Low
UltraSonic No High High High Low
Vortex No Moderate Moderate High Low
Qatar Workshop Doha, 8-9 May 2011 38
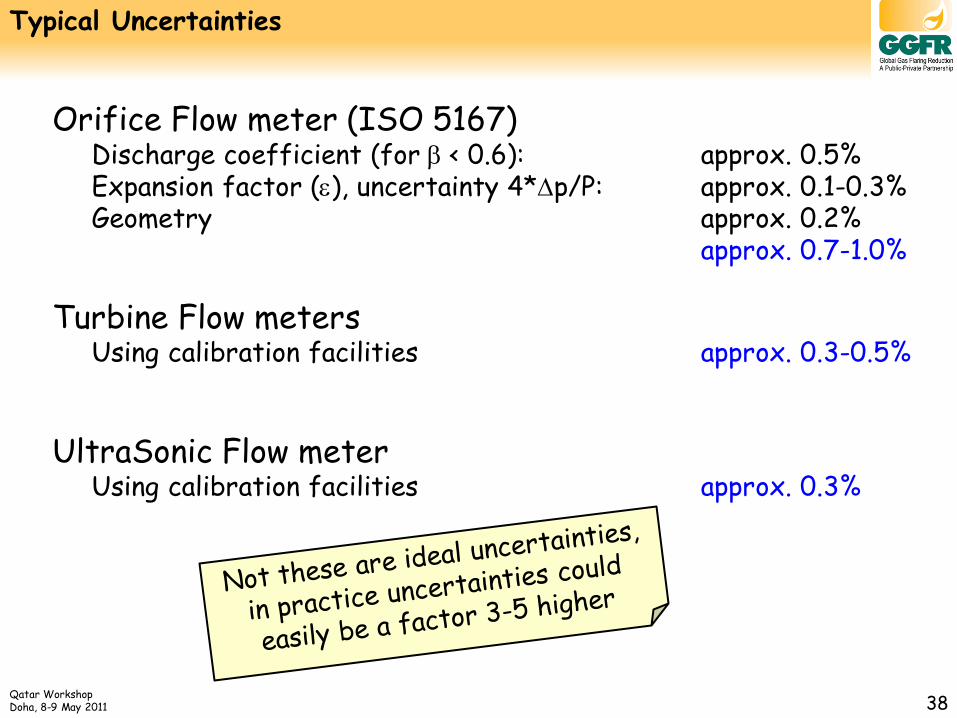
Typical Uncertainties
Orifice Flow meter (ISO 5167) Discharge coefficient (for b < 0.6): approx. 0.5% Expansion factor (e), uncertainty 4*p/P: approx. 0.1-0.3% Geometry approx. 0.2%
approx. 0.7-1.0%
Turbine Flow meters Using calibration facilities approx. 0.3-0.5%
UltraSonic Flow meter Using calibration facilities approx. 0.3%

Qatar Workshop Doha, 8-9 May 2011 39
Methods for spot checks or verification of existing flare gas meters
Preferably :
No shut down
Personnel operating in flare area
Need for strict procedures and policies
Safety (thermal radiation, toxic gases, noise)
Need for sampling and injection points
Periodic checks detect fouling and/or meter drift
Ways to execute spot checks:
1. Insertion flow meters
2. Tracer dilution technology
3. Pulse velocity technique

Qatar Workshop Doha, 8-9 May 2011 40
Movable insertion flow meter enables measurement of flow profile
Insertion point needs 20 D upstream, 5D downstream straight length
Uncertainty of 5-10% possible
Methods for spot checks [1] - Insertion flow meters
Insertion turbine meter
Mechanical device
Thermal anemometer (thermal mass flow meter)
Great sensitivity
No wet or dirty gas applications
Pitot tube
Relatively simple concept
Mechanically more complex to insert

Qatar Workshop Doha, 8-9 May 2011 41
ci = Tracer concentration in the injected solution [mol/m3]
cp = Tracer concentration in the pipeline [mol/m3]
Qi = Injection flow rate of tracer solution [m3/s]
Qp = Liquid flow rate in pipeline [m3/s]
Provided Qp >> Qi, the concentration of tracer in the pipe is:
C i C p
x Injection flow rate Gas flow rate =
Tracer mass balance:
Mixing distance
Gas sample
Tracer supply bottle
Metering pump
C i
Wet gas flow
C p
Methods for spot checks [2] - Tracer dilution technology

Qatar Workshop Doha, 8-9 May 2011 42
Methods for spot checks [2] - Tracer dilution technology
Injection of tracer (with known injection rate) upstream
After sufficient mixing sampling of the gas
Analyses for the tracer
Perform mass balance to determine the total gas flowrate :
“the dilution of tracer is a measure for the total gas flowrate”
Sufficient mixing of tracer is required
Sampling at least 20 D from injection tracer point
Background correction
Sample without tracer injection to find out background
Tracer requirements:
Stable or inert substance
Reasonable price
Easy onside analyses
Uncertainty 4-8% possible Example is SF6

Qatar Workshop Doha, 8-9 May 2011 43
Methods for spot checks [3] - Pulse velocity technique
Radioactive tracer injection upstream
Detection of passing the first pulse
Detection of passing of second pulse
Velocity is distance detectors (S) over (T) time delay
Need for dedicated contractor company and procedures
to handle radioactive substances
Uncertainty in order of 1-2% possible

Qatar Workshop Doha, 8-9 May 2011 44
Meter Loops - A low cost method of monitoring meter health
How would you like a very easy way to see if your meters are working at any time?
Daily
Hourly
Takes 10 seconds / check
How would you like to know WHICH meters are not working?
Takes 15 seconds
How would you like to know this for (almost) no cost?
Cost is very low
Meters already in place in most cases
Only cost is programming, a bit of math and displaying the results
Can be done in PI system
Qatar Workshop Doha, 8-9 May 2011 45
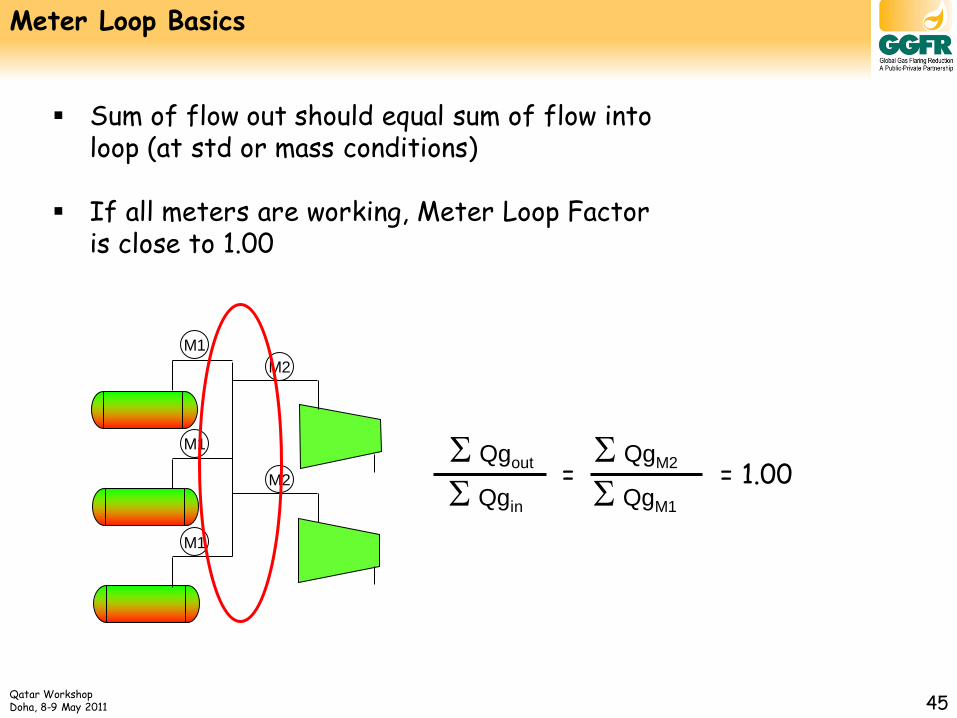
Sum of flow out should equal sum of flow into loop (at std or mass conditions)
If all meters are working, Meter Loop Factor is close to 1.00
M1
M1
M1
M2
M2
S Qgout
S Qgin
= 1.00 S QgM2
S QgM1
=
Meter Loop Basics
Qatar Workshop Doha, 8-9 May 2011 46
M1
M1
M1
M2
M2
M3
M3
M4
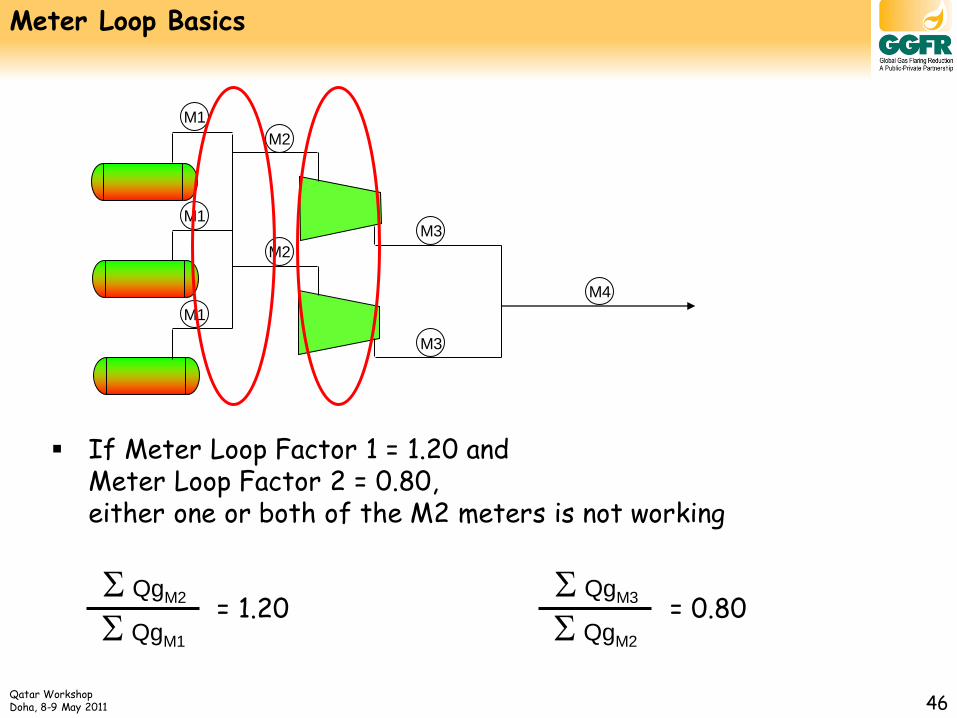
S QgM2
S QgM1
= 1.20
If Meter Loop Factor 1 = 1.20 and Meter Loop Factor 2 = 0.80, either one or both of the M2 meters is not working
S QgM3
S QgM2
= 0.80
Meter Loop Basics
Qatar Workshop Doha, 8-9 May 2011 47
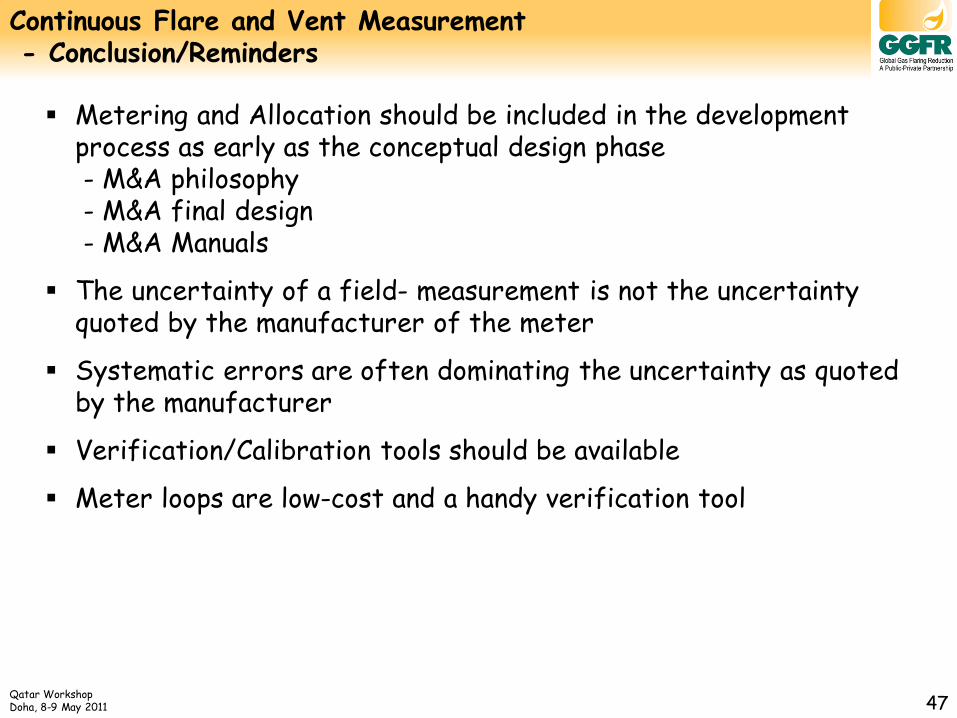
Metering and Allocation should be included in the development process as early as the conceptual design phase - M&A philosophy - M&A final design - M&A Manuals
The uncertainty of a field- measurement is not the uncertainty quoted by the manufacturer of the meter
Systematic errors are often dominating the uncertainty as quoted by the manufacturer
Verification/Calibration tools should be available
Meter loops are low-cost and a handy verification tool
Continuous Flare and Vent Measurement - Conclusion/Reminders

Qatar Workshop on Measurement/Reporting
of Flare Gas
Doha, Qatar 8th and 9th May 2011
Facilitated by Lex Scheers Hint Services BV
Gas Balancing and Gas Allocation

Qatar Workshop Doha, 8-9 May 2011 49
GAS
OIL
WATER
RESERVOIR GAS
WATER
WATER
DISPO
SAL
SALES GAS (Fiscal / Custody Transfer)
SALES OIL (Fiscal / Custody Transfer)
FLARE GAS, OWN USE
$
$ $
$
$
$
$ $ $
PRODUCTION FACILITY for each phase
Sin = Sout
The Product Balance
(Fiscal ???)

Qatar Workshop Doha, 8-9 May 2011 50
Allocation Example 1
Old Billy Joe had 3 children
and 17 horses
After his death the horses should be allocated according to his will
1/2 1/3 1/9
John Billy Jane
17
Old Billy Joe
Qatar Workshop Doha, 8-9 May 2011 51
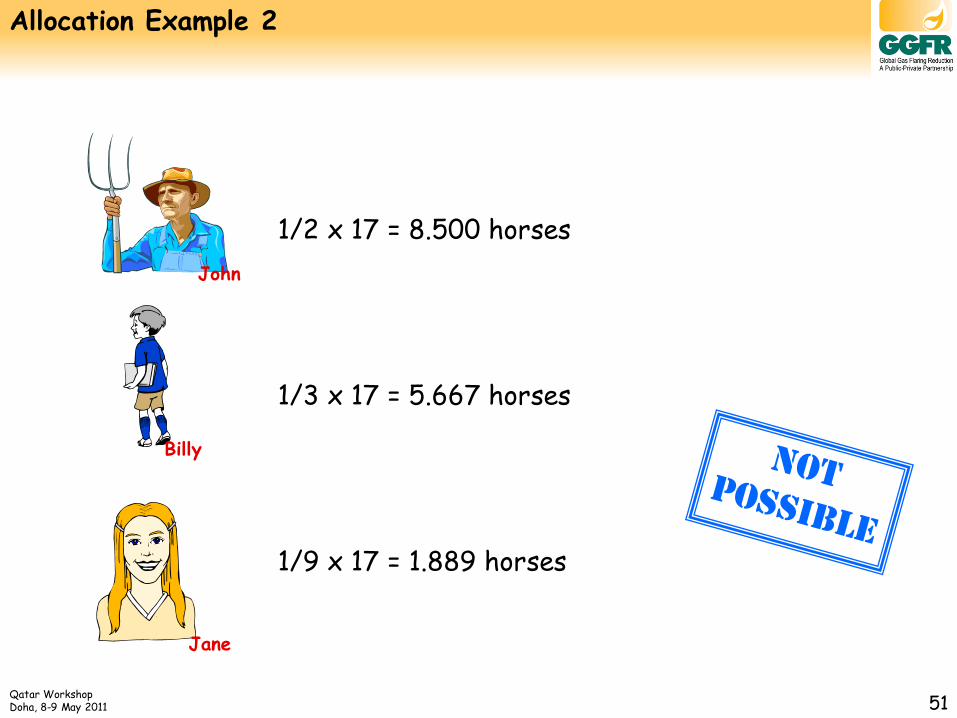
Allocation Example 2
1/2 x 17 = 8.500 horses
1/3 x 17 = 5.667 horses
1/9 x 17 = 1.889 horses
John
Billy
Jane

Qatar Workshop Doha, 8-9 May 2011 52
Allocation Example 3
The family borrowed 1 horse from the next-door neighbour,
so there are now 18 horses
17 +1 =18
Old Billy Joe
John Billy Jane

Qatar Workshop Doha, 8-9 May 2011 53
Allocation Example 4
1/2 x 18 = 9.000 horses
1/3 x 18 = 6.000 horses
1/9 x 18 = 2.000 horses
John
Billy
Jane
Total 17 horses allocated to the kids
and they can return the
borrowed horse back to the neighbour
17.000 horses
+

Qatar Workshop Doha, 8-9 May 2011 54
Gas/Condensate/Oil Allocation
Requirements
• Equitable
• Transparent
• As much as possible existing standards (API, ISO)
• Auditable
• Applicable to wide spread of production systems
• Flexible
• Acceptable
• Independent of well/reservoir characteristics
• Equipment, should be proven and economical viable
• Thermodynamics, should be sound and solid
• Costs vs. uncertainty considerations (Accuracy cost money)
Basic principle What goes in should come out

Qatar Workshop Doha, 8-9 May 2011 55
Conservation of Mass (kg, tonnes)
Conservation of Standard Volume (Sm3, Scft)
Conservation of Actual Volume (Am3, cft, bbls)
Conservation of Energy (MJ, BTU, etc)
Conservation of Mols (kmol)
Conservation Rules

Qatar Workshop Doha, 8-9 May 2011 56
Dead crude oil and water and T (and p) changes No mass transfer from liquid to gas phase or vice versa
- Due to temperature changes (ASTM tables)
- Due to mixing (dislike molecules (API Chapter 12-3)
Live crude oil / condensate /gas and p and T changes Boiling liquids and condensing gas Mass transfer from liquid to gas phase and vice versa
- HySys (PRO II) models
- Shrinkage testers
- Black Oil or other models
Oil Shrinkage and Gas Expansion
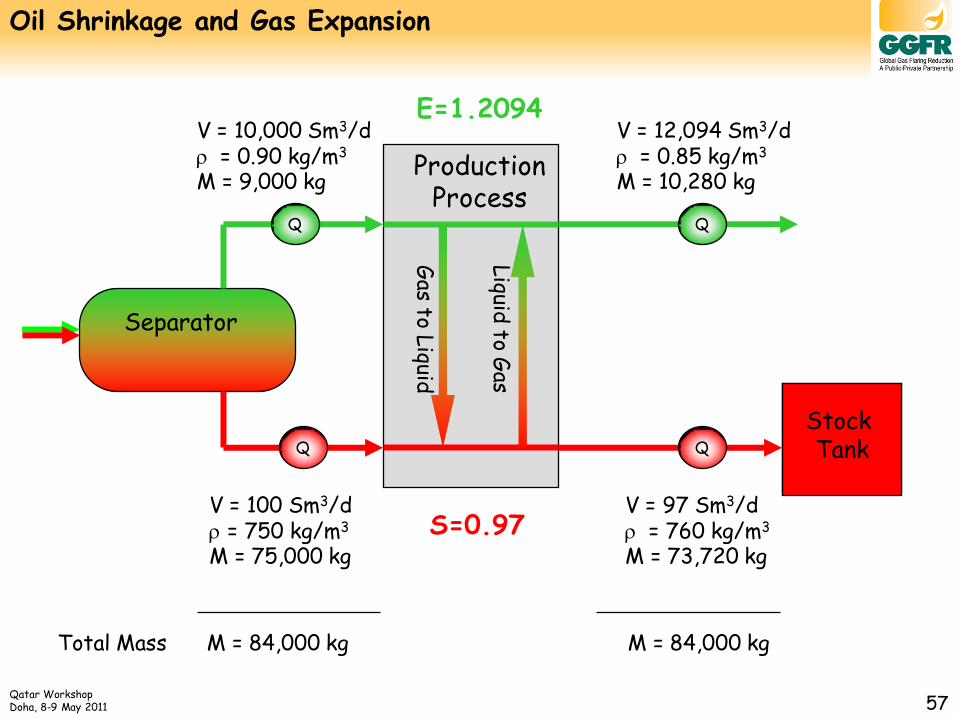
Qatar Workshop Doha, 8-9 May 2011 57
Oil Shrinkage and Gas Expansion
Separator
Q
Gas to L
iquid
Liquid
to Gas
Production Process
Q
Q Q
V = 10,000 Sm3/d = 0.90 kg/m3 M = 9,000 kg
V = 12,094 Sm3/d = 0.85 kg/m3 M = 10,280 kg
V = 100 Sm3/d = 750 kg/m3 M = 75,000 kg
V = 97 Sm3/d = 760 kg/m3 M = 73,720 kg
Total Mass M = 84,000 kg M = 84,000 kg
S=0.97
E=1.2094
Stock Tank

Qatar Workshop Doha, 8-9 May 2011 58
A single and accurate measurement is used to reconcile number of less accurate well measurements
Q1
Q2
Qi
QTot
Wells
Totcicc
c
c
ii
Tot
Toti
QQQQ
QRFQ
QRFQ
Q
QRF
QQQQQ
ReRe2Re1
2Re2
1Re1
321
....
.
.
.....
Reconciliation Factor
And now :
Reconciliation - Principle

Qatar Workshop Doha, 8-9 May 2011 59
or in words
OffLowDaysWellTest
StockFiscalisedOilFiscalisedRF
/)*(
)(
RF= Total oil actually produced
Total oil thought to be produced
Reconciliation Factor (RF)
Qatar Workshop Doha, 8-9 May 2011 60
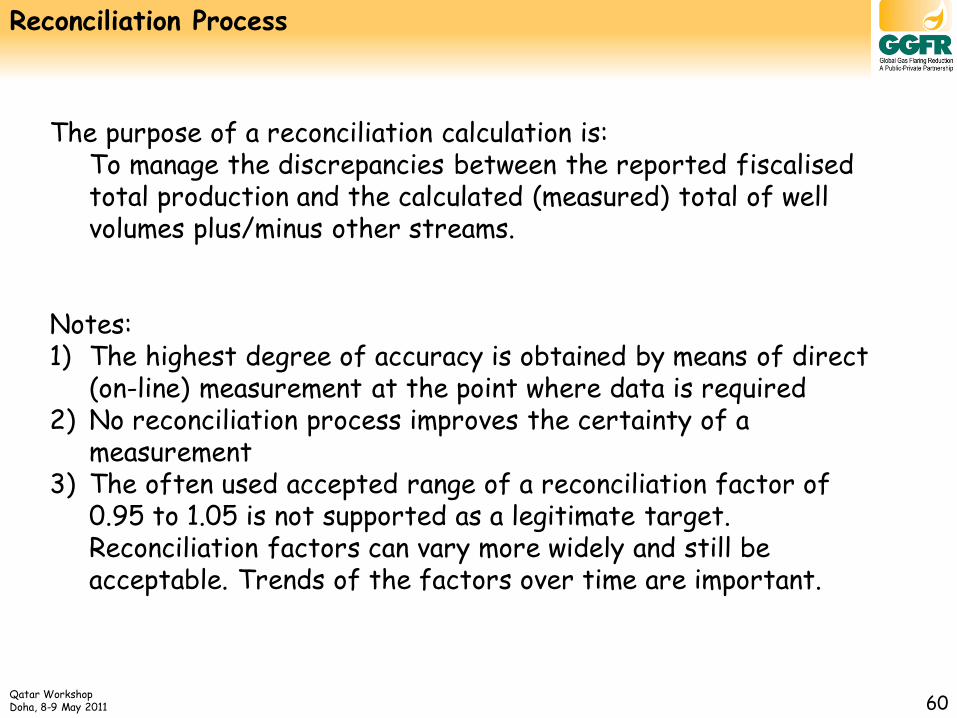
Reconciliation Process
The purpose of a reconciliation calculation is: To manage the discrepancies between the reported fiscalised
total production and the calculated (measured) total of well volumes plus/minus other streams.
Notes: 1) The highest degree of accuracy is obtained by means of direct
(on-line) measurement at the point where data is required 2) No reconciliation process improves the certainty of a
measurement 3) The often used accepted range of a reconciliation factor of
0.95 to 1.05 is not supported as a legitimate target. Reconciliation factors can vary more widely and still be acceptable. Trends of the factors over time are important.

Qatar Workshop Doha, 8-9 May 2011 61
Single Stage Reconciliation
m
iBi
n
iAi
Tot
QRF
11
AicAi QRFQ .Re BicBi QRFQ .Re
QA1
QA2
QAi
QB1
QB2
QBi
QTot
Sta
tion
A
Sta
tion
B
n wells
m wells
Qatar Workshop Doha, 8-9 May 2011 62
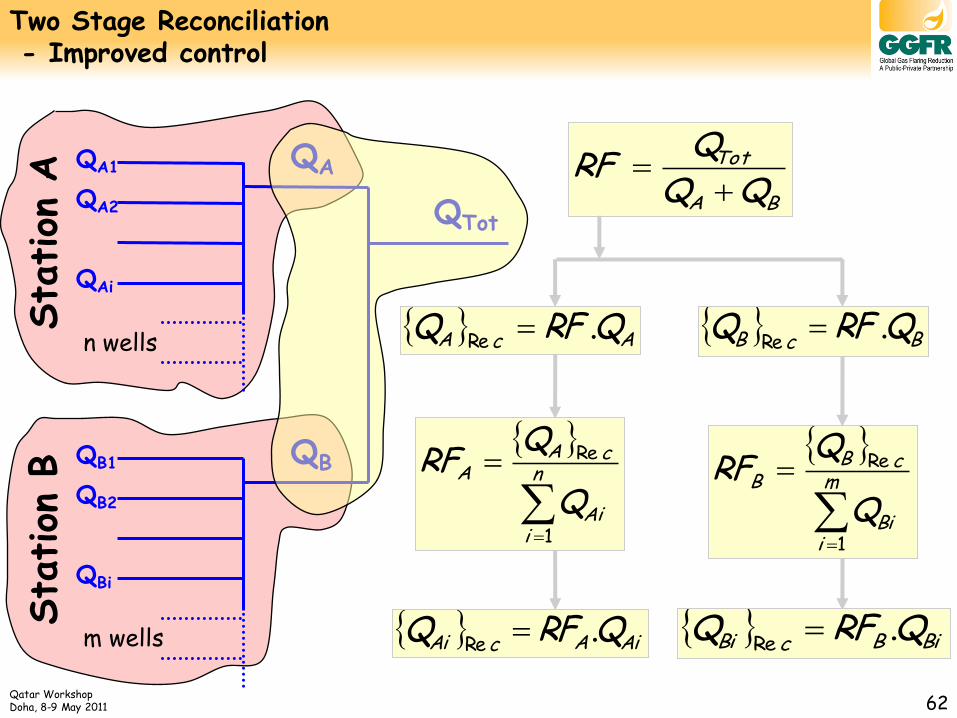
m
iBi
cBB
Q
QRF
1
Re
BiBcBi QRFQ .Re
n
iAi
cAA
Q
QRF
1
Re
AiAcAi QRFQ .Re
QA1
QA2
QAi
QA
QB1
QB2
QBi
QB
QTot
Sta
tion
A
Sta
tion
B
n wells
m wells
BA
Tot
QQQ
RF
AcA QRFQ .Re BcB QRFQ .Re
Two Stage Reconciliation - Improved control
Qatar Workshop Doha, 8-9 May 2011 63
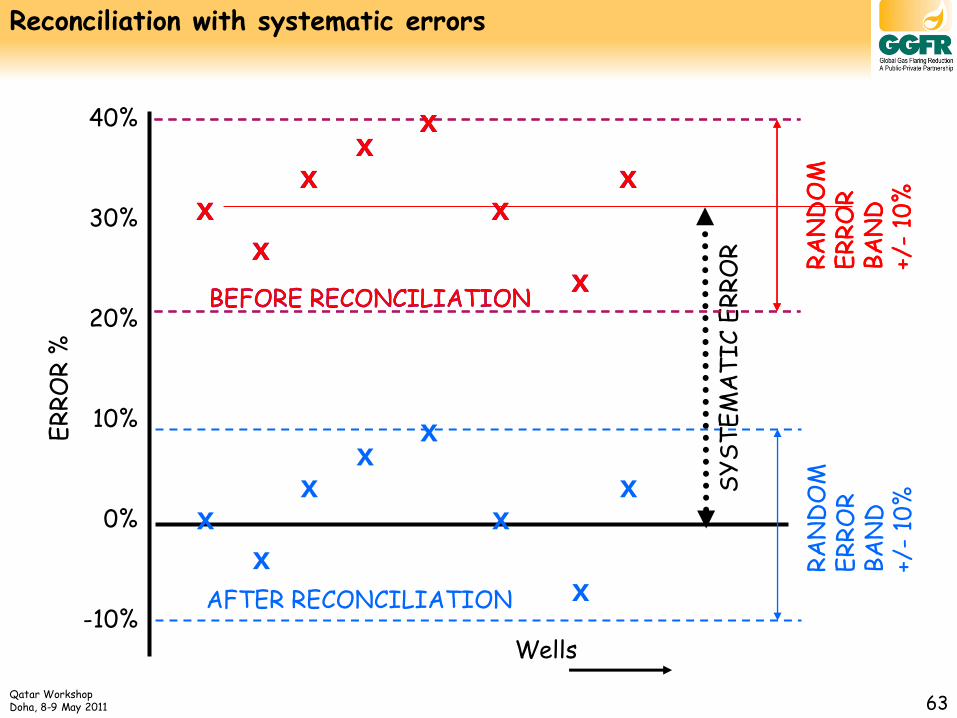
Reconciliation with systematic errors
RA
ND
OM
E
RR
OR
B
AN
D
+/-
10%
x
x
x x
x
x
x
x
BEFORE RECONCILIATION
ER
RO
R %
0%
30%
AFTER RECONCILIATION
RA
ND
OM
E
RR
OR
B
AN
D
+/-
10%
x
x
x x
x
x
x
x SY
ST
EM
AT
IC E
RR
OR
40%
20%
10%
Wells -10%
RA
ND
OM
E
RR
OR
B
AN
D
+/-
10%
x
x
x x
x
x
x
x
BEFORE RECONCILIATION

Qatar Workshop Doha, 8-9 May 2011 64
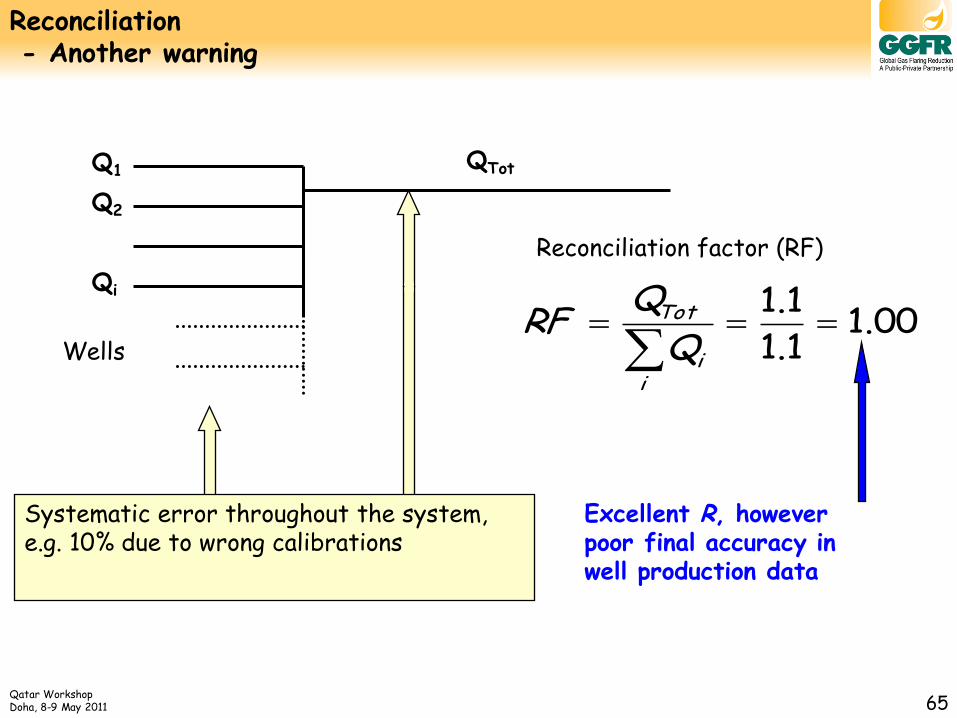
Reconciliation - Another warning
Q1
Q2
Qi
QTot
Wells 91.0
1.1
1
i
i
Tot
RF
Systematic error in well flow metering, e.g. 10% due to over-reading in wet gas measurement or wrong calibrations
Reconciliation factor (RF)
Accurate station metering
Poor R, however good final accuracy in well production data
Qatar Workshop Doha, 8-9 May 2011 65
Q1
Q2
Qi
QTot
Wells 00.1
1.1
1.1
i
i
Tot
Q
QRF
Reconciliation factor (RF)
Excellent R, however poor final accuracy in well production data
Reconciliation - Another warning
Systematic error throughout the system, e.g. 10% due to wrong calibrations

Qatar Workshop Doha, 8-9 May 2011 66
Different types of Allocation Processes
Volumetric balances • Flow proportional • Uncertainty based • By difference
Mass/Energy balances (per component or bulk)
• Flow proportional • Uncertainty based • By difference
Preferred method for complicated gas developments :
• Mass based allocation per component (component based allocation)
P & T independent !!!

Qatar Workshop Doha, 8-9 May 2011 67
Mass Based Allocation per Component [1] - LNG project
Train 1
Train 2
Train 3
Train 4
Train 5
Train 6
1
4 12
7 2
8
Slu
gcat
cher
S
lugc
atch
er
Slu
gcat
cher
24
21
26 23
17
16 18
14
15
22
3 6 5
19
25
13
10
11
9
20
LNG Site
20b
20a
Line 1
Line 2
Line 3
Line 4 $LNG
$LPG
$Cond
Base Project Expansion 1 Expansion 2
Company A
Company B
Company C Expansion 3

Qatar Workshop Doha, 8-9 May 2011 68
Mass Based Allocation per Component [2] (simplified)
Split of sales products (LNG, LPG, Condensate) is done based on quality of gas supply, e.g. A heavy gas (rich or C5+) producer should get more from the condensate sales or A lean gas (mainly C1 or C2) producer should mainly be paid from the LNG sales
$LNG
$LPG
$Cond
to C1, C2 producers
LNG Plant
to C3, C4 producers
to C5+ producers
Assume (as an example) LNG = C1 and C2
LPG = C3 and C4
Condensate = C5+

Qatar Workshop Doha, 8-9 May 2011 69
Mass Based Allocation per Component [3] (real)
LNG Plant Sales LNG
m i,LNG
Sales LPG
m i,LPG
Sales Cond
m i,Cond
m i,k
For each company and each component
$LNG
$LPG
$Cond
3 separate money pots
i = 12 Components C1, C2, ........, CO2, N2
k = 3 Companies

Qatar Workshop Doha, 8-9 May 2011 70
Mass Based Allocation per Component [4] (real)
Step 1
Split money pots per component, hence from 3 “money pots” to 36 “money pots”
LNG
i
iLNGi
iLNGi
iLNG
CVm
CVm.$
.
.$
12
1
,
,
,
LPG
i
iLPGi
iLPGi
iLPG
mwm
mwm.$
.
.$
12
1
,
,
,
Cond
i
iCondi
iCondi
iCond
mwm
mwm.$
.
.$
12
1
,
,
,
For LNG (based on MJ) :
Note: mi,LNG , mi,LPG and mi,Cond
are moles of outgoing sales streams
36 separate money pots
For LPG (based on weight) :
For Cond (based on weight) :
Qatar Workshop Doha, 8-9 May 2011 71
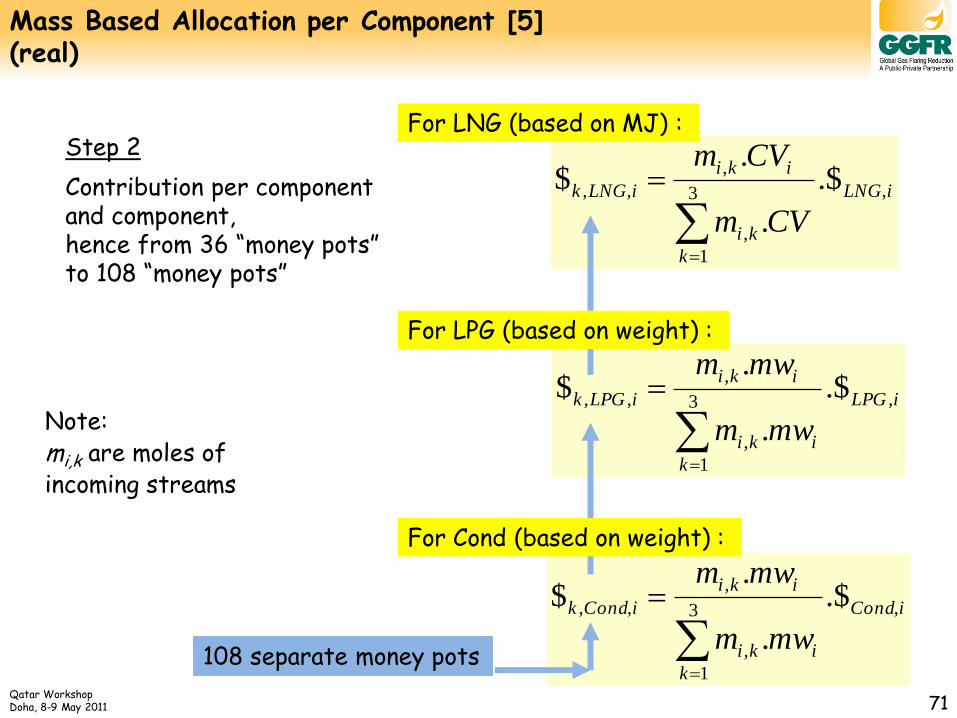
Mass Based Allocation per Component [5] (real)
iLPG
k
iki
iki
iLPGk
mwm
mwm,3
1
,
,
,, .$
.
.$
Step 2
Contribution per component and component, hence from 36 “money pots” to 108 “money pots”
iLNG
k
ki
iki
iLNGk
CVm
CVm,3
1
,
,
,, .$
.
.$
iCond
k
iki
iki
iCondk
mwm
mwm,3
1
,
,
,, .$
.
.$
For LNG (based on MJ) :
Note: mi,k are moles of incoming streams
108 separate money pots
For LPG (based on weight) :
For Cond (based on weight) :
Qatar Workshop Doha, 8-9 May 2011 72
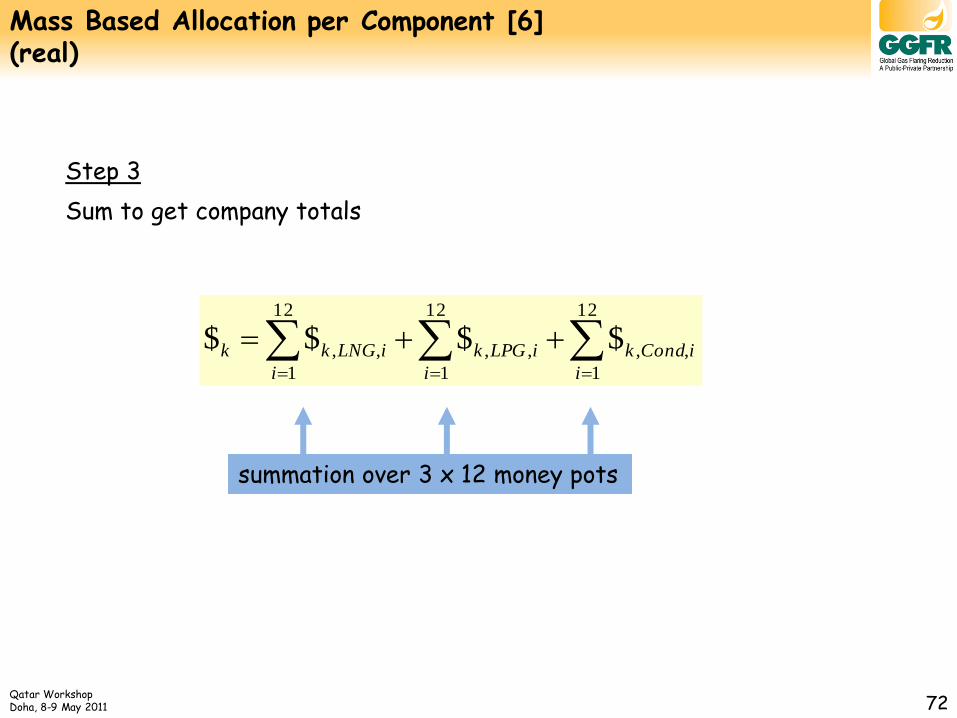
Mass Based Allocation per Component [6] (real)
Step 3
Sum to get company totals
12
1
,,
12
1
,,
12
1
,, $$$$i
iCondk
i
iLPGk
i
iLNGkk
summation over 3 x 12 money pots
Qatar Workshop Doha, 8-9 May 2011 73
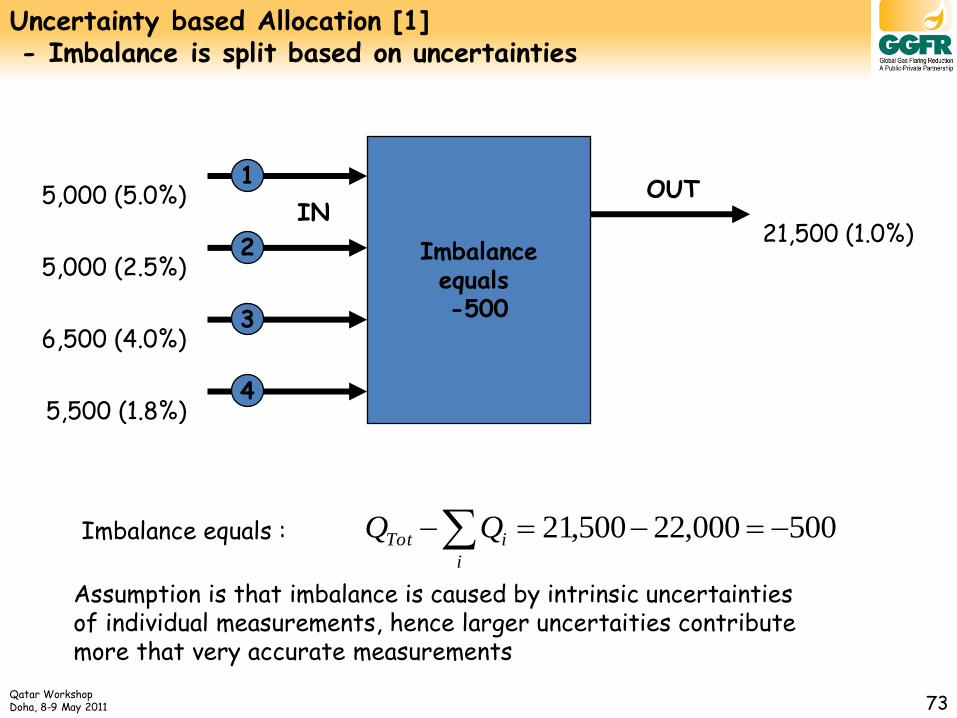
Uncertainty based Allocation [1] - Imbalance is split based on uncertainties
Imbalance equals -500
5,000 (5.0%)
5,000 (2.5%)
6,500 (4.0%)
5,500 (1.8%)
21,500 (1.0%)
500000,22500,21 i
iTot QQImbalance equals :
Assumption is that imbalance is caused by intrinsic uncertainties of individual measurements, hence larger uncertaities contribute more that very accurate measurements
OUT IN
1
2
3
4

Qatar Workshop Doha, 8-9 May 2011 74
Uncertainty based Allocation [2]
526,155
24
1
j
j
250 (62,500)
125 (15,625)
260 (67,600)
99 (9,801)
Assume OK
2j j
799,4)500.(
526,155
500,62000,5
4
1
2
2
11
j
j
Q
same principle for well 2, 3 and 4
Imbalance equals -500
OUT 1
2
3
4
950,42 Q
283,63 Q
468,54 Q
500,21TotQ
IN

Qatar Workshop Doha, 8-9 May 2011 75
Uncertainty based Allocation [3] - Difference Flow Proportional and Uncertainty Based

Qatar Workshop Doha, 8-9 May 2011 76
Levels of Allocation [1]
Well Allocation – Determines the quantity of oil, water and gas produced from an individual well. Data mainly used for reservoir management. Typical metering accuracy 10%
Field Allocation – Determines the quantity of oil, water and gas produced from all the wells within a reservoir/field. Data used for reservoir management, sales and tax. Typical metering accuracy 1 to 5%,
Platform Allocation – Apportions the quantity of oil, water and gas exiting a facility between the different fields that enter the facility. Data used for tariff purposes. Typical metering accuracy 1% or 2% for gas, 0.25% for oil

Qatar Workshop Doha, 8-9 May 2011 77
Levels of Allocation [2]
Terminal Allocation – Apportions the oil, water and gas exiting a Terminal between the different input Platforms. Date used for tariff and oil tanker lifting and gas sales purposes. Typical metering accuracy 1% for gas, 0.25% for oil
Downstream Gas Allocation – Apportionment of gas entering and exiting an onshore gas distribution network. Data used to balance the inflow and outflow and for tariff. Typical metering accuracy 1% for gas
Qatar Workshop on Measurement/Reporting
of Flare Gas
Doha, Qatar 8th and 9th May 2011
Facilitated by Lex Scheers Hint Services BV
Estimation of Errors and Uncertainty in Volume Measurement
Qatar Workshop Doha, 8-9 May 2011 79
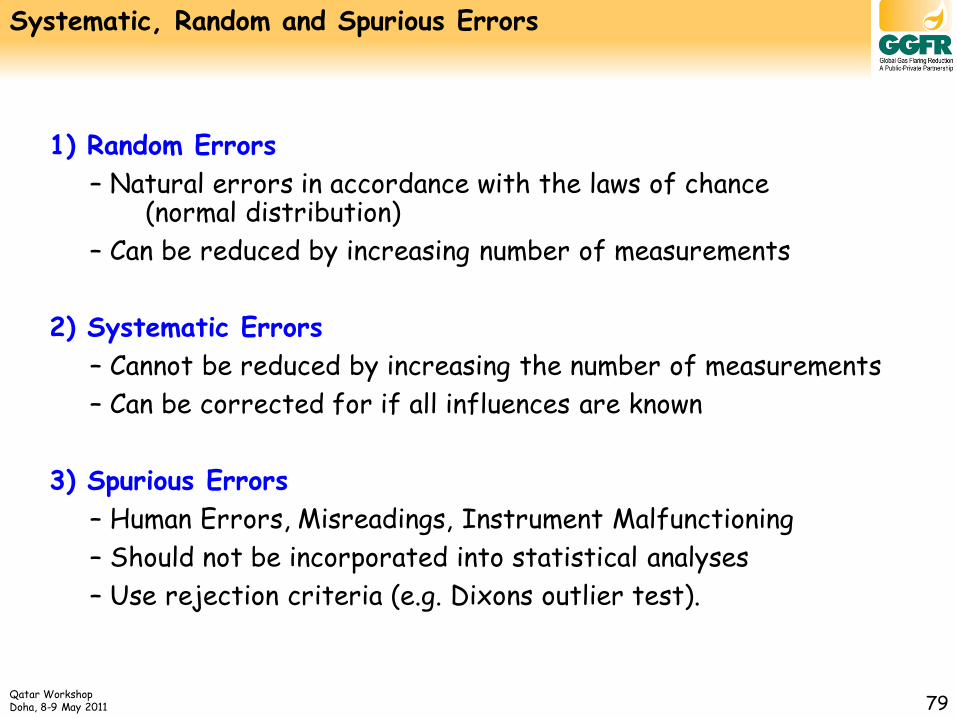
1) Random Errors
– Natural errors in accordance with the laws of chance (normal distribution)
– Can be reduced by increasing number of measurements
2) Systematic Errors
– Cannot be reduced by increasing the number of measurements
– Can be corrected for if all influences are known
3) Spurious Errors
– Human Errors, Misreadings, Instrument Malfunctioning
– Should not be incorporated into statistical analyses
– Use rejection criteria (e.g. Dixons outlier test).
Systematic, Random and Spurious Errors

Qatar Workshop Doha, 8-9 May 2011 80
Time
Meas
ured v
alue
Systematic Error
Spurious Error
Random error
Uncertainty band or 95% confidence level
True value
Systematic, Random and Spurious Errors

Qatar Workshop Doha, 8-9 May 2011 81
Uncertainty - Repeatability, Systematic and Random Errors
Random Error
Systematic error plus random error
Actual Value
Good accuracy Good repeatability
Poor accuracy Good repeatability
Poor accuracy Poor repeatability

Qatar Workshop Doha, 8-9 May 2011 82
The confidence interval, also known as the range of uncertainty, is an interval within which the true value of the measured quantity, corrected for all known systematic errors, can be expected to lie with a stated degree of confidence. Common practice is to use the 95% confidence level, which corresponds to plus/minus two standard deviations, when the measurements are distributed normally about a mean. Note: More precise the 95% confidence level is covered by a range between ms-1.96 ss and ms+1.96 ss
Uncertainty - Confidence interval

Qatar Workshop Doha, 8-9 May 2011 83
±1
±1.96 ±2
Uncertainty = 10%, With 95.45% confidence interval this means St Dev = 5 Uncertainty approx. 2 * St Dev 2 * StDev will be used for 95% confidence interval
Uncertainty - Confidence interval

Qatar Workshop Doha, 8-9 May 2011 84
Relative error xx/x (*100%) A relative error of +/- 10% in a flow measurement of 250 m3/d means that the true value lies in the range 225 m3/d to 275 m3/d, i.e. +/- 10% relative to 250 m3/d. Absolute error xx A absolute error of +/- 10 m3/d in a flow measurement of 250 m3/d means that the true value lies in the range 240 m3/d to 260 m3/d, i.e. +/- 4% relative to 250 m3/d. An uncertainty of +/- 2% absolute in a watercut measurement of 60% means that the true value lies in the range 58% to 62%.
In multiphase flow fractions (oil, water and gas) and watercut are measured directly as percentages. To avoid dealing with percentages of percentages, errors in these quantities are often quoted in absolute terms
!!
Uncertainty - Absolute and Relative Errors

Qatar Workshop Doha, 8-9 May 2011 85
• Addition and Subtraction
•With addition and subtraction the absolute error in the result is the sum of all absolute errors.
yxR
yyxxRR
yxR
yxR
yyR
xxR
R
yxR
Alternatively
Uncertainty - Error Propagation (1)
Qatar Workshop Doha, 8-9 May 2011 86
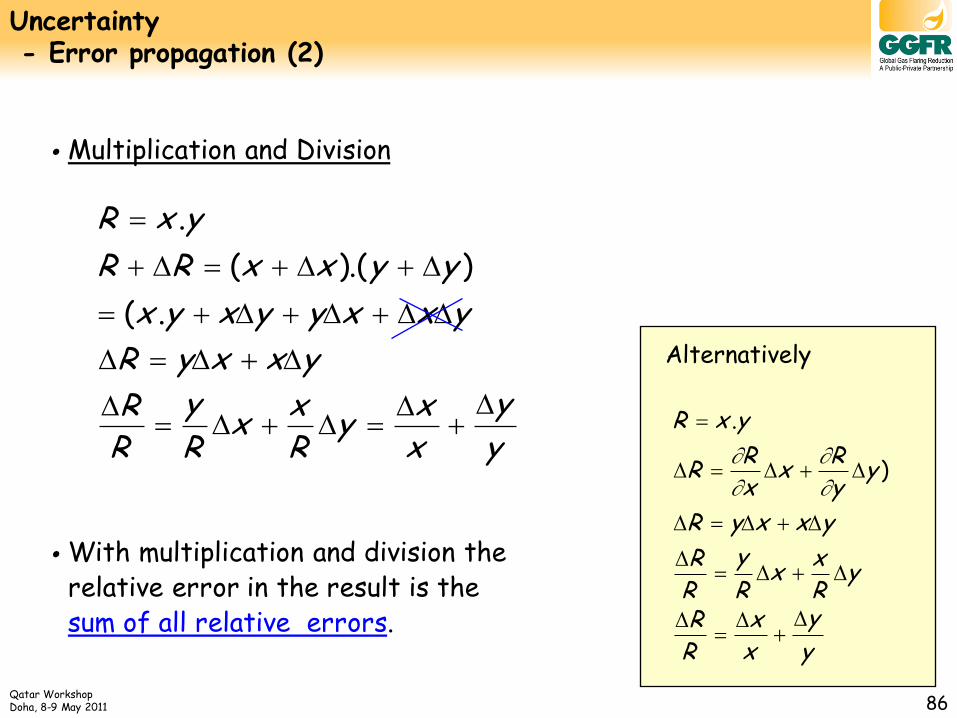
•Multiplication and Division
•With multiplication and division the relative error in the result is the sum of all relative errors.
y
y
xx
yRx
xR
y
RR
yxxyR
yxxyyxyx
yyxxRR
yxR
.(
)).((
.
y
y
xx
RR
yRx
xR
y
RR
yxxyR
yyR
xxR
R
yxR
)
.
Alternatively
Uncertainty - Error propagation (2)

Qatar Workshop Doha, 8-9 May 2011 87
However, the previously mentioned “worst case” scenario's often give a good indication how errors can “explode” and check their sensitivity. It also makes calculations easier.
......XXXQ
......X
X
X
X
X
X
Q
Q
......)X()X()X(Q
....X
X
X
X
X
X
Q
Q
321
3
3
2
2
1
1
2
3
2
2
2
1
2
3
3
2
2
2
2
1
1
Instead of
Statistically the errors should be summed according to the Root Mean Square (RMS) method:
Uncertainty - Error propagation (3)

Qatar Workshop Doha, 8-9 May 2011 88
Q1 = 50 m3/d RelErr = 20% StDev = 2.5
Q2 = 950 m3/d RelErr = 10% StDev = 2.5
QT = 1000 m3/d RelErr = ?? StDev = ??
Monte Carlo Simulation Run multiple calculations whereby the input in each calculation is taken from a given distribution With today’s computing power this is now available in spreadsheets
????
Known
Known
Allocation Model
What is Monte Carlo Simulation
Crystal Ball @Risk
Qatar Workshop Doha, 8-9 May 2011 89
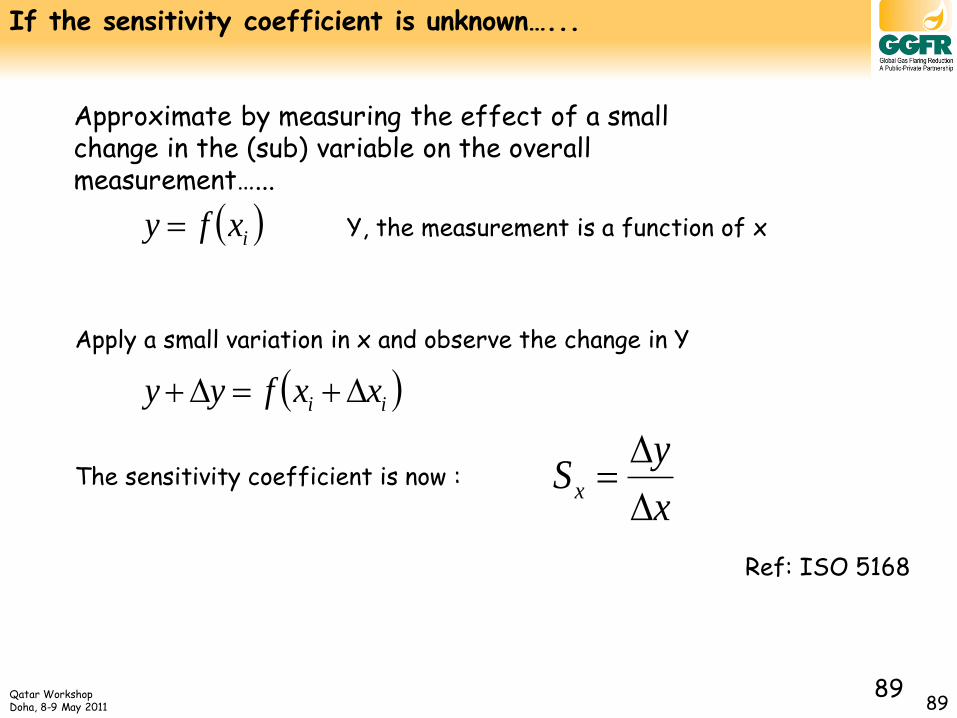
If the sensitivity coefficient is unknown…...
89
Approximate by measuring the effect of a small change in the (sub) variable on the overall measurement…...
ixfy
ii xxfyy
Y, the measurement is a function of x
Apply a small variation in x and observe the change in Y
The sensitivity coefficient is now :
x
ySx
Ref: ISO 5168

Qatar Workshop Doha, 8-9 May 2011 90
Uncertainty Analysis Procedure - Flare Gas Meter
What are relevant parameters:
• Widely varying flow rates
• Gas Composition (measured / fixed)
• Pressure (measured / fixed)
• Temperature (measured / fixed)
• Geometric uncertainties
• Inlet/Outlet piping effects

Qatar Workshop Doha, 8-9 May 2011 91
Example Gas Flow Meter Uncertainty
Calculation Algorithm
of Gas Flow Meter
PR
TR
CR
MR
QR
Pressure
Temperature
Composition
Meter Reading
Gas Flow Rate

Qatar Workshop Doha, 8-9 May 2011 92
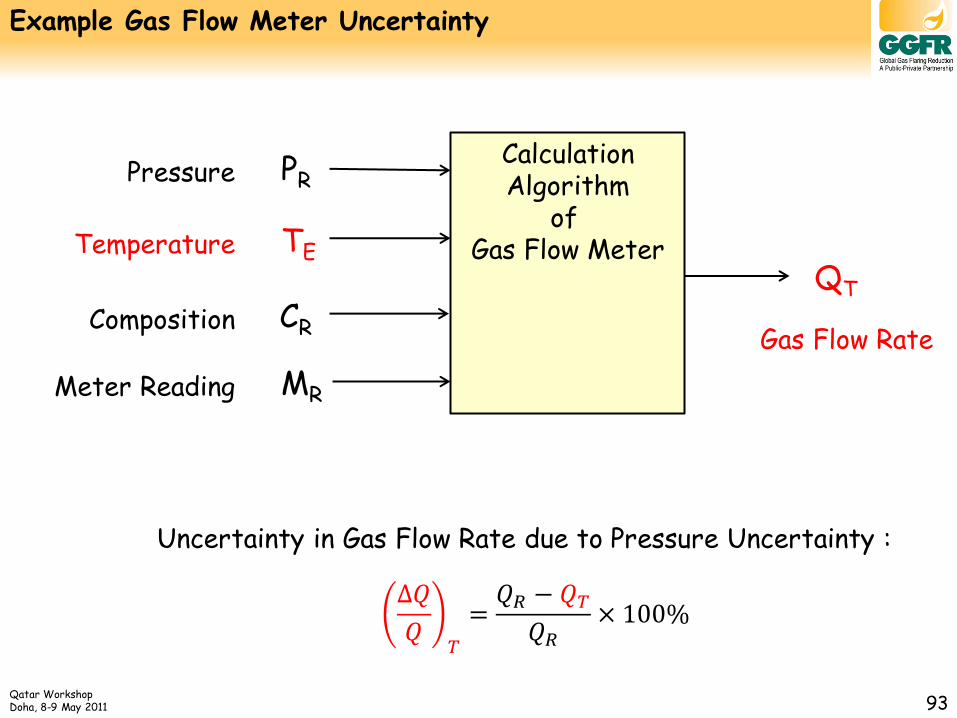
Example Gas Flow Meter Uncertainty
Calculation Algorithm
of Gas Flow Meter
PE
TR
CR
MR
QP
Uncertainty in Gas Flow Rate due to Pressure Uncertainty :
Δ𝑄
𝑄𝑃
=𝑄𝑅 − 𝑄𝑃
𝑄𝑅× 100%
Pressure
Temperature
Composition
Meter Reading
Gas Flow Rate
Qatar Workshop Doha, 8-9 May 2011 93
Example Gas Flow Meter Uncertainty
Calculation Algorithm
of Gas Flow Meter
PR
TE
CR
MR
QT
Uncertainty in Gas Flow Rate due to Pressure Uncertainty :
Δ𝑄
𝑄𝑇
=𝑄𝑅 − 𝑄𝑇
𝑄𝑅× 100%
Pressure
Temperature
Composition
Meter Reading
Gas Flow Rate

Qatar Workshop Doha, 8-9 May 2011 94
Example Gas Flow Meter Uncertainty
Same for others ………
Adding all uncertainties results in total gas flow rate uncertainty (i.e. worst case scenario)
∆𝑄
𝑄𝑇𝑜𝑡𝑎𝑙
=∆𝑄
𝑄𝑃
+∆𝑄
𝑄𝑇
+∆𝑄
𝑄𝐶
+∆𝑄
𝑄𝑀
∆𝑄
𝑄𝑇𝑜𝑡𝑎𝑙
=∆𝑄
𝑄𝑃
2
+∆𝑄
𝑄𝑇
2
+∆𝑄
𝑄𝐶
2
+∆𝑄
𝑄𝑀
2
Better to use the square root of the sum of squares (i.e. not all uncertainties work against you)
Pressure 2.00% Temperature 0.10% Composition 2.00% Meter Reading 1.40%
Worst Case 5.50% RSS 3.16%
EXAMPLE

Qatar Workshop Doha, 8-9 May 2011 95
Examples of Composition Effects
CO2 H2S CH4 C2H6 C3H8 H2
Base Case 1.00 0.90 97.00 1.00 0.10 -
Case 1 Propane Increased
0.53 0.47 51.08 0.53 47.39 -
Case 2 Hydrogen Added
0.40 0.36 38.80 0.40 0.04 60.00
Case 3 CO2 Increased
12.00 0.80 86.22 0.89 0.09 -
Qatar Workshop Doha, 8-9 May 2011 96
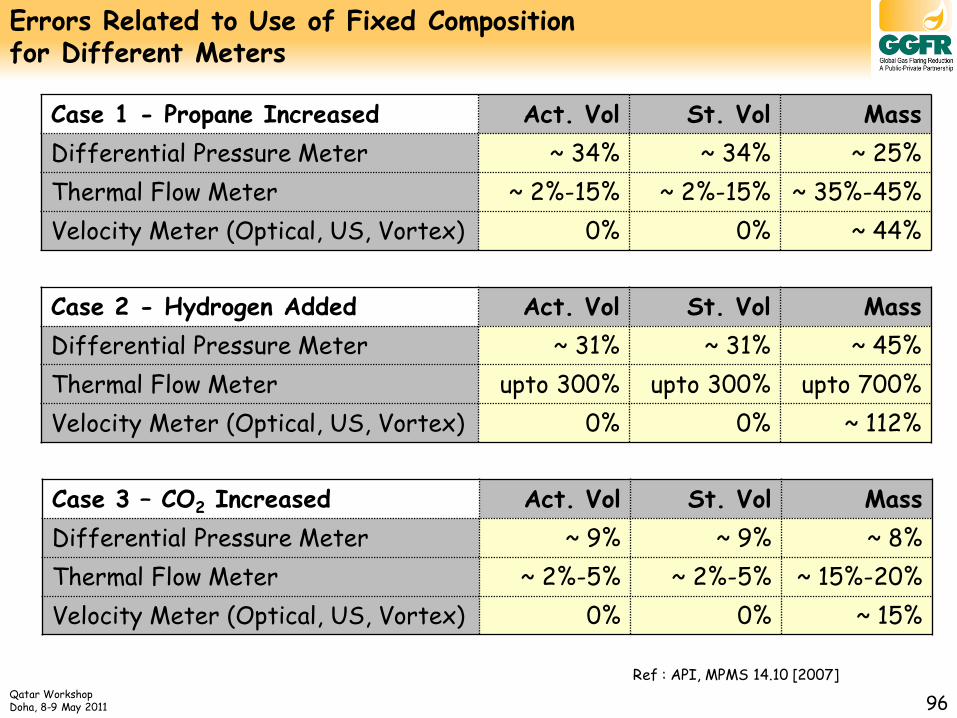
Errors Related to Use of Fixed Composition for Different Meters
Case 1 - Propane Increased Act. Vol St. Vol Mass
Differential Pressure Meter ~ 34% ~ 34% ~ 25%
Thermal Flow Meter ~ 2%-15% ~ 2%-15% ~ 35%-45%
Velocity Meter (Optical, US, Vortex) 0% 0% ~ 44%
Ref : API, MPMS 14.10 [2007]
Case 2 - Hydrogen Added Act. Vol St. Vol Mass
Differential Pressure Meter ~ 31% ~ 31% ~ 45%
Thermal Flow Meter upto 300% upto 300% upto 700%
Velocity Meter (Optical, US, Vortex) 0% 0% ~ 112%
Case 3 – CO2 Increased Act. Vol St. Vol Mass
Differential Pressure Meter ~ 9% ~ 9% ~ 8%
Thermal Flow Meter ~ 2%-5% ~ 2%-5% ~ 15%-20%
Velocity Meter (Optical, US, Vortex) 0% 0% ~ 15%

Qatar Workshop on Measurement/Reporting
of Flare Gas
Doha, Qatar 8th and 9th May 2011
Facilitated by Lex Scheers Hint Services BV
Methods for Estimating Flare and Vent Volumes

Qatar Workshop Doha, 8-9 May 2011 98
You can’t manage if you can’t measure ……
Preferred methods to determine the Flare and Vent volumes are measurements in a closed gas balance (no un-measured gas streams and no measurement by difference) Subsequently, allocation algorithms indicates the quality of the closed balance and provides the final gas figures like:
• sales gas (the largest of all) • own use (compressors, glycol units, instruments, storage, etc) • flared and vented gas • produced gas from wells • injected gas (into reservoir) • lift gas for oil production • others…
However, measurements are not always there (blowdown, pipe rupture, blow-out, etc), hence we need to “guestimate”
Qatar Workshop Doha, 8-9 May 2011 99
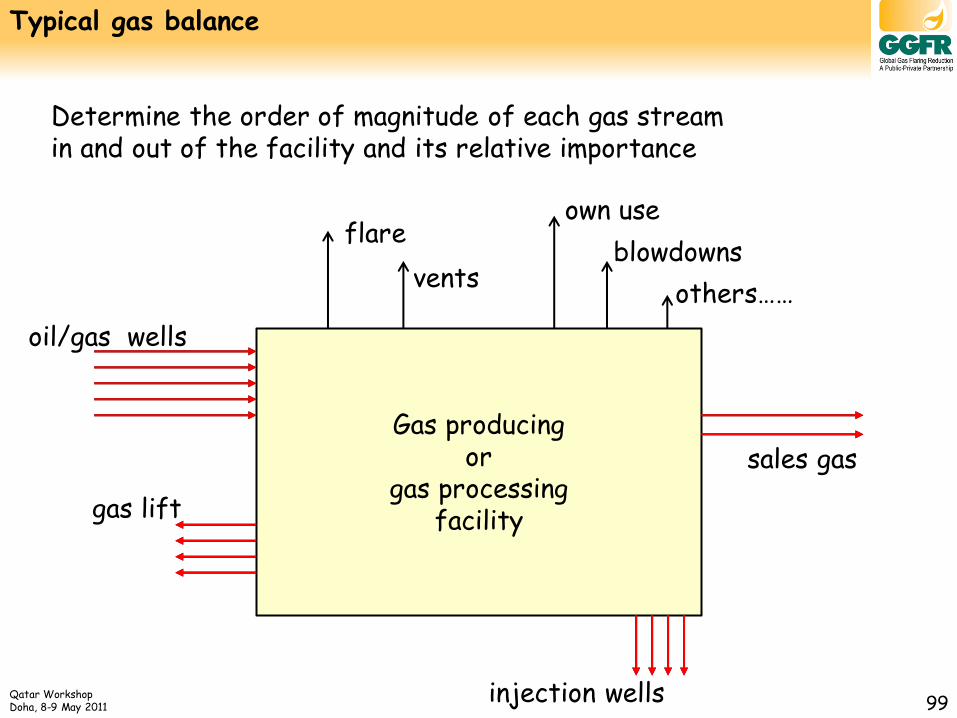
Typical gas balance
Determine the order of magnitude of each gas stream in and out of the facility and its relative importance
Gas producing or
gas processing facility
oil/gas wells
injection wells
gas lift
flare
vents
own use
blowdowns
others……
sales gas

Qatar Workshop Doha, 8-9 May 2011 100
Where to put a second flow meter with +/- 5% relative error Which position gives best accuracy ?
Closing the balance by difference
Flare 100 m3/d
1100 m3/d Production
1000 m3/d +/- 2% ?
Sales
?
Flare installation : Flare +/- 5% Production +/- 2.7% Production installation : Production +/- 5% Flare +/- 72%
Measurement by difference should be avoided. However, if it is the only way then avoid the subtraction of two big numbers to get a small number !!!
Qatar Workshop Doha, 8-9 May 2011 101
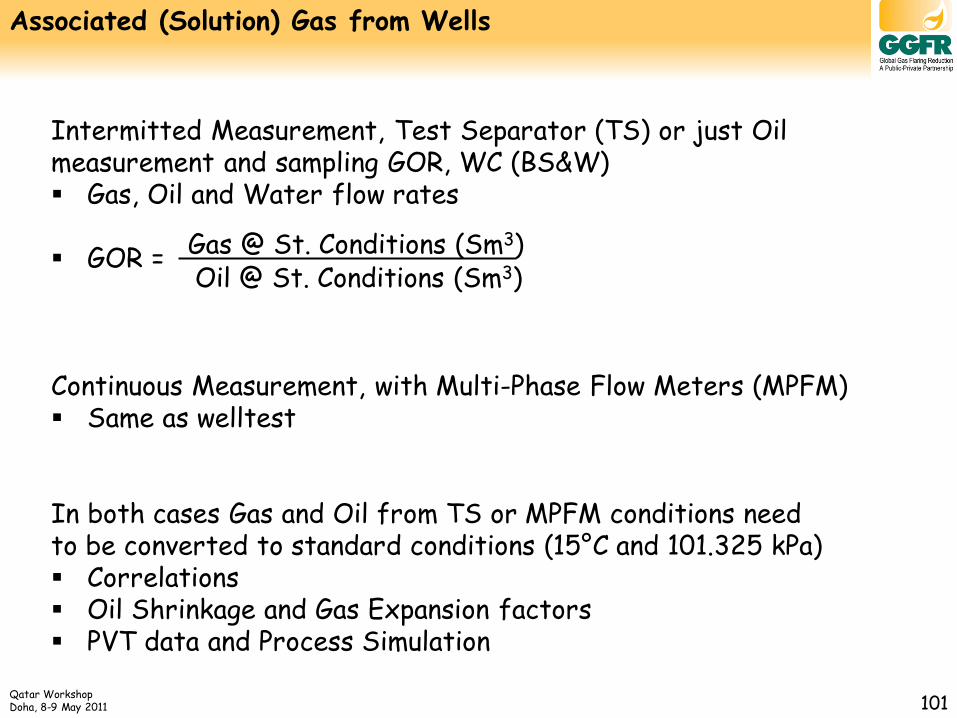
Associated (Solution) Gas from Wells
Intermitted Measurement, Test Separator (TS) or just Oil measurement and sampling GOR, WC (BS&W) Gas, Oil and Water flow rates
GOR = Continuous Measurement, with Multi-Phase Flow Meters (MPFM) Same as welltest In both cases Gas and Oil from TS or MPFM conditions need to be converted to standard conditions (15°C and 101.325 kPa) Correlations Oil Shrinkage and Gas Expansion factors PVT data and Process Simulation
Gas @ St. Conditions (Sm3) Oil @ St. Conditions (Sm3)

Qatar Workshop Doha, 8-9 May 2011 102
Well Testing (Conventional) - 3 Phase Test Separator

Qatar Workshop Doha, 8-9 May 2011 103
222
,,
,
2
,,
,
1
liquid
liquid
liftgtotalg
liftg
liftgtotalg
totalg
Q
Q
wc
wc
Q
Q
FGOR
FGOR
oil
formationg
liquidoil
liftgtotalgformationg
Q
QFGOR
QwcQ
QQQ
,
,,,
).1(
Reservoir
Qliquid
Qg,total
Qg,lift
watercut
Test Sep
M %
GOR measurement
M
M

Qatar Workshop Doha, 8-9 May 2011 104
Well Testing (Advanced) - Multi-Phase Flow Meter (MPM, Norway)
Purpose
Continuous Oil, Water and Gas flow rate measurement in a multi-phase environment
Technology
Venturi
3D Broadband Tomography
Gamma Ray Absorption
Algorithms
Features
Compact design
Simple field configuration
Redundancy
In-situ gas fluid property measurement
Water salinity measurement
Wet Gas and Multiphase mode
Low sensitivity for changes in fluid property
SUB-SEA VERSION
Qatar Workshop Doha, 8-9 May 2011 105
Estimation of Flaring and Venting
Most preferred option is to measure all streams in and out,
However, sometimes not possible, e.g. • Production Storage Tanks • Pipe Rupture/Well Blow-outs • Emergency Shutdown (Safety Valves, Pressure Relief) • Instrument/Pneumatic devices • Well (Facility) Blow-downs • etc.
then engineering calculations should be used to “guestimate”

Qatar Workshop Doha, 8-9 May 2011 106
Estimation of Flaring and Venting - Production Storage Tanks
Lighter HC gasses evaporate from storage tanks
Breathing
Filling/Emptying
Flashing
API report 2518, 2nd edition (1991) replaced by MPMS Ch 19.1 (2002)
• Correlations, e.g. Standing or Vasquez & Beggs • Process Simulators, e.g. ProII or Hysys
Standing Correlation
Valid within a certain range of parameters (e.g. Bubble Point, Temperature, GOR, Oil Gravity (API), Vapour Specific Gravity)
Approx. accuracy 10-15%
𝑅𝑠 = 𝛾𝑔𝑝
519.7 × 10𝛾𝑔
1.2048
𝑅𝑠 = 𝑆𝑜𝑙𝑢𝑡𝑖𝑜𝑛 𝐺𝑂𝑅 (𝑚3/𝑚3)
𝛾𝑔 = 𝑆𝐺 𝑜𝑓 𝑠𝑜𝑙𝑢𝑡𝑖𝑜𝑛 𝑔𝑎𝑠 (−)
𝛾𝑜 = 𝑆𝐺 𝑜𝑓 𝑜𝑖𝑙 (−)
𝑇 = 𝑇𝑒𝑚𝑝𝑒𝑟𝑎𝑡𝑢𝑟𝑒 (𝐾)
𝑝 = 𝑃𝑟𝑒𝑠𝑠𝑢𝑟𝑒 (𝑘𝑃𝑎)
𝑦𝑔 = 1.255 + 0.00164 × 𝑇 −1.769
𝛾𝑜

Qatar Workshop Doha, 8-9 May 2011 107
Estimation of Flaring and Venting - Instrument/Pneumatic Devices
Gas used to power devices (injection pumps) or used to drive instruments (valves, instrument controller, etc)
Determine :
Average use for each type of device
Average operation time
Number of devices
Estimate the monthly vent rate based on above

Qatar Workshop Doha, 8-9 May 2011 108
Estimation of Flaring and Venting - Emergency Shutdown (Safety Valves, Pressure Relief)
Depends on :
Duration
Temperature and Pressure
Throat of relief valve
Gas properties
𝑚 = 𝑚𝑎𝑠𝑠 𝑓𝑙𝑜𝑤 𝑟𝑎𝑡𝑒 (𝑘𝑔/𝑠)
𝐴 = 𝐶𝑟𝑜𝑠𝑠 𝑆𝑒𝑐𝑡𝑖𝑜𝑛𝑎𝑙 𝐴𝑟𝑒𝑎 𝑇ℎ𝑟𝑜𝑎𝑡 (𝑚2)
𝑃0 = 𝑃𝑟𝑒𝑠𝑠𝑢𝑟𝑒 𝑅𝑒𝑙𝑖𝑒𝑓 𝑆𝑒𝑡𝑝𝑜𝑖𝑛𝑡 (𝑘𝑃𝑎)
𝑇0 = 𝑇𝑒𝑚𝑝𝑒𝑟𝑎𝑡𝑢𝑟𝑒 (𝐾)
𝑘 = 𝑆𝑝𝑒𝑐𝑖𝑓𝑖𝑐 𝐻𝑒𝑎𝑡 𝑅𝑎𝑡𝑖𝑜,𝐶𝑝
𝐶𝑣
𝑅 = 𝐺𝑎𝑠 𝐶𝑜𝑛𝑠𝑡𝑎𝑛𝑡, 8314 kJ/kg/K
𝑚 = 𝐴 ×𝑝0
𝑇0 ×
𝑘
𝑅 ×
1
𝑘 + 12
(𝑘+1)/(2𝑘−2)× 1000

Qatar Workshop Doha, 8-9 May 2011 109
Monitoring and Reporting
Measured and estimated volumes needs to be monitored and reported in a transparent and single database
Preferable the corporate HC oil and gas accounting system needs to be used for this purpose
Linked to the overall gas balance (production, sales, etc)
To allocate flare and vent volumes back to contributors
Tax and royalty (Fiscal) reasons
Reporting of unbalance
Flaring and Venting as part of the daily reporting
Qatar Workshop Doha, 8-9 May 2011 110
History of Energy Components
EC has been around in since 1996
Originally different for each client
Web based since 2005 (version 8)
Wide client base
World Wide Implementations
On every continent
Selected as the global standard and best practice by oil & gas majors

Qatar Workshop Doha, 8-9 May 2011 111
Energy Components Production - Overview
Web based Oracle data base system
Users access it using Internet Explorer
Flexible, configurable, secure
Takes production data
Well tests, meter readings, tank volumes, samples, pressures, etc.
Manually keyed and electronic data input, i.e. PI, SCADA, DCS, etc.
Allocates fiscal production down to wells and reservoirs
Provides ad-hoc, daily, weekly, monthly reports.
Hand-off data to other systems
Provides tight data controls
In support of SOX 404

Qatar Workshop Doha, 8-9 May 2011 112
Energy Components - Product Overview
SAP
4 Main Business Area

Qatar Workshop Doha, 8-9 May 2011 113
Energy Components - Reporting and Interfaces
Calculated Data
Input Data
Configuration
Allocation
Reporting
Interfaces
Business Objects
MS Excel MS Access
Metering Atlas
Oracle system
ODBC system
Etc.
Qatar Workshop Doha, 8-9 May 2011 114
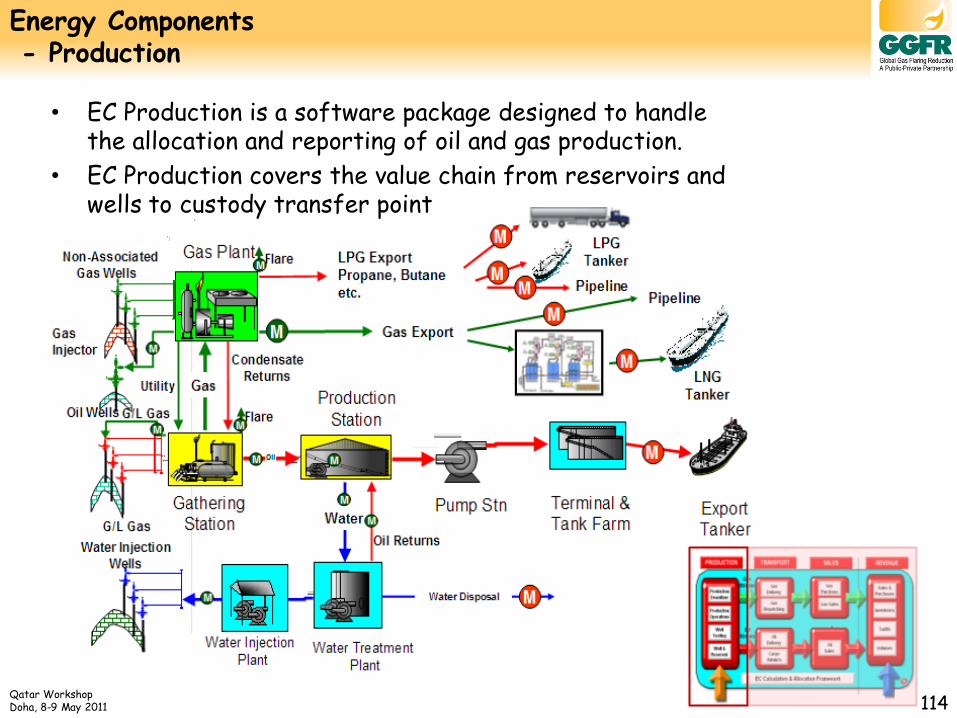
Energy Components - Production
• EC Production is a software package designed to handle the allocation and reporting of oil and gas production.
• EC Production covers the value chain from reservoirs and wells to custody transfer point

Qatar Workshop Doha, 8-9 May 2011 115
Production Net Oil Gas Water Watercut
Wells [days] [Sm3] [k Sm3] [Sm3] [%]
XX-122 30.43 77,774.7 7,451.7 0.0 0.0%
XX-123 30.43 28,385.8 3,002.9 800.0 2.7%
XX-124 16.93 18,467.3 4,455.9 8,234.0 30.8%
XX-125 30.43 30,255.3 3,220.9 0.0 0.0%
XX-126 0.00 0.0 0.0 0.0 NA
XX-127 30.43 71,432.4 6,252.1 0.0 0.0%
XX-128 21.47 23,126.9 3,334.9 8,924.0 27.8%
XX-129 30.43 54,469.5 5,616.7 0.0 0.0%
XX-130 30.43 56,935.1 6,424.6 345.0 0.6%
XX-131 12.90 14,392.9 3,449.0 0.0 0.0%
XX-132 29.44 17,194.6 3,047.3 6,789.0 28.3%
XX-133 27.71 16,453.9 2,230.8 545.0 3.2%
XX-134 8.90 5,839.0 1,364.5 4,567.0 43.9%
Total 414,727.4 49,851.4 30,204.0
How is this information determined ? 1) Spot sample once a year (month) at well head 2) Average of well test separator reading 3) Continuous with a Multi-Phase Flow Meter
Example of a Monthly Production Report [1] - Watercut

Qatar Workshop Doha, 8-9 May 2011 116
Production Net Oil Gas Water Watercut
Wells [days] [Sm3] [k Sm3] [Sm3] [%]
XX-122 30.43 77,774.7 7,451.7 0.0 0.0%
XX-123 30.43 28,385.8 3,002.9 800.0 2.7%
XX-124 16.93 18,467.3 4,455.9 8,234.0 30.8%
XX-125 30.43 30,255.3 3,220.9 0.0 0.0%
XX-126 0.00 0.0 0.0 0.0 NA
XX-127 30.43 71,432.4 6,252.1 0.0 0.0%
XX-128 21.47 23,126.9 3,334.9 8,924.0 27.8%
XX-129 30.43 54,469.5 5,616.7 0.0 0.0%
XX-130 30.43 56,935.1 6,424.6 345.0 0.6%
XX-131 12.90 14,392.9 3,449.0 0.0 0.0%
XX-132 29.44 17,194.6 3,047.3 6,789.0 28.3%
XX-133 27.71 16,453.9 2,230.8 545.0 3.2%
XX-134 8.90 5,839.0 1,364.5 4,567.0 43.9%
Total 414,727.4 49,851.4 30,204.0
How is this information determined ? 1) What equipment has been used ? 2) How often is the data gathered ? 3) Is equipment calibrated and operating OK ? 4) What is uncertainty indication ?
Example of a Monthly Production Report [2] - Net-Oil flowrate

Qatar Workshop Doha, 8-9 May 2011 117
Metering Dashboard
HEALTH MODULE
COLLABORATIVE MODULE
SE
CU
RIT
Y
IN
TE
RF
AC
E
IN
TE
RF
AC
E
HU
MA
N - M
ACH
IN
E
IN
TE
RF
ACE
DATA CONSUMERS
HCA tools
GIS
Data Historian
Engineering DB
Preferred Vendor List
LIMS
Business Mgt
Metering Calc’s
Document Mgt
Metering Dashboard - Block Diagram
Qatar Workshop Doha, 8-9 May 2011 118
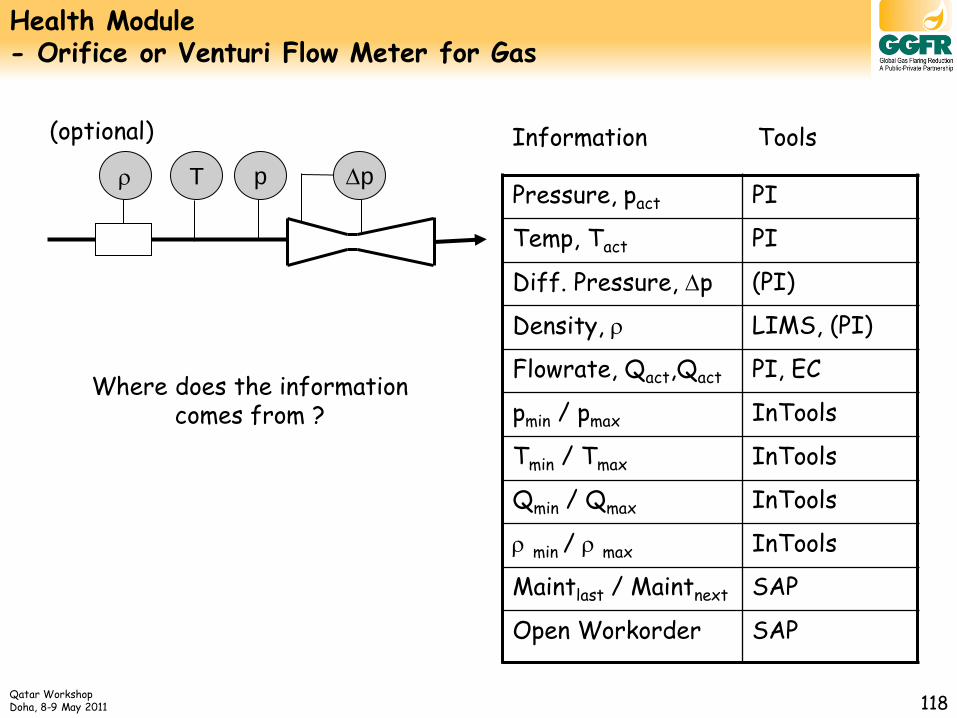
Health Module - Orifice or Venturi Flow Meter for Gas
Pressure, pact PI
Temp, Tact PI
Diff. Pressure, p (PI)
Density, LIMS, (PI)
Flowrate, Qact,Qact PI, EC
pmin / pmax InTools
Tmin / Tmax InTools
Qmin / Qmax InTools
min / max InTools
Maintlast / Maintnext SAP
Open Workorder SAP
Where does the information comes from ?
Information Tools
T p
(optional)
p

Qatar Workshop Doha, 8-9 May 2011 119
Health Module - Orifice or Venturi Flow Meter for Gas
Qact(PI) = Qact(EC)
pmin(InTools) < pact(PI) < pmax(InTools)
Tmin(InTools) < Tact(PI) < Tmax(InTools)
Qmin(InTools) < Qact(PI, EC) < Qmax(InTools)
min(InTools) < act (PI, LIMS) < max(InTools)
(PI) ≈ (LIMS)
Maintnext (SAP) < Current Date
Open Workorder (SAP)
T p
(optional)
p
Example Rules
All Health Rules are configurable by the user

Qatar Workshop Doha, 8-9 May 2011 120
Metering Dashboard shows health and details of Metering Systems to all who have an interest in production data
Metering Dashboard provides a platform to collaborate between “metering data providers” and “metering data consumers”
However, Metering Dashboard is not the cure, it summarizes the status and makes things visible to the users
Feed back from various data consumers, i.e. Reservoir Engineers, Petroleum Engineers and Asset managers is very positive.
We have moved from a “trust me world” into a “show me world”
Metering Dashboard - Features

Qatar Workshop on Measurement/Reporting
of Flare Gas
Doha, Qatar 8th and 9th May 2011
Facilitated by Lex Scheers Hint Services BV
Advice on Improving/Redesigning Gas Measurement System in Qatar

Qatar Workshop Doha, 8-9 May 2011 122
Comments to Questionnaire Responds [1]
Key items Response received Comments Current measurement practice
25% of respondents use meters and 75% use different estimation methods.
Measurements preferred, 25% is low
Types of meters identified
Orifice and Ultrasonic meters
Orifice not the preferred way (limited turndown), UltraSonic is OK
Estimation methods used
PE model, Mass balance, estimation from design flow figures for stacks, different engineering calculations (not sure which is used)
Mass balance is the preferred option
Uncertainty determination
44% of operators accounts for uncertainty and 56% do not account for uncertainty
Key is “management” of uncertainty in measurement or estimation.
Composition of flared gas
Most respondents measure gas compositional analysis.
Spot/Continuous ?
Method for determining gas composition
38% uses meters such as gas chromatography, mass spectrometer and lab analysis. 46% uses methods such as process steam material balance, design composition and different estimation based on internal approved engineering calculations or process.
Measurement preferred (economics) Internal approved calc’s ?

Qatar Workshop Doha, 8-9 May 2011 123
Comments to Questionnaire Responds [2]
Key items Response received Comments Frequency of gas compositional analysis
12 % of respondents do weekly measurement of their compositional analysis, 19% do it continuously, 25% does it as required by internal or external regulatory or approved process, and 25% do it annually or during flaring incidents. 19% do not determine or measure gas compositional analysis at all.
Hence, 75% non-compliant with regulator (high) …… 19% without compositional analysis seems high
Laboratory accreditation
87% of respondents do not have accredited lab. 13% have accredited labs. Of the 87% that do not have accredited labs, 19% are in the process to getting accredited.
Opportunity for Improvement
Calibration frequency for gas flow meters
63% says its not applicable, 31% calibrates yearly and 6% bi-annually
Opportunity for Improvement, at least a bi-annually calibration
Calibration approach
75% of respondents use third party involvement in gas flow meter calibration and 25% do not have third party involvement.
Seems OK

Qatar Workshop Doha, 8-9 May 2011 124
Comments to Questionnaire Responds [3]
Key items Response received Comments Flare data reporting frequency
All respondents report flare data daily, weekly, monthly, quarterly and annually based on MoE’s requirements.
Reporting is one, but what is the uncertainty ?
Closed gas balance systems & meters used
49% do not use any meter or are not sure of the meter used. 51% uses either of the following meters; orifice, vortex and ultrasonic.
Opportunity for Improvement, Gas balances are quality indicators, Mass balances are preferred.
Global standards or guidance used for accounting for flared gas
87% of respondents do not use global standards or guidelines (most operators uses internally approved procedures which varies from operator to operator). 13% uses global standards such as the EU GHG guidelines and the API.
Do is once, Do it right, Do it internationally Regulators and Operators to co-operate and jointly develop a standard

Qatar Workshop Doha, 8-9 May 2011 125
Comments to Questionnaire Responds [3]
Key items Response received Comments Suggestions for Flare data management system
Automated data management system, volumetric gas balance, gas feed and production measured and reported accurately in all degassing stations, standard input for all relevant data and sharing data for all locations, unified approach, common flare reporting guidelines, reporting on mass basis to allow simple comparison and standardized regulation of meter flow measurement.
Mass vs Volume balance, Intergrated in HC accounting system (production, injection, sales, etc), Management of uncertainty, Standardization