introduction - moec.gov.afmoec.gov.af/content/files/saarc sdg report on afghanistan(1).pdf ·...
TRANSCRIPT

Introduction
The South Asian Regional Cooperation organization (SAARC) established on 8 December
1985, the headquarter is located in Katmandu, Nepal which has 8 member countries namely
Afghanistan, Nepal, India, Pakistan, Bhutan, Maldives, Sri Lanka and Bangladesh.
Afghanistan received its membership on April 2007 on the occasion of 4th SAARC summit.
At the Twelfth Summit held in Islamabad, Pakistan (4-6 January 2004), the Heads of States in
their declaration directed the Independent South Asian Commission on Poverty Alleviation
(ISACPA) to submit to the Thirteenth SAARC Summit “a comprehensive and realistic blue-
print setting out SAARC Development Goals for the next five years in the areas of poverty
alleviation, education, health, and environment giving due regard, among others, to
suggestions made in the ISACPA Report”.
In addition to the SAARC mandate there is another motives which is achieving Millennium
development goals (MDGs) 2015, and the overall image of poverty and standard of life in
the south Asian countries.
The present report titled “SAARC Development goals – Afghanistan” representing the 22
goals alienated; Livelihood, Health, Education, and Environmental is arranged in
correspondence to the declaration directed to the ISACPA.
This report is prepared by the General Directorate of Policy, Result based Monitoring and
evaluation, of Ministry of Economy of the Government of Islamic Republic of Afghanistan
which highlights trends, problems and comprehensive studies of the indicators
recommended by the Independent south Asian commission on Poverty alleviation.
Afghanistan like all the south Asian countries suffers from poverty, vulnerability and access
to basic needs on health, education, safe drinking water. Further, high gender imbalances,
injustice, and malnutrition among children remain to still worse.
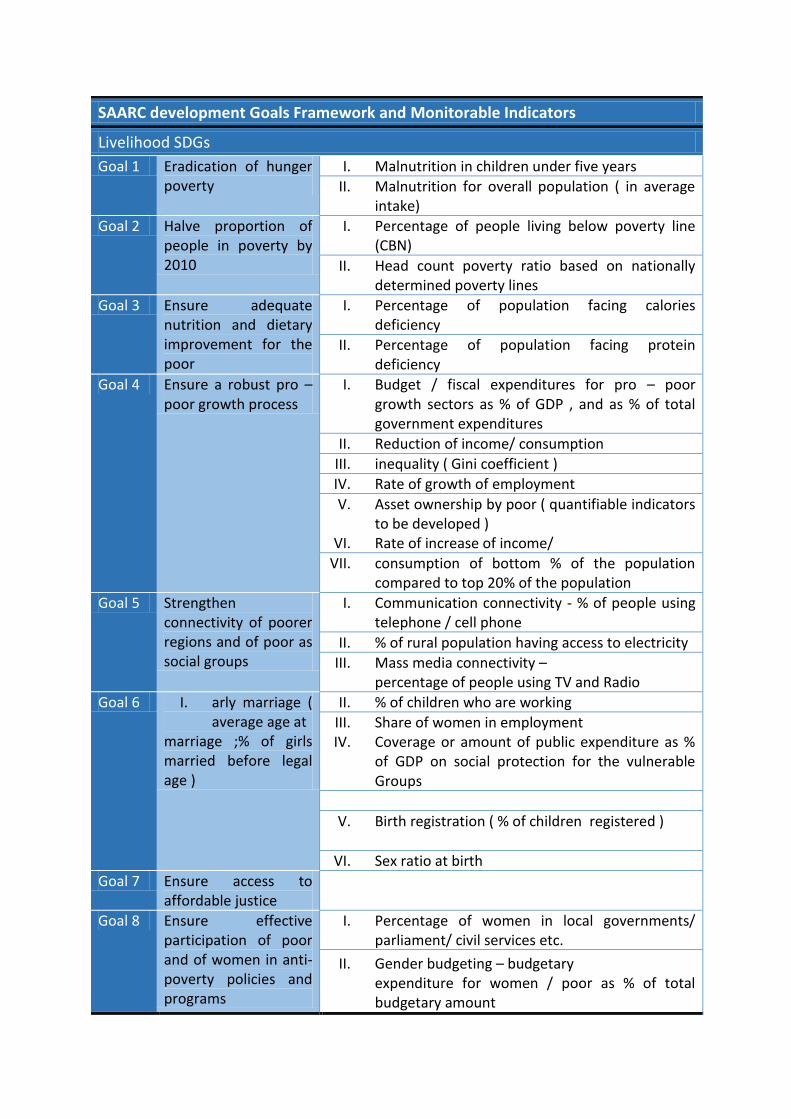
SAARC development Goals Framework and Monitorable Indicators
Livelihood SDGs
Goal 1 Eradication of hunger poverty
I. Malnutrition in children under five years
II. Malnutrition for overall population ( in average intake)
Goal 2 Halve proportion of people in poverty by 2010
I. Percentage of people living below poverty line (CBN)
II. Head count poverty ratio based on nationally determined poverty lines
Goal 3 Ensure adequate nutrition and dietary improvement for the poor
I. Percentage of population facing calories deficiency
II. Percentage of population facing protein deficiency
Goal 4 Ensure a robust pro – poor growth process
I. Budget / fiscal expenditures for pro – poor growth sectors as % of GDP , and as % of total government expenditures
II. Reduction of income/ consumption
III. inequality ( Gini coefficient )
IV. Rate of growth of employment
V. Asset ownership by poor ( quantifiable indicators to be developed )
VI. Rate of increase of income/
VII. consumption of bottom % of the population compared to top 20% of the population
Goal 5 Strengthen connectivity of poorer regions and of poor as social groups
I. Communication connectivity - % of people using telephone / cell phone
II. % of rural population having access to electricity
III. Mass media connectivity – percentage of people using TV and Radio
Goal 6 I. arly marriage ( average age at
marriage ;% of girls married before legal age )
II. % of children who are working
III. Share of women in employment IV. Coverage or amount of public expenditure as %
of GDP on social protection for the vulnerable Groups
V. Birth registration ( % of children registered )
VI. Sex ratio at birth
Goal 7 Ensure access to affordable justice
Goal 8 Ensure effective participation of poor and of women in anti- poverty policies and programs
I. Percentage of women in local governments/ parliament/ civil services etc.
II. Gender budgeting – budgetary expenditure for women / poor as % of total budgetary amount

Goal 1: Eradication of hunger Poverty
According to Afghanistan multiple indicator cluster survey 2010/11 (AMICS) Almost one in
three children under age five in Afghanistan is moderately and severely underweight (31%),
one in two is moderately stunted (55%) and almost one in five is moderately or severely
wasted (18%). Children in the Southern region are more likely to be underweight, stunted
and wasted than other children. The same pattern is observed for children living in rural
areas, and for children whose mothers have secondary education or higher.
Based on the recent national risk and vulnerability 2011 – 12 survey by the central statistical
organization, overall 30.1 percent of the Afghan population which makes 7.6 million people
had a calorie intake that is insufficient to sustain a healthy and active life. An estimated 2.2
million people (or 8.5 percent) are very severely, 2.5 million (9.5 percent) severely, and 3.1
million (12.2) moderately food insecure.
In terms of residence, the urban population is suffering more from food insecurity
compared to Rural and Kuchi population. The level of urban food insecurity percentage is
34.4 percent while it is 25.6 percent in the Kuchi Population and 29.1 percent in the rural
area. The majority of people facing calorie deficiency are also affected by inadequate
protein consumption. On the national level 19.4 percent of the population is facing protein
deficiency where comparing by residence the urban population is suffering more than rural
and Kuchi population. Seasonality and food security has a close linkage in Afghanistan. Food
security is more dependent on the condition of agriculture, and irrigation.
Residence Calorie Deficiency Protein Deficiency
Million Percentage Million Percentage
Urban 2.1 34.4 1.3 21.3
Rural 5.2 29.1 3.4 19.1
Kuchi 0.4 25.6 0.2 15.3
Total 7.6 30.1 4.9 19.4
Goal 2: Half proportion of people in poverty by 2010.
Poverty estimation for Afghanistan is based on the cost of basic needs approach (CBN) and
poverty approach below 1$ per day is not practiced. In Afghanistan approximately 35.8
percent of the population are consuming below the poverty line based on the cost of basic
need approach which makes 9 million people, estimated by the recent 2011/12 household
survey of NRVA by central statistical organization.
Poverty indicators Survey year 2011- 2012 NRVA
Poverty headcount 35.8
Poverty Gap 8.6
Squared poverty Gap 3.0
Despite fast Economic growth in Afhgnaistan poverty remain unchanged over the course of
past five years . yet the studies shows that the riches benefited more and inequaility remain
wide as the income growth of the poorest quntile is very less compared to the richest
indicated below .

Quintile Annual Growth (%) NRVA 2011-12
1 (Poorest) 0.9
2 1.7
3 2.0
4 2.3
5 (Richest) 3.2
Total 2.4
Goal 3: Ensure adequate nutrition and dietary improvement for the poor. This
indicator is reported in the first goal indicator one.
Goal 4: ensure a robust pro – poor growth process. The Afghanistan national
development strategy 2008-2013 (ANDS) was a five year strategic plan of Afghanistan and
serves as a poverty reduction paper. Though it was as a poverty reduction strategic paper
still, the number of poor remain unchanged. the ANDS have been achieved by 66 percent
based on the recent ANDS Completion report and some of the sectors have significant
achievements while others remain underachieved particularly related to alleviation of
poverty. Lack of security, good governance, capacity and close cooperation between donors
and Afghan government are the numbers of factors contributed in less effectiveness of the
ANDS implementation on poverty alleviation targets.
Goal 5: Strengthen connectivity of poorer regions and of poor as social groups.
Access to communication and mass media in Afghanistan is one of the success highlighted
story. In Afghanistan about 82 percent of the population are covered to have access to
cellphones and landline connectivity, based on the recent quarter report of 2014 of
Ministry of Information and technology.
Under National Rural Access Program (NRAP) around 12033 km roads constructed of which
3810 km of tertiary roads to connect rural villages to districts’ cities and 8223 km of
secondary roads to connect districts to provinces’ cities have been constructed.
Goal 6: Reduce social and institutional vulnerability. More than 48 percent of the
Afghan population is below the age of 14 years of age, which make Afghanistan a young
country in the region. Women make 49 percent of the total population. Labour force
participation rate by sex shows that male participation rate is 80% while this only 18.5% for
female. Children, women and Kuchis (nomads) are the more vulnerable segments of our
society. As majority of the people engaged in the agriculture sector and agriculture is
dependent to the weather condition of the country. Favorable weather condition has direct
impact on the agriculture productivity and reciprocal is remain to be the scenario. While on
the other respect a small shock will affect many people to shift into poverty.
Goal 7: No data is available on this goal

Goal 8: Ensure effective participation of poor and of women in anti- poverty policies and
programs. This goal is measured by the Percentage of women in local governments/
parliament/ civil services and the budget expenditure for women and poor as part of the
budgetary amount. Based on the MDGs report 2012 of Afghanistan the ratio of female to
male in the government employee (public sector) in the central is 43 % while on the
provincial level the ratio decreases to 27%. The constitution of Afghanistan for national
assembly reserves at least 25% of seat held by the women. In 2007, the data shows the
value for ratio of seats held by women in national, provincial and district representative
bodies 24.9%, very close to the quota/target. In 2010 a value of 27% was registered which
showed an increase of over 2% in the ratio of seats held by women in national, provincial
and district representative bodies. Despite significant improvement in respect of women
participation in the decision making position and government participation, yet there are
still persist a wide gap between male and female participation.
Health SDGs
Goal 9
Maternal health I. Maternal mortality ratio (MMR)
II. Percentage of births covered by the skilled birth attendants (SBA)
III. Life expectancy of women as a ratio of life expectancy of men
IV. Age specific fertility rate of 15 to 24 years girls
Goal 10
Child health I. Immunization coverage
II. Under 5 mortality rate (CMR)
III. IMR
IV. Neo- natal mortality rate
Goal 11
Affordable health care
I. Out of pocket expenditure on health as a % of total household expenditure
II. Total government expenditure on health as a % of GDP
III. % of budget allocated to primary health care vis a vis total health budget
IV. No of doctors per 1000 of population
Goal 12
Improved hygiene and public health
I. Percentage of population with access to safe drinking water
II. % of population having access to sanitation
III. Policies on health education ( no . of programs preventing and health promoting , on communicable diseases e .g HIV/AID, TB and malaria
IV. Prevalence rate of HIV/AIDS, TB and malaria
Goal 9: Maternal Health. There is reported to be a significant progress in access to health
services following Education in the past one decade in Afghanistan. The Afghanistan
millennium development goals report 2012 shows that maternal mortality rate (MMR) as it
was 1600 per 100 thousands in the baseline year 2003 has significantly decreased between
2003 and 2012 . The MMR was 327 person per 100 thousands while it decreased to 320 in
2014 which indicates an 80 percent decrease from the baseline year.
The Percentage of births covered by the skilled birth attendants (SBA) has indicates an
improvement. This indicator is critical to save both mother and children life and it’s remain
to be an important input where Mortality rate has decreased. The Ministry of Public Health
reported only 6 percent access to skilled birth attendants in the year 2003 while, the
percentage of birth covered by the skilled births attends has increased 7 times by the year
2012 which indicates that 47 percent of the birth covered by the skilled birth attendance .
The life expectancy rate of Afghanistan based on the UNICEF report is estimated 60 years
unlikely it’s reported higher at the rate 62 years by the World Bank. On the other respect
the life expectancy percentage of female as a percentage of male is estimated higher at the
rate 103.4 meaning that women life cycle is bigger than that of men in Afghanistan.
According to the National risk and vulnerability survey 2012 the average household size
estimated at 7.6 for Afghanistan. Marriage is almost universal in Afghanistan and is
characterized by early marriage for women. However, significant changes are observed in
female age at first marriage. In the age group 30 years and older, 25 percent of women were
married at age 15, and at least 80 percent at age 20. For women in the age group 20-24
years the corresponding figures have decreased to, 17 and 65 percent respectively, and for
the age group 15-19 years only 6 percent were married at age 15.
The observed large spousal age difference is a prime cause of high levels of female
widowhood: 57 percent of women aged 65 and older are widowed. However, the age
difference is rapidly decreasing: while women aged 40 years and older have a husband who
is on average 7 years older, the age gap narrows for each younger age group, to around 4
years for women aged 15-19 years.
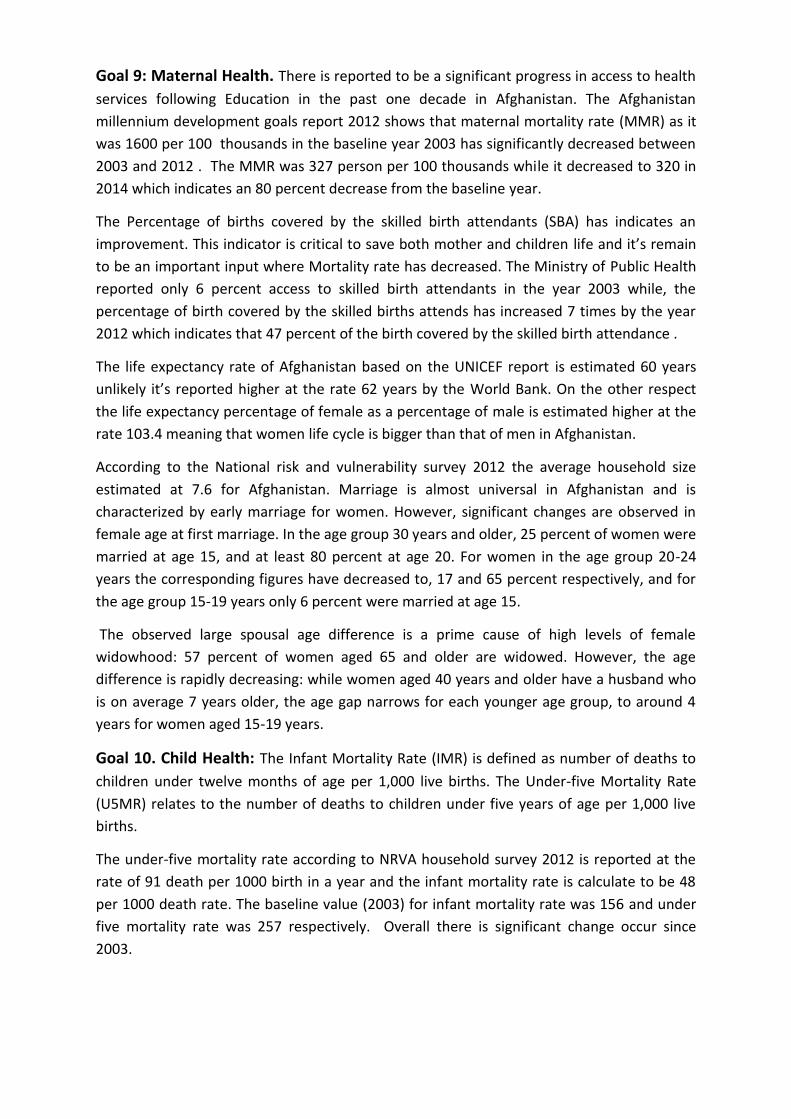
Goal 10. Child Health: The Infant Mortality Rate (IMR) is defined as number of deaths to
children under twelve months of age per 1,000 live births. The Under-five Mortality Rate
(U5MR) relates to the number of deaths to children under five years of age per 1,000 live
births.
The under-five mortality rate according to NRVA household survey 2012 is reported at the
rate of 91 death per 1000 birth in a year and the infant mortality rate is calculate to be 48
per 1000 death rate. The baseline value (2003) for infant mortality rate was 156 and under
five mortality rate was 257 respectively. Overall there is significant change occur since
2003.
The proportion percentage of 1 years old children immunized against measles have
increased considerably as it was 35 percent in the baseline and the latest data shows the
improvement as it increased to 62 percent almost double upsurge. Despite unprecedented
progress on child health still, there are much to be done in terms of access to basic health
services at the remote community.
Goal 11: Affordable health care. According to latest report of Afghanistan national
development strategy during the ANDS implementation period 2008 -2013 the total
approved development budget in this sector was 763 million USD of which 426 million USD
were spent by the ministry of Public health . In total for the entire five years total amount of
1.2 billion USD were spent of which 33% was through national budget and 58% external
budget.
Based on the UNICEF Afghanistan report the proportion of public expenditure on health is
1.5 percent of GDP. The data for the number of doctors per 1000 population is not available.
Goal 12: Access to clean drinking water. The percentage of population with Access to
clean drinking water as reported by the NRVA 2012 household survey indicates that 45.5
percent of the national population are using improved water source while only 8.3 percent
of the population has access to improved sanitation facility. Access to safe drinking water in
the baseline year 2003 was reported 23 percent and improved sanitation facility 12 percent
respectively. Though there seems to be improvement regarding water access while it’s more
likely that there was limitation with the baseline of access to sanitation which shows
decline.
161
102 97 91 114
74 76
48
0
20
40
60
80
100
120
140
160
180
NRVA 2007- 08 MICS 2010 AMS 2010 NRVA 2011-12
De
ath
Pe
r 1
,00
0 li
ve b
irth
Childhood Mortality indicators ,by Surveys
U5MR IMR

Education SDGs
Goal 13
Access to primary / communal school for all children, boys and girls
I. % - age of children having access to primary schools by distance ( physical or time to be decided by respective countries
II. Gross enrollment rate / net enrollment rate
III. Public expenditure on education in terms of GDP
IV. Gender parity at primary and secondary level
Goal 14
Completion of primary education cycle
I. Survival rates ( along with drop out )
Goal 15
Universal functional literacy
I. Adult literacy rate
Goal 16
Quality education at primary , secondary and vocational levels
I. % of trained teachers
II. Student teacher ratio
III. % of schools with toilets for girls
Goal 13: Security and distance to school facility are the major obstructions following
cultural barriers to non – attending schools. Yet, this varies across residence living in Rural,
Urban, and Kuchi. Unlike the Rural area Distance to school facility is not a big impediment
for children school non -attendance in the urban areas as there exist transportation facility
while it remain a big challenge for the Kuchi and Rural population. Nevertheless, cultural
reasons are reported high across all residence in Urban, Rural and Kuchi.95 percent of the
households both in Rural and Urban are living within two kilometers distance from primary
education facility where it affects girls more than boy given below in the chart.
95
44
29
54
97
36 27
48
0
20
40
60
80
100
120
Urban Rural Kuchi National
Households within two Kilometers distance from Primary
education facility , by Sex of students population , and by
residence (%)
Boy Girl

The net enrollment ratio in primary education has steadily improved since 2003 as the value
was recorded 54 in 2003 baseline while the recent data 2014 indicates the ratio as 80;
meaning 80 girls for each 100 boys. Similarly the gross enrollment ratio in primary education
was 82 in the baseline of 2003 and increased to 110.9. Though there seems to be significant
progress in the primary education. Yet security, distance to school and cultural reason are
the major obstacles on the national level. In terms of average expenditure on education as a
proportion of gross domestic product is estimated at 3.36 percent.
The situation of access to education for females has drastically improved since 2001. Ratio
of girls to boys in primary education is 71% and by 2015 the target is to improve this ratio to
83%, which however will be difficult to achieve. Ratio of girls to boys in secondary education
has also steadily improved from the dismal just over 30% to according to the data collected
for 2012 which is 57 percent, similarly the target for 2015 which is 70 percent is difficult to
achieve.
However, the gaps still remains wide concerning the ratio of girls to boys in tertiary
education. The value recorded for 2012 reveal this ratio to be 36%, accounted for ratio of
girls to boys in universities and other higher learning institutions, whilst accounting
universities only, the ratio is low as 22%.
Goal 14: This goal is dignified by survival rates (along with the drop out). Survival
Rate to Grade 5 in primary education is 64% in total and 62% and 66% for boys and girls
respectively in 2013. Since the real cohort analysis is not possible to the current calculation
of survival rate, then it is calculated based on the apparent survival rate in which grade 5
students in 2013 is divided by the number of grade 1 students in 2009. The shortcomings of
this calculation are that it does not consider the dropouts and repeaters as well as new
intake in the other grades (2-5). The GPI in the Survival rate to Grade 5 is estimated 0.93 in
2013. Comparing this GPI with GPI for other indicators it has the highest parity ratio.
3.2, 19%
3.8, 22%
3.8, 23%
3.2, 19%
2.8, 17%
Public expenditure on educaiton in terms of GDP
2009
2010
2011
2012
2013
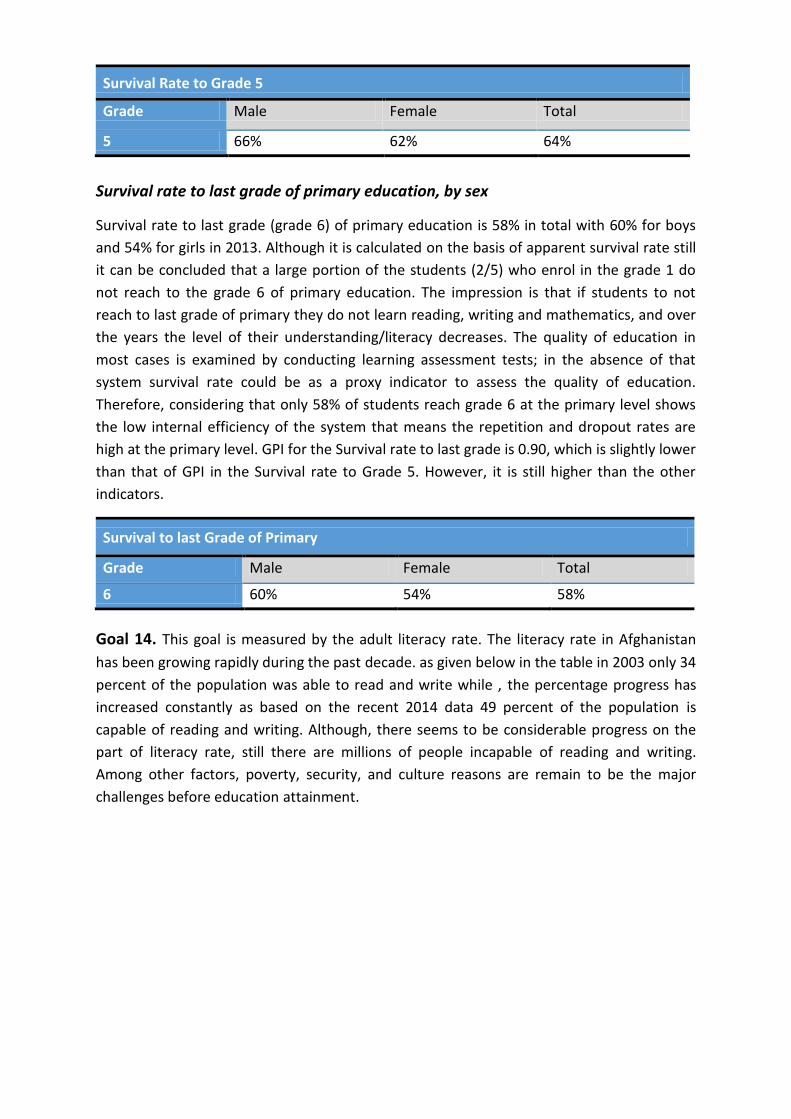
Survival Rate to Grade 5
Grade Male Female Total
5 66% 62% 64%
Survival rate to last grade of primary education, by sex
Survival rate to last grade (grade 6) of primary education is 58% in total with 60% for boys
and 54% for girls in 2013. Although it is calculated on the basis of apparent survival rate still
it can be concluded that a large portion of the students (2/5) who enrol in the grade 1 do
not reach to the grade 6 of primary education. The impression is that if students to not
reach to last grade of primary they do not learn reading, writing and mathematics, and over
the years the level of their understanding/literacy decreases. The quality of education in
most cases is examined by conducting learning assessment tests; in the absence of that
system survival rate could be as a proxy indicator to assess the quality of education.
Therefore, considering that only 58% of students reach grade 6 at the primary level shows
the low internal efficiency of the system that means the repetition and dropout rates are
high at the primary level. GPI for the Survival rate to last grade is 0.90, which is slightly lower
than that of GPI in the Survival rate to Grade 5. However, it is still higher than the other
indicators.
Survival to last Grade of Primary
Grade Male Female Total
6 60% 54% 58%
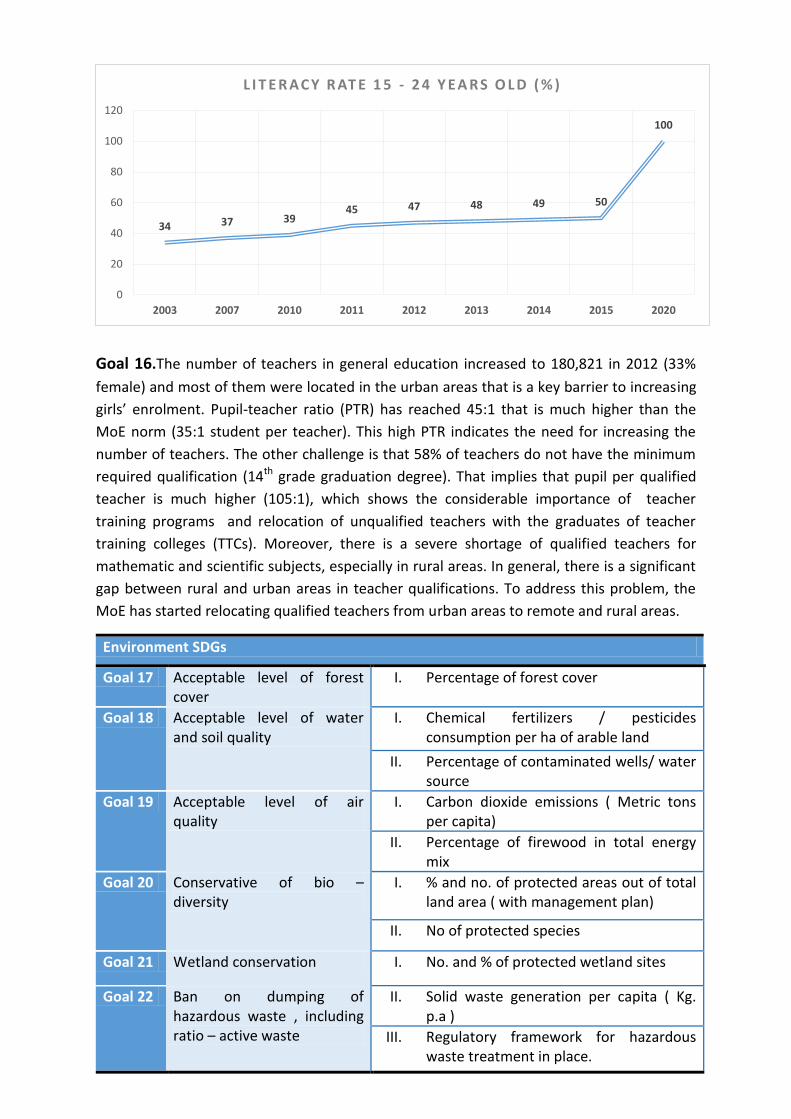
Goal 14. This goal is measured by the adult literacy rate. The literacy rate in Afghanistan
has been growing rapidly during the past decade. as given below in the table in 2003 only 34
percent of the population was able to read and write while , the percentage progress has
increased constantly as based on the recent 2014 data 49 percent of the population is
capable of reading and writing. Although, there seems to be considerable progress on the
part of literacy rate, still there are millions of people incapable of reading and writing.
Among other factors, poverty, security, and culture reasons are remain to be the major
challenges before education attainment.
Goal 16.The number of teachers in general education increased to 180,821 in 2012 (33%
female) and most of them were located in the urban areas that is a key barrier to increasing
girls’ enrolment. Pupil-teacher ratio (PTR) has reached 45:1 that is much higher than the
MoE norm (35:1 student per teacher). This high PTR indicates the need for increasing the
number of teachers. The other challenge is that 58% of teachers do not have the minimum
required qualification (14th grade graduation degree). That implies that pupil per qualified
teacher is much higher (105:1), which shows the considerable importance of teacher
training programs and relocation of unqualified teachers with the graduates of teacher
training colleges (TTCs). Moreover, there is a severe shortage of qualified teachers for
mathematic and scientific subjects, especially in rural areas. In general, there is a significant
gap between rural and urban areas in teacher qualifications. To address this problem, the
MoE has started relocating qualified teachers from urban areas to remote and rural areas.
Environment SDGs
Goal 17 Acceptable level of forest cover
I. Percentage of forest cover
Goal 18 Acceptable level of water and soil quality
I. Chemical fertilizers / pesticides consumption per ha of arable land
II. Percentage of contaminated wells/ water source
Goal 19 Acceptable level of air quality
I. Carbon dioxide emissions ( Metric tons per capita)
II. Percentage of firewood in total energy mix
Goal 20 Conservative of bio – diversity
I. % and no. of protected areas out of total land area ( with management plan)
II. No of protected species
Goal 21 Wetland conservation I. No. and % of protected wetland sites
Goal 22 Ban on dumping of hazardous waste , including ratio – active waste
II. Solid waste generation per capita ( Kg. p.a )
III. Regulatory framework for hazardous waste treatment in place.
34 37 39 45 47 48 49 50
100
0
20
40
60
80
100
120
2003 2007 2010 2011 2012 2013 2014 2015 2020
L I T E R AC Y R AT E 1 5 - 2 4 Y E A R S O L D ( % )
Goal 17. Acceptable level of forest cover: According to National risk and vulnerability
household survey by the central statistical organization, Agriculture – including livestock-
related activities – is the backbone of Afghanistan’s economy. For around half (49 percent)
of households agriculture provides any source of income and for 30 percent it is even the
most important source. Similarly, with 40 percent of the labour force engaged in agriculture,
it is the main sector for employment. CSO estimates that the sector contributes 27 percent
to the country’s GDP in the solar year 1390 (2011-12) (CSO 2012).
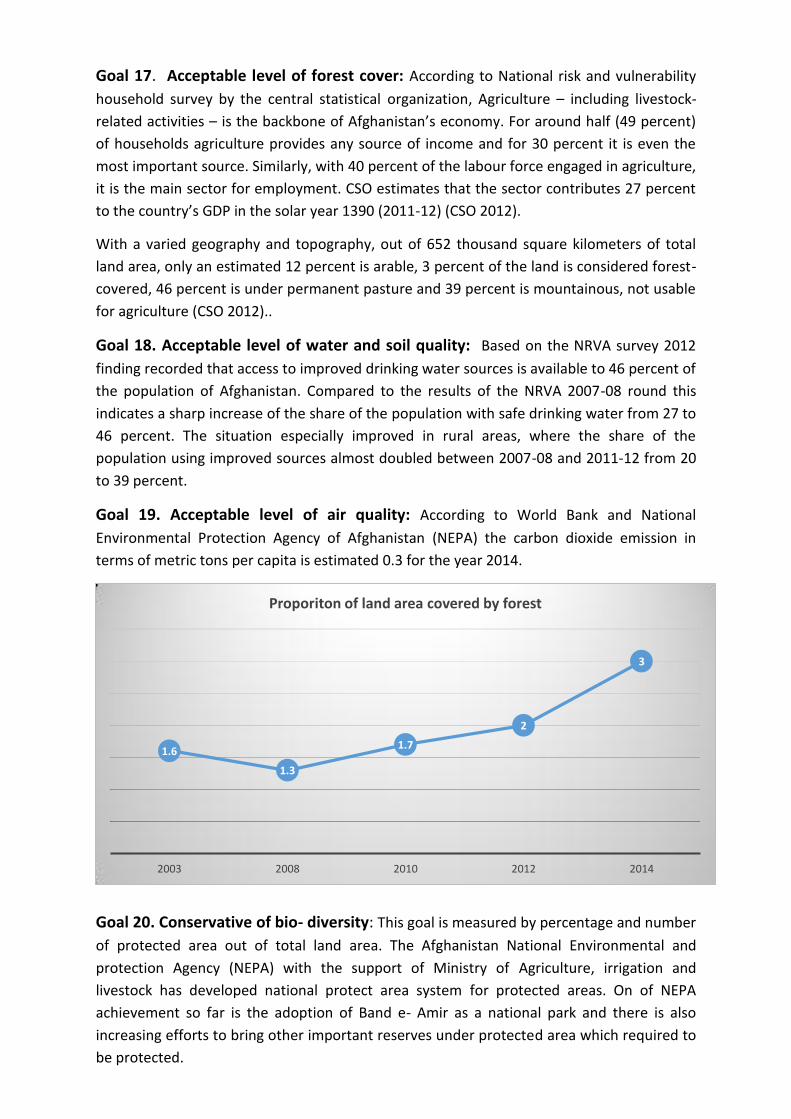
With a varied geography and topography, out of 652 thousand square kilometers of total
land area, only an estimated 12 percent is arable, 3 percent of the land is considered forest-
covered, 46 percent is under permanent pasture and 39 percent is mountainous, not usable
for agriculture (CSO 2012)..
Goal 18. Acceptable level of water and soil quality: Based on the NRVA survey 2012
finding recorded that access to improved drinking water sources is available to 46 percent of
the population of Afghanistan. Compared to the results of the NRVA 2007-08 round this
indicates a sharp increase of the share of the population with safe drinking water from 27 to
46 percent. The situation especially improved in rural areas, where the share of the
population using improved sources almost doubled between 2007-08 and 2011-12 from 20
to 39 percent.
Goal 19. Acceptable level of air quality: According to World Bank and National
Environmental Protection Agency of Afghanistan (NEPA) the carbon dioxide emission in
terms of metric tons per capita is estimated 0.3 for the year 2014.
Goal 20. Conservative of bio- diversity: This goal is measured by percentage and number
of protected area out of total land area. The Afghanistan National Environmental and
protection Agency (NEPA) with the support of Ministry of Agriculture, irrigation and
livestock has developed national protect area system for protected areas. On of NEPA
achievement so far is the adoption of Band e- Amir as a national park and there is also
increasing efforts to bring other important reserves under protected area which required to
be protected.
1.6
1.3
1.7
2
3
2003 2008 2010 2012 2014
Proporiton of land area covered by forest
Goal 21. Wetland conservation: The national environmental protection agency identified
138 species so far and titled as “red list” species to be protect based on the presidential
decree. Further, the percentage of protected wetland reported by NEPA is 0.5 percent.
Goal 22. No data available for this goal.
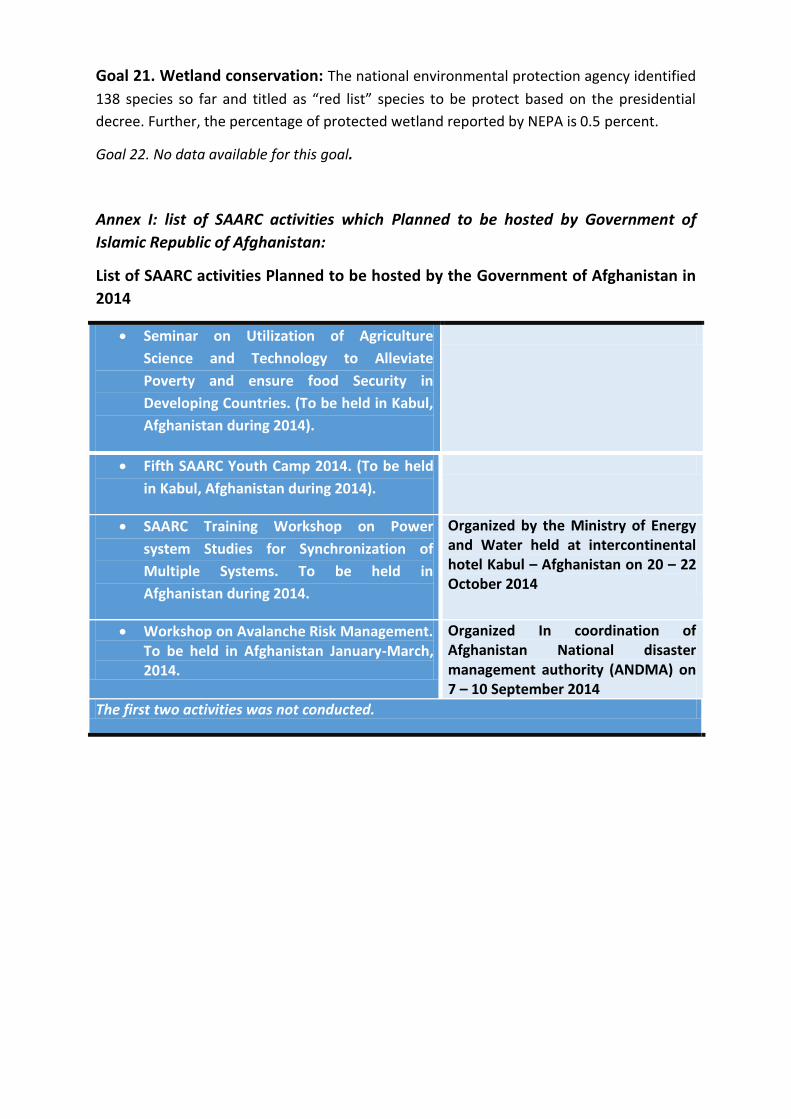
Annex I: list of SAARC activities which Planned to be hosted by Government of
Islamic Republic of Afghanistan:
List of SAARC activities Planned to be hosted by the Government of Afghanistan in
2014
Seminar on Utilization of Agriculture
Science and Technology to Alleviate
Poverty and ensure food Security in
Developing Countries. (To be held in Kabul,
Afghanistan during 2014).
Fifth SAARC Youth Camp 2014. (To be held
in Kabul, Afghanistan during 2014).
SAARC Training Workshop on Power
system Studies for Synchronization of
Multiple Systems. To be held in
Afghanistan during 2014.
Organized by the Ministry of Energy and Water held at intercontinental hotel Kabul – Afghanistan on 20 – 22 October 2014
Workshop on Avalanche Risk Management. To be held in Afghanistan January-March, 2014.
Organized In coordination of Afghanistan National disaster management authority (ANDMA) on 7 – 10 September 2014
The first two activities was not conducted.
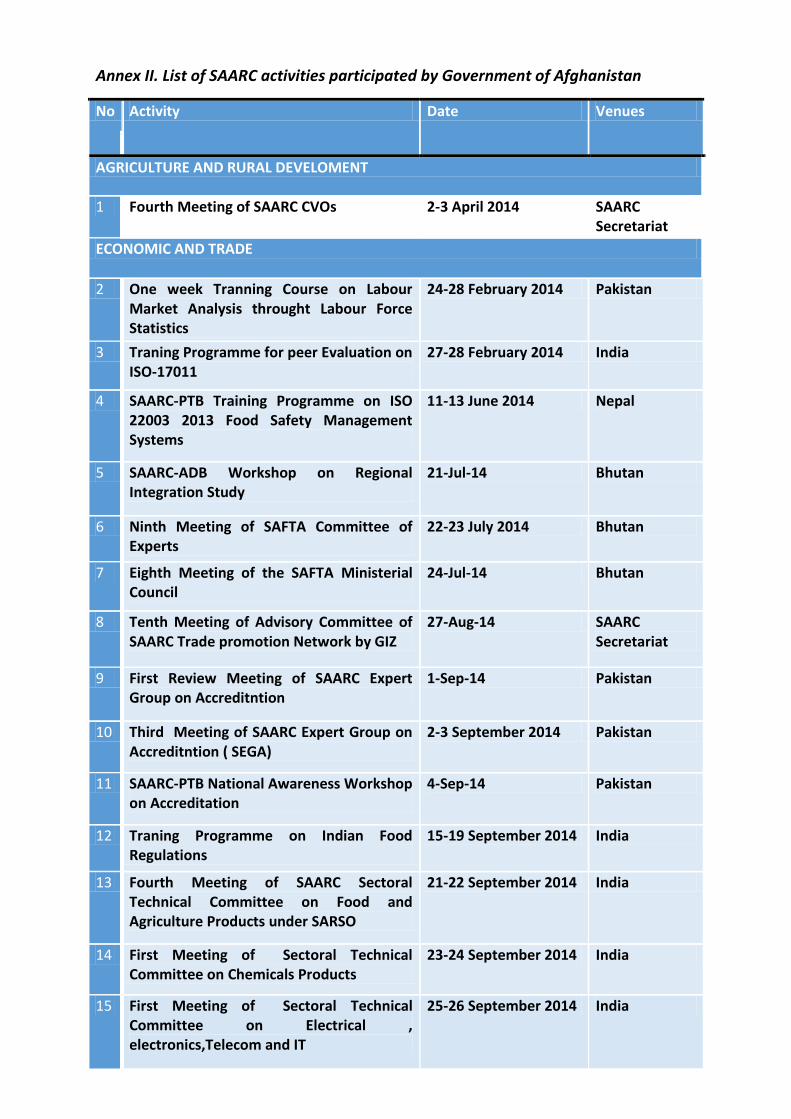
Annex II. List of SAARC activities participated by Government of Afghanistan
No Activity Date Venues
AGRICULTURE AND RURAL DEVELOMENT
1 Fourth Meeting of SAARC CVOs 2-3 April 2014 SAARC Secretariat
ECONOMIC AND TRADE
2 One week Tranning Course on Labour Market Analysis throught Labour Force Statistics
24-28 February 2014 Pakistan
3 Traning Programme for peer Evaluation on ISO-17011
27-28 February 2014 India
4 SAARC-PTB Training Programme on ISO 22003 2013 Food Safety Management Systems
11-13 June 2014 Nepal
5 SAARC-ADB Workshop on Regional Integration Study
21-Jul-14 Bhutan
6 Ninth Meeting of SAFTA Committee of Experts
22-23 July 2014 Bhutan
7 Eighth Meeting of the SAFTA Ministerial Council
24-Jul-14 Bhutan
8 Tenth Meeting of Advisory Committee of SAARC Trade promotion Network by GIZ
27-Aug-14 SAARC Secretariat
9 First Review Meeting of SAARC Expert Group on Accreditntion
1-Sep-14 Pakistan
10 Third Meeting of SAARC Expert Group on Accreditntion ( SEGA)
2-3 September 2014 Pakistan
11 SAARC-PTB National Awareness Workshop on Accreditation
4-Sep-14 Pakistan
12 Traning Programme on Indian Food Regulations
15-19 September 2014 India
13 Fourth Meeting of SAARC Sectoral Technical Committee on Food and Agriculture Products under SARSO
21-22 September 2014 India
14 First Meeting of Sectoral Technical Committee on Chemicals Products
23-24 September 2014 India
15 First Meeting of Sectoral Technical Committee on Electrical , electronics,Telecom and IT
25-26 September 2014 India
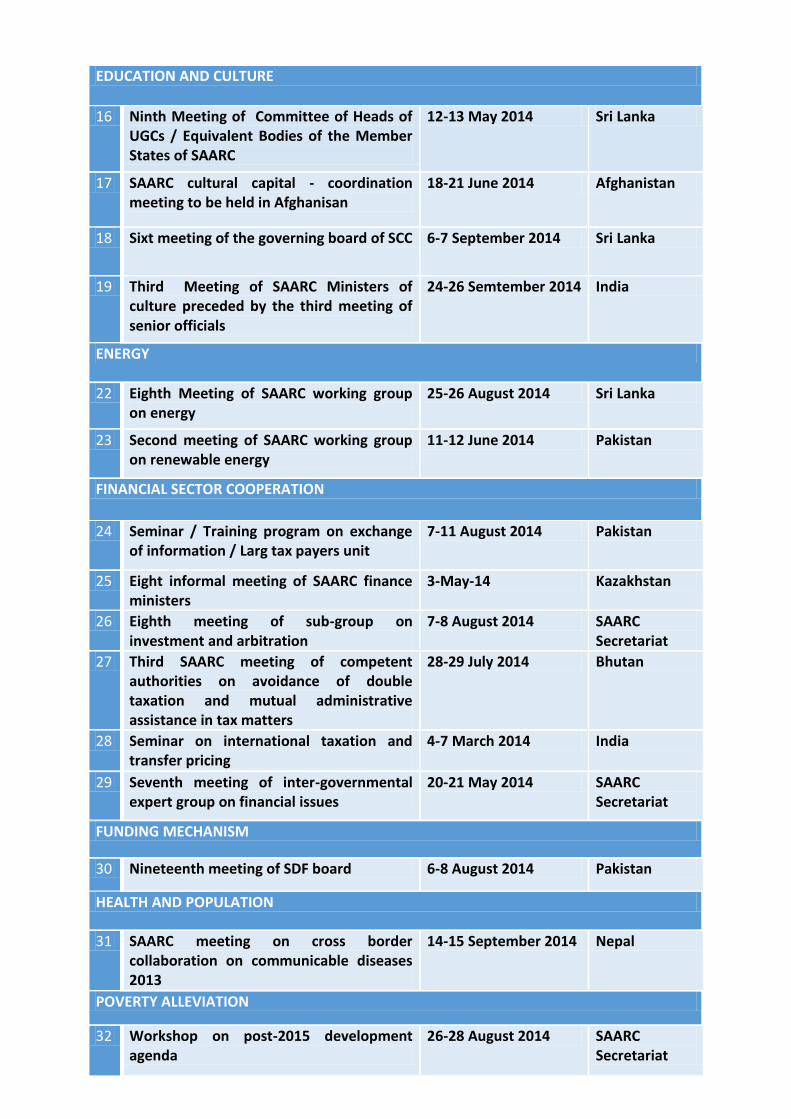
EDUCATION AND CULTURE
16 Ninth Meeting of Committee of Heads of UGCs / Equivalent Bodies of the Member States of SAARC
12-13 May 2014 Sri Lanka
17 SAARC cultural capital - coordination meeting to be held in Afghanisan
18-21 June 2014 Afghanistan
18 Sixt meeting of the governing board of SCC 6-7 September 2014 Sri Lanka
19 Third Meeting of SAARC Ministers of culture preceded by the third meeting of senior officials
24-26 Semtember 2014 India
ENERGY
22 Eighth Meeting of SAARC working group on energy
25-26 August 2014 Sri Lanka
23 Second meeting of SAARC working group on renewable energy
11-12 June 2014 Pakistan
FINANCIAL SECTOR COOPERATION
24 Seminar / Training program on exchange of information / Larg tax payers unit
7-11 August 2014 Pakistan
25 Eight informal meeting of SAARC finance ministers
3-May-14 Kazakhstan
26 Eighth meeting of sub-group on investment and arbitration
7-8 August 2014 SAARC Secretariat
27 Third SAARC meeting of competent authorities on avoidance of double taxation and mutual administrative assistance in tax matters
28-29 July 2014 Bhutan
28 Seminar on international taxation and transfer pricing
4-7 March 2014 India
29 Seventh meeting of inter-governmental expert group on financial issues
20-21 May 2014 SAARC Secretariat
FUNDING MECHANISM
30 Nineteenth meeting of SDF board 6-8 August 2014 Pakistan
HEALTH AND POPULATION
31 SAARC meeting on cross border collaboration on communicable diseases 2013
14-15 September 2014 Nepal
POVERTY ALLEVIATION
32 Workshop on post-2015 development agenda
26-28 August 2014 SAARC Secretariat

SECURITY ASPECTS
33 The 18th SAARC summit the motto was deeper integration for peace and prosperity
26-17 November 2014 Nepal
34 Sixth meeting of SAARC ministers of interior / Home preceded by the sixth meeting of SAARC secretaries of interior / Home & sixth meeting of SAARC immigration authorities
17-19 September 2014 Nepal
SOCIAL DEVELOPMENT
35 Seventh meeting of the SAARC gender info base ( SGIB )
25-26 March 2014 Pakistan
36 Regional policy dialogue on the finincial sustainability and effectiveness of social protection schemes for children
21-23 May 2014 Sri Lanka
37 Regional consultative meeting to finalize SAARC youth charter and youth action plan
12-14 May 2014 Maldives
38 Expert group meeting to discuss and draft changes to the convention on preventing and combating trafficking in women and children for prostitution
16-17 October 2014 SAARC Secretariat
TRANSPORT
39 Third meeting of the expert group to negotiate draft regional agreement on motor vehicles
7-8 September 2014 India
40 Fifth meeting of IGG on transport 30-Sep-14 India
OTHERS
41 Third meeting of chiafs of public / civil service commisssions
9-12 Junuary 2014 Sri Lanka
42 47th session of the programming committee to review and analyze exsting engagement and experience with observer ststaes to establish dialogue partnership
31 August - 1 September 2014
SAARC Secretariat
43 46th session of the programming committee meeting to review the selective closure and merger of SAARC regional centres
29-30 August 2014 SAARC Secretariat
44 Sixth meeting of immigration authorities 17-Sep-14 Nepal