introduction - global summit on herbals · mahamrutyunjaya rasa, is a formulation containing a...
TRANSCRIPT


Introduction Ayurvedic medicine originated in India more than 2000 years ago.
It makes use of herbs, metals and minerals for curative effects.
In former days Vaidyas (Ayurvedic practitioner) dispensed medicationto the patients in the fresh form.
Quality control of traditional medicines is important in assuring thetherapeutic efficacy, safety and to rationalize their use in the healthcare.
No information is documented about the likely impact of changes inthe manufacture techniques.

Ayurveda uses shodhana technique to render them fit for humanconsumption.
It is believed that the shodhana process converts the metal into itsspecially desired chemical compound which eliminates the toxicity of themetal and has the necessary medicinal benefits.
Since these preparations are sustaining themselves since centuries inclinical use, therefore one cannot exclude its use.
The purification procedures are well documented but none of the methodshave been studied in detail to determine the structural and chemicalchanges taking place in the ingredients.
It is essential requirement to discuss the non-toxicity and therapeutic valueof such formulations.

Mahamrutyunjaya Rasa, is a formulation containing a mixture of herbs andminerals used as a cardio-active formulation prescribed in the A.S.S. RasaRasayana Prakarana.
Ingredients Quantity
Visa Aconitum ferox 1Part
Brihati Solanum indicum 1Part
Pippali Kana Piper longum 1Part
Marica Piper nigrum 1Part
Gandhaka Sulphur 1Part
Tankana Sodium metaborate 1Part
Hingula Cinnabar 2Part
Jambira Lemon juice Q.S
The adult dose of the formulation is 125 mg twice a day.

Aconite Root
Aconitum ferox also known as Aconitum virorum is a species ofmonkshood, in the family Ranunculaceae.
Chemical Constituents: Norditerpenoid alkaloids based on ahexacyclic C19 skeleton, and those based on the C20 skeletons. Theprincipal active ingredients are alkaloids, including aconitine,mesaconitine and hypaconitine.
Pharmacological activities: The cardiac action of the alkaloids isdue to their effect on the voltage-sensitive sodium channels of the cellmembranes of the myocardium.
The alkaloids are toxic with a very narrow safety range, because theyeasily induce ventricular tachycardia and fibrillation even attherapeutic dose levels.

Solanum Roots
A number of ayurvedic formulations contain Solanum indicum Like:Dasamularista , Mahamrutyunjaya rasa, Brhatyadi kvatha, Brhati mulasiddha ghrta
Chemical constituents: Alkaloids solanine and solanidine. Disogenin,lanosterol, sitosterol, solasonnine, solamargine and solasidine.
Pharmacological Activities: Anti-Hypertensive, Immunostimulant and Cytotoxic.
Piper Species
The two species of piper used in the present formulation were Piper nigrum and Piper longum.Piperine is the active principle of both the drugs.

Cinnabar
Mercury is used in many ayurvedic formulations as red sulphide(HgS) of mercury as drug oflongetivity. Cinnabar is insoluble, has very low bioavailability and its long-term use is majorcause of mercury intoxication.
Sulphur
Sulphur is used in ayurvedic formulations widely. It increases bile, acts as a laxative andalterative. Improperly purified sulphur medicine if consumed over a long period causes toxiceffects like dyspepsia, flatulence.
Sodium metaborate
In ayurveda, it is given internally in acidity of the stomach, amenorrhoea and to promoteuterine pains during labour. Consumption over a long duration of time may causegastrointestinal distress including nausea and diarrhea.

The present study was planned in the following manner:
Preparation of laboratory formulation.
Standardization of the procedure for formulation preparation.
Biological Standardization of the formulations
Toxicity studies
In vitro cell viability studies
Studies on the cardio-protective activity using Isoproterenol inducedmyocardial infarction in rats.
Study Objectives

Selection of Formulations
Mahamrutyunjaya rasa was prepared in the laboratory as per the standard textand named as FORM1. Two marketed formulations were selected for the study,FORM2 and FORM3.
Preparation of the Ayurvedic formulation as per the standard text
The ingredients had to be purified as per the traditional procedure. 1 part each ofprocessed Aconitum ferox, Solanum indicum, Piper nigrum and Piper longumpowdered and sieved through 85 mesh sieve. It was then mixed with 1 partpurified sulphur, 1 part purified sodium metaborate and 2 parts of purifiedcinnabar.
S. Govind, S. Brahma Shankar, S. Ambika dutt shastra, Bhaishjaya Ratnavali, Chowkhambh Sanskrita sthan, Varanasi, 549.

Standardization of formulation procedure
It is believed that the shodhana process converts the poisonous rawmaterial into its specially desired chemical compound which eliminatesthe toxicity of the substance and has the necessary medicinal benefits.
Aconitum ferox, Sulphur, Cinnabar and Sodium metaborate have to beprocessed before internal administration as per the ayurvedic literature.
The structural and chemical changes taking place in the ingredients arenot reported, which is essential requirement to ascertain their non-toxicity and therapeutic value.
An attempt was made to derive certain standard data which mayform the basis of quality control of the raw materials present in theformulation.
The standard methods as per traditional text were followed and thephysicochemical changes were investigated by collecting samplesat different steps of purification. The samples were analyzed usingvarious techniques, viz. FTIR, XRD, DSC and HPTLC.

Aconite alkaloids
The aconite roots were processed and samples for in process quality check werecollected. The alkaloidal fractions were subjected to HPTLC and IR studies. Thepurification procedure was as follows:
•Crude Drug (A-1)
•Washed with water (A– 2)
•Soaked in cow urine for 24 hrs. (A – 3)
•Soaked in cow urine for 48 hrs. (A- 4)
•Washed with water and boiled with milk. (A -5)
•Washed with water and dried. (A-6)

HPTLC Studies
• Stationary phase: Pre-coated Silica gel HPTLC plates. F-254nm.
• Mobile Phase: Toluene: Ethyl Acetate: Diethyl amine (7:2:1 v/v)
• Detection: The plate was scanned 254 nm and 366 nm.
(a) (b)1-Crude Drug (A-1), 2-Washed with water (A– 2) , 3-Soaked in cow urine for 24 hrs. (A – 3),4-Soaked in cow urine for 48 hrs. (A- 4), 5- Washed with water and boiled with milk. (A -5) ,6-Washed with water and dried. (A-6)

Sample Concentration µg per spot
Peak Rf value
Height Area % Height
% Area
A-1 100 AG-1 0.42 210.3 6295.1 44.77 41.28
100 AG-2 0.48 149.7 5618.0 31.86 38.58
A-2 100 AG-1 0.42 160.6 6092.4 41.12 40.21
100 AG-2 0.48 144.3 5294.0 29.26 32.79
A-3 100 AG-1 0.42 148.9 5748.1 30.00 35.40
100 AG-2 0.48 135.3 5070.5 26.25 33.28
A-4 100 AG-1 0.42 129.9 5309.5 24.88 28.74
100 AG-2 0.48 126.8 5142.2 24.01 32.98
A-5 100 AG-1 0.42 71.5 2048.1 20.30 25.22
100 AG-2 0.48 79.7 2296.7 21.04 29.14
A-6 100 AG-1 0.42 114.6 4974.6 16.39 22.06
100 AG-2 0.48 100.3 5325.6 14.89 24.72
The tracks from 1-6 show that there was a gradual chemical degradation withdecrease in the concentration of two alkaloids, and increase in concentration ofother alkaloids.

IR Spectra of samples of Aconitum extracts
Cm-1
%Transmittance
FTIR Studies

A1 A2 A3 A4 A5 A6Peaks, cm-1
3435 3436 3417 3420 3422 3372,29582929 2930 2930 2928 2929 29242819 2821 ------- ------- 2851 28521720 1717 1713,1659 1710,1655 1708,1670 16761601 1601 1601 1601 1602 15971514 1515 1515 1515 1514 15141462 1463, 1419 1463,1455 1461 1459 14551368 1369 1372 1370 1376 13781294 1295 ------- -------- -------- ------1271 1271 1271 1271 1271 12711224 1224 1223 1224 1223 12231177 1177 1177 1177 1177 11761096 1097 1101 1101 1101 11011024 1024 1037 1037 1036 1036
985 985, 803 984, 878984,935,
878985,927,
874,915
765 765 765 764 765 765------- 689 --------- --------- 611 612
1720 C=O stretching of esters
1676 C=O stretching of Ketones.
1294 C-O or O-H stretch

Name R1 R2 R3Benzoylaconine C2H5 OH H
Aconitine C2H5 OH AcetylBenzoylmesaconine CH3 OH H
Mesaconitine CH3 OH AcetylBenzoylhypaconine CH3 H H
Hypaconitine CH3 H Acetyl
Chemical structures of benzoylaconine, aconitine, benzoylmesaconine, mesaconitine,benzoylhypaconine and hypaconitine.
It is observed from the IR spectra that during the purification there was loss of an estergroup (peak at 1720 cm-1), which may have been replaced with a Keto-group (1676 cm-1).

The HPTLC and IR studies, show that there were significant differences in alkaloidcontents between the processed and unprocessed aconite roots.
The purification procedure may thus be responsible for the chemical degradation of the di-ester alkaloids.
It has been reported in earlier studies that the diester alkaloids of Aconitum alkaloids areprone to hydrolysis.
Toxicological studies have demonstrated that the toxicity of diester alkaloids(aconitine, hypaconitine and mesaconitine) is almost the same with LD50 values formice per injection about 0.15 mg/kg body weight, while the hydrolyzed monoesteralkaloids (benzoylaconine, benzoylhypaconine and benzoylmesaconine) showmuch lower toxicity.
The processing of the aconitum alkaloids thus involve the hydrolysis of acetyl group which isdepicted in the IR spectra.
However, due to the presence of a number of alkaloids in the alkaloid fraction, the exactchemical changes cannot be predicted.
The IR spectras may be used as reference for comparison of the raw materials as a qualitycontrol parameter. The changes in the processed roots can be checked using the standard IRspectras.

Sulphur
Sulphur was purified as follows:
Crude Sulphur (S– 1)
Sulphur was treated with cow ghee (S – 2)
Mixture was heated in Iron vessel and melted ( S – 3)
Mixture was washed with cow milk ( S – 4)
The mixture was washed with water and powdered. (S – 5)
The samples were analyzed using XRD and DSC.
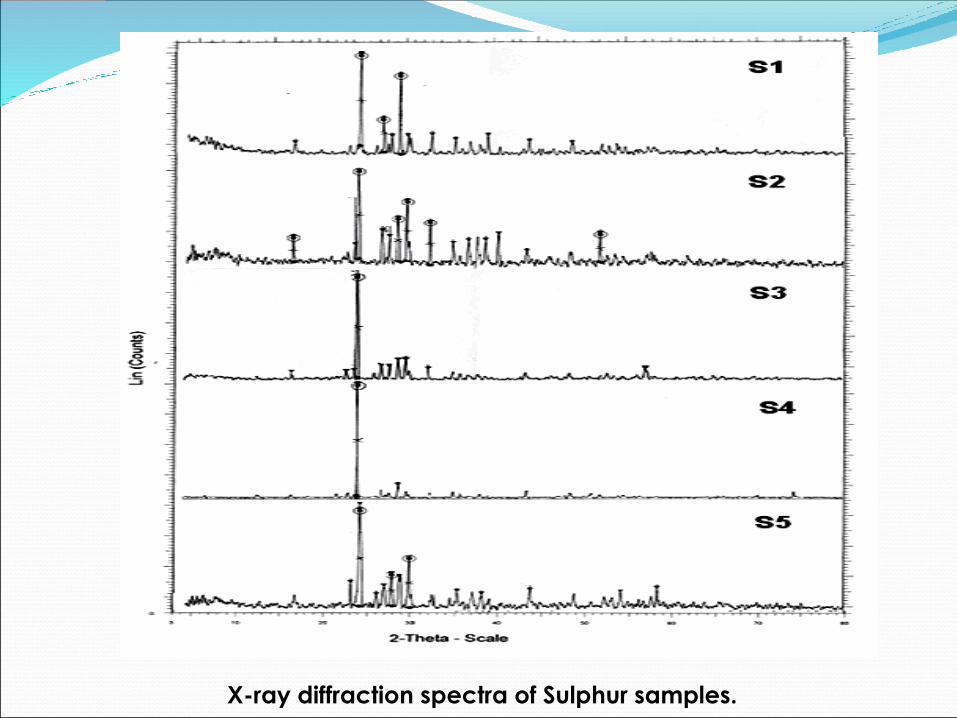
X-ray diffraction spectra of Sulphur samples.

d- spacing values of Sulphur
d-Spacing values
Orthorhombic Sulphur
d(Å)
S-1 d(Å)
3.85 (a=23.083) 3.825 (a=23.235)
3.219 (a= 27.690) 3.198 (a=27.871)
3.447 (a=25.826) 3.422 (a= 26.016)
Orthorhombic Sulphur
d(Å)
S-2 d(Å)
3.85 (a=23.083) 3.844 (a=23.114)
3.113 (a=28.653) 3.102 (a=28.757)
3.219 (a=27.690) 3.215 (a=27.721)
3.447 (a=25.826) 3.443 (a=25.851)
3.336 (a=26.315) 3.331 (a=26.743)
2.848 (a=31.385) 2.838 (a= 31.499)
Orthorhombic Sulphur
d(Å)
S-3 d(Å)
3.85 (a=23.083) 3.834 (a=23.178)
3.084 (a=28.653) 3.099 (a=28.77)
3.336 (a=26.701) 3.321 (a=26.823)
Monoclinic Sulphur d(Å) S-4 d(Å)
3.803 (a=23.372) 3.781 (a=23.505)
3.168 (a=28.145) 3.166 (a=28.156)
Orthorhombic Sulphur
d(Å)
S-5 d(Å)
3.85 (a=23.083) 3.853 (a=23.174)
3.084 (a= 28.928) 3.084 (a=28.927)
3.336 (a= 26.701) 3.312 (a=26.891)
3.219 (a=27.690) 3.205 (a=27.81)
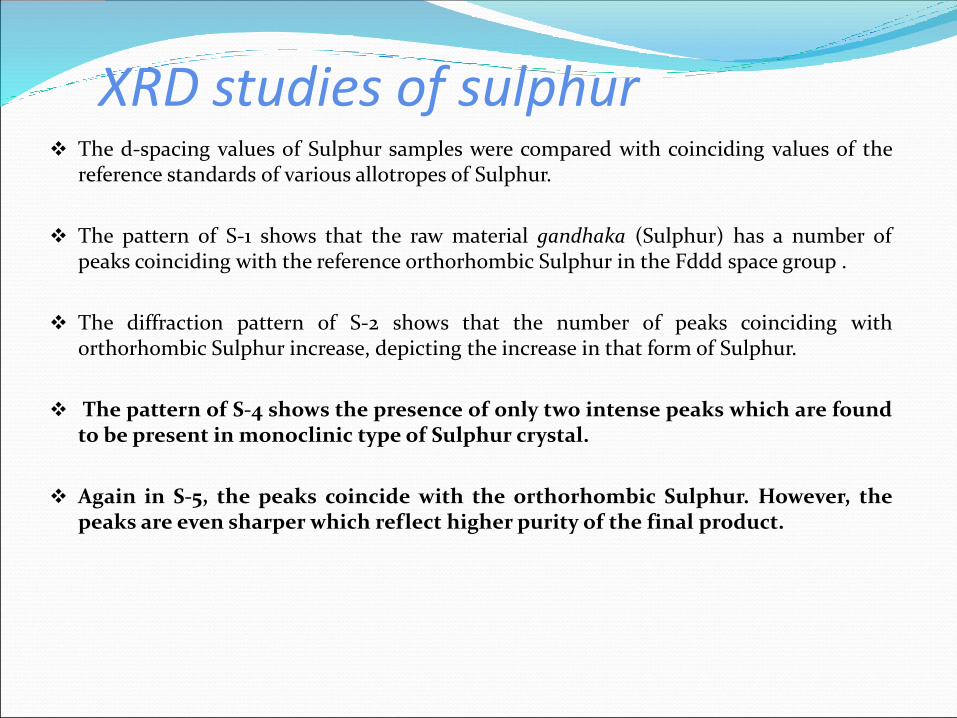
XRD studies of sulphur The d-spacing values of Sulphur samples were compared with coinciding values of the
reference standards of various allotropes of Sulphur.
The pattern of S-1 shows that the raw material gandhaka (Sulphur) has a number ofpeaks coinciding with the reference orthorhombic Sulphur in the Fddd space group .
The diffraction pattern of S-2 shows that the number of peaks coinciding withorthorhombic Sulphur increase, depicting the increase in that form of Sulphur.
The pattern of S-4 shows the presence of only two intense peaks which are foundto be present in monoclinic type of Sulphur crystal.
Again in S-5, the peaks coincide with the orthorhombic Sulphur. However, thepeaks are even sharper which reflect higher purity of the final product.
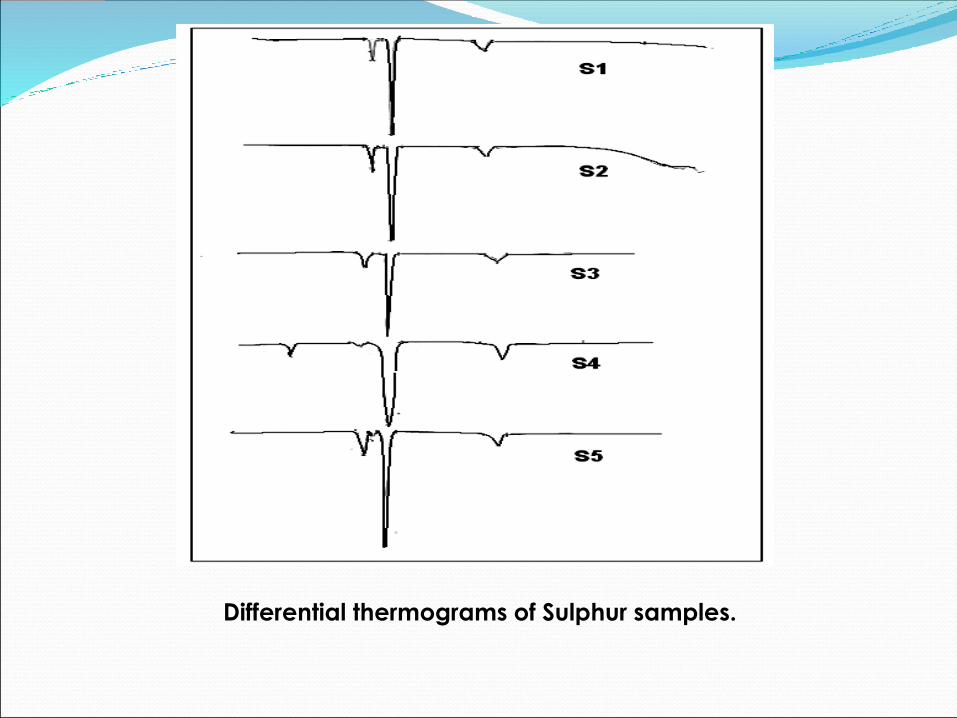
Differential thermograms of Sulphur samples.

DSC data:
Sr. No. S-1 S-2 S-3 S-4 S-5
1 ------------ ------------ ------------ 75.97°C ------------
2 108.60°C 110.93°C 110.04°C 108.49°C 111.55°C
3 ------------ ------------ ------------ ------------ 115.61°C
4 119.97°C 121.10°C 121.29°C 121.01°C 121.31°C
5 186.83°C 174.17°C 174.73°C 173.96°C 174.74°C

Thermal Studies of Sulphur The peaks displayed for S-1, S-2 and S-5 are similar with changes in the number and
sharpness of the peaks.
A small endothermic peak is observed at 115.61°C in the S-5 sample which may bedue to a different type of allotrope of Sulphur formed during the heatingprocedure.

The sulphur used as the crude raw material is a mixture of α-orthorhombic Sulphurand small amounts of β-sulphur.
Significant change is observed in DSC of S-4 wherein additional endothermic peak isobserved at 760C which may be due to the removal of the hydrates. The XRD of thesample tends to display the presence of monoclinic sulphur.
The XRD and DSC patterns of S-5, display that the structure of S-4 reverts back to theS8 orthorhombic sulphur.
The unwanted components are also reduced which may be observed by the sharpnessof the peaks in the X-ray diffraction pattern of S-5.
Thus, from the above study it can be concluded that the processing of sulphurbrings about purification, reducing the toxic nature of sulphur.
By impregnating with organic material, like ghee, sulphur is madehomologous to the tissue cells and their toxicity is reduced and acceptability tothe cell is increased.
Inference

Cinnabar:
The purification of cinnabar was performed as follows:
Crude cinnabar (H- 1)
Cinnabar was treated with lemon juice-three times (H -2)
Cinnabar was treated with lemon juice-seven times (H -3).
The samples were analyzed using XRD.

XRD studies on Cinnabar
The d-spacing values of H-3 matched with the reference data showing high purity ofcinnabar in the trigonal trapezohedral cystalline form.
HgS d(Å) H-1 d(Å) H-2 d(A) H-3 d(A)
3.36 (a= 26.507) 3.337 (a= 26.363) 3.370 (a=26.422) 3.358 (a= 26.517)
3.181 (a= 28.218) 3.181 (a= 28.024) 3.171 (a=28.109) 3.162 (a= 28.199)
2.85 (a= 31.362) 2.877 (a= 31.060) 2.874 (a=31.089) 2.862 (a= 31.224)
2.06 (a= 43.917) 2.078 (a= 43.50) 2.030 (a= 44.593) 2.071 (a= 43.665)
1.67 (a= 54.937) 1.682 (a= 54.508) 1.682 (a= 54.490) 1.677 (a= 54.677)

X-ray diffraction spectra of Cinnabar samples.

When compared with reference values of trigonal trapezohedral cystalline form ofcinnabar, it is clear that the final product is of very pure nature.
Further, on treatment with lemon juice the organic material make cinnabar morehomologous to the body for its assimilation and the therapeutic effect.
Inference

Sodium metaborate
The purification of sodium metaborate was performed as follows:
o Crude sodium metaborate ( B – 1)
o Heat sodium metaborate for 10 minutes (B – 2)
o Heat sodium metaborate for 20 minutes (B-3)
o Remove moisture completely (B – 4).
The samples were analyzed using XRD and DSC.

XRD Studies of Sodium metaborate
X-ray diffraction spectra of Sodium metaborate samples.

Thermal studies on Sodium metaborate
Differential thermograms of Sodium metaborate samples.
Sr. No. B-1 B-2 B-2
1 74.71ºC --------- ---------
2 114.65 ºC 110.62 ºC 104.22 ºC
3 138.67 ºC 138.39 ºC 137.54 ºC

The Differential thermograms of B-1 show an extra peak at 74.71 ºC which may be dueto the presence of solvates of water, while the peak is missing in the differentialthermogram of B-2.
The purity of the raw material can be ascertained from the DSC study as the sharpnessof the endothermic peak at 137ºC increased markedly even when low concentration ofsample was analyzed.
However, the slight shift from 110.62 ºC of B-2 to 104.22 ºC in the final product showscertain changes taking place in the crystal structure which further needs to be studied.

Preparation and Characterization of Mahamrutyunjaya Rasa
Shodhana (Purification)
Cinnabar Sodium MetaborateAconite Roots Sulphur
FTIR & HPTLC Studies
DSC & XRD Studies
DSC & XRD Studies
DSC Studies
Treatment with Cow Urine
Treatment with Lemon Juice
Treatment with Cow ghee
Heating
Conversion of Di-ester (poisonous)
to Monoester Alkaloids
Conversion of Impure to Pure
and homologous to body tissues.
Conversion of Impure to Pure
and Homologous to body tissues.
Conversion to Hydrate free
Borax.
All the above parameters can be set as Quality Standards For Raw Materials

Biological evaluation of Formulations
1. Cell Viability studies2. Toxicity studies3. Isoproterenol induced MI in rats

Sample Preparation
The tablets were powdered and suspended in water using 1% tween 80 for the in vivo studies.
AnimalsFemale Balb/c mice weighing between 20-25 g and male albino rats of Wistar strain weighing250 to 280 g were used for the studies.
Determination of toxicity of formulations in mice
Toxicity study with single oral doses of formulations was carried out as per the OECDguidelines using mice.
Effect of single oral dose administration of formulations in mice
Mortality was observed in mice administered with single oral dose (2000 mg/kg) of F1, F2 andF3, while with 550 mg/kg dose no mortality was seen.
OECD. 1998. Test Guideline 408. Single Dose 90-day Oral Toxicity Study in Rodents. In: OECDGuidelines for the Testing of Chemicals. Organization for Economic Cooperation &Development, Paris.

Microscopic images of mice heart, kidney and liver illustrating effect of single oral doseadministration of formulation F1, F2 and F3 (Staining: Hemotoxylin and Eosin). Microscopicimages of mice heart from (A) F1, (B) F2, (C) F3 groups; images of mice kidney from (D)F1, (E) F2, (F) F3, images of mice liver from (G) F1, (H) F2, (I) F3 groups.

Cell culture and treatmentThe H9c2 cell line derived from embryonic rat heart tissue was purchased fromAmerica Tissue Type Collection (Manassas, VA; catalog # CRL – 1446). Cells werecultured in Dulbecco's Modified Eagle's Medium (DMEM) and supplemented with10% fetal calf serum (FCS), 100 U/ml of penicillin and 100 μg/ml of streptomycin in 75cm2 tissue culture flasks at 37°C in a humidified atmosphere of 5% CO2.
Sample Preparation
Alkaloid fractions of the formulations (FORM1, FORM2 AND FORM3) were preparedand fractions were dried under high vacuum for several hours to remove any traces ofsolvents used during their processing.
The fractions dissolved in dimethyl sulfoxide (DMSO) were used for in vitro studies.
The final concentration of DMSO was not more than 0.2 % during the experiments.

Determination of cell viability
The viability of H9c2 cells after treatment with alkaloidal fractions of formulations F1, F2 andF3 was assayed by the reduction of MTT to formazan.
The cells (5×10³) were cultured in 96- well microtiter plates, and left overnight in an incubatorat 37oC with 5% CO2 before being exposed to different concentrations of formulations.
Cells were treated with different concentrations (2, 5, 10, 20, 50, 100 and 200 μg/ml) ofFORM1, FORM2 and FORM3 for 12, 24 and 48 h and their viability was determined using 10μl of 5 mM MTT with additional incubation for 4 h.
Thereafter, the medium was removed, the formazan crystals were dissolved in 100 μl ofDMSO and the absorbance was measured at 570 nm using microplate reader (MolecularDevices, Spectra MAX 250). The data of the survival curves were expressed as the percentageof untreated controls .
•Plumb J, Milroy R, Kaye S. Effects of the pH dependence of 3-(4,5-dimethylthiazol-2-yl)-2,5-diphenyl-tetrazolium bromide-formazan absorption on chemosensitivity determined by a novel tetrazolium-based assay.Cancer Res. 1989; 49: 4435-4440.

0
25
50
75
100
125
150
0.9 1.9 2.9 3.9 4.9 5.9 6.9 7.9 8.9
Conc. (µg/ml)
% C
ell V
iab
ilty
12 h 24 h 48 h
Control 2 5 10 20 50 100 200
A
0
20
40
60
80
100
120
0.9 1.9 2.9 3.9 4.9 5.9 6.9 7.9 8.9Conc. (µg/ml)
% C
ell V
iab
ilit
y
12 h 24 h 48 h
Control 2 5 10 20 50 100 200
B
0
20
40
60
80
100
120
0.9 1.9 2.9 3.9 4.9 5.9 6.9 7.9 8.9
Conc. (µg/m)
% C
ell V
iab
ilty
12 h 24 h 48 h
Control 2 5 10 20 50 100 200
C
Effect of formulations FORM1 (A), FORM2 (B) and FORM3 (C) on viability of H9c2 cells after 12,24 and 48 h of treatment. Values are expressed as mean ± SD and are average of threedeterminations. c

Effect of Formulations on viability of H9c2 cells
Cells incubated with FORM1 (2 to 200 µg/ml) for 12 h showed increased cell viability.
Significant decrease in cell viability was observed after 24 and 48 h of treatment with maximumdecrease of 47.49% at 24 h and 56.34% at 48 h with 200 µg/ml concentration.
Formulation FORM2 showed 14.85% decrease in cell viability at 200 µg/ml concentrationafter 12 h of treatment, while treatment for 24 and 48 h decreased cell viability by 65.08% and72.66% with 200 µg/ml concentrations respectively.
Treatment with formulation FORM3 decreased cell viability by 34.71, 36.08, 40.42, 31.97,25.35, 70.55, and 85.55% after 12 h of treatment, similarly 24 h treatment decreased cell viabilityby 7.68, 6.49, 7.94, 13.63, 22.09, 53.84, and 94.98% at 2, 5, 10, 20, 50, 100 and 200 µg/mlconcentrations respectively.
Cell viability was decreased by 7.23, 9.23, 13.01, 24.48, 58.51, and 96.15% with 5, 10, 20, 50, 100and 200 µg/ml concentrations respectively, after 48 h of treatment.

Determination of protective effect of formulations against ISO-induced myocardialinfarction (MI) in rats
Rats were administered with 25 and 50 mg/kg doses of formulations for 15 days and at the endof treatment MI was induced by injecting 25 mg/kg s.c. dose of ISO twice at the interval of 24h.
Serum levels of cardiac marker enzymes like lactate dehydrogenase (LDH), creatine kinaseisoenzymes (CK-MB), glutamate-oxaloacetate transaminase (GOT), and alkaline phosphatase(ALK-P) along with uric acid were determined in order to evaluate the cardiac injury.
Heart was dissected out, washed in ice-cold saline and weighed accurately to determine heartweight/ body weight ratio (HW/BW).
Histopathological studies on heart were carried out in order to assess any changes in cellulararchitecture. The body weights of the animals were recorded throughout the experimentalperiod.
Hearse DJ, De Leiris J, Loisance J, editors. Enzymes in cardiology. A wiley- Interscience publication, London,
John Wiley and sons Ltd, 1979.
Manjula TS, Geetha A, Shyamala Devi CS. Effect of aspirin on isoproterenol induced myocardial infarction-
a pilot study. Ind J Biochem Biophys 1992;29:378-9.
Iriama. Uric acid in ischaemic tissues. Jikeikai Med J 1987;34:145-68.

Experimental design
Animal were divided into different groups, containing six animals each.
Group-I: Served as a control, administered orally with 1% solution of tween 80 in water for 15 daysfollowed by normal saline (2 ml/kg, s.c. twice at an interval of 24 h);
Group-II: administered orally with 1% tween 80 for 15 days followed by ISO (25 mg/kg, s.c. twiceat an interval of 24 h);
Group-III, -VI, -IX: Served as formulation control, administered orally with 50 mg/kg dose of F1,F2 and F3 respectively for 15 days followed by normal saline (2 ml/kg, s.c. twice at an interval of 24h);
Group-IV, -VII, -X: administered orally with 25 mg/kg dose of FORM1, FORM2 and FORM3respectively for 15 days followed by ISO (25 mg/kg, s.c. twice at an interval of 24 h);
Group-V, -VIII, -XI administered orally with 50 mg/kg dose of FORM1, FORM2 and FORM3respectively for 15 days followed by ISO (25 mg/kg, s.c. twice at an interval of 24 h).
Statistical Analysis of Data
Data are presented as Mean ± S.E.M. The significance of differences was estimated by one-wayanalysis of variance followed by application of the Dunnett’s Multiple Comparisons and Tukey-Kramer Multiple Comparisons test. A P value of less than 0.05 was considered to be significant.

(a)
(b)
Effect of Formulations on serum levels of CK-MB and LDH. #Compared with ISO treated group,*Compared with saline treated (control) group

Effect of Formulations on serum levels of GOT and ALKP . #Compared with ISO treated group, *Compared with saline treated (control) group

Effect of Formulations on serum levels of Uric acid. #Compared with ISO treated group,*Compared with saline treated (control) group
Effect of formulations F-1, F-2 and F-3 on Heart weight/body weight ratio (HW/BW). *Compared with control group.

Microscopic images of rat heart illustrating the effect of formulation F-1, F-2 and F-3 in ISO induced MI rats(Staining: Haematoxylin and Eosin). Microscopic images of rat heart from Group-I (A), Group-II (B), Group-III(C), Group-IV (D), Group-V (E), Group-VI (F), Group-VII (G), Group-VIII (H), Group- IX (I), Group-X (J),Group-XI (K).

Myocardial necrosis induced by ISO is probably due to a primary act on the sarcolemmalmembrane, followed by stimulation of adenylate cyclase, activation of Ca2+ and Na+
channels, exaggerated Ca2+ inflow, excess of excitation-contraction coupling mechanism,energy consumption and cellular death.
Increased serum levels of CK-MB, LDH, ALK-P, GOT and uric acid are the diagnosticindicators of ISO induced MI.
An increase in the activity of these enzymes in serum is due to their leakage from myocytesas a result of necrosis induced by ISO.
Increase in serum uric acid could be due to excessive degradation of purine nucleotides andproteolysis.
Cardioprotective effects of formulations were assessed by analyzing the levels of serummarker enzymes like GOT, ALK-P, CK-MB, LDH, and uric acid.
Formulations FORM1 and FORM2 treatment prevented the maximum increase of CK-MB,LDH, GOT and ALK-P in the serum during the peak infarction in the tissues.

The cardioprotective action of MHR may be attributed to a number of components presentin the formulation.
Aconitum roots containing the diterpenoid alkaloids like aconitine can be one of theingredients recognized for the cardiac action.
Aconitine has been reported to have a positive inotropic effect by elevating the intracellularCa2+ concentration through different sub-cellular mechanisms which lead to an increase inCa2+ transients in myocardial cells.
A significant increase in the serum marker enzymes levels in rats treated with Form3 aloneshows its cardiotoxic nature.
The reason for cardiotoxicity of FORM3 may be aggravation of intracellular Ca2+ occurringdue to the presence of high aconitine content.

Conclusion

SR. NO
STANDARDIZATION PARAMETER FORM1 FORM2 FORM3
1 Acute Toxicity Studies (550 mg/kg b.w.,
Histopathology)
No Toxicity No Toxicity Minor changes
2 Cell viabilty Studies (200 µg/ml in 24
hrs.)
Decreased
47.49 %
Decreased
65.08 %
Decreased
94.98%3 Effect on Isoproterenol induced myocardial infarction rats. (25mg/kg and 50 mg/kg b.w)4 Levels of serum markers in comparison
to negative control
Significant
decrease
Significant
decrease
Significant
Increase5 Heart Weight/Body weight Significant
decrease
Significant
decrease
Significant
Increase6 Histopathology Normal
Architecture
Normal
Architecture
Damaged
Myocardium

Therefore, from the above study one can conclude that for the preparation ofMahamrutyunjaya rasa, standardized traditional methods and raw materialsshould be used.
The characterization techniques like FTIR, XRD, DSC, HPTLC which have beenused in the present studies can be used as a physico-chemical fingerprint forcharacterization of the raw materials in industry not only to check uniformity butalso to ensure that each step is been followed as per the standard text.
A routine use of such scientific techniques will lead to standardization of theproduct to a certain extent and would definitely help in building confidence in useof such products for medication.

My due acknowledgements are to:
1) Indian Council of Medical Research2) Sir Ratan Tata Trust3) University Grants Commission4) National Centre f0r Cell Sciences, Pune5) Anchrom Laboratory, Mumbai6) Zydus Cadila, Ahmedabad

Our Team Dr. Sadhana J. Rajput
Professor, Pharmacy Department,
The M.S. University of Baroda,
Gujarat India
Dr. Manish S. Lavhale
Associate Director,
Pharmazz India Private Limited,
Greater Noida, UP, India
