introduction - cook county government, illinois ... executive budget recommendation 30 the new...
TRANSCRIPT

VOLUME 1 FY2017 REVENUE
27
INTRODUCTION
The total operating revenue for Cook County in FY 2017 is estimated at $4,404 million compared to FY 2016 operating revenue of $4,217 million. The increase of $186 million is a change of 4.4%; however this figure includes an $83 million increase associated with the full fiscal year implementation of the 1% increase in the Sales Tax rate, effective on January 1, 2016; that growth is entirely dedicated in FY 2017 to a supplemental appropriation to the County Employees’ and Officers’ Annuity and Benefit Fund to address the Fund’s accrued liabilities. When netting out this factor, along with $33 million in increased grant funding for designated grant programs that cannot be used for general operations, the growth is $70 million, or 1.7%, comparable to the rate of inflation projected by the Federal Reserve Survey of Professional Forecasters for 2016 and below the 2.3% the Survey projects for 2017 inflation. The $70 million growth is entirely driven by a $16 million increase associated with the full fiscal year implementation of the Hotel Accommodations Tax (1% tax effective on May 1, 2016), and a $74.6 million impact from a proposed Sweetened Beverage Tax for 2017; absent this new tax initiative year-over-year revenues available to fund general operations would actually decline in 2017. Total operating revenues include revenues for the: General Fund, Health Enterprise Fund, Special Purpose Funds, and Grants.
The County has a General Fund, Health Enterprise Fund and 35 restricted Special Purpose Funds. The County uses a fund accounting system to present the financial position and the results of operation for each fund. It is also designed to provide budgetary control over the revenues and expenditures of each fund. Separate funds are maintained for the purpose of segregating various types of governmental activities. Each fund is an independent fiscal and accounting entity made up of a self-balancing set of accounts containing all transactions affecting the particular fund. Generally, transfers between funds may occur under the County’s home rule authority or other means, except when prohibited by law.
The County FY 2017 General Fund and Health Enterprise Fund revenue is estimated to be $3,465 million, approximately $84 million, or 2.5% above the projected FY 2016 year-end revenue of $3,381 million; absent the $83 million increase in sales tax revenues referenced above that are entirely dedicated to the proposed supplemental pension appropriation, revenues in the General and Health Funds are essentially flat year over year. Projected revenues are estimated for budgetary purposes through trend analysis of historical data. For major tax-based revenues, economic forecasting models are applied to account for the impact of the national and local economy.
GENERAL FUNDThe total budgeted revenue for FY 2016 was estimated at $1,734 million for the General Fund. The FY 2017 revenue is estimated at $1,873 million for the General Fund, representing an 8%, or $139 million increase, reflecting the approved sales tax increase for the full fiscal year which will be largely dedicated to an appropriation for supplemental pension funding. The General Fund encompasses the Corporate and Public Safety Funds.
The Corporate Fund is the general operating fund of the County; this fund includes the majority of the property tax related functions of County government on behalf of underlying jurisdictions, as well as general administrative functions of the County. It funds such departments as the County Assessor, County Treasurer, County Clerk, Recorder of Deeds, Board of Review and the various offices under the
REVENUE EXECUTIVE BUDGET RECOMMENDATION
28
President, along with the supplemental pension appropriation referenced above. The Corporate Fund accounts for approximately 16% of projected FY 2017 revenue ($544 million) and derives most of its revenue from departmental fees and sales tax.
The Public Safety Fund is comprised of the County’s criminal justice system: jails, courts, and related programs. Departments in this fund include: Sheriff, State’s Attorney, Public Defender, Office of the Chief Judge and the Juvenile Temporary Detention Center. The Public Safety Fund comprises approximately 38% of projected FY 2017 revenue ($1.33 billion). The revenue supporting this fund is mostly derived from the property tax levy, departmental fees and non-property taxes such as the sales tax, gas tax, alcoholic beverage tax, and use tax.
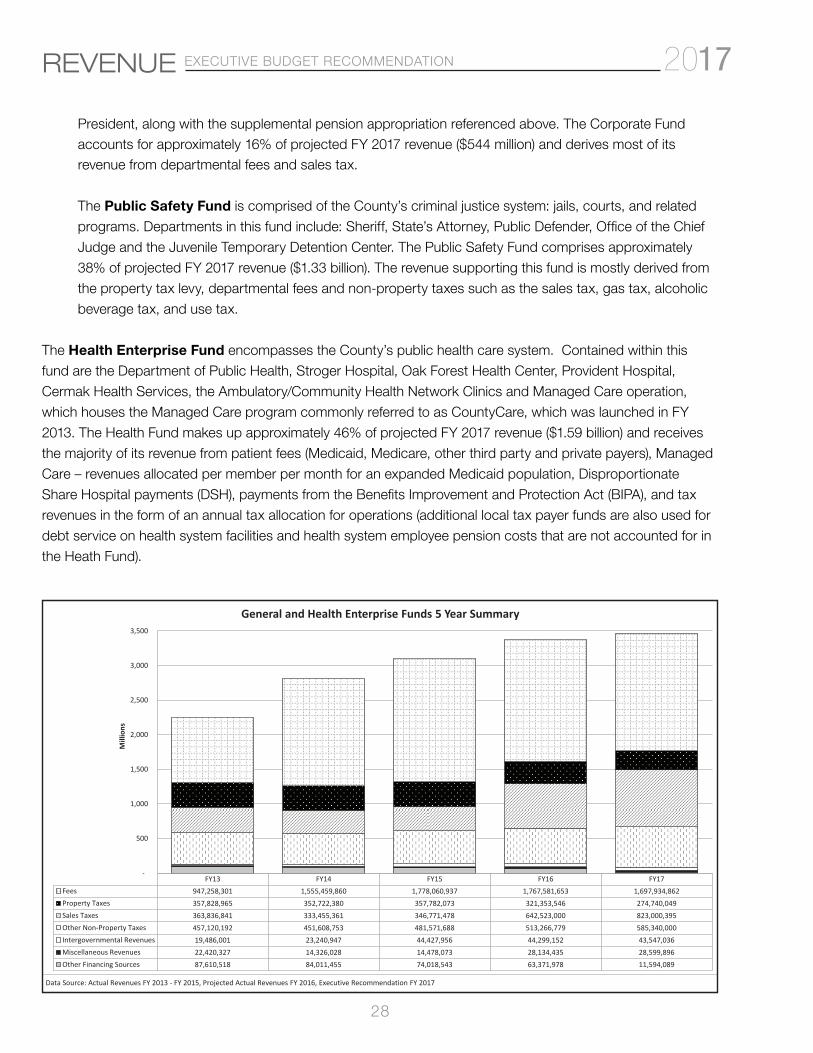
The Health Enterprise Fund encompasses the County’s public health care system. Contained within this fund are the Department of Public Health, Stroger Hospital, Oak Forest Health Center, Provident Hospital, Cermak Health Services, the Ambulatory/Community Health Network Clinics and Managed Care operation, which houses the Managed Care program commonly referred to as CountyCare, which was launched in FY 2013. The Health Fund makes up approximately 46% of projected FY 2017 revenue ($1.59 billion) and receives the majority of its revenue from patient fees (Medicaid, Medicare, other third party and private payers), Managed Care – revenues allocated per member per month for an expanded Medicaid population, Disproportionate Share Hospital payments (DSH), payments from the Benefits Improvement and Protection Act (BIPA), and tax revenues in the form of an annual tax allocation for operations (additional local tax payer funds are also used for debt service on health system facilities and health system employee pension costs that are not accounted for in the Heath Fund).
FY13 FY14 FY15 FY16 FY17Fees 947,258,301 1,555,459,860 1,778,060,937 1,767,581,653 1,697,934,862Property Taxes 357,828,965 352,722,380 357,782,073 321,353,546 274,740,049Sales Taxes 363,836,841 333,455,361 346,771,478 642,523,000 823,000,395Other Non-Property Taxes 457,120,192 451,608,753 481,571,688 513,266,779 585,340,000Intergovernmental Revenues 19,486,001 23,240,947 44,427,956 44,299,152 43,547,036Miscellaneous Revenues 22,420,327 14,326,028 14,478,073 28,134,435 28,599,896Other Financing Sources 87,610,518 84,011,455 74,018,543 63,371,978 11,594,089
-
500
1,000
1,500
2,000
2,500
3,000
3,500
Mill
ions
General and Health Enterprise Funds 5 Year Summary
Data Source: Actual Revenues FY 2013 - FY 2015, Projected Actual Revenues FY 2016, Executive Recommendation FY 2017

VOLUME 1 FY2017 REVENUE
29
REVENUE BY SOURCE
Under State law, using its Home Rule power, the County imposes and collects taxes and fees. In addition, the State of Illinois also imposes and collects taxes and fees with a portion of the revenue being remitted to the County. These different revenue sources which are imposed both by the County and by other governments are grouped into seven categories: 1) property taxes, 2) fees, 3) sales tax 4) other non-property taxes,5) intergovernmental revenues, 6) miscellaneous revenues, and 7) other financing sources.
PROPERTY TAXIn FY 2016, the County property tax levy projected revenue available for General and Health Enterprise Fund operations was $310.1 million. The estimate for property tax levy revenue in FY 2017 to finance General and Health Enterprise Fund operations is $265.7 million. This figure is $44.4 million less than FY 2016. The decrease in projected revenue available to the General Fund and Health Enterprise Fund is a result of the County’s legacy liabilities, an increase in Bond and Interest debt service obligations by $27 million as well as an increase to the Employee Annuity & Benefit Fund by $24 million. Offsetting the decrease in the Election Fund requirements to conduct Federal, State, and County elections will be an investment in Capital Projects for 2017, the County intends to use the alternating year decrease in 2017 and coming years to provide a funding source for shorter duration capital assets that the County traditionally funded from debt proceeds. This approach will assist in reducing debt of the County as well as creating greater stability in financial operations through the alternating year election cycle that leads to cost increases in even years. The projected decrease in revenue is despite the fact that the net property tax levy in aggregate is growing by a modest $5.3 million through the incorporation of an estimate of the value of taxes generated from new property construction, and the expiration of incentives and tax increment financing districts, which is a continuation of a practice that started in recent years. The County is a Home Rule unit of government and is not bound by these estimates, but uses this estimate process to project the approximate property tax revenues to be generated in Tax Year 2017 from the values of new property and expirations as published by the County Clerk in 2016 for the 2015 tax year based on the millage rates in affect during tax year 2015.
The County’s total property tax levy is made up of two basic components; 1) the base property tax levy and 2) estimated revenue from expiring incentives, expired tax increment financing districts, and new property construction. As TIF districts and incentives expire, the County captures additional property tax revenue without increasing property taxes on Cook County taxpayers on a real (net of inflation) or nominal basis, absent any offsetting reduction in property removed from the tax roll. Similarly, the addition of new property through construction and economic activity allows the County to generate additional revenue without increasing property taxes for existing taxpayers in the same manner. The County’s 2017 proposed base property tax levy continues to be $720.4 million. In addition, the levy includes an estimate of $31.5 million in property taxes that will be captured from new property, expiring TIF districts and expiring incentives from previous years (estimated for years after the base levy was frozen), and $5.3 million estimated for the coming 2017 levy, offset for a 3% factor for loss in collections for operating accounts (Corporate, Public Safety, Health, Elections and Capital Projects) for an estimated net total property tax amount of $748 million available for appropriations; the County Clerk is separately authorized to account for loss in collections as necessary and as consistent with State law to ensure adequate resources are collected to cover obligations in the Bond and Interest and Annuity and Benefit Funds.

REVENUE EXECUTIVE BUDGET RECOMMENDATION
30
The new property projection reflects the figures published by the Cook County Clerk for the 2015 tax year, which are the most recent available and were published in June of 2016. The base property tax levy established by the County Board of Commissioners is currently $720.4 million and has not been adjusted to account for inflation since 1996. This amount is levied by adjustments to the property tax rate in order to offset increases or decreases to the assessed valuations in Cook County. As a result of the flat base levy, the Cook County portion of property tax bills has actually declined on a real basis, net of inflation annually since 1996 and is projected to continue to do so in the 2017 tax year.
In addition to the Property Tax Levy, projected property tax revenues also reflect an estimate of declared TIF surplus of remittance of the County’s proportionate share of expiring TIF districts across the County. Budgeted TIF surplus revenues were $11.3 million in FY 2016, the FY 2017 estimate is approximately $9 million, reflecting the estimate of the County’s proportional share of the City of Chicago’s anticipated TIF surplus as well as an estimate for the annual average receipts from expiring suburban TIF districts such as the Hoffman Estates Sears Economic Development Area TIF.
$-
$50
$100
$150
$200
$250
$300
$350
$400
FY13 FY14 FY15 FY16 FY17
Mill
ions
Property Taxes Available to General and Health Enterprise Funds
Data Source: Actual Revenues FY 2013 - FY 2015, Projected Actual Revenues FY 2016, Executive Recommendation FY 2017

VOLUME 1 FY2017 REVENUE
31
COOK COUNTY SALES TAXThe Cook County Sales Tax was established September 1, 1992 and was imposed on general merchandise at a rate of 0.75%. As of January 1, 2016, the effective sales tax rate in Cook County increased to 1.75%. The tax is County-wide including both incorporated and unincorporated areas and has been adjusted over time by the County Board. The State collects the sales tax on behalf of Cook County, and remits the tax receipts to the County.
The FY 2017 Cook County gross sales tax estimate is $823 million and is distributed between the Public Safety Fund and Corporate Fund, with approximately $353.8 million dedicated to a supplemental appropriation for an additional payment to the Pension Fund. In FY 2016, the projected revenue from sales tax was $663.5 million; projected year-end sales tax revenues in FY 2016 are expected to be slightly lower at $642.5 million due to slower than expected economic growth during the fiscal year. The underlying sluggish trend of economic growth and increasing movement of consumption to online sales activity seen in Cook County and across the nation is projected to continue in FY 2017 with a forecasted 1.45% change in underlying sales volumes underpinning the 2017 revenue estimate.
$-
$100
$200
$300
$400
$500
$600
$700
$800
$900
FY13 FY14 FY15 FY16 FY17
Mill
ions
Sales Tax Receipts
Data Source: Actual Revenues FY 2013 - FY 2015, Projected Actual Revenues FY 2016, Executive Recommendation FY 2017

REVENUE EXECUTIVE BUDGET RECOMMENDATION
32
OTHER NON-PROPERTY TAXES
The County is projecting to receive $513.3 million in other non-property taxes in FY 2016; this is higher than the FY 2016 budgeted revenue of $494.2 million. The estimated revenue for other non-property taxes in FY 2017 is $585.3 million, which is an increase of $91.1 million compared to the FY 2016 budget. This projected increase is the result of the full fiscal year implementation and collection of receipts for the Hotel Accommodations Tax in FY 2016. In addition, the increase is the result of a new Sweetened Beverage Tax of one cent per fluid ounce in FY 2017.
Other non-property taxes are for the most part taxes imposed by the County under the Home Rule authority granted by the 1970 Illinois Constitution. Under State law, the County’s taxing authority is generally limited by a prohibition against an income based tax and a tax upon occupations. With the exception of the County’s general sales tax and its non-retailer motor vehicle tax, all of the County’s non-property taxes are administered and collected by the Cook County Department of Revenue. All non-property taxes are deposited into the Corporate Fund, Public Safety Fund, and Health Fund. From the State of Illinois, the County also receives a portion of income taxes paid by those who live in unincorporated Cook County.
COOK COUNTY USE TAXBeginning December 1, 1995, the County imposed and collected the Cook County Use Tax. This tax applies to tangible personal property (e.g. cars, motorcycles & boats) titled or registered with a State agency, within the corporate limits of Cook County. The rate is 1%. The FY 2016 Cook County use tax projection is $81.3 million, $4.3 million higher than the FY 2016 budget. The Use Tax receipts are deposited in the Public Safety Fund, for transportation purposes authorized by law. The Cook County Use Tax is estimated to bring in $81 million in revenue for FY 2017, consistent with the FY 2016 revenue projection due to expectations of a flat year in new vehicle sales resulting from a higher inventory of used vehicles coming off lease agreements.
ALCOHOLIC BEVERAGE TAXThe Alcoholic Beverage Tax is imposed on the retail sale in Cook County of all alcoholic beverages. The ordinance was enacted in 1975 and last amended in 2012. Wines containing 14% or less alcohol by volume are taxed at the rate of 24 cents per gallon, while those containing more than 14% are taxed at the rate of 45 cents per gallon. Alcohol and spirits are taxed at a rate of $2.50 per gallon and beer is taxed at a rate of 9 cents per gallon. Once collected, all receipts are distributed to the Public Safety Fund. The Alcoholic Beverage Tax is projected to garner $37.6 million in FY 2016 and is estimated to bring in $37.3 million in revenue for FY 2017 as well. Continued enforcement efforts will keep the revenue level despite modest declines in projected consumption.
CIGARETTE TAXPrior to 1997, the Cigarette Tax was imposed at a rate of 10 cents per packet of 20 cigarettes. Beginning in FY 1997, the cigarette tax began a series of increases including the last increase in FY 2013, bringing the tax up from $2 to $3 per pack. The Cigarette Tax is estimated to bring in $125.2 million in revenue for FY 2017, compared to a projected $128.9 million in FY 2016. The decline in consumption due to price sensitivity to higher tax rates, the City of Chicago raising the age for the legal purchase of tobacco to 21, the impact of smoking cessation programs and the increased usage of alternative e-cigarettes is offset by increased compliance efforts

VOLUME 1 FY2017 REVENUE
33
conducted by the Department of Revenue. The Department of Revenue has begun utilizing tobacco-sniffing dogs as well as public outreach programs such as the whistleblower telephone hotline regarding retailers who would seek to avoid paying the levied tax. The Cigarette Tax is distributed to the Public Safety Fund and Health Enterprise Fund.
GAS TAXThe Gas Tax is imposed on the retail sale of gasoline and diesel within Cook County. Prior to FY 1997, the tax rate of 6 cents per gallon was not imposed on propane, jet fuel, diesel fuel, or kerosene. The receipts generated from this tax are deposited in the Public Safety Fund, for transportation purposes authorized by law. The Gas Tax is estimated to bring in $91.5 million in revenue for FY 2017, compared to projected FY 2016 revenue of $94.4 million. This slight decrease is the result of more fuel efficient cars and cars that run on alternative fuel and electricity along with several significant payments of back taxes for this tax type due to enforcement initiatives of the Department of Revenue. Though average vehicle miles driven has declined, the stabilization of lower gasoline prices and the Department of Revenue continuing a major focus on enforcement initiatives for this tax type to ensure a level playing field for all taxpayers in FY 2017 will keep revenue generation steady.
RETAIL SALE OF MOTOR VEHICLES TAXA tax is imposed on the retail sale of new motor vehicles in Cook County at a rate of $7.50 for 2-wheelmotor vehicles, $11.25 for 3-wheel motor vehicles, $15.00 for 4-wheel motor vehicles, and $22.50 for trucks, truck tractors, trailers, semi-trailers or pole trailers. All of the tax receipts are deposited in the Public Safety Fund for transportation purposes authorized by law. The Retail Sale of Motor Vehicles Tax is estimated to bring in $3.4 million in revenue for FY 2017, compared to projected FY 2016 revenue of $3.4 million. Expectations of a flat year in new vehicle sales due to a higher inventory of used vehicles coming off lease agreements will keep revenues stable.
NON-RETAILER MOTOR VEHICLE TRANSACTION TAXThe non-retailer transactions tax is a use tax for non-retailer transfers of motor vehicles in Cook County. The tax is applied to the transfer or purchase of a motor vehicle that is titled or registered from a non-retailer, at a location in Cook County, with an agency of the State of Illinois. The estimated FY 2017 revenue is $20 million, compared to projected FY 2016 revenue of $22 million. Though revenues that the State is now collecting on behalf of the County at registration are stable, the collection on outstanding past due taxes from prior years is projected to decrease slightly as the amount outstanding decreases. All of the tax receipts are deposited in the Public Safety Fund, for transportation purposes authorized by law.
GAMBLING MACHINE TAXIn FY 2013, Cook County instituted a tax on electronic gambling machines. The tax rate is $1,000 per year per electronic gambling device, such as a slot machine, and $200 per year per video gaming terminal, such as a video poker machine. The Gambling Machine Tax is estimated to generate $2.1 million for FY 2017, a $0.6 million increase from FY 2016 budgeted revenues as additional machines are brought on-line.
FIREARM AND FIREARM AMMUNITION TAXIn FY 2013, Cook County established a tax on firearms sold in Cook County. The tax of $25 per firearm is levied per new firearm sold and also collected by the seller. In FY 2016, Cook County established a tax on ammunition at a rate of $0.05 per cartridge of centerfire ammunition and $0.01 per cartridge of rimfire ammunition. The revenue generated by the Firearm and Firearm Ammunition Tax is deposited into the Public Safety Fund to help

REVENUE EXECUTIVE BUDGET RECOMMENDATION
34
alleviate the cost of gun violence. The tax on firearm and firearm ammunition is estimated to generate revenue of $1.2 million for FY 2017, comparable to the $1.1 million projected in FY 2016.
WHEEL TAXThe Wheel Tax is an annual license fee authorizing the use of any motor vehicle within the unincorporated area of Cook County. Depending on the motor vehicle’s class, weight, and number of axles, annual tax rates vary based on the vehicle and trailer type. All tax receipts are deposited in the Public Safety Fund, for transportation purposes authorized by law. The Wheel Tax is estimated to bring in $4.2 million in revenue for FY 2017, compared to budgeted FY 2016 revenue of $4.1 million. The minor increase in revenue for FY 2017 is due to additional noticing to increase compliance amongst the townships that comprise unincorporated Cook County.
AMUSEMENT TAXThe Amusement Tax is imposed upon the patrons of any amusement within the County of Cook, such as sporting events and theaters. The tax rate is 3.0% of the gross receipts from admission fees or other charges for larger venues with lower tax rates applicable to live performances at smaller venues. All tax receipts are deposited in the Public Safety Fund. The Amusement Tax is estimated to bring in $32.3 million in revenue for FY 2017, compared to a projected $34 million in FY 2016. Though the tax rate is being held steady in FY 2017, the decrease is attributed to one-time audit compliance collections in 2016 that are not recurring in the coming year.
PARKING LOT AND GARAGE OPERATIONS TAXThe Parking Lot and Garage Operations Tax is imposed upon the use and privilege of parking a motor vehicle in or upon any parking lot or garage in the County of Cook. Effective September 1, 2013, the Cook County Board of Commissioners approved a change to the structure of the Parking Tax imposed upon the use and privilege of parking a motor vehicle in or upon any parking lot or garage in the County. The new structure imposes a rate of 6% of the charge or fee paid for parking for a 24-hour period or less and 9% of the charge or fee paid for parking for a weekly or monthly period. All tax receipts are deposited in the Public Safety Fund, for transportation purposes authorized by law. The Parking Lot and Garage Operations Tax is estimated to bring in $47.3 million in revenue for FY 2017. This amount reflects a slight decrease from the projected revenue in FY 2016 of $48.1 million due to fewer audit compliance findings.
OTHER TOBACCO AND CONSUMABLE PRODUCTS TAXIn FY 2012 the Home Rule Tax Ordinance was amended to close a loophole in the taxing of other tobacco products. In FY 2016 the County is expected to collect approximately $8.6 million from taxing tobacco products other than cigarettes including liquid nicotine as well as taxing “roll your own” tobacco on a per ounce basis. The FY 2017 revenue estimate is $8 million; the decrease is based on the City of Chicago raising the age for the legal purchase of tobacco to 21. All of the tax receipts are deposited in the Public Safety Fund.
HOTEL ACCOMMODATIONS TAXIn FY 2016, Cook County established a Hotel Accommodations Tax at a rate of 1% of the gross rental or leasing charge effective May 1, 2016. In FY 2016 the County is projecting to generate $16.6 million compared to a FY 2017 revenue estimate of $31.5 million. The increase is the result of the full fiscal year implementation of the tax and initial monthly collections during 2016 suggest initial estimates for this tax appear to be accurate. The revenue generated will be deposited entirely in the Public Safety Fund.

VOLUME 1 FY2017 REVENUE
35
SWEETENED BEVERAGE TAXIn FY 2017, Cook County proposes a Sweetened Beverage Tax imposed on the retail sale of sweetened beverages in Cook County at the rate of a one cent per fluid ounce. The tax includes amongst other products carbonated soft drinks, sweetened fruit beverages (excluding 100% fruit juice), sports drinks, ready-to-drink (RTD) tea, energy drinks, and RTD coffee. The tax, which has long been advocated to address the rising cost and incidence of diabetes and obesity in our society, applies to both canned and bottled sweetened beverages and fountain drinks as well as diet drinks and flavored/enhanced waters with added sweetener. The Sweetened
Beverage tax is expected to provide $74.6 million in revenue in FY 2017 based on an effective date of July, 2017.
STATE INCOME TAX, RETAILER’S OCCUPATION TAX, ILLINOIS GAMING,AND OFF TRACK BETTING COMMISSIONThe remaining non-property taxes received by the County are generated through State taxes, a portion of which is remitted by the State to the County. In other words, some taxes and fees are imposed by other governmental units, i.e., the State, and a portion of those tax receipts are given to the County. All revenue received from the State income tax, retailer’s occupation tax, Illinois gaming (casino and off-track betting) are deposited into the Public Safety Fund. These revenues are estimated based on current statutory formulas, although it is notable that the State of Illinois has not yet adopted a full budget for the fiscal year beginning July 1, 2016 and until the State adopts a full year budget many of these revenue sources remain at risk for further disruption from the State.
- 20 40 60 80 100 120 140
Cigarette Tax
Gas Tax/Diesel Fuel Tax
County Use Tax
Sweetened Beverage Tax
Parking Lot/Garage Operations Tax
Alcoholic Beverage Tax
Amusement Tax
Hotel Accommodations Tax
Non-Retailer Transactions Tax
State Income Tax
Illinois Gaming - Casino
Other Tobacco and Consumable Products Tax
Wheel Tax
Retail Sale of Motor Vehicles Tax
Retailer's Occupation Tax
Gambling Machine Tax
Firearms Tax
Off Track Betting Commission
Millions
FY 2017 Other Non-Property Taxes
Data Source: Actual Revenues FY 2013 - FY 2015, Projected Actual Revenues FY 2016, Executive Recommendation FY 2017

REVENUE EXECUTIVE BUDGET RECOMMENDATION
36
GENERAL FUND FEES
The County imposes various General Fund fees for certain services that it performs. The fees charged by various County departments include fees for vital records, real estate transactions, court case filings, and delinquent taxes. The General Fund fees are distributed into the Corporate Fund and Public Safety Fund. The County is estimated to receive $227 million at the end of FY 2016 which is slightly lower than budgeted revenues of $229 million. This projected deficit is due in large part to a decrease in court case filings, resulting in the Clerk of the Circuit Court projecting to end FY 2016 $5.9 million under budgeted revenues. For FY 2017, total General Fund fees are estimated to generate $217.5 million, or a roughly $10 million decline from the prior year. Traditionally many of these fees are set by state statute or local ordinance and may not generally keep pace with the rate of inflation.
The following estimates were prepared either by or in certain instances in collaboration with the respective elected officials and department directors.
$-
$100
$200
$300
$400
$500
$600
$700
FY13 FY14 FY15 FY16 FY17
Mill
ions
Other Non-Property Taxes
Data Source: Actual Revenues FY 2013 - FY 2015, Projected Actual Revenues FY 2016, Executive Recommendation FY 2017

VOLUME 1 FY2017 REVENUE
37
COUNTY TREASURERThe Cook County Treasurer is projected to receive $54 million in FY 2016. The estimated revenue for FY 2017 remains $54 million. Revenue collections are lower than historical averages due to State legislation moving up the annual delinquent tax sale by 8 months over a several year period, with a change to April in 2017 and a further change in 2018. The Treasurer’s source of revenue primarily consists of penalties on delinquent taxes.
COUNTY CLERKThe County Clerk collects revenue for sold and forfeited real estate taxes as well as a fee for each property index number sold at tax sale. In addition, the Clerk collects miscellaneous vital records fees. The Clerk is projecting to receive $10.45 million in revenue for FY 2016 and estimates revenue to be slightly higher at $10.6 million for FY 2017. The projected increase reflects fees resulting from the schedule of two tax sales in FY 2017.
RECORDER OF DEEDSThe Recorder of Deeds collects revenue from the recording and collection of transfer stamps for real estate transactions and other miscellaneous recordings including judgments and liens. The revenue projection is $40.4 million in FY 2016. For FY 2017, we are estimating revenues lower at $36.5 million. The decrease is the result of a projected slowdown in commercial real estate activity which has been extremely strong in recent years and traditionally follows a cyclical pattern along with economic activity.
CLERK OF THE CIRCUIT COURTThe Clerk of the Circuit Court collects revenue from a variety of fees and fines related to court case filings to cover costs in administering judicial facilities and satellite offices. The projected revenue for FY 2016 is $72 million and $72 million is estimated by the Clerk of the Circuit Court’s office for FY 2017 as well. The FY 2017 revenue estimate projects a stabilization of overall court case filings as anticipated by the office.
SHERIFFThe Sheriff derives revenue from processing court orders, the Municipal Division, evictions, escrow, Department of Corrections, fines and citations. The projected revenue for FY 2016 is $21.4 million and for FY 2017 revenue is estimated to decrease to $18.2 million. The FY 2017 revenue estimation reflects a decrease in fines collected by the Sheriff Police.
PUBLIC GUARDIANThe Public Guardian’s Office charges legal and other fees for the representation of disabled adult wards and for the maintenance of their estates in the Probate Division and for minors in the Domestic Relations Division. The FY 2017 revenue estimate remains consistent at $3 million in comparison to budgeted revenue in FY 2016 of $3 million.
STATE’S ATTORNEYThe State’s Attorney’s budgeted revenue consists entirely of certain fees for felony and misdemeanor convictions in the Circuit Court, which are imposed by the judges, collected by the Clerk of the Court and deposited directly to the Public Safety Fund. The projected revenues for FY 2016 are $1.7 million and are estimated to remain roughly level at $1.6 million in FY 2017.

REVENUE EXECUTIVE BUDGET RECOMMENDATION
38
BUILDING AND ZONINGThe Department of Building and Zoning collects revenue through the inspection of structures and the permitting for the construction of structures within unincorporated Cook County. In addition, the Department collects fees for violations, business occupancy certificates, contractor registrations, and zoning amendments. Building and Zoning is projected to receive $3.5 million in FY 2016 and estimates revenue to be steady at $3.5 million for FY 2017 as real estate construction activities continue at a similar pace.
- 10 20 30 40 50 60 70 80
Clerk of Circuit CourtCounty Treasurer
Recorder of DeedsCounty Sheriff
County ClerkSheriff Court Services Fee
Environmental ControlBuilding and Zoning
Public GuardianHighway Department Permits
State's AttorneyMedical Examiner
Cable TV FranchisePublic Administrator
Liquor LicensesOther
Recorder Audit RevenuesCounty Assessor
Millions
FY 2017 General Fund Fees
Data Source: Actual Revenues FY 2013 - FY 2015, Projected Actual Revenues FY 2016, Executive Recommendation FY 2017
$-
$50
$100
$150
$200
$250
$300
FY13 FY14 FY15 FY16 FY17
Mill
ions
Total General Funds Fees
Data Source: Actual Revenues FY 2013 - FY 2015, Projected Actual Revenues FY 2016, Executive Recommendation FY 2017
VOLUME 1 FY2017 REVENUE
39
HEALTH ENTERPRISE FUND
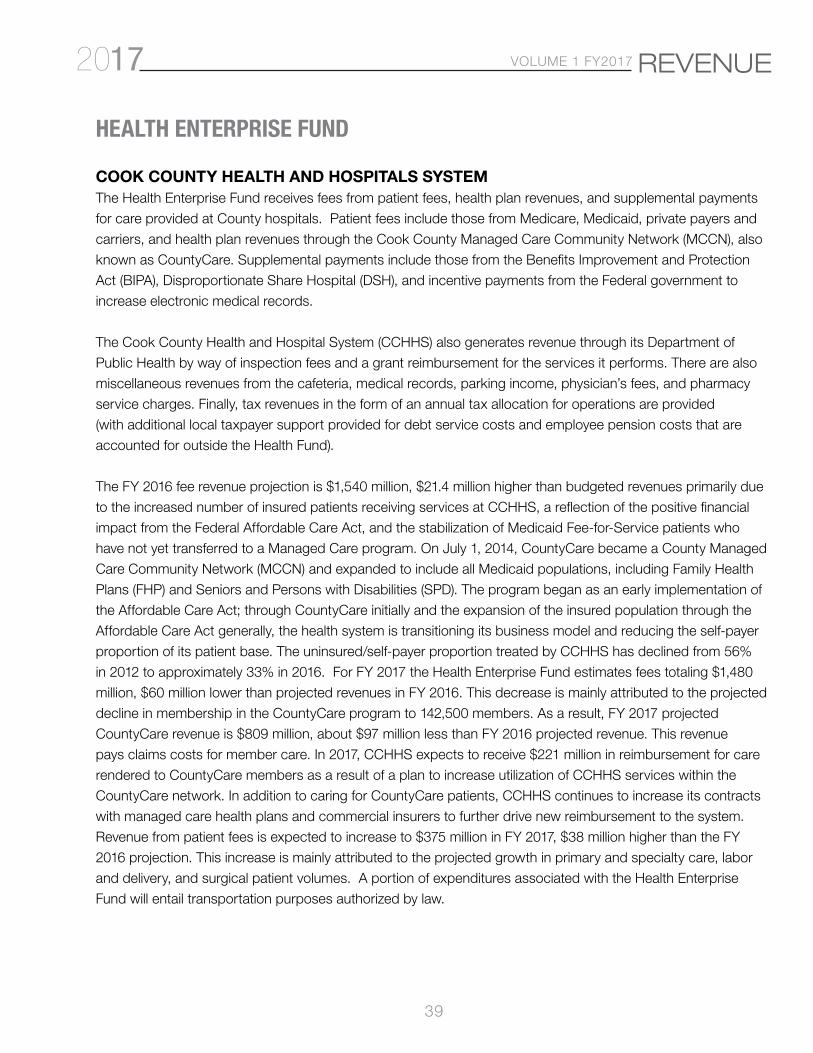
COOK COUNTY HEALTH AND HOSPITALS SYSTEMThe Health Enterprise Fund receives fees from patient fees, health plan revenues, and supplemental payments for care provided at County hospitals. Patient fees include those from Medicare, Medicaid, private payers and carriers, and health plan revenues through the Cook County Managed Care Community Network (MCCN), also known as CountyCare. Supplemental payments include those from the Benefits Improvement and Protection Act (BIPA), Disproportionate Share Hospital (DSH), and incentive payments from the Federal government to increase electronic medical records.
The Cook County Health and Hospital System (CCHHS) also generates revenue through its Department of Public Health by way of inspection fees and a grant reimbursement for the services it performs. There are also miscellaneous revenues from the cafeteria, medical records, parking income, physician’s fees, and pharmacy service charges. Finally, tax revenues in the form of an annual tax allocation for operations are provided (with additional local taxpayer support provided for debt service costs and employee pension costs that are accounted for outside the Health Fund).
The FY 2016 fee revenue projection is $1,540 million, $21.4 million higher than budgeted revenues primarily due to the increased number of insured patients receiving services at CCHHS, a reflection of the positive financial impact from the Federal Affordable Care Act, and the stabilization of Medicaid Fee-for-Service patients who have not yet transferred to a Managed Care program. On July 1, 2014, CountyCare became a County Managed Care Community Network (MCCN) and expanded to include all Medicaid populations, including Family Health Plans (FHP) and Seniors and Persons with Disabilities (SPD). The program began as an early implementation of the Affordable Care Act; through CountyCare initially and the expansion of the insured population through the Affordable Care Act generally, the health system is transitioning its business model and reducing the self-payer proportion of its patient base. The uninsured/self-payer proportion treated by CCHHS has declined from 56% in 2012 to approximately 33% in 2016. For FY 2017 the Health Enterprise Fund estimates fees totaling $1,480 million, $60 million lower than projected revenues in FY 2016. This decrease is mainly attributed to the projected decline in membership in the CountyCare program to 142,500 members. As a result, FY 2017 projected CountyCare revenue is $809 million, about $97 million less than FY 2016 projected revenue. This revenue pays claims costs for member care. In 2017, CCHHS expects to receive $221 million in reimbursement for care rendered to CountyCare members as a result of a plan to increase utilization of CCHHS services within the CountyCare network. In addition to caring for CountyCare patients, CCHHS continues to increase its contracts with managed care health plans and commercial insurers to further drive new reimbursement to the system. Revenue from patient fees is expected to increase to $375 million in FY 2017, $38 million higher than the FY 2016 projection. This increase is mainly attributed to the projected growth in primary and specialty care, labor and delivery, and surgical patient volumes. A portion of expenditures associated with the Health Enterprise Fund will entail transportation purposes authorized by law.

REVENUE EXECUTIVE BUDGET RECOMMENDATION
40
$-
$200
$400
$600
$800
$1,000
$1,200
$1,400
$1,600
$1,800
FY13 FY14 FY15 FY16 FY17
Mill
ions
Total Health Enterprise Funds Fees
Data Source: Actual Revenues FY 2013 - FY 2015, Projected Actual Revenues FY 2016, Executive Recommendation FY 2017
Data Source: Actual Revenues FY 2013 - FY 2015, Projected Actual Revenues FY 2016, Executive Recommendation FY 2017
- 100 200 300 400 500 600 700 800 900 1,000
Managed Care
Patient Fees (Medicare, Medicaid, Private)
Fed State Med. Program Funding
Patient Fees (Medicaid Plan BIPA IGT)
CCHHS - Miscellaneous Fees
Public Health
Millions
FY 17 Health Enterprise Fund Fees

VOLUME 1 FY2017 REVENUE
41
INTERGOVERNMENTAL REVENUES
Revenue from intergovernmental sources is granted by other governmental units, i.e., the State. For example, the State through State statute agrees to partially reimburse for the salaries of the State’s Attorney and Public Defender.
All revenue received from the state criminal alien assistance (SCAAP), probation, Juvenile Temporary Detention Center (JTDC), Forest Preserve, State’s Attorney and the Public Defender are deposited into the Public Safety Fund.
The Intergovernmental revenue for FY 2016 is projected to be $44.3 million, though this incorporates an assumption that the State of Illinois ultimately funds these amounts despite the delay in passage of a full year state budget. In the County FY 2017, the revenue estimate is expected to decrease to $43.5 million due to a decrease in funding from the Administrative Office of the Illinois Courts (AOIC). The AOIC subsidizes the salaries of probation officers and administrative staff that work on behalf of adult and juvenile probation. In 2015 the Juvenile Temporary Detention Center (JTDC) transitioned from a Federal Transitional Administrator to the Office of the Chief Judge; as a result, the personnel assigned to the JTDC also became eligible for the AOIC subsidy.
$-
$5
$10
$15
$20
$25
$30
$35
$40
$45
$50
FY13 FY14 FY15 FY16 FY17
Mill
ions
Intergovernmental Revenue
Data Source: Actual Revenues FY 2013 - FY 2015, Projected Actual Revenues FY 2016, Executive Recommendation FY 2017

REVENUE EXECUTIVE BUDGET RECOMMENDATION
42
$-
$5
$10
$15
$20
$25
$30
$35
FY13 FY14 FY15 FY16 FY17
Mill
ions
Miscellaneous Revenue
Data Source: Actual Revenues FY 2013 - FY 2015, Projected Actual Revenues FY 2016, Executive Recommendation FY 2017
MISCELLANEOUS REVENUES
Miscellaneous Revenues includes real estate rental income from various County Buildings, sale of excess real estate, commissions on public telephones, proceeds from the estates of unknown heirs, investment income, and other forms of miscellaneous revenue such as parking fees and the sale of salvage. For FY 2017, Cook County is estimated to receive $28.6 million in miscellaneous revenues, a decline from the 2016 budgeted level but a modest $465,000 greater than projected 2016 year-end estimates.

VOLUME 1 FY2017 REVENUE
43
OTHER FINANCING SOURCES
In 2017 Other Financing Sources available to the General and Health Funds no longer includes the Motor Fuel Tax (MFT) which the State collects and remits to the County; these funds are now dedicated to support the Highway and Transportation plan and associated operating costs of the Highway and Transportation system. The remaining revenue source in Other Financing Sources are Indirect Costs reimbursed from Special Purpose Funds and Grants back to the County General Fund based on a cost allocation plan identifying indirect expenses and pension funding supplied by the County.
For FY 2017, the County is estimated to receive $11.6 million in Other Financing Sources, a decline of $52 million from FY 2016 projected revenues, entirely reflecting the County’s commitment to completely rollback MFT transfers to the General Fund and increase spending on infrastructure costs across the County following the 2016 increase in the sales tax. The Cook County Department of Transportation has developed the first Long Range Transportation Plan for Cook County since 1940. Through that process, a need for increased funding to support and rebuild infrastructure was identified.
$-
$10
$20
$30
$40
$50
$60
$70
$80
$90
$100
FY13 FY14 FY15 FY16 FY17
Mill
ions
Other Financing Sources
Data Source: Actual Revenues FY 2013 - FY 2015, Projected Actual Revenues FY 2016, Executive Recommendation FY 2017

REVENUE EXECUTIVE BUDGET RECOMMENDATION
44
Actual Appropriation Projected Actual RecommendationFY15 FY16 FY16 FY17
Property TaxesProperty Tax - Tax Levy 351,066,777$ 310,087,546$ 310,087,546$ 265,700,049$ Property Tax - Tax Increment Financing Surplus 6,715,296 11,266,000 11,266,000 9,040,000Total Property Tax Revenue 357,782,073$ 321,353,546$ 321,353,546$ 274,740,049$
Sales TaxesHome Rule Sales Tax 346,771,478 663,500,000 642,523,000 823,000,395Total Sales Tax Revenue 346,771,478$ 663,500,000$ 642,523,000$ 823,000,395$
Other Non-Property TaxesCounty Use Tax 80,991,543 77,000,000 81,291,313 81,000,000Off Track Betting Commission 1,783,185 1,150,000 1,504,586 1,000,000Illinois Gaming - Casino 8,508,058 8,450,000 11,384,804 8,500,000Retail Sale of Motor Vehicles Tax 3,634,741 3,200,000 3,358,614 3,400,000Retailer's Occupation Tax 2,747,398 2,440,000 2,919,000 2,930,000Wheel Tax 3,720,806 4,100,000 3,499,150 4,200,000State Income Tax 13,384,885 13,900,000 12,813,000 13,160,000Alcoholic Beverage Tax 36,616,131 37,000,000 37,584,508 37,250,000Gas / Diesel Fuel Tax 90,591,948 88,650,000 94,441,729 91,500,000Cigarette Tax 135,002,849 134,000,000 128,862,663 125,190,000Other Tobacco and Consumable Products Tax 6,886,583 8,750,000 8,605,330 8,000,000Firearm and Firearm Ammunition Tax 853,180 930,000 1,072,697 1,210,000Hotel Accommodations Tax - 15,400,000 16,617,830 31,500,000Gambling Machine Tax 987,923 1,500,000 5,165,987 2,100,000Sweetened Beverage Tax - - - 74,600,000Non-Retailer Transaction Use Tax 15,289,970 22,000,000 22,037,061 20,200,000Amusement Tax 33,860,195 30,250,000 34,038,848 32,300,000Parking Lot / Garage Operations Tax 46,712,293 45,500,000 48,069,659 47,300,000Total Other Non Property Taxes 481,571,688$ 494,220,000$ 513,266,779$ 585,340,000$
FeesCounty Treasurer 90,677,013 54,000,000 54,222,000 54,000,000County Clerk 10,120,275 10,350,000 10,447,218 10,595,000Recorder of Deeds 40,078,645 33,293,302 40,369,309 36,500,000Recorder Audit Revenues 113,745 750,000 162,953 200,000Clerk of Circuit Court 75,336,026 77,990,000 72,026,371 72,000,000County Sheriff 21,943,773 21,416,600 21,448,472 18,226,300State's Attorney 1,688,347 1,850,000 1,678,000 1,600,000Building & Zoning 4,400,449 3,550,000 3,520,934 3,500,000Environmental Control 4,673,961 4,770,000 4,770,000 4,700,000County Assessor 67,747 56,760 56,760 56,760County Assessor Tax Fraud 1,756,934 3,453,250 1,622,400 - Highway Department Permits 1,501,258 1,800,000 1,863,582 1,800,000Public Administrator 750,068 900,000 900,000 900,000Liquor Licenses 348,935 330,000 331,000 305,000Public Guardian 2,625,635 3,000,000 2,799,954 3,027,127Medical Examiner 1,276,312 1,500,000 1,275,000 1,400,000Sheriff Court Services Fee 8,231,200 8,474,000 8,200,886 7,440,885Cable TV Franchise 1,195,470 1,320,000 1,134,587 1,000,000Other Fees 277,214 262,500 244,725 253,000Total Fee Revenue 267,063,007$ 229,066,412$ 227,074,151$ 217,504,072$
County Health & Hospital System FeesPatient Fees (Medicare ,Medicaid, Private) 347,318,111 266,000,000 337,101,438 375,119,387Patient Fees - Medicaid Plan BIPA IGT 138,668,750 131,250,000 134,586,500 132,337,500Fed State Med. Program Funding 157,709,645 162,338,232 156,718,352 156,700,000Managed Care 859,295,613 952,420,286 906,101,212 809,273,903CCHHS - Miscellaneous Fees 5,128,401 5,108,481 4,000,000 5,000,000Public Health 2,877,410 2,000,000 2,000,000 2,000,000Total CCHHS Fee Revenue 1,510,997,930$ 1,519,116,999$ 1,540,507,502$ 1,480,430,790$
Intergovernmental RevenuesFederal GovernmentState Criminal Alien Assist. (SCAAP) 1,350,766 1,436,985 1,436,985 1,436,985State of IllinoisProbation Off, Juvenile CT & JTDC 42,756,732 49,000,000 42,536,680 39,967,570Salaries of State's Attorney 195,792 195,784 195,784 195,784Salaries of Public Defender 124,666 129,703 129,703 131,320Cook County Forest Preserve DistrictReimbursement for Services - - - 1,815,377Total Intergovernmental Revenues 44,427,956$ 50,762,472$ 44,299,152$ 43,547,036$
Miscellaneous RevenuesInvestment Income 260,619 260,236 260,236 760,236Estate of Heirs - 500,000 500,000 500,000Telephone Commissions 3,356,293 2,400,000 3,357,600 2,200,000Real Estate and Rental Income 5,905,004 9,197,272 7,782,360 8,857,599Other 4,956,157 19,823,829 16,234,239 16,282,061Total Miscellaneous Revenues 14,478,073$ 32,181,337$ 28,134,435$ 28,599,896$
Other Financing SourcesMotor Fuel Tax 64,500,000 54,500,000 54,500,000 - Indirect Costs 9,518,543 10,087,429 8,871,978 11,594,089Total Other Financing Sources 74,018,543$ 64,587,429$ 63,371,978$ 11,594,089$
Revenue Total 3,097,110,748$ 3,374,788,195$ 3,380,530,543$ 3,464,756,327$
2017 ANNUAL REVENUES BY SOURCE

VOLUME 1 FY2017 REVENUE
45
Recommendation Revenue Allocation
Property TaxesProperty Tax - Tax Levy 265,700,049$ 177,836,169$ Property Tax - Tax Increment Financing Surplus 9,040,000 9,040,000Total Property Tax Revenue 274,740,049$ 186,876,169$
Sales TaxesHome Rule Sales Tax 823,000,395 823,000,395Total Sales Tax Revenue 823,000,395$ 823,000,395$
Other Non-Property TaxesCounty Use Tax 81,000,000 81,000,000Off Track Betting Commission 1,000,000 1,000,000Illinois Gaming - Casino 8,500,000 8,500,000Retail Sale of Motor Vehicles Tax 3,400,000 3,400,000Retailer's Occupation Tax 2,930,000 2,930,000Wheel Tax 4,200,000 4,200,000State Income Tax 13,160,000 13,160,000Alcoholic Beverage Tax 37,250,000 37,250,000Gas / Diesel Fuel Tax 91,500,000 91,500,000Cigarette Tax 125,190,000 121,803,880Other Tobacco and Consumable Products Tax 8,000,000 8,000,000Firearm and Firearm Ammunition Tax 1,210,000 1,210,000Hotel Accommodations Tax 31,500,000 31,500,000Gambling Machine Tax 2,100,000 2,100,000Sweetened Beverage Tax 74,600,000 54,600,000Non-Retailer Transaction Use Tax 20,200,000 20,200,000Amusement Tax 32,300,000 32,300,000Parking Lot / Garage Operations Tax 47,300,000 47,300,000Total Other Non Property Taxes 585,340,000$ 561,953,880$
FeesCounty Treasurer 54,000,000 54,000,000County Clerk 10,595,000 10,595,000Recorder of Deeds 36,500,000 36,500,000Recorder Audit Revenues 200,000 200,000Clerk of Circuit Court 72,000,000 72,000,000County Sheriff 18,226,300 18,226,300State's Attorney 1,600,000 1,600,000Building & Zoning 3,500,000 3,500,000Environmental Control 4,700,000 4,700,000County Assessor 56,760 56,760County Assessor Tax Fraud - - Highway Department Permits 1,800,000 1,800,000Public Administrator 900,000 900,000Liquor Licenses 305,000 305,000Public Guardian 3,027,127 3,027,127Medical Examiner 1,400,000 1,400,000Sheriff Court Services Fee 7,440,885 7,440,885Cable TV Franchise 1,000,000 1,000,000Other Fees 253,000 253,000Total Fee Revenue 217,504,072$ 217,504,072$
County Health & Hospital System FeesPatient Fees (Medicare ,Medicaid, Private) 375,119,387Patient Fees - Medicaid Plan BIPA IGT 132,337,500Fed State Med. Program Funding 156,700,000Managed Care 809,273,903CCHHS - Miscellaneous Fees 5,000,000Public Health 2,000,000Total CCHHS Fee Revenue 1,480,430,790$ -$
Intergovernmental RevenuesFederal GovernmentState Criminal Alien Assist. (SCAAP) 1,436,985 1,436,985State of IllinoisProbation Off, Juvenile CT & JTDC 39,967,570 39,967,570Salaries of State's Attorney 195,784 195,784Salaries of Public Defender 131,320 131,320Cook County Forest Preserve DistrictReimbursement for Services 1,815,377 1,815,377Total Intergovernmental Revenues 43,547,036$ 43,547,036$
Miscellaneous RevenuesInvestment Income 760,236 760,236Estate of Heirs 500,000 500,000Telephone Commissions 2,200,000 2,200,000Real Estate and Rental Income 8,857,599 8,857,599Other 16,282,061 16,282,061Total Miscellaneous Revenues 28,599,896$ 28,599,896$
Other Financing SourcesMotor Fuel Tax - - Indirect Costs 11,594,089 11,594,089Total Other Financing Sources 11,594,089$ 11,594,089$
Revenue Total 3,464,756,327$ 1,873,075,537$
2017 PROJECTED ANNUAL REVENUE ALLOCATION GENERAL FUND

REVENUE EXECUTIVE BUDGET RECOMMENDATION
46
Recommendation Revenue Allocation
Property TaxesProperty Tax - Tax Levy 265,700,049$ 87,863,880$ Property Tax - Tax Increment Financing Surplus 9,040,000Total Property Tax Revenue 274,740,049$ 87,863,880$
Sales TaxesHome Rule Sales Tax 823,000,395Total Sales Tax Revenue 823,000,395$ -$
Other Non-Property TaxesCounty Use Tax 81,000,000Off Track Betting Commission 1,000,000Illinois Gaming - Casino 8,500,000Retail Sale of Motor Vehicles Tax 3,400,000Retailer's Occupation Tax 2,930,000Wheel Tax 4,200,000State Income Tax 13,160,000Alcoholic Beverage Tax 37,250,000Gas / Diesel Fuel Tax 91,500,000Cigarette Tax 125,190,000 3,386,120Other Tobacco and Consumable Products Tax 8,000,000Firearm and Firearm Ammunition Tax 1,210,000Hotel Accommodations Tax 31,500,000Gambling Machine Tax 2,100,000Sweetened Beverage Tax 74,600,000 20,000,000Non-Retailer Transaction Use Tax 20,200,000Amusement Tax 32,300,000Parking Lot / Garage Operations Tax 47,300,000Total Other Non Property Taxes 585,340,000$ 23,386,120$
FeesCounty Treasurer 54,000,000County Clerk 10,595,000Recorder of Deeds 36,500,000Recorder Audit Revenues 200,000Clerk of Circuit Court 72,000,000County Sheriff 18,226,300State's Attorney 1,600,000Building & Zoning 3,500,000Environmental Control 4,700,000County Assessor 56,760County Assessor Tax Fraud - Highway Department Permits 1,800,000Public Administrator 900,000Liquor Licenses 305,000Public Guardian 3,027,127Medical Examiner 1,400,000Sheriff Court Services Fee 7,440,885Cable TV Franchise 1,000,000Other Fees 253,000Total Fee Revenue 217,504,072$ -$
County Health & Hospital System FeesPatient Fees (Medicare ,Medicaid, Private) 375,119,387 375,119,387Patient Fees - Medicaid Plan BIPA IGT 132,337,500 132,337,500Fed State Med. Program Funding 156,700,000 156,700,000Managed Care 809,273,903 809,273,903CCHHS - Miscellaneous Fees 5,000,000 5,000,000Public Health 2,000,000 2,000,000Total CCHHS Fee Revenue 1,480,430,790$ 1,480,430,790$
Intergovernmental RevenuesFederal GovernmentState Criminal Alien Assist. (SCAAP) 1,436,985State of IllinoisProbation Off, Juvenile CT & JTDC 39,967,570Salaries of State's Attorney 195,784Salaries of Public Defender 131,320Cook County Forest Preserve DistrictReimbursement for Services 1,815,377Total Intergovernmental Revenues 43,547,036$ -$
Miscellaneous RevenuesInvestment Income 760,236Estate of Heirs 500,000Telephone Commissions 2,200,000Real Estate and Rental Income 8,857,599Other 16,282,061Total Miscellaneous Revenues 28,599,896$ -$
Other Financing SourcesMotor Fuel Tax - Indirect Costs 11,594,089Total Other Financing Sources 11,594,089$ -$
Revenue Total 3,464,756,327$ 1,591,680,790$
2017 PROJECTED ANNUAL REVENUE ALLOCATION HEALTH ENTERPRISE FUND

VOLUME 1 FY2017 REVENUE
47
Revenue Source Corporate Public Safety Health Grand TotalProperty TaxesProperty Tax - Tax Levy 17,669,022$ 160,167,147$ 87,863,880$ 265,700,049$ Property Tax - Tax Increment Financing Surplus 9,040,000 9,040,000$ Total Property Tax Revenue 17,669,022$ 169,207,147$ 87,863,880$ 274,740,049$
Sales TaxesHome Rule Sales Tax 381,610,239 441,390,156 823,000,395Total Sales Tax Revenue 381,610,239$ 441,390,156$ -$ 823,000,395$
Other Non-Property TaxesCounty Use Tax 81,000,000 81,000,000Off Track Betting Commission 1,000,000 1,000,000Illinois Gaming - Casino 8,500,000 8,500,000Retail Sale of Motor Vehicles Tax 3,400,000 3,400,000Retailer's Occupation Tax 2,930,000 2,930,000Wheel Tax 4,200,000 4,200,000State Income Tax 13,160,000 13,160,000Alcoholic Beverage Tax 37,250,000 37,250,000Gas / Diesel Fuel Tax 91,500,000 91,500,000Cigarette Tax 121,803,880 3,386,120 125,190,000Other Tobacco and Consumable Products Tax 8,000,000 8,000,000Firearm and Firearm Ammunition Tax 1,210,000 1,210,000Hotel Accommodations Tax 31,500,000 31,500,000Gambling Machine Tax 2,100,000 2,100,000Sweetened Beverage Tax 54,600,000 20,000,000 74,600,000Non-Retailer Transaction Use Tax 20,200,000 20,200,000Amusement Tax 32,300,000 32,300,000Parking Lot / Garage Operations Tax 47,300,000 47,300,000Total Other Non Property Taxes -$ 561,953,880$ 23,386,120$ 585,340,000$
FeesCounty Treasurer 54,000,000 54,000,000County Clerk 10,595,000 10,595,000Recorder of Deeds 36,500,000 36,500,000Recorder Audit Revenues 200,000 200,000Clerk of Circuit Court 72,000,000 72,000,000County Sheriff 18,226,300 18,226,300State's Attorney 1,600,000 1,600,000Building & Zoning 3,500,000 3,500,000Environmental Control 4,700,000 4,700,000County Assessor 56,760 56,760Highway Department Permits 1,800,000 1,800,000Public Administrator 900,000 900,000Liquor Licenses 305,000 305,000Public Guardian 3,027,127 3,027,127Medical Examiner 1,400,000 1,400,000Sheriff Court Services Fee 7,440,885 7,440,885Cable TV Franchise 1,000,000 1,000,000Other Fees 253,000 253,000Total Fee Revenue 112,909,760$ 104,594,312$ -$ 217,504,072$
County Health & Hospital System FeesPatient Fees (Medicare ,Medicaid, Private) 375,119,387 375,119,387Patient Fees - Medicaid Plan BIPA IGT 132,337,500 132,337,500Fed State Med. Program Funding 156,700,000 156,700,000Managed Care 809,273,903 809,273,903CCHHS - Miscellaneous Fees 5,000,000 5,000,000Public Health 2,000,000 2,000,000Total CCHHS Fee Revenue -$ -$ 1,480,430,790$ 1,480,430,790$
Intergovernmental RevenuesFederal GovernmentState Criminal Alien Assist. (SCAAP) 1,436,985 1,436,985State of Illinois 0Probation Off, Juvenile CT & JTDC 39,967,570 39,967,570Salaries of State's Attorney 195,784 195,784Salaries of Public Defender 131,320 131,320Cook County Forest Preserve District 0Reimbursement for Services 1,815,377 1,815,377Total Intergovernmental Revenues 1,815,377$ 41,731,659$ -$ 43,547,036$
Miscellaneous RevenuesInvestment Income 760,236 760,236Estate of Heirs 500,000 500,000Telephone Commissions 2,200,000 2,200,000Real Estate and Rental Income 8,857,599 8,857,599Other 12,226,061 4,056,000 16,282,061Total Miscellaneous Revenues 22,343,896$ 6,256,000$ -$ 28,599,896$
Other Financing SourcesMotor Fuel TaxIndirect Costs 7,844,297 3,749,792 11,594,089Total Other Financing Sources 7,844,297$ 3,749,792$ -$ 11,594,089$
Grand Total 544,192,591$ 1,328,882,946$ 1,591,680,790$ 3,464,756,327$
General & Health Enterprise Fund Revenues Uses and Purposes

REVENUE EXECUTIVE BUDGET RECOMMENDATION
48
INTRODUCTION TO SPECIAL PURPOSE FUNDS
The total amount of special purpose fund revenue and fund balance used for the appropriation in FY 2017 is estimated to be $680.9 million, an increase of $63.4 million from FY 2016. Special purpose funds are enabled through State statute and have defined sources of revenue and uses for expenditures; in contrast to the General Fund the County has traditionally considered the appropriation of fund balance for Special Purpose Funds as an available resource for appropriation, though it is not required to budget such fund balances and generally does not appropriate the entire fund balance where practical. In FY 2017, there are 35 special purpose funds. In addition to these special purpose funds, there are funds specifically utilized to pay for bond and interest as well as the statutory payment for the employee annuity and benefit fund. These funds receive revenues from the property tax as well as the Personal Property Replacement Tax (PPRT). Most of the variance between FY 2016 and FY 2017 special purpose funds is attributed to a $27 million increase in rising bond and interest expenses associated with legacy debt service as well as a transfer of $22 million to the Motor Fuel Tax Illinois First Special Purpose Fund.
BOARD OF ELECTION COMMISSIONERS ELECTION FUNDThe election fund revenue comes from the property tax and varies according to the election cycle. As a result, this fund decreases from $42.7 million in FY 2016 to $22 million in FY 2017 due to the decline in the City of Chicago election costs that occur in odd numbered years.
BOND AND INTERESTThe bond and interest fund is utilized for County debt service payments. This fund receives revenue from a portion of the property tax levy. For FY 2017, this fund is expected to receive $277.1 million, up from $250 million in FY 2016, reflecting an increase in projected debt service costs associated with legacy debt issuance.
ANNUITY AND BENEFITSThe annuity and benefits fund is utilized for statutory payments to the Pension Fund. For FY 2017, this fund will receive revenue from the property tax levy in the amount of $162.3 million and a projected $46 million from the PPRT, for a total budget of $208.2 million. This is an increase of $12.6 million from the FY 2016 total of $195.6 million. The 2015 employee payroll deductions for pension purposes are used to establish the County funding requirement for the Annuity and Benefits Fund in the 2017 levy year which reflected higher costs versus the 2014 figure utilized in calculating the 2016 statutorily authorized payment, largely due to the timing of the calendar in 2015 having 27 bi-weekly pay periods rather than the 26 that occurs in most years, along with the impact of retroactive union agreement settlements during 2015.

VOLUME 1 FY2017 REVENUE
49
Fisc
al Y
ear 2
017
Spec
ial P
urpo
se F
unds
Dep
t. S
peci
al P
urpo
se
Fund
sFY
201
5 En
ding
Fu
nd B
alan
ceFY
201
6 R
even
ue
Estim
ate
FY 2
016
Estim
ated
Tot
al
Res
ourc
es
FY 2
016
Estim
ated
Ex
pend
iture
s
FY 2
016
Proj
ecte
d En
ding
Bal
ance
FY 2
017
Rev
enue
Es
timat
e
FY 2
017
Estim
ated
Tot
al
Res
ourc
es
FY 2
017
Estim
ated
Ex
pend
iture
s
FY 2
017
Proj
ecte
d En
ding
Bal
ance
Bur
eau
of A
dmin
istr
atio
n
501
Mot
or F
uel T
ax Il
linoi
s Fi
rst
(1st
)4,
296,
671
25,9
25,2
3530
,221
,906
24,8
53,5
995,
368,
307
48,2
14,6
1753
,582
,924
48,2
14,6
175,
368,
307
Inte
rgov
ernm
enta
l rev
enue
for p
lann
ing
road
infra
stru
ctur
e im
prov
emen
ts w
ith th
e S
tate
of I
llino
is a
nd F
eder
al G
over
nmen
t.
510
Ani
mal
Con
trol
8,83
2,64
43,
376,
752
12,2
09,3
963,
533,
728
8,67
5,66
83,
750,
000
12,4
25,6
684,
545,
521
7,88
0,14
7Fu
nded
by
fees
for t
he c
ontro
l and
pre
vent
the
spre
ad o
f rab
ies.
530
Law
Lib
rary
(956
,792
)5,
000,
000
4,04
3,20
84,
862,
261
(819
,053
)5,
000,
000
4,18
0,94
74,
891,
570
(710
,623
)Fu
nded
by
fees
to p
rovi
de fo
r org
aniz
ed b
ook
colle
ctio
ns, b
iblio
grap
hica
l and
refe
renc
e se
rvic
e to
law
yers
, jud
ges
and
gene
ral l
aw li
brar
y se
rvic
es to
pub
lic.
585
Env
ironm
enta
l Con
trol S
olid
W
aste
405,
924
480,
000
885,
924
443,
439
442,
485
480,
000
922,
485
559,
102
363,
383
Bur
eau
of T
echn
olog
y
545
Geo
grap
hica
l Inf
orm
atio
n S
yste
m (R
ecor
der)
12,3
57,3
898,
696,
981
21,0
54,3
7012
,661
,458
8,39
2,91
28,
696,
981
17,0
89,8
9312
,733
,799
4,35
6,09
4
Fund
ed b
y Fe
es fo
r equ
ipm
ent,
mat
eria
l, an
d ne
cess
ary
expe
nses
incu
rred
in im
plem
entin
g an
d m
aint
aini
ng th
e G
IS s
yste
m.
Cou
nty
Cle
rk
524
Cou
nty
Cle
rk E
lect
ion
Div
isio
n13
,664
,659
24,7
90,6
2338
,455
,282
24,7
90,6
2313
,664
,659
20,9
14,0
4634
,578
,705
20,9
14,0
4613
,664
,659
525
Boa
rd o
f Ele
ctio
n C
omm
issi
oner
s9,
845,
075
17,8
61,0
7727
,706
,152
17,8
61,0
779,
845,
075
1,08
9,58
110
,934
,656
1,08
9,58
19,
845,
075
Pro
perty
Tax
reve
nue
to p
ay fo
r the
cos
ts o
f ele
ctio
ns u
nder
the
juris
dict
ion
of th
e C
ount
y C
lerk
and
the
Boa
rd o
f Ele
ctio
ns.
533
Cou
nty
Cle
rk A
utom
atio
n Fu
nd77
1,43
01,
179,
521
1,95
0,95
11,
579,
042
371,
909
1,35
0,00
01,
721,
909
1,68
3,20
838
,701
Fees
use
d to
upg
rade
and
est
ablis
h co
mpu
teriz
ed fi
les
for v
oter
regi
stra
tion
and
elec
tion
judg
es.
Rec
orde
r of D
eeds
527
Cou
nty
Rec
orde
r Doc
umen
t S
tora
ge1,
302,
363
3,03
6,56
24,
338,
925
4,84
5,27
4(5
06,3
49)
2,94
5,46
62,
439,
117
3,88
9,56
0(1
,450
,443
)
Fund
ed w
ith fe
es u
sed
to p
ay fo
r the
exp
endi
ture
s in
volv
ed in
sta
rting
and
mai
ntai
ning
a d
ocum
ent s
tora
ge s
yste
m.
570
Rec
orde
r GIS
Fee
(671
,621
)1,
894,
030
1,22
2,40
91,
813,
067
(590
,658
)1,
837,
209
1,24
6,55
11,
594,
331
(347
,780
)Fu
nded
with
Fee
s to
pro
vide
and
mai
ntai
n a
coun
tyw
ide
map
thro
ugh
a ge
ogra
phic
info
rmat
ion
syst
em.
571
Ren
tal H
ousi
ng S
uppo
rt Fe
e19
6,67
027
4,83
647
1,50
627
4,83
619
6,67
026
6,59
146
3,26
145
7,11
76,
144
Fund
ed th
roug
h Fe
es fr
om a
Sta
te s
urch
arge
, to
assi
st in
add
ress
ing
the
need
for r
enta
l hou
sing
.
Cou
nty
Trea
sure
r
534
Tax
Sal
e A
utom
atio
n Fu
nd17
,049
,018
9,51
5,46
626
,564
,484
10,4
86,3
8816
,078
,096
9,50
0,00
025
,578
,096
11,6
90,1
9113
,887
,905
Use
r Fee
s us
ed to
Pay
for t
he e
xpen
ditu
res
requ
ired
to s
tart
and
mai
ntai
n a
com
pute
rized
sys
tem
to c
ondu
ct d
elin
quen
t pro
perty
tax
sale
s.
Chi
ef J
udge
531
Dis
pute
Res
olut
ion
- Chi
ef
Judg
e 10
1,32
317
2,00
027
3,32
319
2,55
380
,770
175,
000
255,
770
196,
547
59,2
23
Fee
reve
nue
sour
ce u
sed
to s
uppo
rt ac
tiviti
es to
med
iate
dis
pute
s in
an
atte
mpt
to re
lieve
the
cour
t sys
tem
of l
engt
hy la
wsu
its.
532
Adu
lt P
roba
tion
Ser
vice
Fee
1,
621,
088
4,16
0,00
05,
781,
088
3,85
7,57
21,
923,
516
4,15
0,00
06,
073,
516
6,05
5,15
618
,360
Fee
reve
nue
sour
ce u
sed
to s
uper
vise
peo
ple
conv
icte
d of
crim
inal
and
civ
il of
fens
es.
Fees
col
lect
ed fr
om s
anita
ry la
ndfil
ls a
nd m
unic
ipal
sol
id w
aste
tran
sfer
sta
tions
loca
ted
with
in C
ook
Cou
nty.

REVENUE EXECUTIVE BUDGET RECOMMENDATION
50
Fisc
al Y
ear 2
017
Spec
ial P
urpo
se F
unds
Dep
t. S
peci
al P
urpo
se
Fund
sFY
201
5 En
ding
Fu
nd B
alan
ceFY
201
6 R
even
ue
Estim
ate
FY 2
016
Estim
ated
Tot
al
Res
ourc
es
FY 2
016
Estim
ated
Ex
pend
iture
s
FY 2
016
Proj
ecte
d En
ding
Bal
ance
FY 2
017
Rev
enue
Es
timat
e
FY 2
017
Estim
ated
Tot
al
Res
ourc
es
FY 2
017
Estim
ated
Ex
pend
iture
s
FY 2
017
Proj
ecte
d En
ding
Bal
ance
541
Soc
ial S
ervi
ces
- Pro
batio
n C
ourt
Fee
2,62
1,65
52,
850,
000
5,47
1,65
54,
389,
278
1,08
2,37
75,
820,
000
6,90
2,37
76,
855,
592
46,7
85
Fee
used
to p
rovi
de s
ocia
l ser
vice
cas
ewor
k ex
perti
se fo
r pro
batio
n an
d co
urt s
ervi
ce c
ases
.
572
Chi
ldre
n W
aitin
g R
oom
620,
292
2,35
0,00
02,
970,
292
2,36
6,33
660
3,95
62,
350,
000
2,95
3,95
62,
724,
924
229,
032
Fee
used
to p
rovi
de fr
ee, o
n-si
te c
are
for c
hild
ren
who
se p
aren
ts o
r gua
rdia
ns a
ttend
cou
rt to
pro
tect
chi
ldre
n fro
m b
eing
exp
osed
to p
oten
tially
trau
mat
ic c
ourtr
oom
test
imon
y or
beh
avio
r.57
4M
enta
l Hea
lth(4
09,0
37)
770,
000
360,
963
681,
539
(320
,576
)77
0,00
044
9,42
470
1,25
4(2
51,8
30)
Fee
reve
nue
sour
ce to
add
ress
the
disp
ropo
rtion
ate
invo
lvem
ent o
f ind
ivid
uals
with
men
tal i
llnes
s in
the
crim
inal
just
ice
syst
em.
575
Pee
r Cou
rt(2
27,6
26)
350,
000
122,
374
301,
148
(178
,774
)35
0,00
017
1,22
630
1,10
7(1
29,8
81)
Fee
reve
nue
sour
ce to
col
lect
, dis
pers
e, a
nd a
ccou
nt fo
r pee
r jur
y an
d te
en c
ourt
or y
outh
div
ersi
on s
ervi
ces.
576
Dru
g C
ourt
(217
,372
)40
0,00
018
2,62
830
1,24
6(1
18,6
18)
375,
000
256,
382
301,
071
(44,
689)
Fund
ed b
y fe
es to
ass
ist n
onvi
olen
t sub
stan
ce a
busi
ng o
ffend
ers
in th
eir r
ecov
ery
from
dru
g an
d/or
alc
ohol
add
ictio
n.H
ealth
and
Hos
pita
l
544
Lead
Poi
soni
ng P
reve
ntio
n Fu
nd10
,155
,108
010
,155
,108
1,32
0,57
18,
834,
537
08,
834,
537
4,14
2,22
34,
692,
314
564
Sub
urba
n C
ook
Cou
nty
TB
San
itariu
m D
istri
ct
12,8
67,9
421,
110,
608
13,9
78,5
505,
161,
774
8,81
6,77
61,
287,
805
10,1
04,5
815,
695,
934
4,40
8,64
7
Fund
ed b
y "o
ther
reve
nue"
to p
reve
nt, c
are,
trea
t, an
d co
ntro
l tub
ercu
losi
s an
d ot
her c
omm
unic
able
dis
ease
s in
or a
ssoc
iate
d w
ith C
ook
Cou
nty.
Cle
rk o
f the
Circ
uit C
ourt
528
Aut
omat
ion
(9,7
89,5
75)
11,4
19,0
001,
629,
425
9,37
2,68
3(7
,743
,258
)10
,500
,000
2,75
6,74
29,
900,
042
(7,1
43,3
00)
Fund
ed b
y fe
es fo
r the
acq
uisi
tion,
inst
alla
tion,
and
mai
nten
ance
of a
ll co
mpu
ter h
ardw
are
syst
em a
naly
sis,
des
ign,
pro
gram
min
g, a
nd a
ll co
mpu
ter p
rogr
ams.
529
Doc
umen
t Sto
rage
(7
,585
,339
)10
,372
,000
2,78
6,66
18,
278,
132
(5,4
91,4
71)
9,20
0,00
03,
708,
529
8,68
7,39
1(4
,978
,862
)Fu
nded
by
fees
to a
ssis
t in
the
prep
arat
ion
of d
ocum
ents
to
be m
icro
film
ed o
r mic
rofic
hed,
and
per
form
film
ing
whe
n ne
cess
ary.
567
Cle
rk A
dmin
istra
tive
(225
,346
)82
0,00
059
4,65
477
6,51
1(1
81,8
57)
820,
000
638,
143
739,
048
(100
,905
)
580
Ele
ctro
nic
Cita
tion
Fund
44
,740
268,
000
312,
740
268,
000
44,7
4025
0,00
029
4,74
025
0,00
044
,740
Fees
use
d to
est
ablis
h an
d m
aint
ain
a sy
stem
for e
lect
roni
c ci
tatio
ns.
Publ
ic D
efen
der
584
Rec
ords
Aut
omat
ion
Fund
86
,749
128,
333
215,
082
158,
000
57,0
8215
8,00
021
5,08
213
8,00
077
,082
Sher
riff
535
911
- Int
ergo
vern
men
tal
Agr
eem
ent -
ETS
B
(2,5
89,5
25)
1,54
7,28
3(1
,042
,242
)3,
023,
312
(4,0
65,5
54)
2,09
9,38
8(1
,966
,166
)1,
917,
470
(3,8
83,6
36)
Inte
rgov
ernm
enta
l rev
enue
for t
he Im
plem
enta
tion,
inst
alla
tion
of a
n en
hanc
ed “9
11” e
mer
genc
y te
leph
one
syst
em fo
r the
citi
zens
of u
ninc
orpo
rate
d C
ook
Cou
nty.
Fund
ed b
y "o
ther
reve
nue"
to re
duce
the
dang
er o
f lea
d-ba
sed
pain
in C
ook
Cou
nty
dwel
lings
, thr
ough
lead
aba
tem
ent,
miti
gatio
n, a
nd e
duca
tion
of re
side
nts
on th
e da
nger
s of
lead
bas
ed p
aint
/mat
eria
ls.
Fund
ed th
roug
h fe
es to
offs
et c
osts
incu
rred
by th
e C
ircui
t Cou
rt C
lerk
in p
erfo
rmin
g ad
ditio
nal d
utie
s re
quire
d to
col
lect
and
dis
burs
e fu
nds
to e
ntiti
es o
f Sta
te a
nd L
ocal
Gov
ernm
ents
.
Fee
reve
nue
sour
ce to
dev
elop
and
impl
emen
t cos
t effe
ctiv
e an
d pr
oduc
tivity
enh
anci
ng in
form
atio
n te
chno
logy
sol
utio
ns to
mee
t cur
rent
and
futu
re d
ocum
ent s
tora
ge a
nd re
cord
s re
tent
ion
need
s.

VOLUME 1 FY2017 REVENUE
51
Fisc
al Y
ear 2
017
Spec
ial P
urpo
se F
unds
Dep
t. S
peci
al P
urpo
se
Fund
sFY
201
5 En
ding
Fu
nd B
alan
ceFY
201
6 R
even
ue
Estim
ate
FY 2
016
Estim
ated
Tot
al
Res
ourc
es
FY 2
016
Estim
ated
Ex
pend
iture
s
FY 2
016
Proj
ecte
d En
ding
Bal
ance
FY 2
017
Rev
enue
Es
timat
e
FY 2
017
Estim
ated
Tot
al
Res
ourc
es
FY 2
017
Estim
ated
Ex
pend
iture
s
FY 2
017
Proj
ecte
d En
ding
Bal
ance
573
Wom
en's
Jus
tice
Ser
vice
(3
,137
)64
,339
61,2
0240
,000
21,2
0220
,000
41,2
0220
,000
21,2
02
577
Veh
icle
Pur
chas
e Fu
nd -
(Cle
rk o
f the
Circ
uit C
ourt)
861,
628
500,
000
1,36
1,62
850
0,00
086
1,62
830
0,00
01,
161,
628
277,
500
884,
128
Stat
es A
ttorn
ey
561
Nar
cotic
For
feitu
re
(2,8
26,7
85)
3,77
5,73
794
8,95
23,
597,
408
(2,6
48,4
56)
3,80
0,00
01,
151,
544
3,38
2,08
9(2
,230
,545
)
583
Rec
ords
Aut
omat
ion
Fund
20
7,50
213
7,48
834
4,99
015
8,41
118
6,57
913
8,00
032
4,57
913
8,00
018
6,57
9
Fee
reve
nue
used
to p
rovi
de p
rofe
ssio
nal s
ervi
ces
to y
outh
ful o
ffend
er’s
invo
lved
in th
e Ju
veni
le J
ustic
e sy
stem
.
Asse
ssor
579
Ass
esso
r Spe
cial
Rev
enue
70
,508
815,
000
885,
508
815,
000
70,5
0881
5,00
088
5,50
881
5,00
070
,508
Oth
er re
venu
e fo
r mar
ketin
g op
portu
nitie
s fo
r, an
d no
t lim
ited
to, t
he A
sses
sor's
web
site
, dat
abas
e an
d as
sess
men
t not
ices
.
588
Erro
neou
s H
omes
tead
E
xem
ptio
n R
ecov
ery
Fund
00
00
02,
672,
282
2,67
2,28
22,
672,
282
0
Rev
enue
gen
erat
ed th
roug
h pe
nalti
es a
nd in
tere
st b
ased
on
audi
t fin
ding
s of
erro
neou
s ho
mes
tead
exe
mpt
ions
.
Land
Ban
k
586
Land
Ban
k A
utho
rity
3,43
4,79
69,
140,
656
12,5
75,4
526,
394,
518
6,18
0,93
420
,879
,066
27,0
60,0
0027
,060
,000
0
Est
ablis
hes
Land
Ban
k, fu
nded
by
"oth
er re
venu
e," t
o re
duce
and
retu
rn v
acan
t and
aba
ndon
ed p
rope
rties
bac
k in
to p
rodu
ctiv
e an
d su
stai
nabl
e co
mm
unity
ass
ets.
Econ
omic
Dev
elop
men
t
587
Sec
tion
108
Loan
Pro
gram
00
00
035
0,00
035
0,00
035
0,00
00
Pro
gram
allo
ws
loca
l gov
ernm
ents
to tr
ansf
orm
a p
ortio
n of
thei
r CD
BG
fund
s in
to fe
dera
lly g
uara
ntee
d lo
ans
to p
ursu
e ph
ysic
al a
nd e
cono
mic
revi
taliz
atio
n. p
roje
cts
capa
ble
of re
new
ing
entir
e ne
ighb
orho
ods.
Spec
ial P
urpo
se F
und
Subt
otal
$75,
913,
019
$153
,181
,527
$229
,094
,546
$159
,958
,784
$69,
135,
762
$171
,324
,032
$240
,459
,794
$195
,583
,273
$44,
876,
521
Oth
er S
peci
al P
urpo
se F
unds
700
Bon
d an
d In
tere
stN
/A25
0,00
0,00
025
0,00
0,00
025
0,00
0,00
0N
/A27
7,13
3,39
227
7,13
3,39
227
7,13
3,39
2N
/A
590
Ann
uity
and
Ben
efits
(P
rope
rty T
ax)
013
8,30
8,62
113
8,30
8,62
113
8,30
8,62
10
162,
275,
629
162,
275,
629
162,
275,
629
0
590
Ann
uity
and
Ben
efits
(P
PR
T)0
57,3
14,0
0057
,314
,000
57,3
14,0
000
45,9
50,5
7745
,950
,577
45,9
50,5
770
Tota
l Spe
cial
Pur
pose
Fu
nds
$75,
913,
019
$598
,804
,148
$674
,717
,167
$605
,581
,405
$69,
135,
762
$656
,683
,630
$725
,819
,392
$680
,942
,871
$44,
876,
521
* Dep
artm
ent 5
42 S
elf I
nsur
ance
Fun
d no
t inc
lude
d.
Oth
er re
venu
e so
urce
s to
fund
the
acqu
isiti
on o
r mai
nten
ance
of p
olic
e ve
hicl
es.
Inte
rgov
ernm
enta
l rev
enue
to fu
nd w
ork
with
Sta
te, C
ity a
nd C
ount
y A
genc
ies
on v
ario
us d
rug
rela
ted
case
s. R
even
ues
are
deriv
ed th
roug
h m
onie
s an
d Fo
rfeite
d N
arco
tics
Inve
stig
atio
ns.
Fee
reve
nue
sour
ce fo
r the
ope
ratio
n of
the
reha
bilit
atio
n pr
ogra
ms
prov
ided
by
the
She
riff’s
Dep
artm
ent o
f Wom
en’s
Jus
tice
Ser
vice
s, in
clud
ing
men
tal h
ealth
and
sub
stan
ce s
ervi
ces.

REVENUE EXECUTIVE BUDGET RECOMMENDATION
52
2008
2009
2010
2011
2012
2013
2014
2015
2016
2017
Cor
pora
te$1
2,54
6,22
2$1
2,54
6,22
2$1
1,81
4,35
6$1
2,91
2,70
8$1
0,12
9,47
4$7
,876
,457
$12,
146,
790
$11,
638,
727
$7,8
25,3
16$1
7,32
9,99
2P
ublic
Saf
ety
182,
230,
414
203,
836,
519
191,
946,
006
244,
587,
612
246,
079,
114
274,
129,
354
305,
385,
960
190,
000,
000
178,
718,
789
157,
093,
889
Hea
lth E
nter
pris
e Fu
nd14
8,85
3,73
714
8,85
3,73
714
0,17
0,56
711
8,40
5,01
485
,564
,791
82,6
56,6
4239
,725
,778
150,
000,
000
119,
753,
400
86,1
77,9
64Su
btot
al G
ener
al F
und
and
Hea
lth E
nter
pris
e Fu
nd$3
43,6
30,3
73$3
65,2
36,4
7834
3,93
0,92
9$
375,
905,
334
$
34
1,77
3,37
9$
$364
,662
,453
$357
,258
,528
$351
,638
,727
$306
,297
,505
$260
,601
,845
Bon
d an
d In
tere
st F
und
212,
729,
169
209,
147,
064
190,
760,
412
187,
080,
716
193,
532,
419
186,
227,
827
185,
502,
992
218,
605,
568
239,
536,
046
263,
661,
333
Em
ploy
ee A
nnui
ty &
Ben
efit
Fund
120,
124,
000
127,
100,
000
141,
841,
605
138,
497,
492
147,
556,
135
150,
002,
488
137,
898,
511
130,
275,
771
132,
519,
601
154,
387,
057
Cap
ital P
roje
cts
20,2
51,8
82Su
btot
al B
&I,
Annu
ity &
Ben
efit,
and
Cap
ital
332,
853,
169
$
33
6,24
7,06
4$
332,
602,
017
$
32
5,57
8,20
8$
341,
088,
554
$
33
6,23
0,31
5$
323,
401,
503
$
34
8,88
1,33
9$
372,
055,
647
$
43
8,30
0,27
2$
Elec
tion
Fund
44,0
00,0
0019
,000
,000
43,9
50,5
9619
,000
,000
37,6
21,6
0919
,590
,774
39,8
23,5
1119
,963
,476
42,1
30,3
9021
,581
,425
Subt
otal
Ele
ctio
n Fu
nd$4
4,00
0,00
0$1
9,00
0,00
0$4
3,95
0,59
6$1
9,00
0,00
0$3
7,62
1,60
9$1
9,59
0,77
4$3
9,82
3,51
1$1
9,96
3,47
6$4
2,13
0,39
0$2
1,58
1,42
5
Bas
e Ta
x Le
vy$7
20,4
83,5
42$7
20,4
83,5
42$7
20,4
83,5
42$7
20,4
83,5
42$7
20,4
83,5
42$7
20,4
83,5
42$7
20,4
83,5
42$7
20,4
83,5
42$7
20,4
83,5
42$7
20,4
83,5
42
Exp
iring
TIF
00
00
1,40
0,00
01,
613,
406
1,90
8,47
29,
166,
938
15,6
40,8
9917
,022
,794
Ince
ntiv
es0
00
00
74,2
2827
5,50
451
8,93
169
5,66
898
2,23
8N
ew P
rope
rty0
00
00
2,78
8,48
45,
124,
677
11,3
88,9
9715
,137
,220
18,8
08,8
48Su
btot
al E
stim
ated
Val
ue o
f Exp
iring
TIF
/Ince
ntiv
es
& N
ew P
rope
rty
-$
-$
-$
-$
1,40
0,00
0$
4,
476,
118
$
7,30
8,65
3$
21
,074
,866
$
31
,473
,787
$
36
,813
,880
$
Bas
e Ta
x Le
vy p
lus
Estim
ated
Val
ue o
f Exp
iring
TI
F/In
cent
ives
& N
ew P
rope
rty
720,
483,
542
$
72
0,48
3,54
2$
720,
483,
542
$
72
0,48
3,54
2$
721,
883,
542
$
$7
24,9
59,6
60$7
27,7
92,1
95$7
41,5
58,4
08$7
51,9
57,3
29$7
57,2
97,4
22
$-
$10
0
$20
0
$30
0
$40
0
$50
0
$60
0
$70
0
$80
0
2008
2009
2010
2011
2012
2013
2014
2015
2016
2017
Millions
Tax
Levy
Gen
eral
Fun
d &
Hea
lth E
nter
pris
e Fu
ndB
ond
and
Inte
rest
, Ann
uity
Ben
efit,
& C
apita
lEl
ectio
n

VOLUME 1 FY2017 REVENUE
53
Base Tax Levy
Estimated Value of Expiring
TIF/Incentive & New Property
Previous Years
Estimated Value of Expiring
TIF/Incentive, New Property Current
Year Gross Tax Levy
Appropriation Allowance for
Uncollected TaxesNet Tax Levy For
Appropriation
Corporate Purpose Fund $ 17,329,992 $ 757,048 $ 128,447 $ 18,215,487 $ (546,465) $ 17,669,022
Public Safety Fund $ 157,093,889 $ 6,862,530 $ 1,164,351 $ 165,120,770 $ (4,953,623) $ 160,167,147
Sub Total General Fund $ 174,423,881 $ 7,619,577 $ 1,292,798 $ 183,336,257 $ (5,500,088) $ 177,836,169
Health Enterprise Fund $ 86,177,964 $ 3,764,620 $ 638,735 $ 90,581,320 $ (2,717,440) $ 87,863,880
Election Fund $ 21,581,425 $ 942,768 $ 159,958 $ 22,684,151 $ (680,525) $ 22,003,627
Capital Projects $ 20,251,882 $ 884,688 $ 150,103 $ 21,286,674 $ (638,600) $ 20,648,073
Bond and Interest Fund $ 263,661,333 $ 11,517,849 $ 1,954,210 $ 277,133,392 $ - $ 277,133,392
Employee Annuity & Benefit Fund $ 154,387,057 $ 6,744,284 $ 1,144,289 $ 162,275,629 $ - $ 162,275,629
Total All Funds $ 720,483,542 $ 31,473,787 $ 5,340,093 $ 757,297,422 $ (9,536,652) $ 747,760,770
FY 2017 Tax Levy
Year Chicago Outside Chicago Total Cook County2015 70,963,288,968$ 61,751,561,451$ 132,714,850,419$ 2014 64,908,056,690 63,302,490,501 128,210,547,191 2013 62,363,875,664 63,550,963,278 125,914,838,942 2012 65,250,387,267 70,925,637,060 136,176,024,327 2011 75,122,913,910 76,946,137,806 152,069,051,716 2010 82,087,170,063 88,317,443,227 170,404,613,290 2009 84,586,807,689 93,483,786,583 178,070,594,272 2008 80,977,543,020 92,664,404,974 173,641,947,994 2007 73,645,316,037 85,621,597,612 159,266,913,649 2006 69,511,192,285 74,833,590,915 144,344,783,200 2005 59,304,530,189 74,067,183,541 133,371,713,730 2004 55,276,929,775 66,285,171,636 121,562,101,411 2003 53,168,632,414 59,332,812,042 112,501,444,456 2002 45,330,892,358 59,754,320,644 105,085,213,002 2001 41,981,912,323 52,927,743,804 94,909,656,127
Source: Cook County Clerk, Tax Extension Division.
Cook County, IllinoisEqualized Assessed Valuation
$-
$20,000
$40,000
$60,000
$80,000
$100,000
$120,000
$140,000
$160,000
$180,000
$200,000
2001 2002 2003 2004 2005 2006 2007 2008 2009 2010 2011 2012 2013 2014 2015
Mill
ions
Chicago Outside Chicago Total Cook County
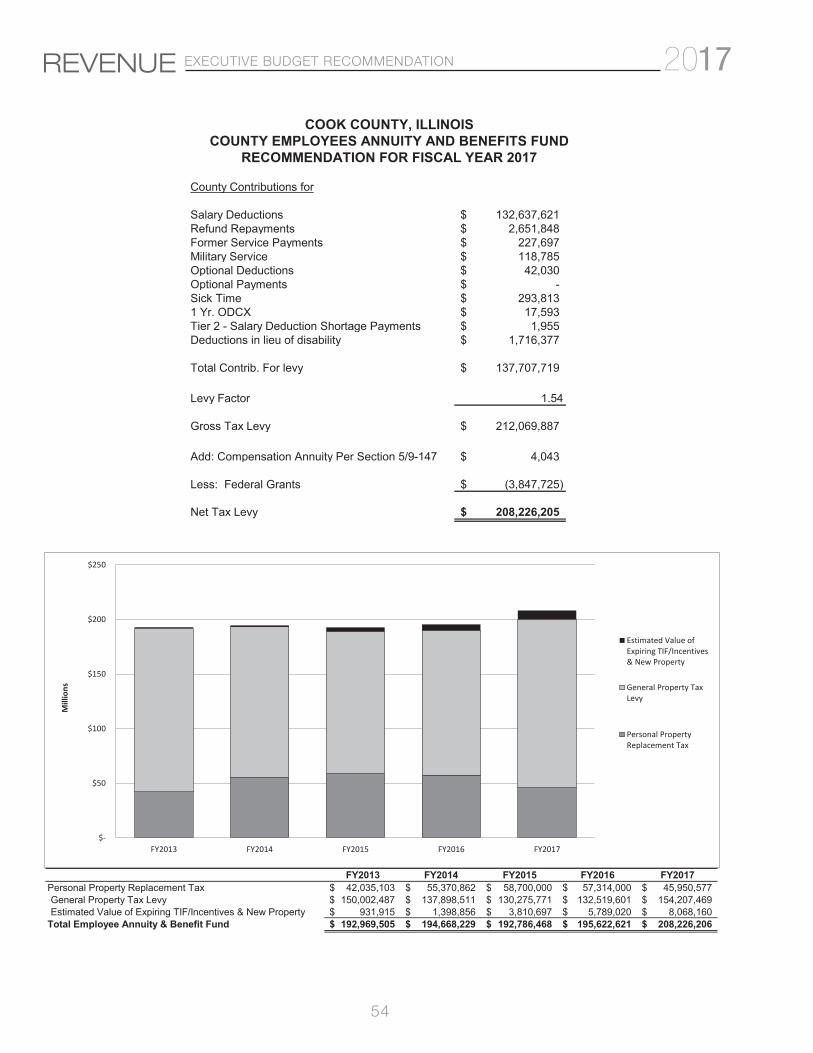
REVENUE EXECUTIVE BUDGET RECOMMENDATION
54
County Contributions for
Salary Deductions 132,637,621$ Refund Repayments 2,651,848$ Former Service Payments 227,697$ Military Service 118,785$ Optional Deductions 42,030$ Optional Payments -$ Sick Time 293,813$ 1 Yr. ODCX 17,593$ Tier 2 - Salary Deduction Shortage Payments 1,955$ Deductions in lieu of disability 1,716,377$
Total Contrib. For levy 137,707,719$
Levy Factor 1.54
Gross Tax Levy 212,069,887$
Add: Compensation Annuity Per Section 5/9-147 4,043$
Less: Federal Grants (3,847,725)$
Net Tax Levy 208,226,205$
COOK COUNTY, ILLINOISCOUNTY EMPLOYEES ANNUITY AND BENEFITS FUND
RECOMMENDATION FOR FISCAL YEAR 2017
FY2013 FY2014 FY2015 FY2016 FY2017Personal Property Replacement Tax 42,035,103$ 55,370,862$ 58,700,000$ 57,314,000$ 45,950,577$ General Property Tax Levy 150,002,487$ 137,898,511$ 130,275,771$ 132,519,601$ 154,207,469$ Estimated Value of Expiring TIF/Incentives & New Property 931,915$ 1,398,856$ 3,810,697$ 5,789,020$ 8,068,160$
Total Employee Annuity & Benefit Fund 192,969,505$ 194,668,229$ 192,786,468$ 195,622,621$ 208,226,206$
$-
$50
$100
$150
$200
$250
FY2013 FY2014 FY2015 FY2016 FY2017
Mill
ions
Estimated Value ofExpiring TIF/Incentives& New Property
General Property TaxLevy
Personal PropertyReplacement Tax
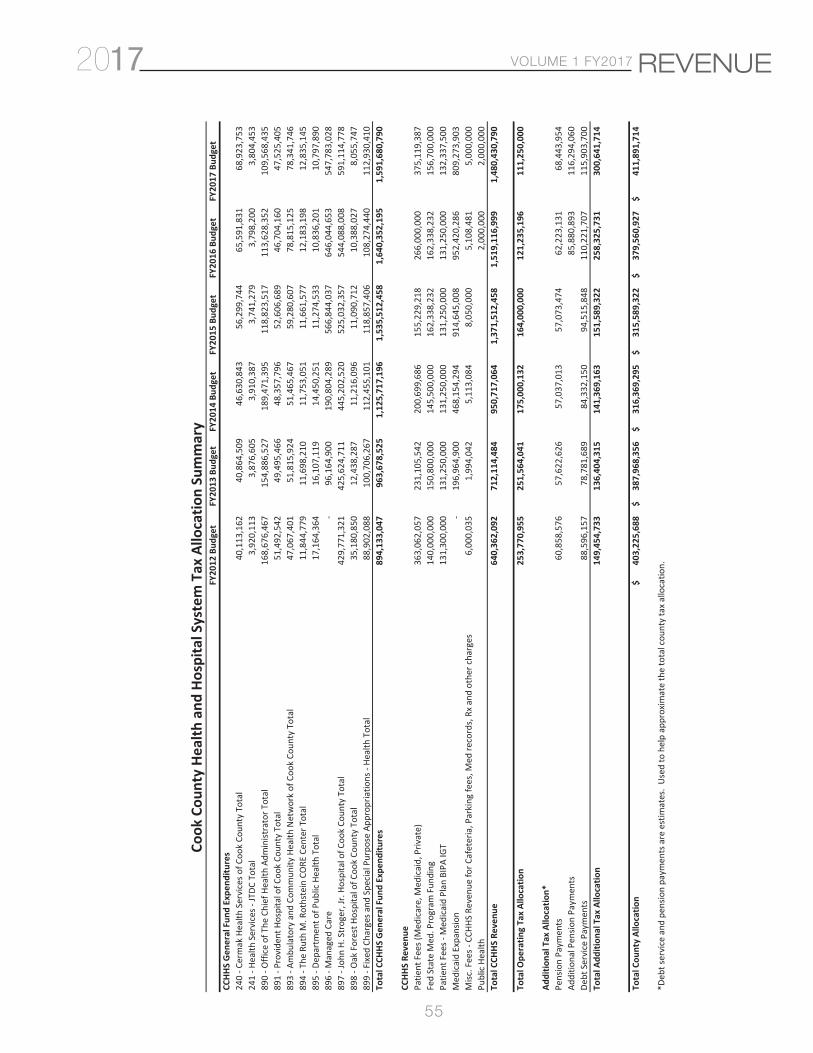
VOLUME 1 FY2017 REVENUE
55
FY20
12 B
udge
tFY
2013
Bud
get
FY20
14 B
udge
tFY
2015
Bud
get
FY20
16 B
udge
tFY
2017
Bud
get
CCHH
S Ge
nera
l Fun
d Ex
pend
iture
s24
0 - C
erm
ak H
ealth
Ser
vice
s of C
ook
Coun
ty T
otal
40,1
13,1
62
40
,864
,509
46,6
30,8
4356
,299
,744
65,5
91,8
3168
,923
,753
24
1 - H
ealth
Ser
vice
s - JT
DC T
otal
3,92
0,11
3
3,87
6,60
53,
910,
387
3,74
1,27
93,
798,
200
3,80
4,45
3
89
0 - O
ffice
of T
he C
hief
Hea
lth A
dmin
istra
tor T
otal
168,
676,
467
154,
886,
527
189,
471,
395
118,
823,
517
113,
628,
352
109,
568,
435
89
1 - P
rovi
dent
Hos
pita
l of C
ook
Coun
ty T
otal
51,4
92,5
42
49
,495
,466
48,3
57,7
9652
,606
,689
46,7
04,1
6047
,525
,405
89
3 - A
mbu
lato
ry a
nd C
omm
unity
Hea
lth N
etw
ork
of C
ook
Coun
ty T
otal
47,0
67,4
01
51
,815
,924
51,4
65,4
6759
,280
,607
78,8
15,1
2578
,341
,746
89
4 - T
he R
uth
M. R
oths
tein
CO
RE C
ente
r Tot
al11
,844
,779
11,6
98,2
10
11
,753
,051
11,6
61,5
7712
,183
,198
12,8
35,1
45
895
- Dep
artm
ent o
f Pub
lic H
ealth
Tot
al17
,164
,364
16,1
07,1
19
14
,450
,251
11,2
74,5
3310
,836
,201
10,7
97,8
90
896
- Man
aged
Car
e-
96
,164
,900
190,
804,
289
566,
844,
037
646,
044,
653
547,
783,
028
89
7 - J
ohn
H. S
trog
er, J
r. Ho
spita
l of C
ook
Coun
ty T
otal
429,
771,
321
425,
624,
711
44
5,20
2,52
052
5,03
2,35
754
4,08
8,00
859
1,11
4,77
8
898
- Oak
For
est H
ospi
tal o
f Coo
k Co
unty
Tot
al35
,180
,850
12,4
38,2
87
11
,216
,096
11,0
90,7
1210
,388
,027
8,05
5,74
7
89
9 - F
ixed
Cha
rges
and
Spe
cial
Pur
pose
App
ropr
iatio
ns -
Heal
th T
otal
88,9
02,0
88
10
0,70
6,26
711
2,45
5,10
111
8,85
7,40
610
8,27
4,44
011
2,93
0,41
0
Tota
l CCH
HS G
ener
al F
und
Expe
nditu
res
894,
133,
047
963,
678,
525
1,12
5,71
7,19
61,
535,
512,
458
1,64
0,35
2,19
51,
591,
680,
790
CCHH
S Re
venu
ePa
tient
Fee
s (M
edic
are,
Med
icai
d, P
rivat
e)36
3,06
2,05
7
23
1,10
5,54
2
200,
699,
686
15
5,22
9,21
8
266,
000,
000
37
5,11
9,38
7
Fed
Stat
e M
ed. P
rogr
am F
undi
ng14
0,00
0,00
0
15
0,80
0,00
0
145,
500,
000
16
2,33
8,23
2
162,
338,
232
15
6,70
0,00
0
Patie
nt F
ees -
Med
icai
d Pl
an B
IPA
IGT
131,
300,
000
131,
250,
000
13
1,25
0,00
0
131,
250,
000
13
1,25
0,00
0
132,
337,
500
M
edic
aid
Expa
nsio
n-
19
6,96
4,90
0
468,
154,
294
91
4,64
5,00
8
952,
420,
286
80
9,27
3,90
3
Misc
. Fee
s - C
CHHS
Rev
enue
for C
afet
eria
, Par
king
fees
, Med
reco
rds,
Rx
and
othe
r cha
rges
6,00
0,03
5
1,99
4,04
2
5,11
3,08
4
8,05
0,00
0
5,10
8,48
1
5,00
0,00
0
Pu
blic
Hea
lth2,
000,
000
2,
000,
000
Tota
l CCH
HS R
even
ue64
0,36
2,09
2
71
2,11
4,48
4
950,
717,
064
1,
371,
512,
458
1,51
9,11
6,99
9
1,
480,
430,
790
Tota
l Ope
ratin
g Ta
x Al
loca
tion
253,
770,
955
251,
564,
041
17
5,00
0,13
2
164,
000,
000
12
1,23
5,19
6
111,
250,
000
Addi
tiona
l Tax
Allo
catio
n*Pe
nsio
n Pa
ymen
ts60
,858
,576
57,6
22,6
26
57
,037
,013
57,0
73,4
74
62
,223
,131
68,4
43,9
54
Addi
tiona
l Pen
sion
Paym
ents
85,8
80,8
93
11
6,29
4,06
0
Debt
Ser
vice
Pay
men
ts88
,596
,157
78,7
81,6
89
84
,332
,150
94,5
15,8
48
11
0,22
1,70
7
115,
903,
700
To
tal A
dditi
onal
Tax
Allo
catio
n14
9,45
4,73
3
13
6,40
4,31
5
141,
369,
163
15
1,58
9,32
2
258,
325,
731
30
0,64
1,71
4
Tota
l Cou
nty
Allo
catio
n40
3,22
5,68
8$
38
7,96
8,35
6$
316,
369,
295
$
31
5,58
9,32
2$
379,
560,
927
$
41
1,89
1,71
4$
*Deb
t ser
vice
and
pen
sion
paym
ents
are
est
imat
es.
Used
to h
elp
appr
oxim
ate
the
tota
l cou
nty
tax
allo
catio
n.
Cook
Cou
nty
Heal
th a
nd H
ospi
tal S
yste
m T
ax A
lloca
tion
Sum
mar
y

REVENUE EXECUTIVE BUDGET RECOMMENDATION
56
REG
vers
ion
9/9/
2013
2013
Reve
nue
2014
Reve
nue
2015
Reve
nue
2016
Estim
ated
Re
venu
e
2017
Estim
ated
Re
venu
e
2017
/ 20
16Va
rianc
e Es
t. Re
venu
e
2017
Est
imat
ed
Expe
nditu
res /
En
cum
bran
ces
High
way
(Fun
ding
Sou
rce
Corp
orat
e Fu
nd) -
Dep
artm
ent 5
006,
390,
077
$
5,86
0,45
3$
5,
830,
891
$
5,36
8,81
5$
84
8,92
2$
(4,5
19,8
93)
$
High
way
(Cor
pora
te E
xpen
ditu
res)
848,
922
$
Mot
or F
uel T
ax F
und
(Gov
ernm
enta
l Fun
d Ty
pe)
2013
Reve
nue
2014
Reve
nue
2015
Estim
ated
Re
venu
e
2016
Estim
ated
Re
venu
e
2017
Estim
ated
Re
venu
e
2017
/ 20
16Va
rianc
e Es
t. Re
venu
eM
otor
Fue
l Tax
Fun
d(G
over
nmen
tal F
und
Type
)
2017
Est
imat
ed
Expe
nditu
res /
En
cum
bran
ces
Capi
tal E
xpen
ditu
res
Stat
e of
Illin
ois M
otor
Fue
l Tax
Allo
tmen
ts92
,237
,588
$
92
,748
,945
$
87
,734
,167
$
92
,000
,000
$
96
,000
,000
$
4,
000,
000
$
M
otor
Fue
l Tax
Allo
tmen
ts56
,890
,021
Ill
inoi
s Job
s Now
Cap
ital B
ill16
,739
,339
16
,739
,339
16
,739
,339
-
-
-
$
M
otor
Fue
l Tax
- Bo
nds
5,00
0,00
0
Fe
dera
l Rei
mbu
rsem
ents
2,50
0,00
0
7,
618,
739
2,03
1,00
0
2,
230,
000
-
(2,2
30,0
00)
$
Tota
l Cap
ital O
utla
ys61
,890
,021
Lo
cal A
genc
y Re
imbu
rsem
ents
and
Oth
ers
3,00
0,00
0
1,
778,
036
1,85
8,12
1
6,
526,
000
20,3
47,5
00
13,8
21,5
00$
N
on C
apita
l Exp
endi
ture
sTo
tal M
otor
Fue
l Tax
Rev
enue
& R
eim
burs
emen
t11
4,47
6,92
7
11
8,88
5,05
9
10
8,36
2,62
7
10
0,75
6,00
0
11
6,34
7,50
0
15
,591
,500
Fund
ing
of C
TA-
Fund
Bal
ance
(Def
icit)
15,0
00,0
00
15,0
00,0
00
30,0
00,0
00
15,0
00,0
00
15,0
00,0
00
-$
Mai
nten
ance
Cos
ts4,
986,
000
Tota
l Mot
or F
uel T
ax R
even
ue /
Sour
ces o
f Fun
ds12
9,47
6,92
7
13
3,88
5,05
9
13
8,36
2,62
7
11
5,75
6,00
0
13
1,34
7,50
0
15
,591
,500
Tota
l Non
Cap
ital O
utla
ys4,
986,
000
Tran
sfer
Out
to M
otor
Fue
l Tax
Firs
t (1s
t)(2
1,96
0,72
9)
(22,
748,
938)
(2
3,50
4,31
9)
(25,
925,
235)
(4
8,21
4,61
7)
(22,
289,
382)
$
Tran
sfer
Out
107,
516,
198
111,
136,
121
114,
858,
308
89,8
30,7
65
83,1
32,8
83
(6,6
97,8
82)
Fund
ing
of P
ublic
Saf
ety
- Cou
rts
-
De
bt S
ervi
ce
6,25
6,86
2
Tr
ansf
er In
- M
otor
Fue
l Tax
- Bo
nds
25,0
00,0
00
35,0
00,0
00
10,0
00,0
00
-
5,00
0,00
0
5,
000,
000
$
6,
256,
862
Rese
rve
For F
utur
e O
blig
atio
ns15
,000
,000
Tota
l Net
Mot
or F
uel T
ax R
even
ue /
Sou
rces
of F
unds
132,
516,
198
$
146,
136,
121
$
124,
858,
308
$
89,8
30,7
65$
88,1
32,8
83$
(1,6
97,8
82)
$
Tota
l Mot
or F
uel T
ax88
,132
,883
$
Ex
pend
iture
s / U
ses o
f Fun
ds
2013
Reve
nue
2014
Reve
nue
2015
Estim
ated
Re
venu
e
2016
Estim
ated
Re
venu
e
2017
Estim
ated
Re
venu
e
2017
/ 20
16Va
rianc
e Es
t. Re
venu
eM
otor
Fue
l Tax
Firs
t (1s
t)(N
on -
Maj
or G
over
nmen
tal F
und)
2017
Est
imat
ed
Expe
nditu
res /
En
cum
bran
ces
Stat
e of
Illin
ois M
otor
Fue
l Tax
Allo
tmen
ts (T
rans
fer I
n)21
,960
,729
$
22
,748
,938
$
23
,504
,319
$
25
,925
,235
$
48
,214
,617
$
22
,289
,382
$
Expe
nditu
res
48,2
14,6
17$
Fund
Bal
ance
1,02
2,67
8
1,
100,
000
1,10
0,00
0
-
-
-
$
Tota
l Mot
or F
uel T
ax F
irst (
1st)
Rev
enue
/ S
ourc
es o
f Fun
ds22
,042
,862
$
23
,848
,938
$
24
,604
,319
$
25
,925
,235
$
48
,214
,617
$
22
,289
,382
$
Tota
l Mot
or F
uel T
ax F
irst (
1st)
48,2
14,6
17$
Expe
nditu
res /
Use
s of F
unds
Tow
nshi
p Ro
ads
(Non
- M
ajor
Gov
ernm
enta
l Fun
d)
2013
Reve
nue
2014
Reve
nue
2015
Estim
ated
Re
venu
e
2016
Estim
ated
Re
venu
e
2017
Estim
ated
Re
venu
e
2017
/ 20
16Va
rianc
e Es
t. Re
venu
eTo
wns
hip
Road
s(N
on -
Maj
or G
over
nmen
tal F
und)
2017
Est
imat
ed
Expe
nditu
res /
En
cum
bran
ces
Stat
e of
Illin
ois T
ax A
llotm
ents
444,
740
$
44
4,74
0$
444,
740
$
44
4,74
0$
440,
163
$
(4
,577
)$
Avai
labl
e Re
sour
ces f
or E
xpen
ditu
res
3,83
4,35
0$
Fu
nd B
alan
ce2,
933,
387
3,16
8,01
3
3,
065,
754
3,06
5,75
4
3,
834,
350
768,
596
$
Tota
l Tow
nshi
p Ro
ads R
even
ue3,
378,
127
$
3,61
2,75
3$
3,
510,
494
$
3,51
0,49
4$
4,
274,
513
$
764,
019
$
Tota
l Tow
nshi
p Ro
ads E
xpen
ditu
res /
Use
s of F
unds
3,83
4,35
0$
Estim
ated
Tra
nspo
rtat
ion/
MFT
Pro
gram
Rev
enue
/ S
ourc
es o
f Fun
ds16
4,32
7,26
4$
17
9,45
8,26
5$
15
8,80
4,01
2$
12
4,63
5,30
9$
14
1,47
0,93
5$
16
,835
,626
$
Estim
ated
Tra
nspo
rtat
ion
Prog
ram
/MFT
141,
030,
772
$
Es
timat
ed re
serv
es E
xpen
ditu
res /
Use
s of F
unds
Cook
Cou
nty,
Illin
ois
Five
Yea
r Com
paris
on o
f Est
imat
ed R
even
ue /
Sour
ces o
f Fun
dsTr
ansp
orta
tion
Prog
ram
sFi
scal
Yea
r 201
3 - 2
017
Estim
ated
Exp
endi
ture
s / E
ncum
bran
ces /
Use
s of F
unds
Tran
spor
tatio
n Pr
ogra
ms
For F
iscal
Yea
r 201
7