introduction - teachpsych.comteachpsych.com/resources/documents/otrp/resources/poker chip peo… ·...
TRANSCRIPT
POKER CHIP PEOPLE 1
Poker Chip People: Using Manipulatives in a College Level Statistics Course
Eve M. Sledjeski
Rowan University
Note: Supported by an Instructional Resource Award 2015
Author contact information:Eve M. SledjeskiAssistant Dean, College of Science and MathematicsRowan UniversityGlassboro, New Jersey 08028 [email protected]
Copyright 2016 by Eve M. Sledjeski. All rights reserved. You may reproduce multiple copies of this material for your own personal use, including use in your classes and/or sharing with individual colleagues as long as the author’s name and institution and the Office of Teaching Resources in Psychology heading or other identifying information appear on the copied document. No other permission is implied or granted to print, copy, reproduce, or distribute additional copies of this material. Anyone who wishes to produce copies for purposes other than those specified above must obtain the permission of the author(s).

POKER CHIP PEOPLE 2
Table of Contents
Introduction................................................................................................................................... 3
#1. Population vs. Sample (Sampling Techniques)........................................................................8
#2. Descriptive Statistics: Frequency Distributions and Histograms............................................10
#3. Descriptive Statistics: Central Tendency...............................................................................13
#4. Descriptive Statistics: Variability..........................................................................................14
#5. Probability and Sampling Distributions (Central Limit Theorem).........................................15
#6. Hypothesis Testing: One-Sample z test vs. One-Sample t test...............................................18
#7. Hypothesis Testing: Independent Groups t test vs. Correlated Pairs t test.............................20
#8. Hypothesis Testing: One-Way Between-Subjects Analysis of Variance (ANOVA)..............22
#9. Hypothesis Testing: One-Way Repeated-Measures ANOVA................................................24
#10. Hypothesis Testing: Two-Way Between-Subjects Analysis of Variance.............................26
#11. Hypothesis Testing: Pearson Correlation and Linear Regression.........................................27
#12. Hypothesis Testing: Chi-Square Goodness of Fit vs. Chi-Square Test of Independence.....28
Statistical Software......................................................................................................................30

POKER CHIP PEOPLE 3
Introduction
Background Information
Statistics is typically one of the most difficult courses for psychology majors to complete and
for faculty to teach (Conners, McCown, & Roskos-Ewoldsen, 1998). Research indicates that one
effective way to teach statistics is through the use of active learning strategies where students are
tasked with actively applying their knowledge (e.g., Carlson & Winquist, 2011). In fact, a
number of student-centered resources have been created to help students better learn the
statistical concepts that underlie the field (e.g., Society for the Teaching of Psychology [STP]
resources). However, many of these hands-on strategies are stand-alone activities that do not
allow students to use the same problem or dataset to examine multiple statistical concepts, or
they use objects to simulate data that do not correspond to the typical variables that psychologists
tend to study.
The use of manipulatives (physical objects used to support hands-on learning) is a
common tool used to teach math in the K-8 setting (Cain-Caston, 1996). In the education
literature, manipulatives are thought to make abstract mathematical concepts more concrete
(Cain-Caston, 1996). This same principle may also apply to the college student (Conners et al.,
1998). In fact, the use of manipulatives is becoming more popular as a way to promote active
learning in the higher education college classroom (e.g., Dunham, 2013). Several common
statistics activities use manipulatives such as dice, poker chips, candy, and coins to demonstrate
concepts such as sampling and the Central Limit Theorem. However, most of these
manipulatives vary on only one dimension (e.g., color, date) and so do not reflect the types of
data typically collected in the field of psychology.
POKER CHIP PEOPLE 4
In-Class Activities
This instructional resource consists of in-class activities using the same poker chips to
demonstrate a variety of statistical concepts that are commonly covered in psychology courses
including sampling and probability, probability and frequency distributions, descriptive statistics
(i.e., frequency distributions, central tendency, variability), and inferential statistics (i.e., z test, t
tests, Analysis of Variance, correlation, linear regression, and chi-square). These activities
provide students with the ability to simulate real world data collection and subsequent statistical
analyses using a very concrete and fun hands-on approach. This resource includes 12 activities
using one population of Poker Chip People (N = 100). These activities can be easily completed
through instructor demonstration or in small groups with each group having its own set of poker
chip people.
Poker Chips and Labels
In order to simulate real people, these Poker Chip People differ on five variables: color
(white, red, blue, green), gender (male, female), level of happiness (1-7), age (18-65), and
income ($, $$, $$$, $$$$). The instructor will need to purchase 1.5 in. (2.54 cm) poker chips
that come in at least four colors. This teaching resource is based on white, red, blue, and green
poker chips.
The instructor will need to purchase 1 in. (2.54 cm) round labels (e.g., Avery®
Removable Round Labels 6450) to place the additional four variables onto the front and back of
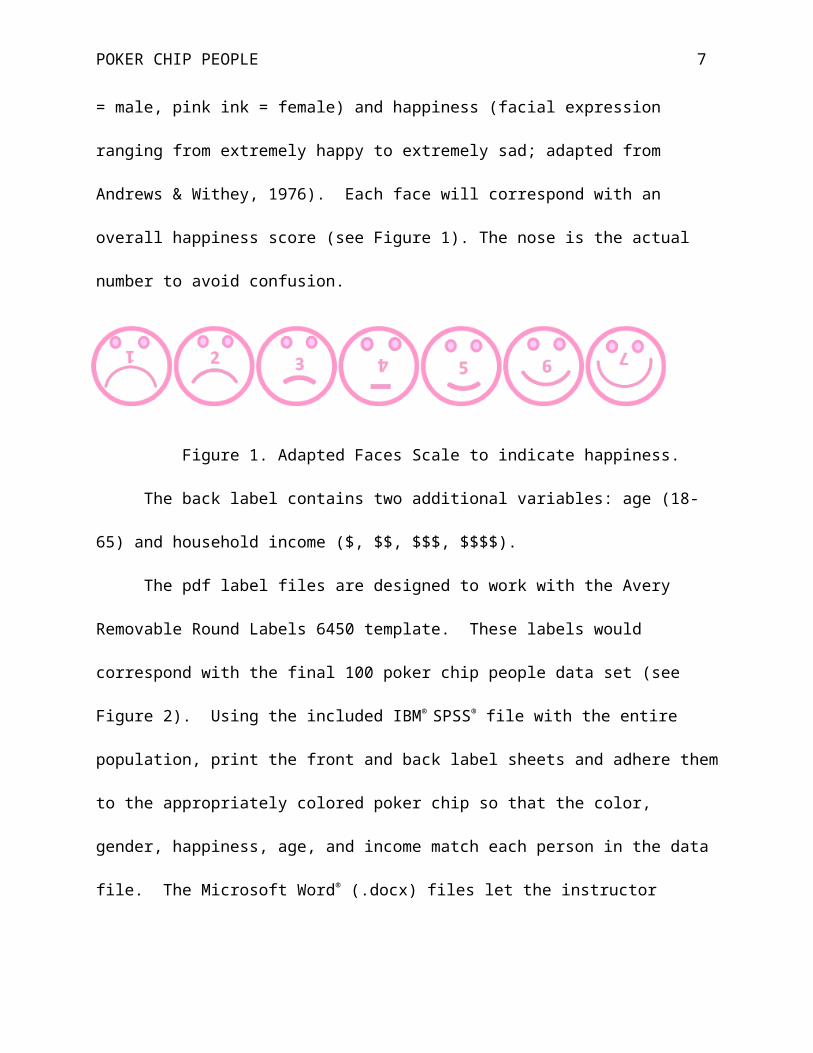
the poker chips. The front label indicates two variables: gender (blue ink = male, pink ink =
female) and happiness (facial expression ranging from extremely happy to extremely sad;
POKER CHIP PEOPLE 5
adapted from Andrews & Withey, 1976). Each face will correspond with an overall happiness
score (see Figure 1). The nose is the actual number to avoid confusion.
Figure 1. Adapted Faces Scale to indicate happiness.
The back label contains two additional variables: age (18-65) and household income ($, $
$, $$$, $$$$).
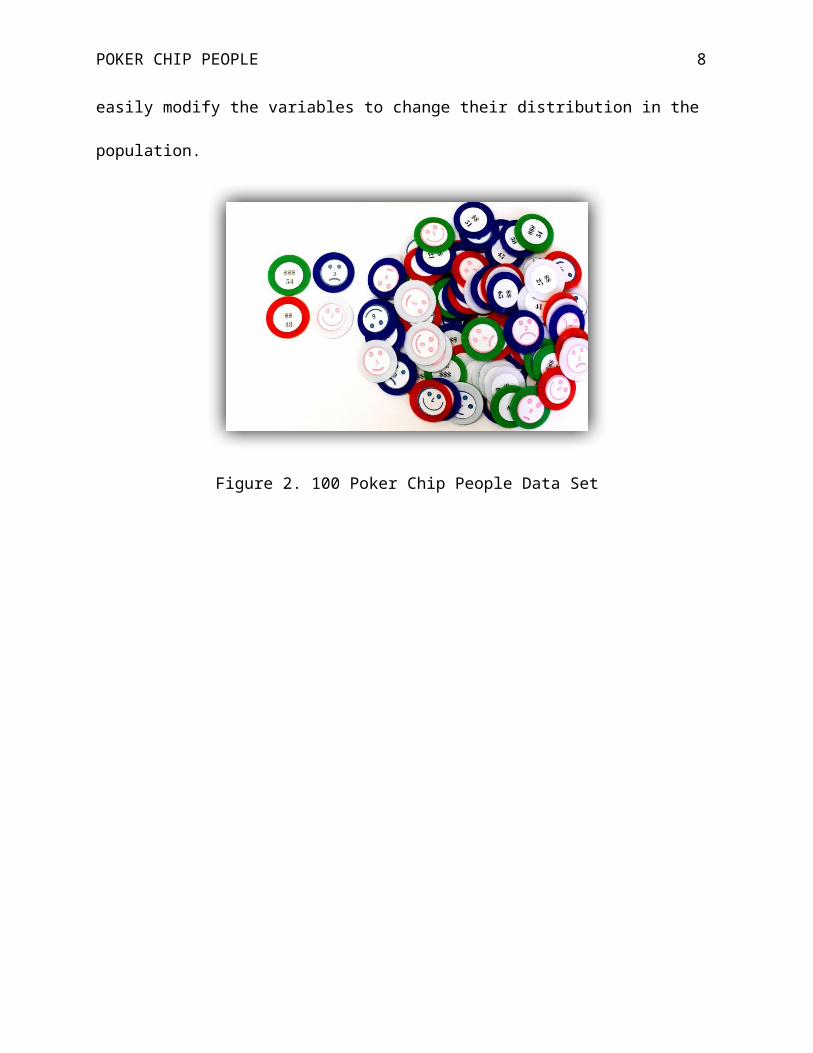
The pdf label files are designed to work with the Avery Removable Round Labels 6450
template. These labels would correspond with the final 100 poker chip people data set (see
Figure 2). Using the included IBM® SPSS® file with the entire population, print the front and
back label sheets and adhere them to the appropriately colored poker chip so that the color,
gender, happiness, age, and income match each person in the data file. The Microsoft Word®
(.docx) files let the instructor easily modify the variables to change their distribution in the
population.
Figure 2. 100 Poker Chip People Data Set

POKER CHIP PEOPLE 6
Excel and SPSS Data Files
A Microsoft Excel® file and an SPSS file of the final dataset of 100 Poker Chip People
are included for the instructor’s use. The data file consists of the following variables that
correspond to the printed labels for the poker chips: chip color (red, blue, white, green), age (18-
65), gender (male, female), happiness (range 1-7), and income ($, $$, $$$, $$$$). Instructors
should have their students create these files with their poker chips to provide practice with data
input and manipulation using statistical software.
Final Notes
Four of the variables are either nominal (gender, color) or ordinal (happiness, income)
due to the difficulty in identifying appropriate interval and ratio variables that would easily fit on
a poker chip. Thus, these four variables do not meet the assumptions of parametric statistical
tests; however, this resource presents the opportunity for students to compare and contrast a
parametric with its nonparametric equivalent. These activities are designed to be a fun way to
help students practice their statistical calculations -- especially because students can keep
generating new datasets by repeatedly picking different poker chips of different sample sizes.
Instructors could consider adding new variables such as body mass index or IQ or, as suggested
by an anonymous reviewer, use Popsicle sticks as a more cost-effective alternative to poker chips
and labels.
POKER CHIP PEOPLE 7
References
Andrews, F. M., & Withey, S. B. (1976). Social indicators of well-being: Americans'
perceptions of life quality. New York, NY: Plenum Press.
Cain-Caston, M. (1996). Manipulative queen. Journal of Instructional Psychology, 23, 270-274.
Carlson, K. A., & Winquist, J. R. (2011). Evaluating an active learning approach to teaching
introductory statistics: A classroom workbook approach. Journal of Statistics Education,
19 (1), 1-22.
Conners, F. A., McCown, S. M., & Roskos-Ewoldsen, B. (1998). Unique challenges in teaching
undergraduate statistics. Teaching of Psychology, 25, 40-42. http://dx.doi.org/
10.1207/s15328023top2501_12
Dunham, P. (2013). Food for (mathematical) thought. PRIMUS, 23, 659-670.
http://dx.doi.org/ 10.1080/10511970.2012.748113
POKER CHIP PEOPLE 8
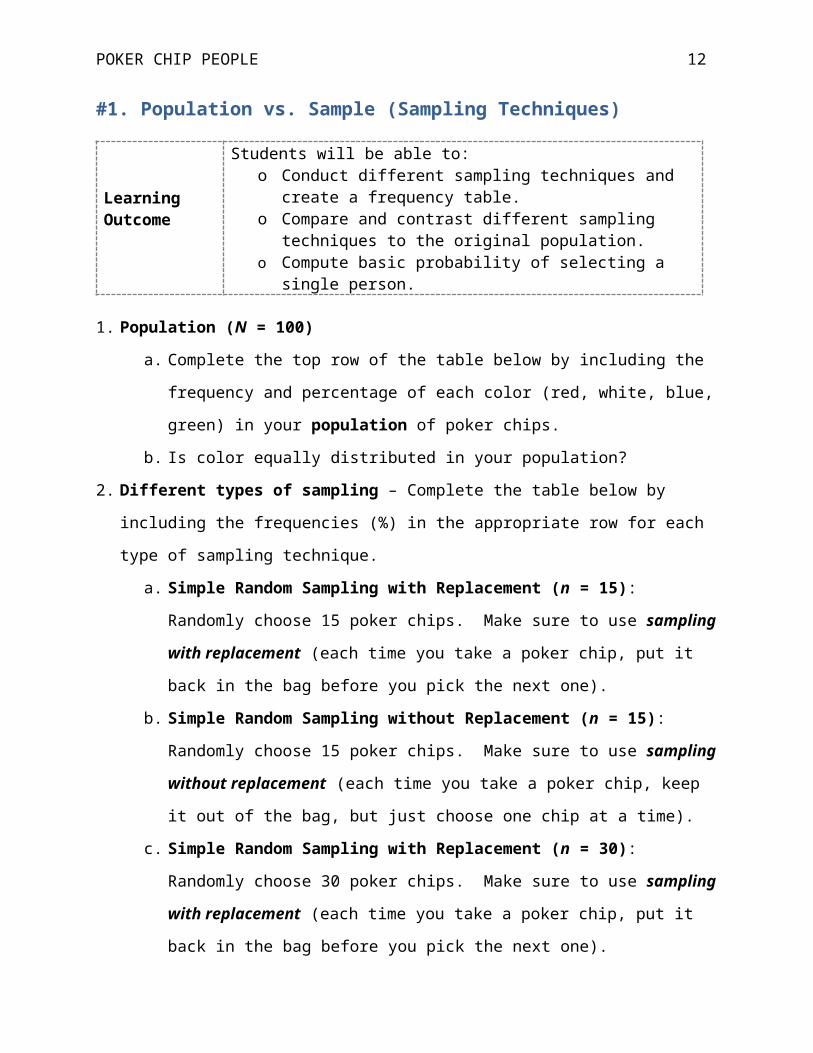
#1. Population vs. Sample (Sampling Techniques)
Learning Outcome
Students will be able to:o Conduct different sampling techniques and create a frequency
table.o Compare and contrast different sampling techniques to the
original population. o Compute basic probability of selecting a single person.
1. Population (N = 100)
a. Complete the top row of the table below by including the frequency and percentage of
each color (red, white, blue, green) in your population of poker chips.
b. Is color equally distributed in your population?
2. Different types of sampling – Complete the table below by including the frequencies (%) in
the appropriate row for each type of sampling technique.
a. Simple Random Sampling with Replacement (n = 15): Randomly choose 15 poker
chips. Make sure to use sampling with replacement (each time you take a poker
chip, put it back in the bag before you pick the next one).
b. Simple Random Sampling without Replacement (n = 15): Randomly choose 15
poker chips. Make sure to use sampling without replacement (each time you take a
poker chip, keep it out of the bag, but just choose one chip at a time).
c. Simple Random Sampling with Replacement (n = 30): Randomly choose 30 poker
chips. Make sure to use sampling with replacement (each time you take a poker
chip, put it back in the bag before you pick the next one).
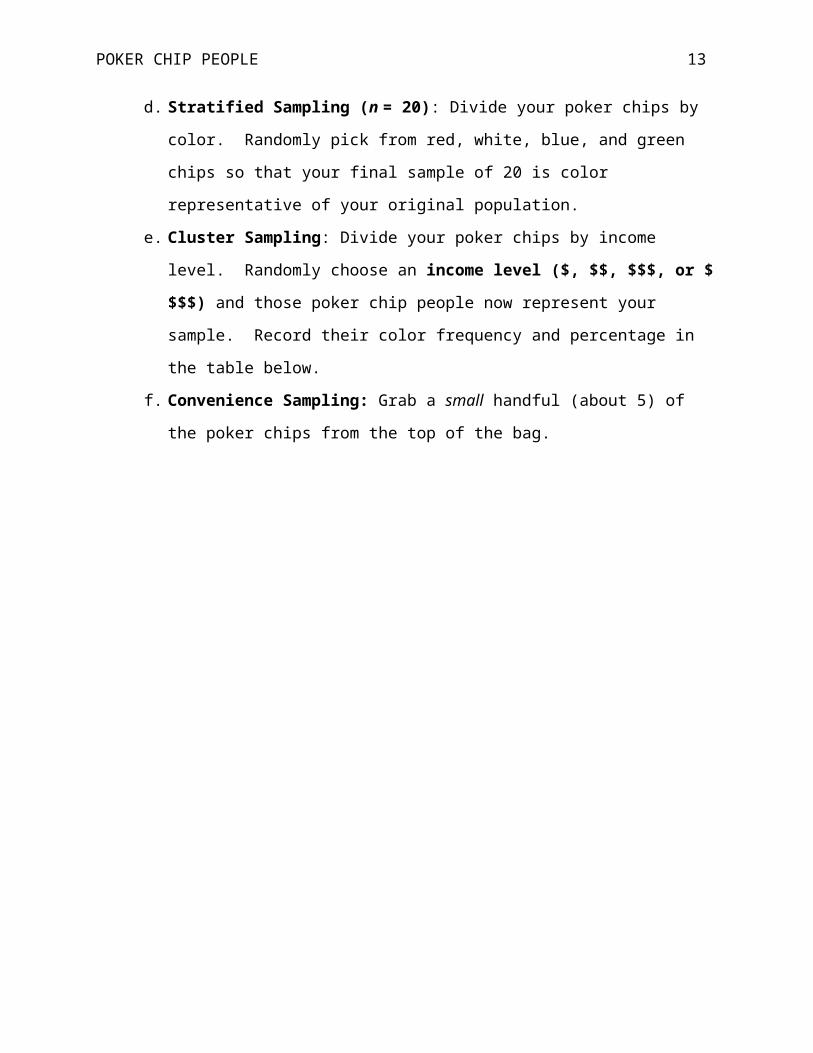
d. Stratified Sampling (n = 20): Divide your poker chips by color. Randomly pick
from red, white, blue, and green chips so that your final sample of 20 is color
representative of your original population.
e. Cluster Sampling: Divide your poker chips by income level. Randomly choose an
income level ($, $$, $$$, or $$$$) and those poker chip people now represent your
sample. Record their color frequency and percentage in the table below.
f. Convenience Sampling: Grab a small handful (about 5) of the poker chips from the
top of the bag.
POKER CHIP PEOPLE 9
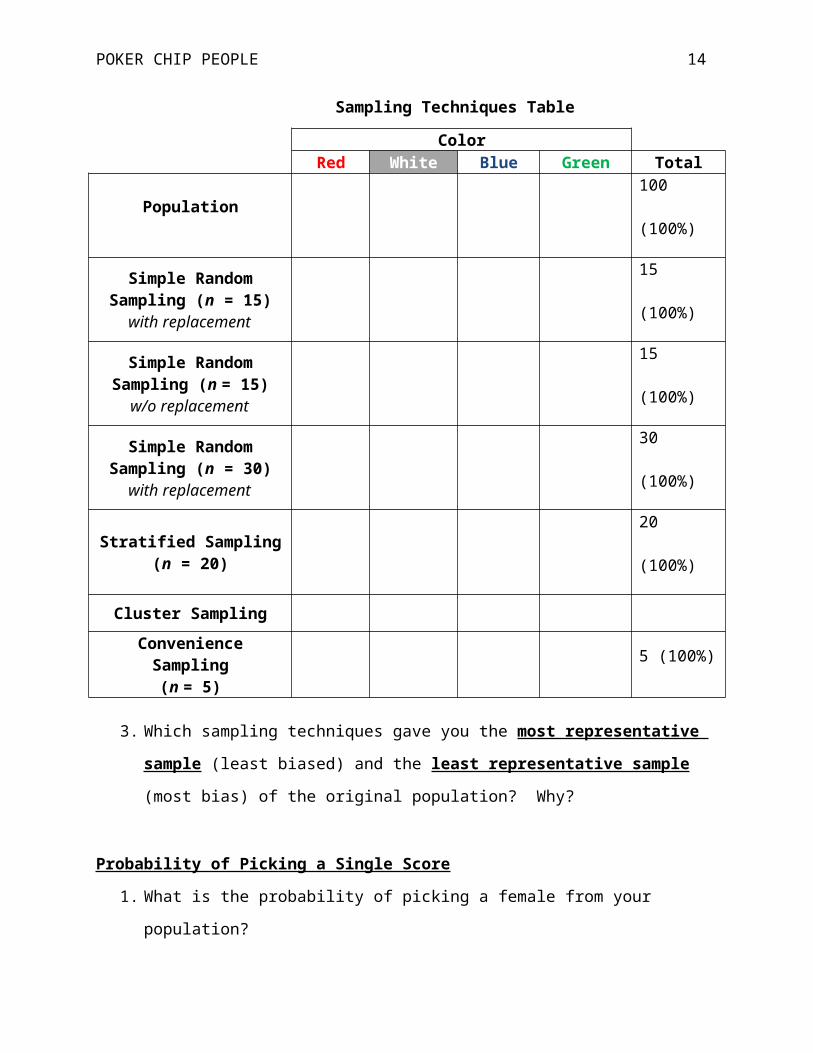
Sampling Techniques Table
ColorRed White Blue Green Total
Population 100 (100%)
Simple Random Sampling (n = 15)
with replacement
15 (100%)
Simple Random Sampling (n = 15)
w/o replacement
15 (100%)
Simple Random Sampling (n = 30)
with replacement
30 (100%)
Stratified Sampling (n = 20)
20 (100%)
Cluster Sampling
Convenience Sampling (n = 5)
5 (100%)
3. Which sampling techniques gave you the most representative sample (least biased) and
the least representative sample (most bias) of the original population? Why?
Probability of Picking a Single Score
1. What is the probability of picking a female from your population?
2. What is the probability of picking a person with a happiness rating of 4 from your
population?
3. What is the probability of picking a person between the ages of 20-25 from your
population?
Additional Practice:
1. Repeat this activity, but instead use gender or income as your variable of interest.
Practice calculating the probability of picking a single person from your samples. How does that
probability compare to the probability of picking that same person from the entire population?
Please note this activity is based on “Sampling Techniques-An Activity with Poker Chips”
distributed by Donna Gorton (Butler County Community College).

POKER CHIP PEOPLE 10
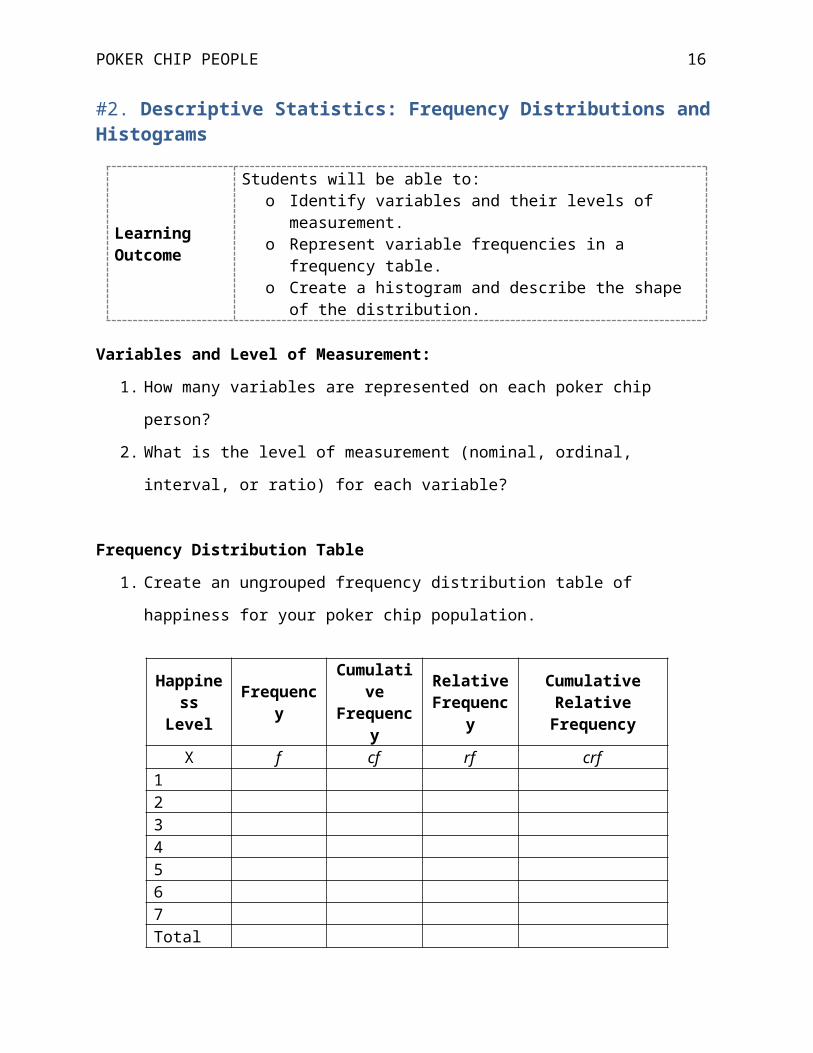
#2. Descriptive Statistics: Frequency Distributions and Histograms
Learning Outcome
Students will be able to:o Identify variables and their levels of measurement.o Represent variable frequencies in a frequency table.o Create a histogram and describe the shape of the distribution.
Variables and Level of Measurement:
1. How many variables are represented on each poker chip person?
2. What is the level of measurement (nominal, ordinal, interval, or ratio) for each variable?
Frequency Distribution Table
1. Create an ungrouped frequency distribution table of happiness for your poker chip
population.
Happiness Level Frequency Cumulative
FrequencyRelative
FrequencyCumulative
Relative FrequencyX f cf rf crf
1234567Total
What happiness level is the most common?
POKER CHIP PEOPLE 11
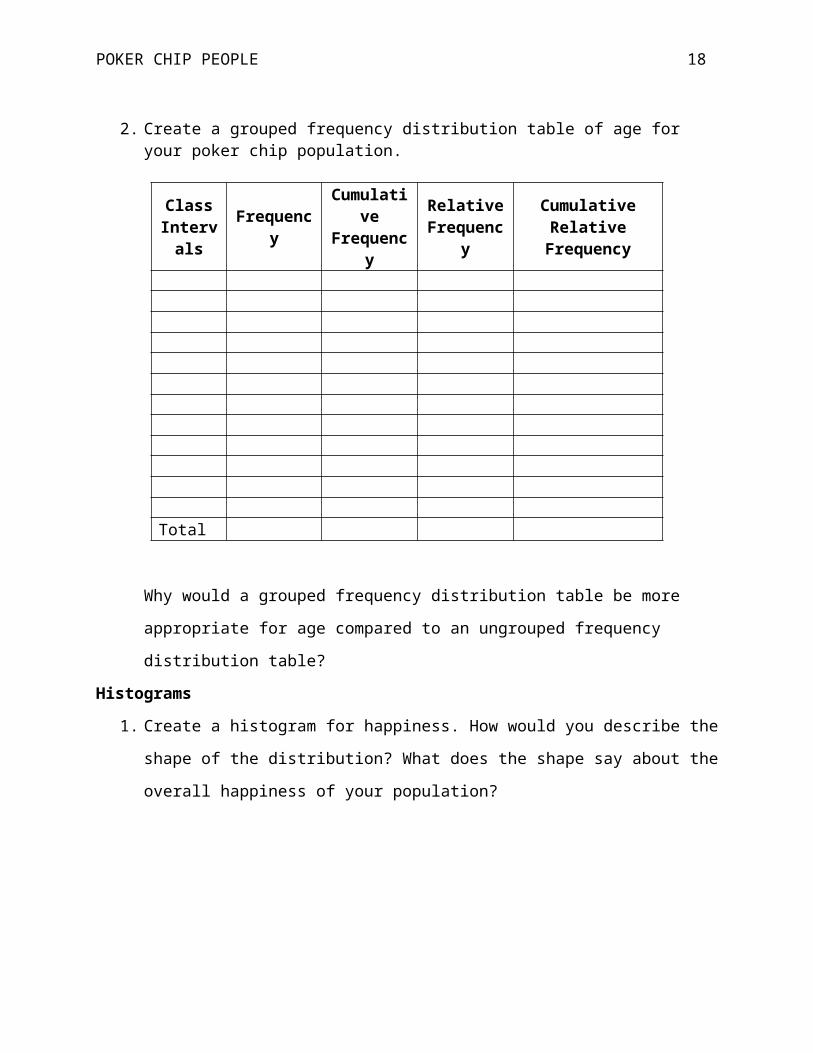
2. Create a grouped frequency distribution table of age for your poker chip population.
Class Interval
sFrequency Cumulative
FrequencyRelative
FrequencyCumulative
Relative Frequency
Total
Why would a grouped frequency distribution table be more appropriate for age compared
to an ungrouped frequency distribution table?
Histograms
1. Create a histogram for happiness. How would you describe the shape of the distribution?
What does the shape say about the overall happiness of your population?
POKER CHIP PEOPLE 12
1 2 3 4 5 6 702468
1012141618202224
Happiness
Happiness Level
Freq
uenc
y
2. Create a histogram for age based on the grouped frequency distribution. How would you
describe the shape of the distribution? What does the shape say about the overall age of
your population?
Other Visual Representations of Data
1. Visually represent the proportion of males and females in your population. Are males
and females equally distributed?
2. Visually represent the color of your population. Is one color more common than the
others?
Additional Practice for students:
1. Create a frequency distribution for color, gender, and income. How would you describe
the population based on these distributions?
2. Besides using histograms, how else could you “visualize” the data?
Additional Ideas for Instructors:
1. Have students visualize the data in as many ways as possible. Some examples may
include: stem-and-leaf plots, pie charts, bar graphs, and dot plots.
POKER CHIP PEOPLE 13
#3. Descriptive Statistics: Central Tendency
Learning Outcome
Students will be able to:o Calculate the mean, median, and mode.o Compare and contrast central tendency of a sample to the
original population.o Identify the best measure of central tendency given level of
measurement.
1. Calculate the mean, median, and mode for happiness for your population of poker chip
people.
a. Which measure is the “best”? Why?
b. In words, how would you describe the happiness level of your population?
2. A researcher believes that males are happier than females. Based on measures of central
tendency, would you agree?
3. Choose a sample of 20 poker chip people (use any sampling method).
a. Recalculate the mean, median, and mode for happiness.
b. How do these values compare to the population values?
4. What is the average age of the poker chip population?
a. Suppose that an 85 year-old person joins your population. What happens to the
average age? What happens to the median age?
Additional practice:
1. What is the best measure of central tendency to report for gender, color, and income for
your population of poker chip people?
2. Choose samples of varying sizes and calculate central tendency for happiness. Compare
and contrast these measures to the central tendency of the entire population. Are the
larger samples more representative of the population?
POKER CHIP PEOPLE 14
#4. Descriptive Statistics: Variability
Learning Outcome
Students will be able to:o Calculate the variance and standard variation for a
population and sample. o Explain the difference between population and sample
variance.
Variability of Happiness Levels
1. Calculate the range, variance, and standard deviation of happiness scores for your
population of poker chip people.
2. Calculate the range, variance, and standard deviation for a sample of 25 poker chip
people.
a. How and why do the calculations for variance and standard deviation differ from
the population formula?
b. How do your measures of variability for your sample compare to the true
population?
Variability of Age
1. Calculate the range, variance, and standard deviation of age for your population of poker
chip people.
2. Calculate the range, variance, and standard deviation for a sample of 10 poker chip
people.
a. How do your measures of variability for your sample compare to the true
population?

POKER CHIP PEOPLE 15
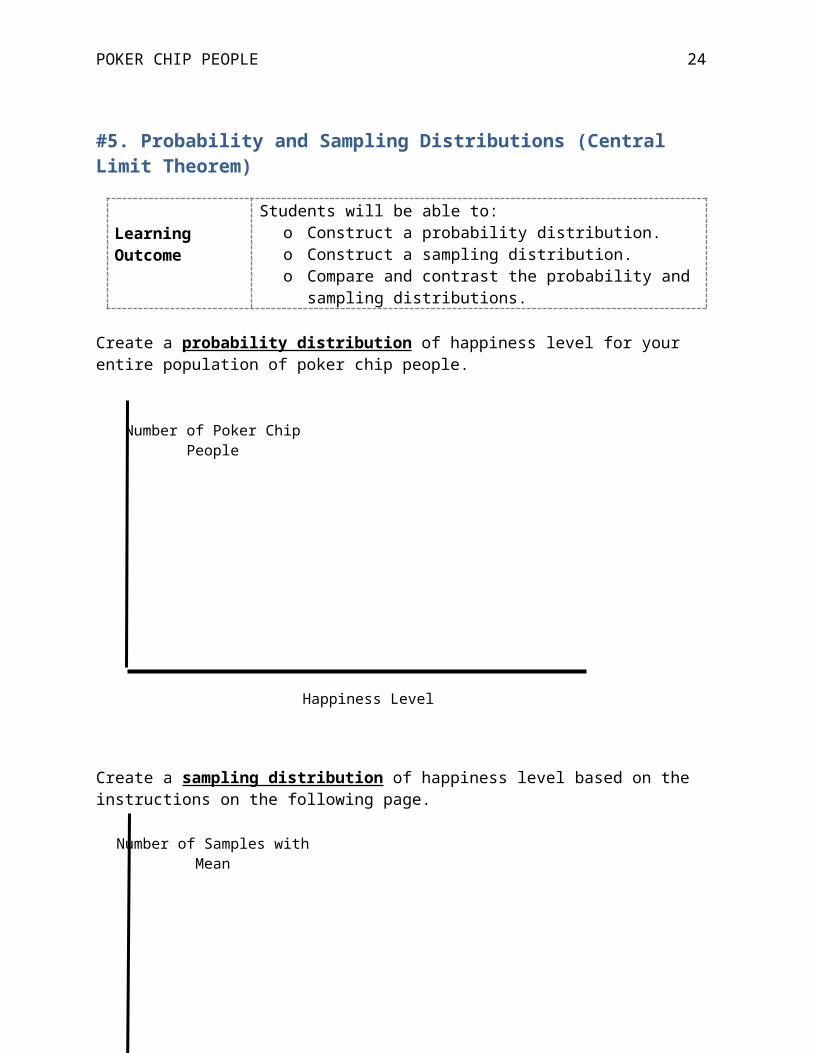
#5. Probability and Sampling Distributions (Central Limit Theorem)
Learning Outcome
Students will be able to:o Construct a probability distribution.o Construct a sampling distribution. o Compare and contrast the probability and sampling
distributions.
Create a probability distribution of happiness level for your entire population of poker chip people.
Create a sampling distribution of happiness level based on the instructions on the following page.
Happiness Level
Number of Poker Chip People
Mean Happiness Level
Number of Samples with Mean
POKER CHIP PEOPLE 16
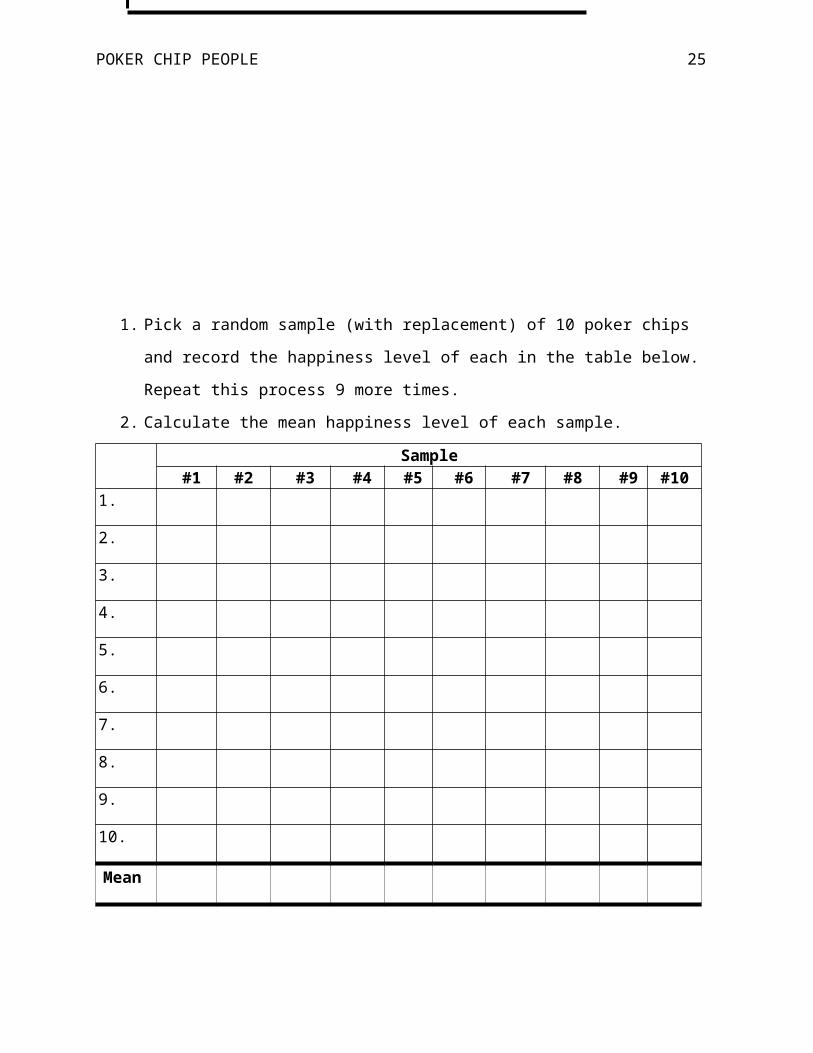
1. Pick a random sample (with replacement) of 10 poker chips and record the happiness
level of each in the table below. Repeat this process 9 more times.
2. Calculate the mean happiness level of each sample.
Sample #1 #2 #3 #4 #5 #6 #7 #8 #9 #10
1.
2.
3.
4.
5.
6.
7.
8.
9.
10.
Mean
1. Plot your 10 sample means on a histogram. This histogram is called a Sampling
Distribution.
2. How does the shape of the sampling distribution compare to your probability
distribution? What shape would you expect if you took an infinite number of samples?
3. Calculate the mean of your sample means? How does it compare to the population
mean? Is it closer to the population mean than each individual sample mean?
Additional Ideas for Instructors

POKER CHIP PEOPLE 17
1. Incorporate a discussion of the Central Limit Theorem and how sampling distributions
will be normally distributed (depending on sample size, etc.) even though the probability
distribution may not be normally distributed.
POKER CHIP PEOPLE 18
#6. Hypothesis Testing: One-Sample z test vs. One-Sample t test
Learning Outcome
Students will be able to:o Compute a one-sample z test.o Compute a one-sample t test.o Compare and contrast the one-sample z test and t test.
Assume that the happiness level of your population is normally distributed with an average of
4.45 and standard deviation of 1.76.
1. Are blue people significantly happier than the general population?
a. Choose a random sample of 12 blue poker chips to answer this question using a
one-sample z test.
b. What if you didn’t know the population standard deviation (σ)? Using the same
sample from above, conduct a one-sample t test to answer the question.
c. Compare and contrast your results from the z test and the t test.
2. Are females happier than the general population?
a. Choose a random sample of 10 female poker chips to answer this question using a
one-sample z test.
b. What if you didn’t know the population standard deviation (σ)? Using the same
sample from above, conduct a one-sample t test to answer the question.
c. Compare and contrast your results from the z test and the t test.
3. Are individuals in the lowest income bracket ($) sadder than the general population?
a. Choose a random sample of 5 poker chips in the lowest income bracket ($) to
answer this question using a one-sample z test.
b. What if you didn’t know the population standard deviation (σ)? Using the same
sample from above, conduct a one-sample t test to answer the question.
c. Compare and contrast your results from the z test and the t test.
Additional Ideas for Instructors

POKER CHIP PEOPLE 19
1. Have students conduct the activity using different sampling methods (e.g., with and
without replacement, convenient, clustered) or different sample sizes and compare their
answers.
a. How do different sampling techniques affect the results?
b. How does the size of the sample affect the results?
2. Have students conduct the inferential tests as both one-tailed and two-tailed tests.
a. Do the results change?
b. How does a one-tailed or two-tailed test change the way an inferential test is
conducted?
3. Given that happiness level is an ordinal variable, have students conduct a Wilcoxon one-
sample Signed-Rank test (nonparametric equivalent of a one-sample t test). How do the
results compare to the one-sample t test?
POKER CHIP PEOPLE 20
#7. Hypothesis Testing: Independent Groups t test vs. Correlated Pairs t test
Learning Outcome
Students will be able to:o Calculate and interpret an independent groups t test. o Calculate and interpret a correlated pairs t test.o Create a bar graph of their findings.
Answer the following questions using the appropriate t test.
1. Are men happier than women?
a. Pick a sample of 16 poker chip people to determine whether men are significantly
happier than women. Conduct an independent groups t test to answer this
question.
i. Note: With random sampling you may not get equal groups of males and
females! What do you do if your groups are unequal? What type of
sampling could you use to ensure that your groups are equal sizes?
b. Create a bar graph of your results with gender on the x axis and mean happiness
on the y axis.
c. How do your results compare to the entire population of poker chip people?
Would you have drawn the same conclusion if you had access to the entire
population versus just the sample of 16?
2. Are husbands happier than their wives?
a. Divide your population into males and females. For every male that you choose
match him with a female. The male and female pair will represent the husband
and wife in the pair. Conduct a correlated pairs t test to answer this question.
b. Create a bar graph of your results with gender on the x axis and mean happiness
on the y axis.
Additional Practice:
1. Are individuals in a higher income bracket happier than those in a lower income bracket?
Combine income levels into two groups ($ & $$ = lower income; $$$ & $$$$ = higher
income) and choose a sample to test this question.
POKER CHIP PEOPLE 21
2. Does happiness increase after winning the Powerball for individuals with a lower
income? Choose a sample from the lower income brackets ($ & $$). Their happiness
level represents their happiness at Time 1. Generate a happiness rating for Time 2 as if
those individuals had just won the Powerball. Perform a correlated pairs t test to answer
the question.
Additional Ideas for Instructors:
1. Given that happiness level is an ordinal variable, have students conduct the
nonparametric equivalent to the independent samples t test (Wilcoxon Rank Sum test)
and the correlated pairs t test (Wilcoxon Matched-Pairs Signed-Ranks test). How do the
results compare to the t tests?

POKER CHIP PEOPLE 22
#8. Hypothesis Testing: One-Way Between-Subjects Analysis of Variance (ANOVA)
Learning Outcome
Students will be able to o Conduct and interpret a one-way between-subjects ANOVA.o Create a bar graph of their findings.o Compare their sample results to the entire population.
1. Does color affect your happiness level?
a. Pick a sample of 24 poker chip people to determine whether color is related to
happiness level. Conduct a one-way between-subjects ANOVA with post hoc test
(if appropriate) to answer this question.
Note: With random sampling you may not get equal groups of each color!
Plus, color is not equally distributed in the population. What do you do if
your groups are unequal? What type of sampling could you use to ensure
that your groups are equal sizes?
a. Create a bar graph of your results with color on the x axis and mean happiness on
the y axis.
b. How do your results compare to the entire population of poker chip people?
Would you have drawn the same conclusion if you had access to the entire
population versus just the sample of 24?
2. Is income level related to age?
a. Pick a sample of 32 poker chip people to determine whether income level is
related to age. Conduct a one-way between-subjects ANOVA with a post hoc test
(if appropriate) to answer this question.
b. Create a bar graph of your results with income on the x axis and mean age on the
y axis.
c. How do your results compare to the entire population of poker chip people?
Would you have drawn the same conclusion if you had access to the entire
population versus just the sample of 32?
Additional Practice:
POKER CHIP PEOPLE 23
1. Is income related to happiness?
2. Redo the above problems using a new sample or different sampling technique. Does
your conclusion remain the same?
3. If your conclusions above were nonsignificant, create a new data set (or change some of
your data points) to ensure a significant difference on mean happiness between your
groups.
Additional Ideas for Instructors:
1. Are males happier than females? Using the data from the independent groups t test
activity, recalculate your results using a between-subjects ANOVA. Does your
conclusion change? What is the relationship between the t value and F value?
2. Given that happiness level is an ordinal variable, have students conduct the
nonparametric equivalent to the one-way ANOVA (Kruskal-Wallis One-Way
ANOVA). How do the results compare to the parametric version?
POKER CHIP PEOPLE 24
#9. Hypothesis Testing: One-Way Repeated-Measures ANOVA
Learning Outcome
Students will be able to:o Conduct and interpret a one-way repeated-measures
ANOVA.o Create a line graph of their results.
Does happiness level increase as we age?
1. A researcher assessed happiness levels once per year for four years for 10 people.
Using a one-way repeated-measures ANOVA with post hoc tests (if appropriate),
determine if happiness increased over time.
2. Because our poker chip people have only one assessment of happiness, we’ll have to
be creative in generating a new repeated-measures dataset to answer this question.
a. One option is to pick an initial sample of 10 poker chips and record their
happiness level as Time 1. Then find a “match” for each poker chip you had
originally selected. A match could be based on the age, gender, income, or
color of the poker chip. Repeat that process three times so that you now have
four happiness ratings per poker chip person. Proceed with the hypothesis
testing.
b. If you want to ensure a certain result (i.e., significant or nonsignificant), you
can generate fake data based on your initial set of 10 poker chips. What
would a dataset look like if happiness levels did significantly increase over
time? What would a dataset look like if happiness levels did not significantly
increase over time?
3. Create a line graph of your results with time on the x axis and mean happiness on the
y axis.
Additional Ideas for Instructors:
POKER CHIP PEOPLE 25
1. Websites, Excel® tutorials, and SPSS syntax (among other options) are readily
available to generate fake or simulated data. Instead of having students generate data,
have them use one of these programs to generate data.
2. Given that happiness level is an ordinal variable, have students conduct the
nonparametric equivalent test (Friedman’s Rank Test for k Correlated Samples).
How do the results compare to the parametric version?

POKER CHIP PEOPLE 26
#10. Hypothesis Testing: Two-Way Between-Subjects Analysis of Variance
Learning Outcome
Students will be able to:o Conduct and interpret a two-way between-subjects
ANOVA.o Compare sample results to the entire population.o Create a line graph to depict the interaction term.
Is the relationship between age and happiness the same for males and females?
1. Divide the poker chips into two groups based on their age (18-40 & 41 and older). Now
randomly choose eight males and eight females from each age group to be in your sample
(n = 32). This process is to ensure equal groups. Conduct a two-way between-subjects
(ANOVA) to determine whether there is a significant interaction between age group and
gender on happiness level.
a. Create a line graph to visually depict
your interaction effect.
b. How do your sample results compare to the entire population?
Additional Practice:
Is the relationship between income and happiness the same for males and females?
Choose a sample of 30 poker chip people. Combine income levels into two groups ($ &
$$ = lower income; $$$ & $$$$ = higher income). Conduct a two-way between-subjects
Younger OlderMale Femal
eMale Female

POKER CHIP PEOPLE 27
(ANOVA) to determine whether there is a significant interaction between income bracket
and gender on happiness level.
POKER CHIP PEOPLE 28
#11. Hypothesis Testing: Pearson Correlation and Linear Regression
Learning Outcome
Students will be able to:o Conduct and interpret a Pearson correlation.o Create a scatterplot of two variables.o Conduct a linear regression and use it to predict an
outcome.
1. Do we get happier the older we get?
a. Pick a sample of 12 poker chip people to determine whether age is significantly
related to happiness. Conduct a Pearson correlation to answer this question.
b. Create a scatterplot of your results with age on the x axis and happiness on the y
axis.
c. How do your results compare to the entire population of poker chip people?
Would you have drawn the same conclusion if you had access to the entire
population versus just the sample of 12?
2. What happiness level would you predict for a person that was 47 years old?
a. Calculate the linear regression line for your sample of 12 to use for your
prediction.
b. If your Pearson correlation was not significant, what is your best prediction of
happiness for a 47 year old?
Additional Ideas for Instructors:
Because happiness level is technically an ordinal variable, have students conduct a Spearman
correlation (nonparametric equivalent) to determine if there is a significant association between
age and happiness. How do the results compare to the Pearson correlation?

POKER CHIP PEOPLE 29
#12. Hypothesis Testing: Chi-Square Goodness of Fit vs. Chi-Square Test of Independence
Learning Outcome
Students will be able to:o Conduct and interpret a Chi-Square Goodness of Fit test.o Conduct and interpret a Chi-Square Test of Independence.o Compare their sample findings to the entire population.
1. Are males and females equally distributed in your population?
a. Choose a sample of 14 poker chips and determine if there are more males or
females than would be expected if gender was equally distributed in your
population. Perform a chi-square goodness of fit test to answer this question.
b. How do your results compare to the entire poker chip population? Would you
have drawn the same conclusion if you had access to the entire population versus
just the sample of 12?
2. Recent reports concerning income distribution suggested that about 6% of people are
considered rich, 42% are considered middle class, 40% are considered working class, and
12% are considered poor.
a. Choose 26 poker chip people to determine if that income distribution holds true
for your sample. Perform a chi-square goodness of fit test to answer this question.
b. How do your results compare to the entire poker chip population? Would you
have drawn the same conclusion if you had access to the entire population versus
just the sample of 26?
Poor ($) Working Class ($$)
Middle Class ($$$)
Rich ($$$$)

POKER CHIP PEOPLE 30
3. Is gender related to income?
a. Choose a sample of 50 poker chips to determine if gender is related to income
level. Perform a chi-square test of independence to answer this question.
b. How do your results compare to the entire poker chip population? Would you
have drawn the same conclusion if you had access to the entire population versus just
the sample of 50?
Additional Practice:
1. Are there more younger than older individuals in your sample? Categorize your sample
into younger (18-49) and older (50+) categories (or any age grouping that you’d like!).
Perform a chi-square goodness of fit test to answer the question.
2. Is age related to happiness level? Using your same age brackets, divide your sample
based on their happiness level (happy = 5-7, neutral = 4, sad = 1-3). Perform a chi-cquare
test of independence to answer the question.
Poor ($) Working Class ($$)
Middle Class ($$$)
Rich ($$$$)
Male
Female
POKER CHIP PEOPLE 31
Statistical Software
If your course includes instruction using statistical software consider having students
perform all of these activities using a statistical software program as well.
1. Data Management
a. Setting up variables (naming, value labels, variable labels, etc.)
b. Entering each poker chip into the data file
c. Checking for errors
2. Importing/Exporting Data (e.g., Excel SPSS)
3. Choosing a Random Sample
4. Conducting Descriptive Statistics
a. Frequency tables
b. Central tendency
c. Variability
5. Visualizing Data
a. Bar graphs
b. Line graphs
c. Histograms
d. Scatterplots
e. Pie charts
6. Conducting Inferential Statistics
a. Parametric tests – t tests, ANOVAs, correlations, and regression
b. Nonparametric tests – chi-square
7. Using code/syntax to conduct statistical analyses
A number of textbooks, websites, and YouTube channels are devoted to teaching students how to
conduct statistical analyses in a variety of programs.