introduction - automation
TRANSCRIPT
Introduction
As the world around us becomes increasingly automated, today’s control systems are enabling engineers to accomplish more essential tasks from a singular location. The right control system can greatly enhance productivity, maintenance and ultimately overall prof-itability. That’s why Automation.com has worked with several industry leaders to compile this Control Systems ebook, designed to help you stay up-to-date on the latest advance-ments in control system technology.
Whether you work with these systems on the plant floor or are managing a factory full of automated control, this eBook will provide you with resource full of information on the latest advancements and optimization strategies in control system tech-nology to bring you to your highest productive potential.
PAG E 3Advancing Automation eBook Vol. XII
Modern Instrumentation Simplifies Maintenanceby: Endress+Hauser
Process Safety: The Road to Risk Reductionby: MAVERICK Technologies
Maximizing the Energy Efficiency of Your Enclosure Climate Control Systemby: Rittal North America
Automation of Customer Drawing Formatsby: Quantum Design
5 Smart Machine Innovations and Why You Should Care: Design Considerations for Smart Machines by: Mitsubishi Electric
Page 5
Page 11
Page 20
Page 15
Page 28
Table of Contents

Learn more about our installed base consulting capabilities: go.endress.com/us/asset-management-capabilities
PERSPECTIVE+ PERFORMANCE
You streamline and automate your processes while complying with regulations and minimizing risks.
We understand how critical it is to fi nd sustainable business process improvements in an ever-changing world.
Jon DietzMaintenance Consultant
Remain compliant and minimize risk.
“We enable you to make right maintenance management decisions. To reach your objectives, we make sure asset information is properly collected and enriched with the knowledge of our consultants.”

By: Jon DietzNational Field Service Manager Endress+Hauser
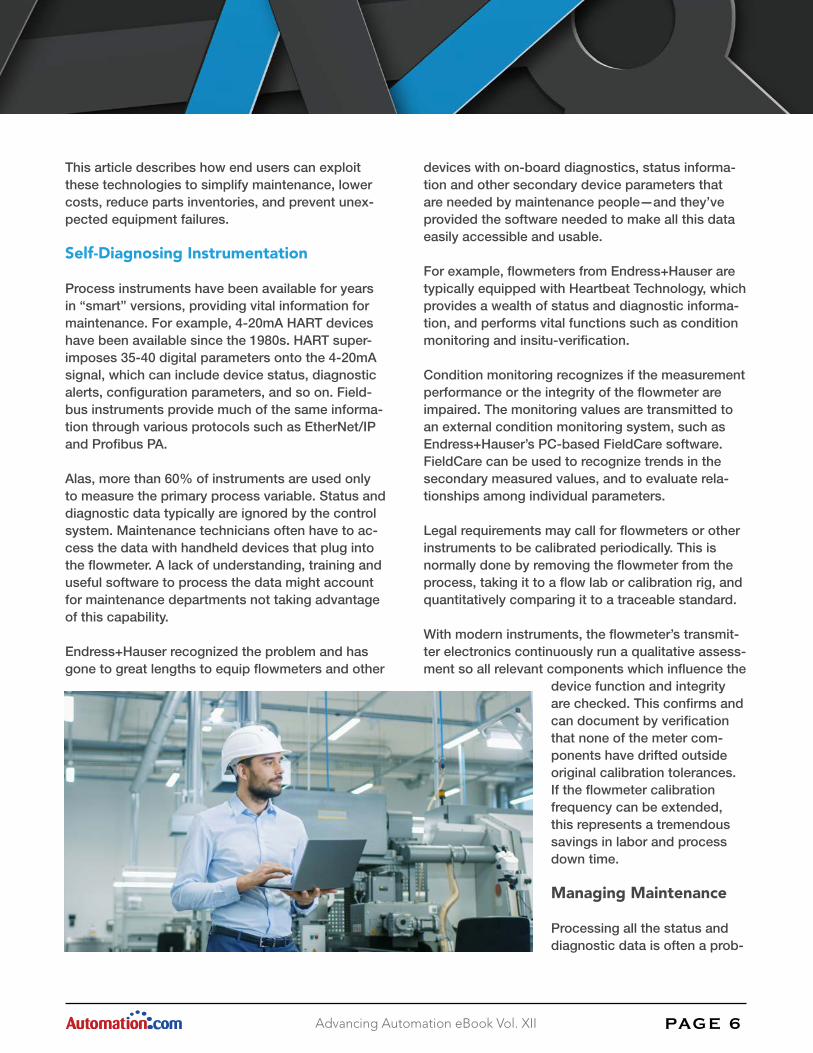
Figure 1: Modern instrumentation provides diagnostic and sta-tus information and specialty software helps the maintenance department use it for preventive maintenance.
PAG E 5Advancing Automation eBook Vol. XII
Modern instrumentation (Figure 1) and related maintenance strategies are making it much easier for process plants to perform preventive mainte-nance, eliminate process shutdowns from failed instruments, and save time and money by avoiding unnecessary maintenance activities.
Some instrument vendors now offer capabilities and services to help end users manage maintenance through on-line diagnostics, asset management, proper scheduling of maintenance tasks, and auto-matic alerts when problems come up.
Modern Instrumentation Simplifies Maintenance Hardware and software developments make preventive maintenance easier, lower costs, reduce parts inventories, and prevent unexpected equipment failures.
PAG E 6Advancing Automation eBook Vol. XII
This article describes how end users can exploit these technologies to simplify maintenance, lower costs, reduce parts inventories, and prevent unex-pected equipment failures.
Self-Diagnosing Instrumentation
Process instruments have been available for years in “smart” versions, providing vital information for maintenance. For example, 4-20mA HART devices have been available since the 1980s. HART super-imposes 35-40 digital parameters onto the 4-20mA signal, which can include device status, diagnostic alerts, configuration parameters, and so on. Field-bus instruments provide much of the same informa-tion through various protocols such as EtherNet/IP and Profibus PA.
Alas, more than 60% of instruments are used only to measure the primary process variable. Status and diagnostic data typically are ignored by the control system. Maintenance technicians often have to ac-cess the data with handheld devices that plug into the flowmeter. A lack of understanding, training and useful software to process the data might account for maintenance departments not taking advantage of this capability.
Endress+Hauser recognized the problem and has gone to great lengths to equip flowmeters and other
devices with on-board diagnostics, status informa-tion and other secondary device parameters that are needed by maintenance people—and they’ve provided the software needed to make all this data easily accessible and usable.
For example, flowmeters from Endress+Hauser are typically equipped with Heartbeat Technology, which provides a wealth of status and diagnostic informa-tion, and performs vital functions such as condition monitoring and insitu-verification.
Condition monitoring recognizes if the measurement performance or the integrity of the flowmeter are impaired. The monitoring values are transmitted to an external condition monitoring system, such as Endress+Hauser’s PC-based FieldCare software. FieldCare can be used to recognize trends in the secondary measured values, and to evaluate rela-tionships among individual parameters.
Legal requirements may call for flowmeters or other instruments to be calibrated periodically. This is normally done by removing the flowmeter from the process, taking it to a flow lab or calibration rig, and quantitatively comparing it to a traceable standard.
With modern instruments, the flowmeter’s transmit-ter electronics continuously run a qualitative assess-ment so all relevant components which influence the
device function and integrity are checked. This confirms and can document by verification that none of the meter com-ponents have drifted outside original calibration tolerances. If the flowmeter calibration frequency can be extended, this represents a tremendous savings in labor and process down time.
Managing Maintenance
Processing all the status and diagnostic data is often a prob-

Figure 2: Asset management programs provide equipment manuals, parts lists and other information to handheld devices, such as Endress+Hauser’s Field Xpert SMT70.
PAG E 7Advancing Automation eBook Vol. XII
lem. For example, a chemical plant in Gendorf, Ger-many, has more than 4,000 instruments measuring level, flow, temperature, pressure and other parame-ters. Having its control systems read all the diagnos-tic information from all 4,000 devices, analyze it for problems, and issue instructions to the maintenance department would be a daunting problem for the plant’s control system programmers. It would also burden the control system with data not relevant to its primary task, which is real-time process control.
Instead, Endress+Hauser developed software pack-ages that perform all those functions. The packages fall into two basic categories: Instrument manage-ment programs, which analyze real-time informa-tion from instrumentation; and asset management software, which keeps track of every instrument in the plant and stores vital data, such as manuals and parts lists.
Instrument management programs perform several functions to aid maintenance departments, including:
• Configuration—helps maintenance configure new instrumentation during initial installation or when replacing an existing instrument.
• Condition monitoring—as noted above, used to analyze real-time data coming from instru- mentation, look for problems, and notify the maintenance department when a device needs attention prior to failure.
• Life cycle management—tracks the entire life cycle of an instrument, from initial configuration to calibrations and repairs, and provides infor- mation for audits and safety regulations.
While a particular instrument manufacturer can pro-vide information for its own instruments, what about all the other instruments in a plant from different manufacturers? Fortunately, standardization across the instrumentation industry makes that information available.
Device Description (DD), enhanced device descrip-tion language (EDDL), Device Type Manager (DTM), and HART and fieldbus configuration files are avail-able from all manufacturers, can be accessed easily
from various web sites, and then loaded into the instrument management program.
Thus, a program like Endress+Hauser’s FieldCare software not only has information about its own instruments, it can support over a thousand process instruments and analyzers from other manufacturers.
Keeping Track
When a plant has thousands of instruments, keep-ing track of manuals, parts lists, audit reports, maintenance schedules and other information can be a nightmare. A maintenance asset management program gathers all this information, digitizes it, and makes it available to maintenance technicians via handheld devices (Figure 2).
An asset management program typically provides:
• Instrument Manuals—Modern manuals are available in digital form and are easily down loaded into the data base; older paper manuals can be scanned
• Parts lists—Like manuals, parts lists can be downloaded or scanned
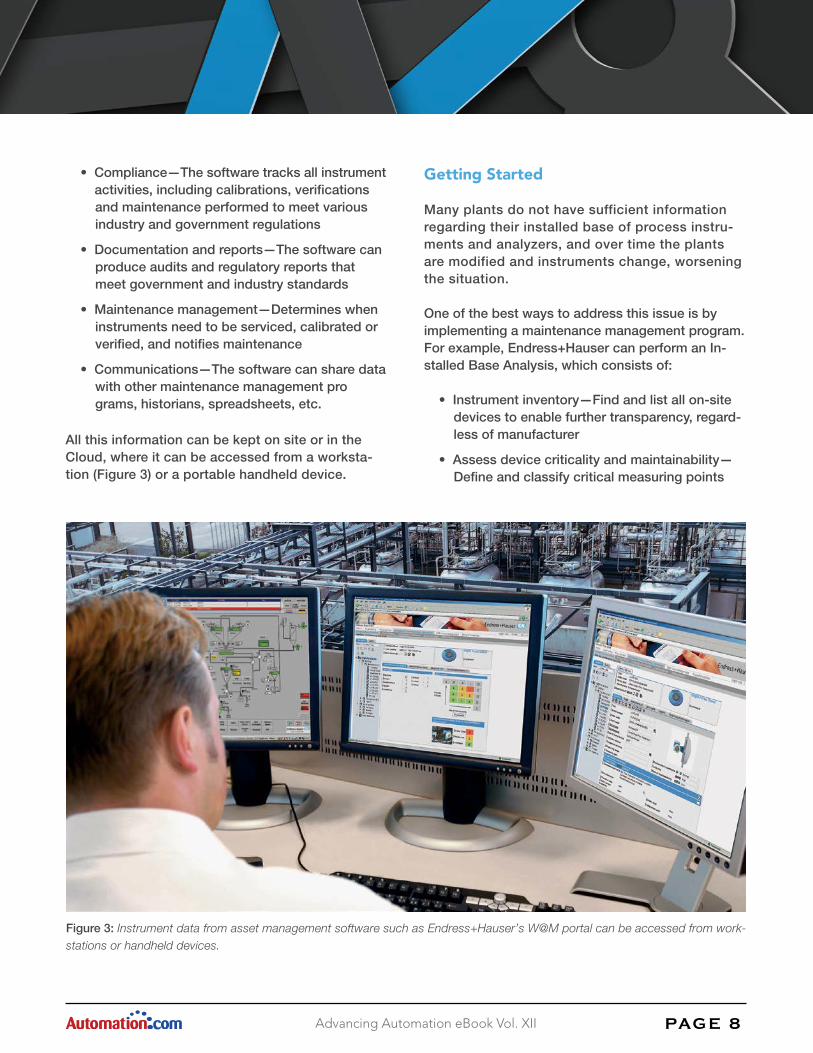
Figure 3: Instrument data from asset management software such as Endress+Hauser’s W@M portal can be accessed from work-stations or handheld devices.
PAG E 8Advancing Automation eBook Vol. XII
• Compliance—The software tracks all instrument activities, including calibrations, verifications and maintenance performed to meet various industry and government regulations
• Documentation and reports—The software can produce audits and regulatory reports that meet government and industry standards
• Maintenance management—Determines when instruments need to be serviced, calibrated or verified, and notifies maintenance
• Communications—The software can share data with other maintenance management pro grams, historians, spreadsheets, etc.
All this information can be kept on site or in the Cloud, where it can be accessed from a worksta-tion (Figure 3) or a portable handheld device.
Getting Started
Many plants do not have sufficient information regarding their installed base of process instru-ments and analyzers, and over time the plants are modified and instruments change, worsening the situation.
One of the best ways to address this issue is by implementing a maintenance management program. For example, Endress+Hauser can perform an In-stalled Base Analysis, which consists of:
• Instrument inventory—Find and list all on-site devices to enable further transparency, regard- less of manufacturer
• Assess device criticality and maintainability— Define and classify critical measuring points

ABOUT THE AUTHOR
Jon Dietz is the national field ser-vice manager for Endress+Hauser and has national responsibility for all after-sale customer field support. He is a U.S. Navy veteran (Advanced Elec-tronics Program) and prior to join-
ing Endress+Hauser supported Doppler radar applications within the agricultural industry. Dietz has been with Endress+Hauser for 26 years. He began his career with Endress+Hauser as a field service engineer and has been in his current position since 1999. Figure 4: After an audit, this wastewater treatment plant in
Switzerland installed Endress+Hauser’s W@M Life Cycle Management software.
PAG E 9Advancing Automation eBook Vol. XII
and its maintainability to ensure maintenance tasks can be performed easily and effectively
• Recommend adequate maintenance strategy— Evaluate current maintenance activities and recommend improvements to achieve a balanced maintenance program
• Identify obsolete equipment—Includes a migration plan to modernize the plant
• Reduce complexity—Includes recommendations to standardize instrumentation and minimize spare parts.
At the completion of the assessment, Endress+Hauser will address its recommendations by pro-viding key information to facilitate relevant decision making regarding the maintenance and quality improvements, obsolescence and spares manage-ment of respective installed base assets. If the plant agrees, the project begins by implementing the new maintenance program within the scope of a service agreement. The data describing each instrument is entered into the database and maintained over time to enable the user to continuously access up-to-date information at any time and from any location.
As noted above, the software may already have most of the data needed, such as DD and DTM files, manuals, etc. In some cases, old manuals and parts lists may have to be found and scanned in. Eventu-ally, the data base will be populated.
A wastewater treatment plant in Thun, Switzerland (Figure 4) had Endress+Hauser conduct an IBA, and then installed W@M Life Cycle Management software.
Once the data had been recorded, a connection was established to the control system. The visual-ization program allows the plant to quickly identify a measuring device needing attention. The necessary information can then be quickly accessed, including the right operating manuals, ordering information, maintenance reports, software drivers and spare parts.
The chemical plant mentioned above also conduct-ed an IBA and adopted such a program to maintain its 4,000 instruments. In the old days, documents such as calibration reports had to be scanned and filed manually. Today, this information is available whenever and wherever it is needed. The plant is now able to identify every one of its devices and react quickly in the event of a malfunction.
Initial implementation of an instrumentation man-agement system can be a daunting task, but instru-ment vendors can provide assistance as required.

A Rockwell Automation Company

By: Lee SwindlerProgram Manager MAVERICK Technologies
PAG E 11Advancing Automation eBook Vol. XII
Process safety management (PSM) can be a con-fusing topic with many specialized concepts and unique terms. One of the more complex concepts is the subject of risk and how to reduce process risk to an acceptable level.
For manufacturing facilities, having a PSM program in place requires verification that their hazardous processes are being operated safely. A key require-ment is to perform a risk analysis of the process and associated safeguards to determine the probability of a dangerous event occurring. In other words, an operating company must validate the safety of their process. So, how can you reduce risk and ensure your process operates at an acceptable level? Let’s find out.
Risk analysis
PSM-required risk analysis can be broken down into three steps:
Step 1: Systematically evaluate the hazards (inherent risks) in operating a given process unit. This is typically done using some sort of process hazard analysis (PHA) with the most common method being a hazard and operability (HAZOP) study. Hazards are identified and individually evaluated to determine the probability (i.e., how frequent) they might occur, along with the severity (i.e., how bad things would be) if the hazard occurs. In most companies, the overall risk is defined as the probability times the severity.
Step 2: Systematically evaluate any safeguards that mitigate those hazards to determine how much residual risk remains after taking credit for those safeguards. The safeguards are called independent protection layers (IPLs). Independence is important, because if one safeguard fails, it should not affect any other safeguard’s ability to mitigate risk. Several methods are used to evaluate the safeguards with the most common being a layer of protection analysis (LOPA). Note that this step is optional; some companies use a more conservative methodology that doesn’t consider credits for IPLs.
Process Safety: The Road to Risk Reduction

Figure 1. Residual risk exceeds the tolerable risk level
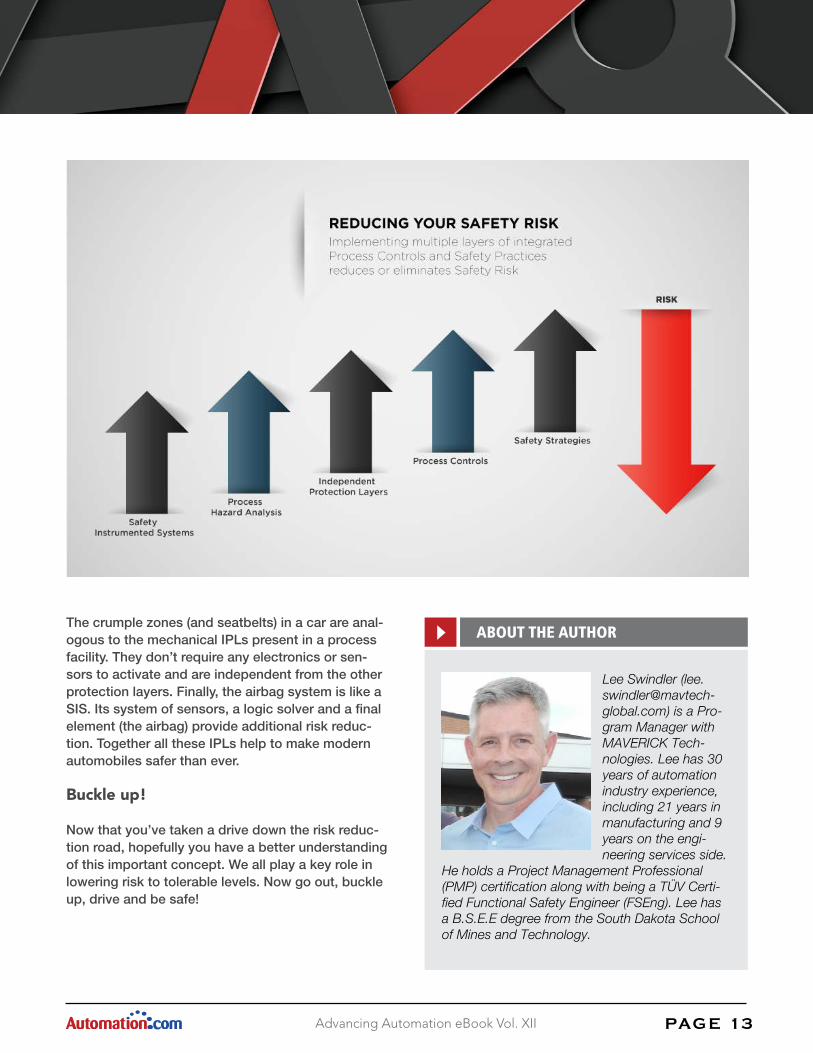
Figure 2. Risk reduction from the driver’s seat
PAG E 12Advancing Automation eBook Vol. XII
Step 3: After taking credit for any IPLs, compare the residual risk to the company-defined tolerable risk level to determine if action needs to be taken. If the residual risk is greater than tolerable, either the process needs to be redesigned or additional safe guards must be installed. A common safe guard is to install a safety instrumented system (SIS) to reduce the residual risk to acceptable levels. The size of the gap between the residual risk and the tolerable risk determines the safety integrity level (SIL), which is a measure of how “safe” the SIS needs to be. Or more specifically, SIL is a measure of the probability that the SIS will take the process to a safe state when called upon to act.
Let’s look at this graphically (Figure 1). In this case, the residual risk exceeds the tolerable risk level even after taking credit for IPLs, such as the basic process control system (BPCS) and mechanical protection (e.g., relief valves or rupture disks). To fill this gap in protection, a SIS is often implemented to reduce the residual risk to a tolerable level.
Note the BPCS IPL is usually a credit for 1) an alarm that triggers an operator response preventing the hazardous event; or 2) some sort of automated control, which keeps the process from reaching the hazardous condition. However, the BPCS can only
provide credit for one IPL, because the alarm and automated control functions are not truly inde-pendent. Certain BPCS failures could disable both functions.
An automobile analogy
If you find all this confusing, don’t feel bad – you are not alone! These concepts can be somewhat abstract, especially if you are not familiar with in-dustrial process facilities. I find it helpful to explain risk reduction in terms of driving an automobile as shown in Figure 2.
Statistically, driving an automobile is considered the most hazardous activity any of us do. But it could be worse! Imagine if cars didn’t have any safety fea-tures or provide a good way for drivers to maintain control. The risk of injury from a collision would be unacceptably high. For many, the inherent risk of this activity would exceed our tolerance level.
Fortunately, modern automobiles have numerous IPLs to help lower this risk to a tolerable level. The steering and brakes are the BPCS in a car. Although they do not run in automatic closed-loop control, they provide an effective way for drivers to safely operate their vehicle. However, failures can still hap-pen, and a clear majority of people want additional protection layers to help keep them safe.
ABOUT THE AUTHOR
Lee Swindler ([email protected]) is a Pro-gram Manager with MAVERICK Tech-nologies. Lee has 30 years of automation industry experience, including 21 years in manufacturing and 9 years on the engi-neering services side.
He holds a Project Management Professional (PMP) certification along with being a TÜV Certi-fied Functional Safety Engineer (FSEng). Lee has a B.S.E.E degree from the South Dakota School of Mines and Technology.
PAG E 13Advancing Automation eBook Vol. XII
The crumple zones (and seatbelts) in a car are anal-ogous to the mechanical IPLs present in a process facility. They don’t require any electronics or sen-sors to activate and are independent from the other protection layers. Finally, the airbag system is like a SIS. Its system of sensors, a logic solver and a final element (the airbag) provide additional risk reduc-tion. Together all these IPLs help to make modern automobiles safer than ever.
Buckle up!
Now that you’ve taken a drive down the risk reduc-tion road, hopefully you have a better understanding of this important concept. We all play a key role in lowering risk to tolerable levels. Now go out, buckle up, drive and be safe!

We make it happenwith a button
of a
Quantum Design Inc. is your Custom Control Systems Integrator. For over 30 years we have provided state-of-the-art automation integration to many manufacturing industries. Our combination of engineering expertise and broad industry experience provides a comprehensive solution to meet your controls needs. Our strategic alliances with industry leaders enables delivery of the best technology to solve most any automation challenge. For a custom automation solution, contact us today.
PUSH
Electrical Engineering & DesignControl System DesignControl Panel Design & AssemblyMotion Control Design & ProgrammingProgrammable Controllers & Peripherals
Drives & Drive SystemAutomatic ID (Vision, Barcode, RF Tag)Human/Machine Interface Prog. & Dev.Logic Programming & DevelopmentERP/MRP/SharePoint Integration
System Upgrades & RetrofitsVisual Basic Application DevelopmentCNC Design and RetrofitInstallation & Start-upField Service
Services Offered
Learn More Now
Quantum DesignControl Systems
815-885-1300www.quantumdi.com
For a full list of products and services, more information or to contact us, visit www.quantumdi.com/customcontrols.
Custom Control Systems Integration

By: Nevagay M. AbelElectrical Engineering Manager Quantum Design
PAG E 15Advancing Automation eBook Vol. XII
System integrators are often tasked with coming up with innovative yet economical solutions to their customer’s problems. It can be something as simple as upgrading a component in a panel, to the more complex, such as integrating the latest tech-nology with older controls systems that use outdat-ed or obsolete hardware, software and/or communi-cation protocols. We are always asked to do this at the lowest possible cost and in the shortest amount of time possible.
Every prospective job has its own unique set of design and build requirements, making the stan-dardization of schematics, difficult to accomplish. Customers’ will require the system integrator to
create these schematics from a design specification, a list of parts or features, hand drawn schematics or an I/O list. Typically, this process will go through several revisions as they work through the approval process with their customers, contractors and local authorities. One way to reduce cost and speed up the design process is to automate as much of the design process as possible, so when changes do come through after the initial design was submitted, the updates can be completed in a more expedient manner.
Often a customer will look to the system integrator for the development of the schematics for a project. Since each customer essentially requires a custom solution, there is less opportunity to take advantage of standardization and reuse of previous designs. Normally each sheet of the schematics is created as an individual drawing which may use a template for at least the title block or basic line numbering
Automation of Customer Drawing Formats

PAG E 16Advancing Automation eBook Vol. XII
and power line creation. If a customer is looking for assistance in drawing design on a regular basis, and their design requirements have certain features, then there are steps that can be automated to speed up the design process.
One of the most time consuming parts of creating these custom designs is the updating of text for items such as cross-references, wire numbers, table of contents, title blocks, device ID’s, I/O points and terminal numbering. On each sheet of the sche-matics there can be anywhere from a couple of text points to well over one hundred in a more detailed or complex design. A set of schematics can range from a couple of sheets to more than one hundred sheets in a distributed system with hundreds of I/O. If asked to change just one item of simple text on each sheet of one hundred fifty sheet set of schematics could easily take an hour when you look at the time it takes to open the drawing, locate the text, open the attribute (as-suming blocks have been used), type in the new text, close the attribute and save the drawing. Then multiply this times the number of items that must be changed on each sheet and now you’re looking at hours. If the text change could be made in a more efficient way and the sheets up-dated or recreated, this could offer a sig-nificant saving in time and cost. Through the use of third-party software like JTB
World® AutoGen, AutoCad® and Microsoft® Excel, a systems integrator can automate some of these tasks to speed up the process if the right conditions apply.
Some of the features to look for to determine if a design is a candidate for using these automated techniques are:
• Repetitive sheets where the text may be different but the overall layout/design of the schematic sheet is the same
• Similar sheets where layer control could allow for making minor changes to the layout/design
• Large sheet sets (probably >40 sheets)
• Multiple sets of similar sheet sets
• Customer typically goes through several design approvals requiring changes to descriptions, I/O addressing, wires and terminal numbers
• A well-defined table of contents can be pro- vided, thereby determining the templates that will be required
If it is determined that a design fits the criteria for applying the automation, the first step is to create the template designs and the required blocks and associated attributes required to populate the fields. We have found that getting this part completed up

PAG E 17Advancing Automation eBook Vol. XII
front and then approved by the customer before attempting any auto-creation of the sheets saves a lot of time down the road. These templates will appear just like the final version of the sheets, but any text that will be filled out in the spreadsheet will have a holder value placed in it, thus allowing the customer to have a good feel for the final product. The system we have implemented uses a JTB World CAD Automation Tool called AutoGen. This product can create multiple sheets from a template drawing developed in AutoCad using an Excel spreadsheet we refer to as generators and the per license cost is less than $40. The program provides a spread-sheet template to get you started and can easily be modified by adding rows for additional sheets and columns for additional attributes.
Once the templates are approved, the generators can be populated with the drawing numbers, de-scriptions, block and attribute names required per template before any actual data is entered. The at-tribute data is then entered into the spreadsheet for each sheet required for the drawing set. Depending on the data that you are entering, it may be possi-ble to automate the generation of some of that data using the formula functions with Excel. Error check-ing can also be implemented to check for duplicate Rack/Slot/Point addressing of I/O cards or in the terminal or wire numbers being used. Once the data has been entered into the generator, running the AutoGen program will create the individual drawing files from the templates, populated with the data en-tered. After checking, it is not uncommon to have to tweak the template drawings to address any overlap issue with the drawing and text or issues with the tag nomenclature of the attributes that may not have populated correctly. There may also need to be cor-rections made to the data in the generators, where it was entered incorrectly into the generator. Tra-ditionally after a schematic set has been checked, each drawing that needed corrections would need to be corrected individually, even when it is a re-peated error. This would again involve opening each drawing, making the necessary changes, saving and closing. However, using the templates means you only have to modify a limited number of drawings and update one spreadsheet.
Some of the other benefits we have seen from using this method are:
• Multiple generators can be used with the set of templates required. This keeps the size of the spreadsheet more manageable and allows you to create a variety of drawings sets.
• When wire numbers are part of the generator, this detail can be imported in most label sys- tems so individual wire numbers do not need to be typed into the label maker software. This can be a considerable time saver when you require 100’s or 1000’s of wire labels for a panel. This feature can also be done with AutoCad® Electrical.
• By using the layer feature of AutoCad, it is possible to reduce the number of templates required as the layer on/off control can be done through the generator. This allows for using the same template drawing creating a number of different sheets. In one case, we were able to reduce the number of templates required for a customer due to the variation in I/O combinations and common feeds from twenty to seven, a 65% reduction in the number drawings we had to work with and maintain.
• When using a customer title block it can be modified into a block format that would then allow AutoCad® Electrical to populate the fields that are the same from sheet to sheet, while the AutoGen program can handle the
ABOUT THE AUTHOR
Nevagay M. Abel is the Electrical Engi-neering Manager for Quantum Design Inc. of Loves Park, IL. She holds a Bachelor’s Degree in Electrical Engineering from Lehigh Univer-sity and a Master’s in Business Admin-istration from Lasalle
University. She has been working in the controls industry for more than 30 years as both a controls engineer and/or manager. She has spent the past 13 years of her career with Quantum Design.
PAG E 18Advancing Automation eBook Vol. XII
fields that change from sheet to sheet, like sheet number, description and revision level, while keeping the original appearance of the block.
• If using AutoCad® Electrical, using the sigcodes in the generators and templates and providing a sheet ID behind the scenes, will allow you to run the Cross Ref Update command to update the cross referencing on all the sheets.
• If using AutoCad® Electrical, if you use a block for the terminal and put this into the generator, then a terminal layout can be auto generated with terminal numbers, wire numbers, field and panel connections. This requires less time than editing each terminal block within the drawing.
Usually with custom designs there is not a lot that can be done to standardize and reduce cost with each subsequent design. However, if a design meets all, some or even just one of the criteria that was stated, it could start a conversation with your customer about what options there might be. If a customer’s current design is a candidate, with a one-time investment from them and/or the system integrator, the design time and rework hours required
can be reduced and a more complete and correct set of drawings can be produced. This can save the customer lots of hours and fees in the future.

By: Eric CorzineProduct Manager Rittal North America
PAG E 2 0Advancing Automation eBook Vol. XII
Constantly tightening budgets demand finding new ways to do more with less. Today, finding more energy-efficient solutions for critical functions is essential to reduce costs without sacrificing pro-ductivity. Protecting the sensitive, sophisticated electronics and drives required for a growing num-ber of industrial applications definitely qualifies as a critical function, so this equipment must be housed in climate-controlled enclosures.
Why Are Enclosures Necessary?
The main function of an enclosure is to protect
electronic components and devices from environ-mental contaminants such as humidity, water, oil mist, corrosive vapors and air-borne dust. Keeping these substances out of enclosures is crucial to ensuring the proper performance of the installed components, such as PLCs, motor starters and/or VFDs. Additionally, the installed electrical/electronic components must be protected from overheating to avoid costly heat-related downtime. The cooling ca-pacity required to remove the thermal load depends on several factors, such as the size of the enclosure, desired internal temperature, maximum ambient temperature and the efficiency of installed devices.
The first question to ask when attempting to save energy on cooling industrial enclosures is simple: “Does this application actually require cooling, and if so, how much?” It is important to determine the cor-
Maximizing the Energy Efficiency of YourEnclosure Climate Control System
PAG E 21Advancing Automation eBook Vol. XII
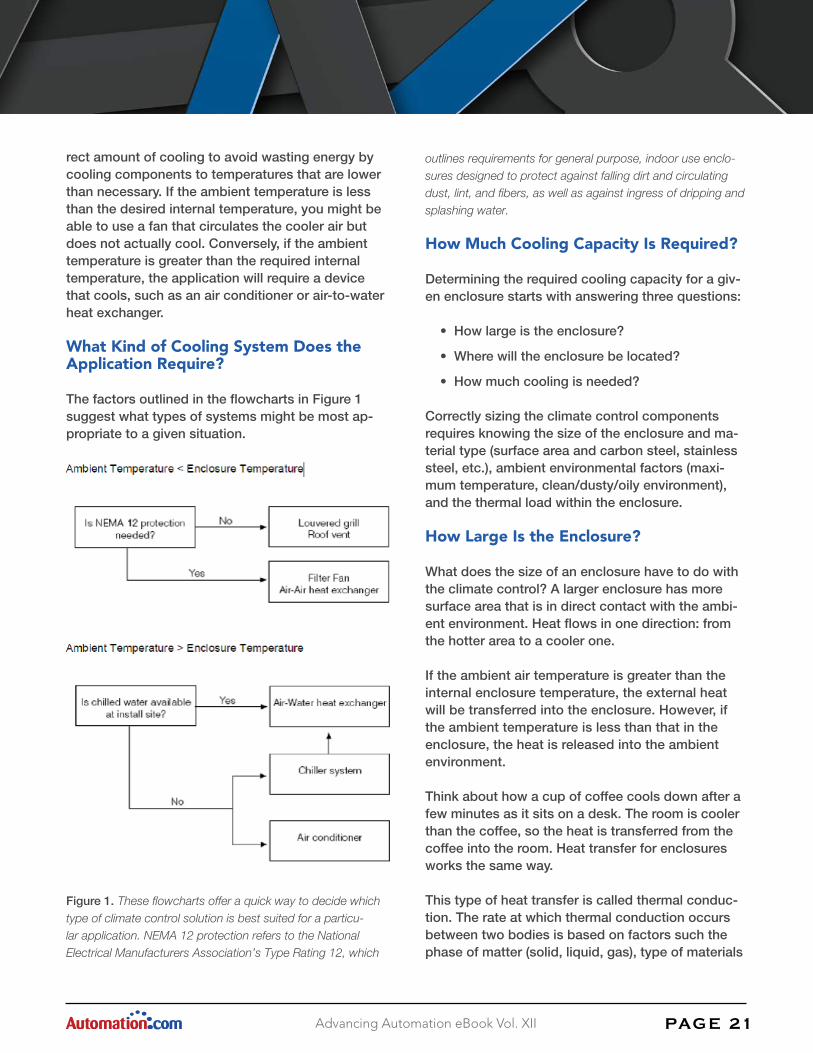
rect amount of cooling to avoid wasting energy by cooling components to temperatures that are lower than necessary. If the ambient temperature is less than the desired internal temperature, you might be able to use a fan that circulates the cooler air but does not actually cool. Conversely, if the ambient temperature is greater than the required internal temperature, the application will require a device that cools, such as an air conditioner or air-to-water heat exchanger.
What Kind of Cooling System Does the Application Require?
The factors outlined in the flowcharts in Figure 1 suggest what types of systems might be most ap-propriate to a given situation.
Figure 1. These flowcharts offer a quick way to decide which type of climate control solution is best suited for a particu-lar application. NEMA 12 protection refers to the National Electrical Manufacturers Association’s Type Rating 12, which
outlines requirements for general purpose, indoor use enclo-sures designed to protect against falling dirt and circulating dust, lint, and fibers, as well as against ingress of dripping and splashing water.
How Much Cooling Capacity Is Required?
Determining the required cooling capacity for a giv-en enclosure starts with answering three questions:
• How large is the enclosure?
• Where will the enclosure be located?
• How much cooling is needed?
Correctly sizing the climate control components requires knowing the size of the enclosure and ma-terial type (surface area and carbon steel, stainless steel, etc.), ambient environmental factors (maxi-mum temperature, clean/dusty/oily environment), and the thermal load within the enclosure.
How Large Is the Enclosure?
What does the size of an enclosure have to do with the climate control? A larger enclosure has more surface area that is in direct contact with the ambi-ent environment. Heat flows in one direction: from the hotter area to a cooler one.
If the ambient air temperature is greater than the internal enclosure temperature, the external heat will be transferred into the enclosure. However, if the ambient temperature is less than that in the enclosure, the heat is released into the ambient environment.
Think about how a cup of coffee cools down after a few minutes as it sits on a desk. The room is cooler than the coffee, so the heat is transferred from the coffee into the room. Heat transfer for enclosures works the same way.
This type of heat transfer is called thermal conduc-tion. The rate at which thermal conduction occurs between two bodies is based on factors such the phase of matter (solid, liquid, gas), type of materials

Figure 2. Location of enclosure
Qe = Qv - A x k x ∆T
PAG E 2 2Advancing Automation eBook Vol. XII
of a body (carbon steel, stainless steel, aluminum, water, etc.), and the temperature differential be-tween the bodies.
Where Will the Enclosure Be Located?
Although it’s possible to calculate the surface area by simply adding up all the surfaces of the en-closure, this might not accurately reflect the heat transfer into the surroundings. As shown in Figure 2, you must consider the enclosure’s location and con-figuration to ensure thermal conduction is calculated correctly. For example, if the rear of an enclosure is placed directly against a wall, the temperature of that spot will have a smaller temperature differential when compared to the other sides of the enclosure that are open to the environment. This differential must be taken into account.
How Much Cooling is Needed?
Once the effective surface area of the enclosure is determined, it is possible to calculate the cooling needed by using the temperature difference be-tween the interior of the enclosure and the surround-ing environment when the installed components are operating at full capacity or by adding up the total heat loss from all installed components using information provided by the various manufacturers’ data sheets.
To determine how much cooling is required, use the following formula:
Where:
Qe is the cooling capacity needed
Qv is the amount heat from the components inside the enclosure
A is the effective surface area
k is 5.5 w/m2 Celsius (for sheet steel; different materials will have different values)
∆T is the difference between the ambient tempera-ture and the interior temperature in degrees Celsius
Air Conditioners by the Numbers
Based on the German Institute for Standardization (DIN) Standard EN 14511, air conditioner cooling ca-pacity is calculated at L35/L35. The first number is the internal temperature and the second number is the external temperature. Thus, L35/L35 designates that both the internal and external temperatures are 35°C (95°F). Another readily used point is L35/L50; internal temperature is 35°C (95°F) and external tem-perature is 50°C (122°F). Using a single reference point will allow users to compare various manufac-turers’ specifications of similar equipment.
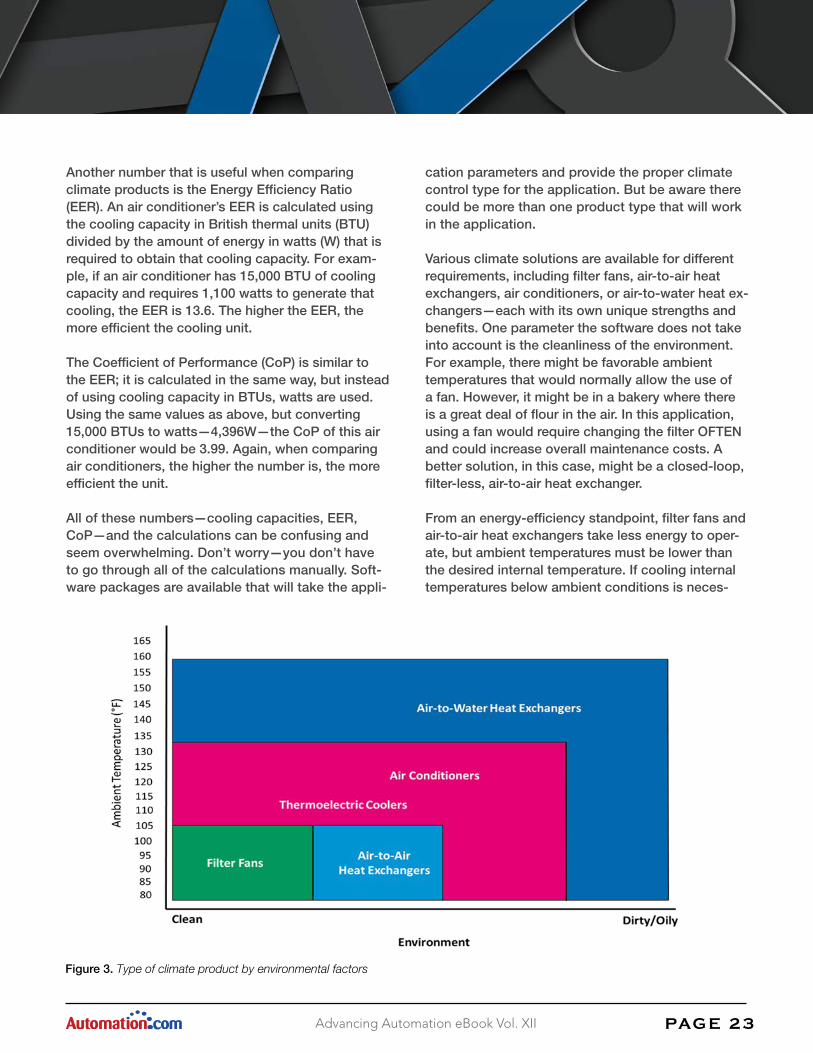
Figure 3. Type of climate product by environmental factors
PAG E 2 3Advancing Automation eBook Vol. XII
Another number that is useful when comparing climate products is the Energy Efficiency Ratio (EER). An air conditioner’s EER is calculated using the cooling capacity in British thermal units (BTU) divided by the amount of energy in watts (W) that is required to obtain that cooling capacity. For exam-ple, if an air conditioner has 15,000 BTU of cooling capacity and requires 1,100 watts to generate that cooling, the EER is 13.6. The higher the EER, the more efficient the cooling unit.
The Coefficient of Performance (CoP) is similar to the EER; it is calculated in the same way, but instead of using cooling capacity in BTUs, watts are used. Using the same values as above, but converting 15,000 BTUs to watts—4,396W—the CoP of this air conditioner would be 3.99. Again, when comparing air conditioners, the higher the number is, the more efficient the unit.
All of these numbers—cooling capacities, EER, CoP—and the calculations can be confusing and seem overwhelming. Don’t worry—you don’t have to go through all of the calculations manually. Soft-ware packages are available that will take the appli-
cation parameters and provide the proper climate control type for the application. But be aware there could be more than one product type that will work in the application.
Various climate solutions are available for different requirements, including filter fans, air-to-air heat exchangers, air conditioners, or air-to-water heat ex-changers—each with its own unique strengths and benefits. One parameter the software does not take into account is the cleanliness of the environment. For example, there might be favorable ambient temperatures that would normally allow the use of a fan. However, it might be in a bakery where there is a great deal of flour in the air. In this application, using a fan would require changing the filter OFTEN and could increase overall maintenance costs. A better solution, in this case, might be a closed-loop, filter-less, air-to-air heat exchanger.
From an energy-efficiency standpoint, filter fans and air-to-air heat exchangers take less energy to oper-ate, but ambient temperatures must be lower than the desired internal temperature. If cooling internal temperatures below ambient conditions is neces-

Figure 4. Blocking airflow can prevent effective cooling of electronic components within an enclosure, which risks shortening lifespan.
Figure 5. Correct routing of cables and removing obstructions will ensure proper airflow within an enclosure.
PAG E 2 4Advancing Automation eBook Vol. XII
sary, devices such as air conditioners or air-to-water heat exchangers—devices that cool, not just cir-culate the air—will be required. The tradeoff being greater electrical consumption.
Consider Climate from the Beginning
It is important to consider climate products at the beginning of a project. All too often, it’s an after-thought and requires time-consuming and costly re-configuration. To ensure the proper airflow, a good rule of thumb is to allow eight inches of clearance in front of and behind any climate products. This will decrease the chances of hot spots and provide a more uniform temperature throughout the enclosure.
Installing the climate control system properly is crucial to effective operation. Filter fans should normally be placed at the bottom of an enclosure with the corresponding exhaust filter installed at the top of the opposite side. That allows the fan to draw in the cooler air located near the floor and creates a cross-ventilation inside the enclosure, increasing heat removal. Air conditioners and heat exchangers can be installed either on the walls or the roof of an enclosure in accordance with the manufacturer’s recommendations for best results.
In the examples shown in Figure 4, cables, binders full of paper, spare parts and other objects are ob-structing proper airflow within the enclosures. Thus,

PAG E 2 5Advancing Automation eBook Vol. XII
the components cannot be effectively cooled, which significantly increases the possibility that elevated temperatures will decrease useful lifespan.
Air-to-Water Heater Exchangers and Energy Efficiency
Air-to-water heat exchangers can be used in harsh-er environments. Like air conditioners, air-to-water heat exchangers cool internal temperatures below external ambient conditions. They’re designed to operate in conjunction with a supply of chilled water that runs through a coil inside the exchanger, where an internal fan blows the hot air across the coil. As the heat is blown across the coil, the chilled water within it absorbs the heat and then is pumped to a device such as a cooling tower or chiller, where the water is re-cooled and the process continues. Air-to-water heat exchangers are considered to be a low-maintenance, highly efficient climate control solution because they require very little energy to operate. Industrial chiller systems are generally large in scale and vital to a variety of other plant opera-tions. These large systems are intrinsically efficient because they take advantage of the economies of scale; generally speaking, the larger a system is, the more efficient it is.
Properly insulating the delivery/return piping in a wa-ter cooled solution and, as much as possible, routing the pipes away from extremely hot areas will optimize cooling efficiencies. Another factor to consider is in-stalling the chiller in a location where it’s not exposed to excessive heat, such as near ovens or furnaces.
Ensuring Optimum Operating Efficiency
Although correct sizing and proper installation are essential to getting the highest returns from indus-trial climate control products, maximizing efficiency doesn’t stop there. Maintaining the units over the course of their service life will keep performance levels up and energy usage down.
Maintaining filter fans is a relatively simple task because it’s possible to inspect the unit visually and determine if the filter media is clogged or dirty and requires replacement. Fan bearings, shafts, and other moving parts are lubricated when manufac-tured and do not need additional lubrication for the life of the fan. However, it might be necessary to remove dust and debris that might have collected on those parts.
Although designed for relatively maintenance-free operation, air conditioners should be inspected on regular intervals based on the manufacturers’ guide-lines. However, these are merely recommendations developed on typical usage and shorter intervals might be necessary if the application/environment is more severe.
The primary factor associated with reducing cooling capacity and efficiency in an air conditioner is dust, dirt, and/or oil collecting on the condenser. If this happens, the air conditioner does not function as designed, which greatly increases the chance of a catastrophic failure, not only of the of cooling unit but the components within the enclosure as well. Knowing this and attempting to mitigate this possi-bility, some manufacturers treat the condenser with a protective coating that prevents dirt, oil and other contaminants from adhering to it.
Additionally, during the inspection, the evaporator fan should be checked for potential dust/debris buildup. If a filter is used, it must be cleaned and/or replaced on a regular schedule, depending on the environment in which the unit operates; it could be up to six months in a relatively clean environment or as short as every day in a harsh setting.
Each of the three common types of filters is designed specifically for a particular type of environment: met-al filters excel in oily environments, fiber and foam filters are intended for settings with varying sizes of air-borne dust, lint, and other solid particulates.
ABOUT THE AUTHOR
Eric Corzine is an Industrial Product Manager at Rittal North America LLC specializing in climate solutions. Starting his career in the military, Eric served in the US Air Force for 11 years working in electronics repair and calibration. After returning to
civilian status, Eric worked in different positions within manufacturing and distribution with his primary focus on managing a broad range of industrial and climate products. Eric joined Rittal in 2015 and has shared his climate expertise as a featured speaker at events and as a content contributor to various design engineering publica-tions. Eric holds a Bachelor of Science in Eco-nomics from the University of Maryland University College and an MBA from Eastern New Mexico University.
PAG E 2 6Advancing Automation eBook Vol. XII
Following the simple steps outlined here will simplify choosing the correct climate product with highest efficiencies for the application and provide the longest lifespan—not only for the fan, air condition-er, etc.—but the electrical/electronic components installed within the enclosure as well.
To learn more about maximizing the energy efficien-cy of industrial enclosures, download a free copy of Enclosure and Process Cooling, available from Rittal Enclosures.
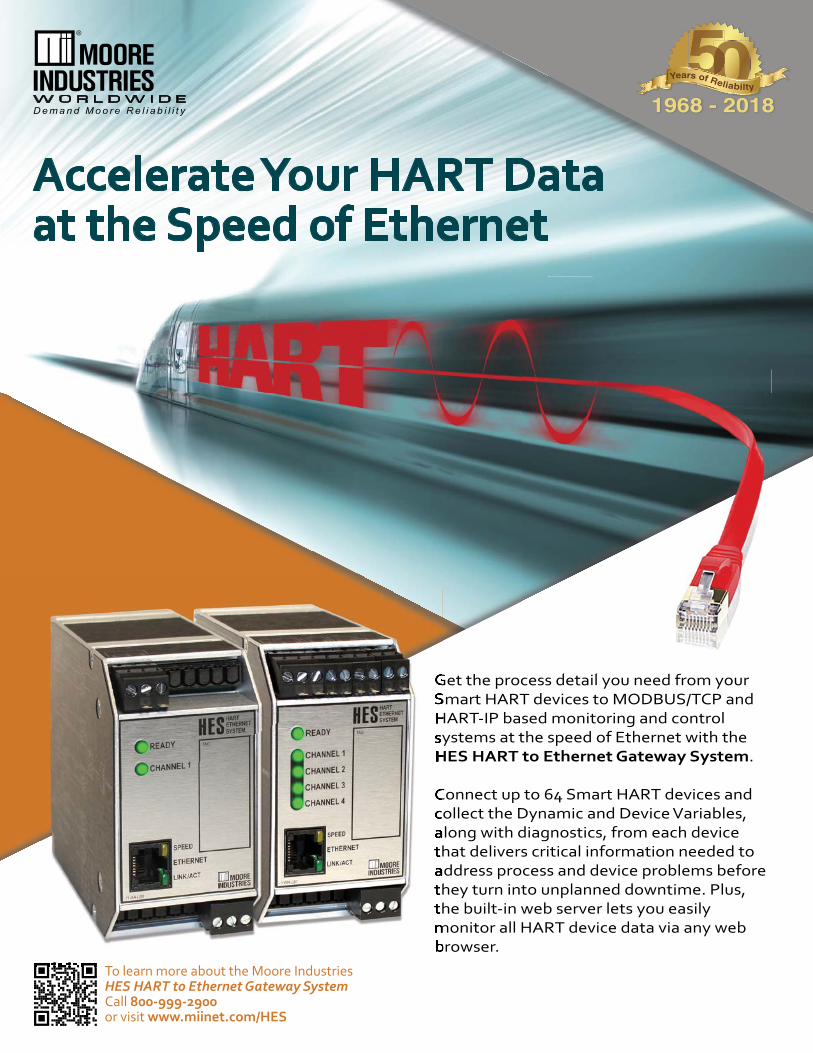
Get the process detail you need from your Smart HART devices to MODBUS/TCP and HART-IP based monitoring and control systems at the speed of Ethernet with the HES HART to Ethernet Gateway System.
Connect up to 64 Smart HART devices and collect the Dynamic and Device Variables, along with diagnostics, from each device that delivers critical information needed to address process and device problems before they turn into unplanned downtime. Plus, the built-in web server lets you easily monitor all HART device data via any web browser.
Get the process detail you need from your Smart HART devices to MODBUS/TCP and HART-IP based monitoring and control systems at the speed of Ethernet with the HES HART to Ethernet Gateway System
Connect up to 64 Smart HART devices and collect the Dynamic and Device Variables, along with diagnostics, from each device that delivers critical information needed to address process and device problems before they turn into unplanned downtime. Plus, the built-in web server lets you easily monitor all HART device data via any web browser.
1968 - 20180055050Years of Reliabilty
Accelerate Your HART Data at the Speed of Ethernet
Get the process detail you need from your
To learn more about the Moore Industries HES HART to Ethernet Gateway SystemCall 800-999-2900or visit www.miinet.com/HES
C
M
Y
CM
MY
CY
CMY
K
Acom 2018-11 eBook HES Train FullPg MII.pdf 1 9/25/2018 3:29:55 PM
By: Sloan ZupanSenior Manager, Corporate Marketing Mitsubishi Electric Automation
PAG E 2 8Advancing Automation eBook Vol. XII
Executive summary:
The last 10 years have brought about dramatic advances in technologies that OEMs had never realized would affect their designs or the sellabil-ity of their machines, much less impact business models and profits so dramatically. Standardiza-tion of network adoption across manufacturing operations, and convergence with office and operations systems have proliferated the need to enhance information flows from individual machines and lineups while improving the per-formance, intelligence, and communications of individual components. The following discussion will cover key advancements and recommenda-tions all OEMs should be adopting in their design processes to stay current and competitive.
The Manufacturing landscape in flux Several trends have impacted production operations over the last decade, creating the need to enhance automation systems to accommodate a changing global landscape. The aging of manufacturing work-ers and the lack of qualified replacement workers coupled with globalization and automation adoption has pushed the envelope of human resources to fill ever more technically demanding roles to augment ever more technically complex machinery.
The recent rise of common IT technology adoption to operations systems, previously explicit to auto-mation vendors, has presented manufacturers with
challenges in both human resource management as well as capital expense deployment. OEMs must now adopt information technologies and intelligent sensing as part of their designs to meet customer needs to monitor the effectivity of their assets. At the same time, open technologies have exposed vulnerabilities to both internal and external threats in cyber or physical worlds. Security and safety challenges have increased in complexity and future proofing against unknown threats is a critical design criteria for OEMs today.
So how do OEMs respond with Smarter Machines to ensure higher levels of value to their customers while navigating more complex technology require-ments? These 5 innovations create a foundation for improving machine intelligence and desirability while offering the added benefit of reshaping your business models for enhanced revenue streams and cost containment.
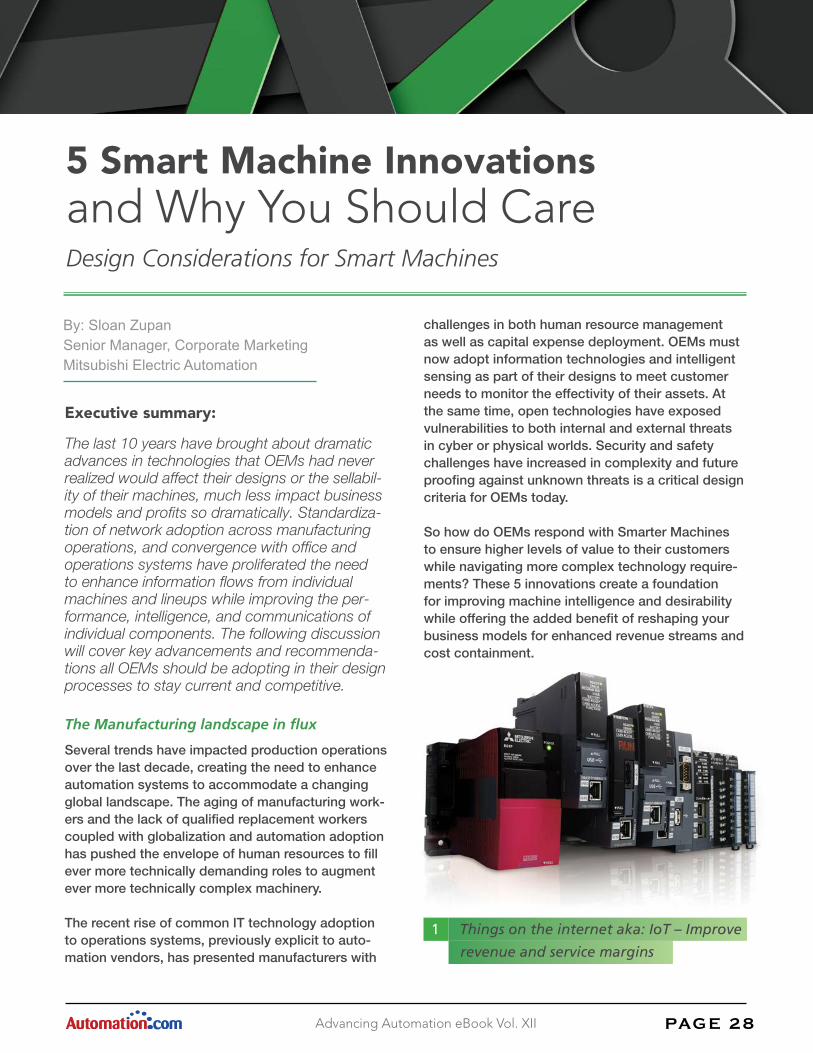
1 Things on the internet aka: IoT – Improve
revenue and service margins
5 Smart Machine Innovations and Why You Should CareDesign Considerations for Smart Machines

PAG E 2 9Advancing Automation eBook Vol. XII
While the common catch phrase for internet intel-ligence seems to captivate a lot of press, it comes down to a simple application of Moore’s law. As Eth-ernet chipsets have increased in processing capac-ity, the price has come down to a point where every industrial sensing or actuating device has inborn capability to communicate and process information. This has created a generation of devices that can be reconfigured, monitored, diagnosed and potentially repaired using mobile and remote devices. OEMs who effectively deploy intelligent devices inherently give themselves a margin saving advantage as this intelligence does several things for them:
• Provides real time diagnostics and potentially predictive analysis
• Provides real time feedback on potential failure modes of the machine and deployment of spare parts - more efficiently to mitigate unnecessary parts stores and cash flow
• Provides the foundation of intelligent machine parameters that users demand in order to ascertain production and operator quality and efficiency.
• Improves global competitiveness and potential new revenue streams as information is processed downstream
2 Analytics become mainstream
Not long ago, analytics were the domain of Big Data players and super computer houses. While these players still hold relevance to major users and pro-ducers, many sets of information require more im-
mediacy and cannot tolerate the latency of upload-ing and processing these players require. Analytics are now available in small footprints and are built directly into products, allowing fit for purpose an-alytics to relay critical behaviors in real time. Many vendors are now pursuing the small analytic engine model to provide immediate diagnostics and repair information to the user as well as report back to the OEM so that any potential downtime is minimized or eliminated.
Using analytic data from a fleet of installed ma-chines provides the OEM aggregated feedback on failure analysis, vendor performance, and customer utilization. It also provides a window into the ma-chines actual utilization so that improvements and evolution, or remote upgrades become revenue enhancements for the future.
3 Remote monitoring through cloud services
More end users have adopted cloud-based services as a means to contain the costly IT support and capital expense required to process the proliferation of data in their systems. As a result, security practic-es have matured and OEMs can have access to their machine data and related production information through judicious accessibility. OEMs have created standard monitoring capabilities to advise their cus-tomers of impending mechanical or operator issues, safety concerns, and production anomalies. Typi-cally control vendors are providing preconfigured diagnostic screens on their HMIs in order to advise operators of fault or alarm conditions, and in paral-lel, advise the OEM of the need for parts or service.
PAG E 3 0Advancing Automation eBook Vol. XII
OEMs can gain an added benefit in using remote monitoring services to adapt their business models. For example, knowing the behaviors, attributes and the utilization characteristics of a fleet of machines can provide useful insight in the evolution of ma-chine designs, upgrades for users, and off site re-mote services such as maintenance monitoring and repair requests. Similarly, fleet monitoring provides a window to part failures, spares requirements, and analysis of inventories to ensure only required spares are inventoried locally - reducing carrying costs and improving delivery times.
4 Machine learning
Smart Machines take advantage of vendor technol-ogies and aggregate the learnings from individual sensors and components into algorithms that miti-gate downtime and provide prognostic and predic-tive diagnostics. These machines provide enhanced value to the end user through improved OEE and optimized availability. Further, as conditions on the machine change over time – due to mechanical deg-radation, product changeovers or operating condi-tions, these algorithms auto-tune and auto-correct to retain performance and availability while provid-ing diagnostic information, and alarms to appropri-ate personnel.
The ability of individual components to monitor and correct aberrant behaviors is critical to running pro-duction at full speed with less operator intervention, and less lost production and downtime.
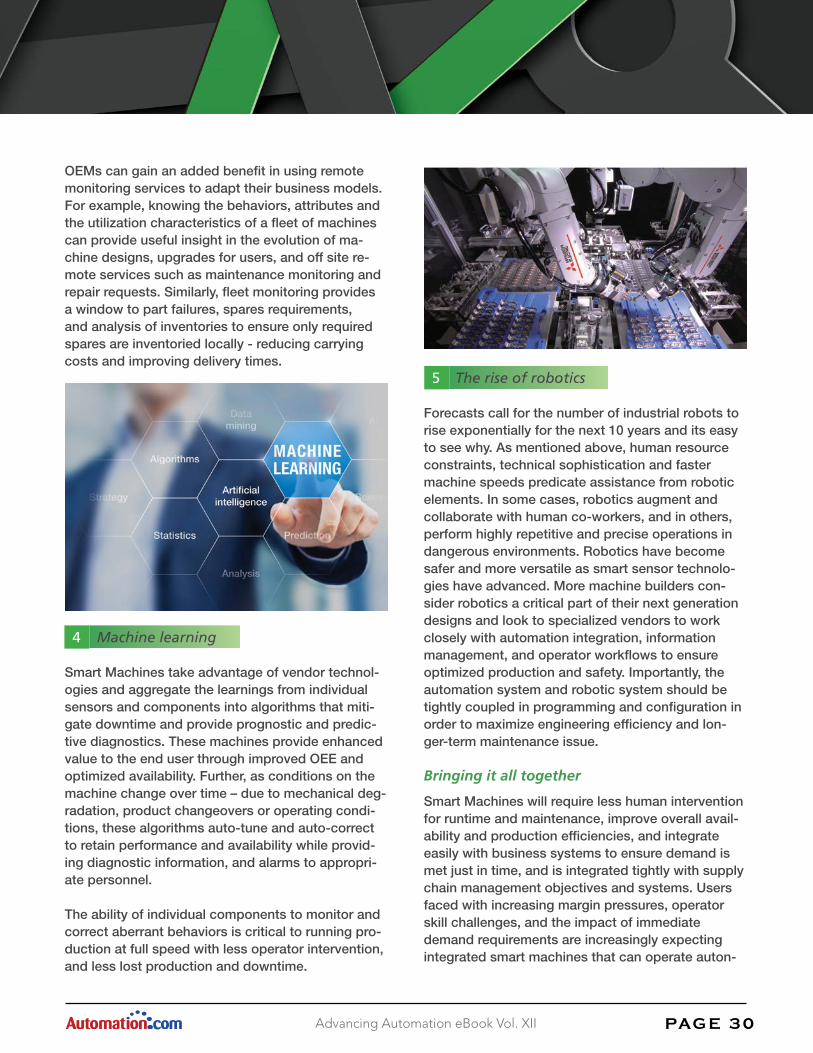
5 The rise of robotics
Forecasts call for the number of industrial robots to rise exponentially for the next 10 years and its easy to see why. As mentioned above, human resource constraints, technical sophistication and faster machine speeds predicate assistance from robotic elements. In some cases, robotics augment and collaborate with human co-workers, and in others, perform highly repetitive and precise operations in dangerous environments. Robotics have become safer and more versatile as smart sensor technolo-gies have advanced. More machine builders con-sider robotics a critical part of their next generation designs and look to specialized vendors to work closely with automation integration, information management, and operator workflows to ensure optimized production and safety. Importantly, the automation system and robotic system should be tightly coupled in programming and configuration in order to maximize engineering efficiency and lon-ger-term maintenance issue.
Bringing it all together
Smart Machines will require less human intervention for runtime and maintenance, improve overall avail-ability and production efficiencies, and integrate easily with business systems to ensure demand is met just in time, and is integrated tightly with supply chain management objectives and systems. Users faced with increasing margin pressures, operator skill challenges, and the impact of immediate demand requirements are increasingly expecting integrated smart machines that can operate auton-

ABOUT THE AUTHOR
The manufacturing sector is poised for substantial growth. An aging workforce, fewer new skilled labor entering the market, and growing global competition is driving domestic manufacturers to increase the use of industrial automation
to meet production demands. Sloan, the Sr. Man-ager of Corporate Marketing at Mitsubishi Electric Automation, is a thought-leader and advisor to the manufacturing sector relative to the adoption of Smart Manufacturing technologies (IoT, Robotics, AI, Machine Learning), to improve manufacturing sustainability, and increasing profitability.
PAG E 31Advancing Automation eBook Vol. XII
omously while communicating upstream to ensure demand is met, quality is guaranteed, and losses are minimized. Working with automation vendors that innovate in these Smart Machine technologies will provide OEMs assurance that their designs will be competitive and improve their customer service longer term.