provide introduction and case study identification ... the zoil and gas capital of europe. ... (such...
TRANSCRIPT
[Partner logo]
Contract no. 633838
PROVIDE
PROVIding smart DElivery of public goods by EU agriculture and forestry
Call identifier: H2020-ISIB-2014-2; Topic: ISIB-01-2014
Funding scheme: Research and Innovation Action (RIA)
Document related to Deliverable:
D3.2 - Report synthesizing the findings of the CSR level mapping of public good
demand and supply, its underlying determinants, producers and beneficiaries
CSR REPORT SCOTLAND
Final version: 14/06/2016
Start date of project: 01 September 2015
Duration: 36 months
Organisation name of lead beneficiary for this deliverable:
The James Hutton Institute - JHI
Authors Anja Byg, Michela Faccioli, Paula Novo, Katrin Martens
Project funded by the European Commission within the Horizon 2020 Programme (2014-
2020)
Dissemination Level
PU Public x
PP Restricted to other programme participants (Including the Commission

2
Services)
RE Restricted to a group specified by the consortium (Including the
Commission Services)
CO Confidential, only for members of the consortium (Including the
Commission Services)

3
Content
Content ................................................................................................................................................................... 3
1 Introduction and case study identification ........................................................................................................ 4
2 Main maps available .......................................................................................................................................... 6
3 Main maps commented ..................................................................................................................................... 7
Annex 1 - Hotspot description form ..................................................................................................................... 17
Annex 2 – List of maps available ........................................................................................................................... 20
Annex 3 - Identification of large discrepancies with EU level maps ..................................................................... 24

4
1 Introduction and case study identification
This document reports the outcomes of the mapping activities (tasks 3.3-3.4) for the Scottish Case
Study Region (CSR), Aberdeenshire. It summarizes the availability of maps showing the distribution
of Public Goods (and Bads) in the CSR.
The report focuses on the public goods (PGs) and public bads (PBs) identified as most relevant in the
CSR by the stakeholders participating in the first PROVIDE case study region workshop in Scotland,
which took place in Aberdeenshire in February 2016.
The structure of the report is as follows: the document first includes a description of the context
characterizing the CSR (Aberdeenshire), then it provides an overview of available, relevant maps. In
the following section, it presents the maps of the most relevant PGs/PBs alongside with a discussion
around the underlying determinants of PG/PB provision. In Annex 1, two potential Aberdeenshire
case study areas for the subsequent phases of the PROVIDE project are presented. These were
identified on the basis of the first regional stakeholder workshop. A detailed list of the available
maps and datasets is included in Annex 2. Annex 3 provides downscaled versions of EU-level maps
produced by PROVIDE partners from the Vrije Universitet Amsterdam (VU) and the Natural
Resources Institute Finland (LUKE), together with digitalised versions of maps produced in a
participatory mapping exercise in the first regional stakeholder workshop in Aberdeenshire, and
comments on similarites and differences between local and EU level maps.
Aberdeenshire
The Scottish case study region consists of Aberdeenshire, located in the north-east of Scotland.
Aberdeenshire covers approximately 6,300 km2 and has a population of around 260,000 people
(excluding the city of Aberdeen). The economy of Aberdeenshire is closely connected to that of the
city of Aberdeen: the ‘oil and gas capital of Europe’. Many Aberdeenshire residents commute to
Aberdeen for work, whilst others are employed in agriculture, fishing or forestry (4.38% of the
Aberdeenshire population in 20111). The county’s main land use is agriculture, with large areas of
arable farming (producing predominantly barley, wheat and oilseed rape) in the eastern and
northern parts of the region and some pockets of marginal farming in the mountainous regions to
the west. While Aberdeenshire constitutes around 9% of the total land area of Scotland it has
around 26% of the total arable area of Scotland. The industry is worth £395million, and is
responsible for 30% of the oilseed rape and 28% of cereals outputs from Scotland1.
1 www.aberdeenshire.gov.uk/media/15921/land-based-sector-web.pdf

5
Around 19% of Aberdeenshire is covered in woodland (excluding the area that falls within the
Cairngorms National Park) which is close to the national average (18%). Most of this consists of
commercial conifer plantations and most is under private ownership. Semi-natural woodlands are
concentrated in the areas around the rivers Dee and Don. Similar to the national forest strategy,
Aberdeenshire aims to increase the amount of woodland cover to 25% of the total land area.
However, woodland expansion is by many considered controversial as woodlands are seen to
compete with agriculture over land2. In addition, in the upland areas there are conflicting interests
between forestry on the one hand, and management for game (such as grouse and deer) on the
other, which is an important income source for many estates. One of Scotland’s two National Parks,
the Cairngorms National Park, covers the western part of Aberdeenshire. The national park places
some planning restrictions on the land that falls within it (e.g. no wind turbine development), but it
does not preclude settlements or production oriented land uses such as forestry and agriculture. The
national park together with the area along the rivers Dee and Spey are major tourist destinations in
Scotland. Tourism constitutes another important revenue source in Aberdeenshire (estimated visitor
spending in 2013 was £220 million corresponding to roughly 5.5% of Aberdeenshire’s GDP). Tourism
is concentrated around outdoor activities such as hiking, fishing and sports shooting, as well as
historic monuments and the whisky industry.
2 www.aberdeenshire.gov.uk/media/15632/2016-0003845-2016-02-04-proposed-aberdeenshire-forestry-and-woodland-strategy-2016.pdf

6
2 Main maps available
The main source of publicly available maps is Scotland’s Environment Web (SEweb -
http://www.environment.scotland.gov.uk) which brings together environmental data and reports
from a wide range of organisations involved in environmental protection and improvement in
Scotland, including the Scottish Environment Protection Agency (SEPA), the Scottish Government,
Scottish Natural Heritage (SNH) and the Forestry Commission Scotland).
The following map layers available on SEweb are the most relevant in relation to the public goods
and bads identified as important for Aberdeenshire by the participants in the first regional
stakeholder workshop
(http://map.environment.scotland.gov.uk/seweb/map.htm?menutype=0&layers=2):
- Land cover based on the EUNIS classification of land uses
- Suitability for crops
- Water quality of surface water
- Water quality of ground water
- Designations
- Ancient woodlands
- Native woodlands
- Green space
- Core paths
- National scenic areas
All the maps are interactive, so that the scale can be adjusted by the user, though some information
(e.g. on native woodlands) is only visible at particular scales. In this report, screenshots of the maps
at the level of Aberdeenshire have been included as illustrations. The two potential hotspot areas
which may consitute the focus for the next phases of the PROVIDE project are indicated by circles.
These two areas are the area along the upper parts of the river Dee, in the south-western part of
Aberdeenshire, and the river Ugie catchment area in the north-eastern part of Aberdeenshire. More
details on the two areas are provided in Annex 1.

7
3 Main maps commented
Land cover and crop production potential
The map showing land cover in Aberdeenshire (map 1) provides a general overview over the
distribution of different agricultural land cover, forestry and other types of land cover in
Aberdeenshire. The map indicates areas of agriculture and forestry in Aberdeenshire and thus helps
set the scene for where we can expect to find major areas of production of public goods and bads
from agriculture and forestry in Aberdeenshire. However, the map does not provide information on
the agriculture or forestry system (apart from discerning between crop cultivation and grassland
areas).
Map 1. Land cover in Aberdeenshire (circles indicate potential case study areas)(source: http://www.environment.scotland.gov.uk)

8
The map showing potential for crop production (map 2) helps understand the current concentration
of different land uses in different areas of Aberdeenshire. Altogether, only a relatively small part of
Scotland’s land surface provides suitable conditions for intensive crop production due to factors such
as slope and soil quality. Generally speaking, the northern and eastern parts of Aberdeenshire are
where the more fertile and level areas are found, while the inland areas to the west become
gradually steeper and poorer quality soils, although pockets of level areas can still be found along
major rivers such as the Dee, Don and Spey. Crop production is therefore largely concentrated in
these areas, while land use shifts towards more extensive grazing in the upland areas (together with
other land uses such as forestry, shooting and recreation). On top of these large scale patterns local
variations can be found. Participants in the first stakeholder workshop thus pointed out that soil
quality can often vary on a very small scale, partly due to natural factors and partly due to the land
management. This means that higher level maps can sometimes be misleading in relation to
particular locations.
Map 2. Potential for crop production in Aberdeenshire (circles indicate potential case study areas)(source: http://www.environment.scotland.gov.uk)

9
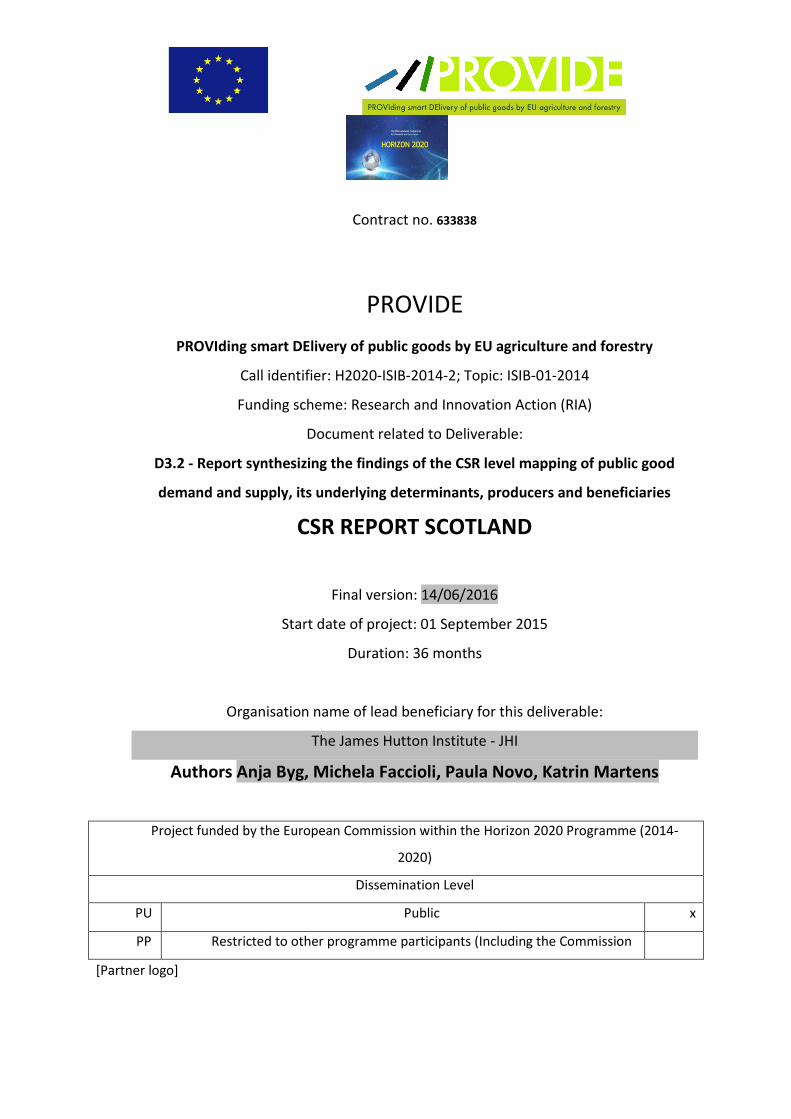
Surface water and ground water quality
Amongst the most important issues of public goods/bads highlighted in the first stakeholder
workshop in Aberdeenshire were issues of water quality and quantity/flows. The available maps
show that there substantial problems with water quality both in surface water (map 3) and
groundwater (map 4) in the north-eastern part of Aberdeenshire. Surface water is used as source of
drinking water in many places. In addition, water quality in rivers is also an issue for the whisky
industry and for recreational angling (which are important income sources in the area).
Map 3. Surface water quality in Aberdeenshire (circles indicate potential case study areas)(source: http://www.environment.scotland.gov.uk)
The areas with main problems in relation to water quality are predominantly situated in areas of
high intensity agriculture. One of the potential case study areas is situated in the northeast of
Aberdeenshire in an area of intensive agriculture, which was identified as one of the areas with
major water problems by the stakeholders, which is in accordance with the information indicated by
the available maps. The other potential case study area is on a gradient from low agriculture (in the
west) to more agriculture (in the east) and generally shows less water quality problems, though
there are some river tributaries where water quality is an issue. In addition, this area experienced
major flooding issues in the winter of 2015/16 which has sparked debates about the causes and the
10
right management of rivers as well as surrounding land as land management (in combination with
unusually heavy rainfalls) is seen as a major cause of flooding.
Map 4. Ground water quality in Aberdeenshire (circles indicate potential case study areas)(source: http://www.environment.scotland.gov.uk)
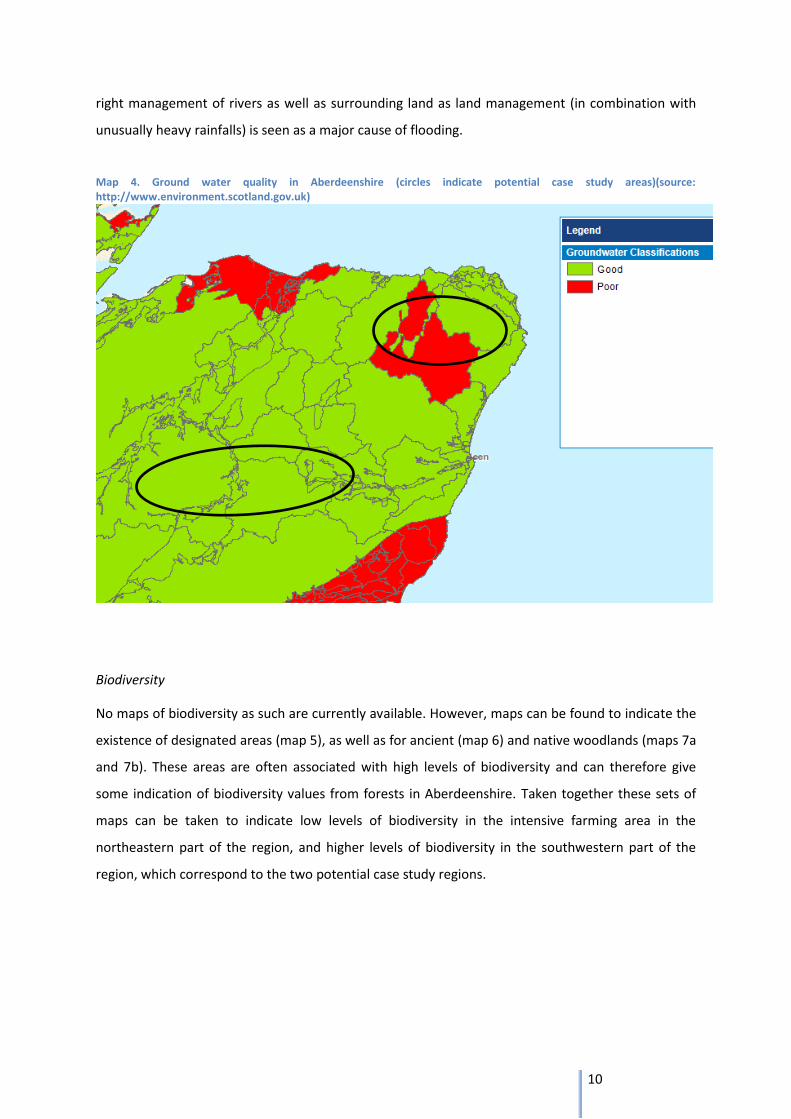
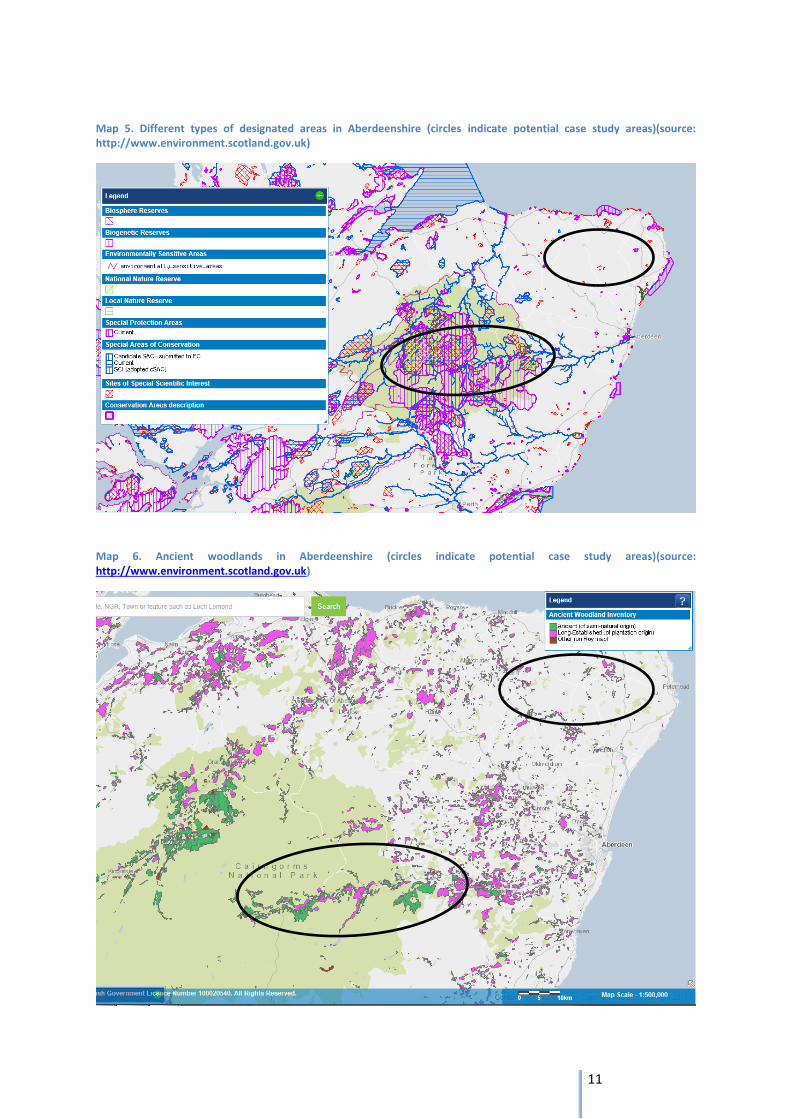
Biodiversity
No maps of biodiversity as such are currently available. However, maps can be found to indicate the
existence of designated areas (map 5), as well as for ancient (map 6) and native woodlands (maps 7a
and 7b). These areas are often associated with high levels of biodiversity and can therefore give
some indication of biodiversity values from forests in Aberdeenshire. Taken together these sets of
maps can be taken to indicate low levels of biodiversity in the intensive farming area in the
northeastern part of the region, and higher levels of biodiversity in the southwestern part of the
region, which correspond to the two potential case study regions.
11
Map 5. Different types of designated areas in Aberdeenshire (circles indicate potential case study areas)(source: http://www.environment.scotland.gov.uk)
Map 6. Ancient woodlands in Aberdeenshire (circles indicate potential case study areas)(source: http://www.environment.scotland.gov.uk)

12
Map 7. Native woodlands in the two potential case study areas (a) the northeastern part of Aberdeenshire (b) and the southwestern part (source: http://www.environment.scotland.gov.uk)
a)
b)

13
Recreation
Recreation constituted a frequently mentioned public good though it was not mapped by the
workeshop participants. Below we include maps which can give some indication of recreational
opportunities in Aberdeenshire. One is the map showing location of greenspace areas (map 8). The
other shows core paths in Aberdeenshire (Map 9). Greenspace is by definition only found around
more urban areas. While they might seem irrelevant in relation to public goods from agriculture and
forestry, we have included them here due to the growing importance afforded to urban forestry. The
map does not differentiate between different types of greenspace, and it is hence not possible to
see where urban forestry contributes to the recreational opportunities in Aberdeen. In neither one
of the two potential hotspot areas does greenspace feature very prominently.
Map 8. Greenspace in Aberdeenshire (circles indicate potential case study areas)(source: http://www.environment.scotland.gov.uk)

14
The distribution of core paths in Aberdeenshire is heavily biased towards the area immediately
surrounding the city of Aberdeen as well as the Cairngorms National Park, and areas along the
northern coast of Aberdeenshire. The latter two are the areas more closely associated with tourism
in Aberdeenshire, but these areas are also important recreational areas for the local inhabitants.
Most core paths are located in mountainous areas and along major river courses though many also
run through forest areas for part of their course. Few core paths are situated in agricultural areas, as
indicated by the lack of core paths in the north-eastern part of Aberdeenshire. However, this does
not mean that there are no paths in these areas. While the absence of core paths indicates that
these areas are not major (walking) tourism areas, they may still be important as recreational areas
for local people in those areas.
Map 9. Core paths in Aberdeenshire (circles indicate potential case study areas)(source: http://www.environment.scotland.gov.uk)

15
The map showing designated National Scenic Areas (map 10) also gives an indication of areas
important for recreation and tourism, as well as for landscape, scenery and aesthetics, which were
also frequently mentioned public goods. The only designated National Scenic Areas in
Aberdeenshire are found within the Cairngorms National Park. This indicates the national
importance of this area which is considered iconic for Scotland and is a major tourist destination.
The main reason for the iconic status of this area can be found in the topography as this area
contains many of the highest mountains in the UK. Agriculture and forestry do, however, impact on
the scenic quality of this as well as of other areas. The iconic mountain landscapes of Scotland are
currently largely without forests and are kept open through grazing (by deer and/or sheep) as well as
periodic burning in some areas (to keep the vegetation open to promote grouse populations). There
are thus debates around the right amount, location and types of forests, not just in Aberdeenshire
but in Scotland in general, and conflicts around different types of recreation, biodiversity, timber
production and climate mitigation.
The lack of designations in other parts of Aberdeenshire does not mean that other areas do not
provide important landscape and asthetic values to local inhabitants, though participants indicated
that intensity of agriculture was negatively linked to aesthetic qualities of the landscape.
Map 10. National scenic areas (circles indicate potential case study areas)(source: http://www.environment.scotland.gov.uk)

16
Digitalised versions of the maps produced by participants at the first Aberdeenshire regional
PROVIDE workshop showing hotspots and cold spots of important public goods and bads from
agriculture and forestry are show in Annex 3. Likewise, downscaled maps based on EU level data,
produced for PROVIDE by the project teams from VU and LUKE are included in Annex 3 and the
results from the two sets of maps are compared to each other.
The potential case study hotspots for Scotland
The two potential case study hotspots for Scotland (the Upper Deeside and the Ugie catchment)
were initially selected based on the mapping activity and discussions held during the first
stakeholder workshop in Aberdeenshire in February 2016. The publicly available maps included in
this report confirm that these two area show very contrasting cases of public goods and bads from
agriculture and forestry.
The Ugie catchment is an area of intensive agriculture which is seen to have serious, negative
impacts on the water quality of rivers and lochs in the area due to the use of molluscicides and other
agricultural chemicals. The intensive agriculture also produces public bads in the form of low levels
of biodiversity and negative impacts on landscape quality. At the same time, however, the area is
seen as important in terms of food production especially in light of the relative scarcity of productive
land in Scotland, and thereby also contributes to the economics and rural vitality of the area. Most
of the agriculture in the area is in the form of owner-occupied individual farms.
The upper Deeside presents a very different picture. Agriculture does not play an important part
here. Instead forestry and recreational activities such as shooting and fishing are more important,
and ownership is characterised by large, private estates. The area is seen to produce many public
goods in the form of recreational and scenic values though there are some problems, mainly in
relation to water quality and quantity and conflicts between different interests. While the regional
authorities are keen to expand the forest cover in this as well as other parts of Aberdeenshire as part
of Scotland’s climate mitigation obligations, this is contrary to sports shooting interests and also to
the scenic qualities that many associate with the upland areas of Scotland. Furthermore, recent
floods have highlighted the impacts of land management practices on water run-off, and have
highlighted the interconnected nature of upland land uses and downstream problems.
17
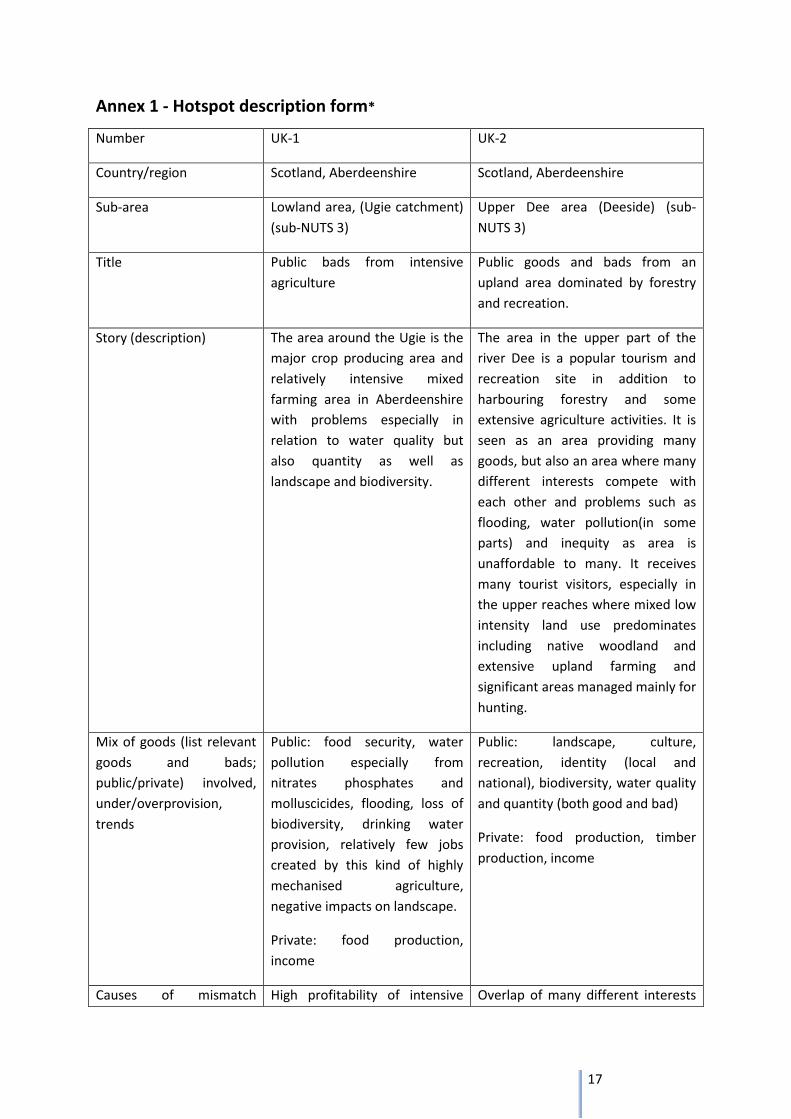
Annex 1 - Hotspot description form*
Number UK-1 UK-2
Country/region Scotland, Aberdeenshire Scotland, Aberdeenshire
Sub-area Lowland area, (Ugie catchment)
(sub-NUTS 3)
Upper Dee area (Deeside) (sub-
NUTS 3)
Title Public bads from intensive
agriculture
Public goods and bads from an
upland area dominated by forestry
and recreation.
Story (description) The area around the Ugie is the
major crop producing area and
relatively intensive mixed
farming area in Aberdeenshire
with problems especially in
relation to water quality but
also quantity as well as
landscape and biodiversity.
The area in the upper part of the
river Dee is a popular tourism and
recreation site in addition to
harbouring forestry and some
extensive agriculture activities. It is
seen as an area providing many
goods, but also an area where many
different interests compete with
each other and problems such as
flooding, water pollution(in some
parts) and inequity as area is
unaffordable to many. It receives
many tourist visitors, especially in
the upper reaches where mixed low
intensity land use predominates
including native woodland and
extensive upland farming and
significant areas managed mainly for
hunting.
Mix of goods (list relevant
goods and bads;
public/private) involved,
under/overprovision,
trends
Public: food security, water
pollution especially from
nitrates phosphates and
molluscicides, flooding, loss of
biodiversity, drinking water
provision, relatively few jobs
created by this kind of highly
mechanised agriculture,
negative impacts on landscape.
Private: food production,
income
Public: landscape, culture,
recreation, identity (local and
national), biodiversity, water quality
and quantity (both good and bad)
Private: food production, timber
production, income
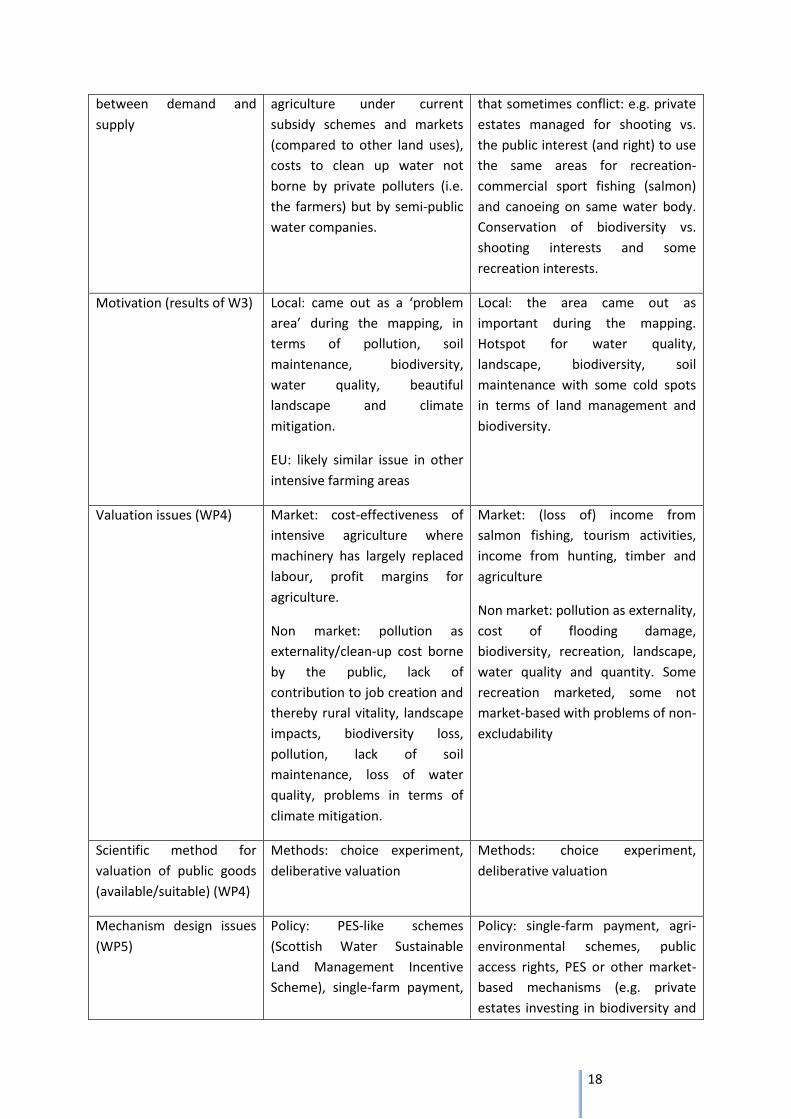
Causes of mismatch High profitability of intensive Overlap of many different interests
18
between demand and
supply
agriculture under current
subsidy schemes and markets
(compared to other land uses),
costs to clean up water not
borne by private polluters (i.e.
the farmers) but by semi-public
water companies.
that sometimes conflict: e.g. private
estates managed for shooting vs.
the public interest (and right) to use
the same areas for recreation-
commercial sport fishing (salmon)
and canoeing on same water body.
Conservation of biodiversity vs.
shooting interests and some
recreation interests.
Motivation (results of W3) Local: came out as a ‘problem
area’ during the mapping, in
terms of pollution, soil
maintenance, biodiversity,
water quality, beautiful
landscape and climate
mitigation.
EU: likely similar issue in other
intensive farming areas
Local: the area came out as
important during the mapping.
Hotspot for water quality,
landscape, biodiversity, soil
maintenance with some cold spots
in terms of land management and
biodiversity.
Valuation issues (WP4) Market: cost-effectiveness of
intensive agriculture where
machinery has largely replaced
labour, profit margins for
agriculture.
Non market: pollution as
externality/clean-up cost borne
by the public, lack of
contribution to job creation and
thereby rural vitality, landscape
impacts, biodiversity loss,
pollution, lack of soil
maintenance, loss of water
quality, problems in terms of
climate mitigation.
Market: (loss of) income from
salmon fishing, tourism activities,
income from hunting, timber and
agriculture
Non market: pollution as externality,
cost of flooding damage,
biodiversity, recreation, landscape,
water quality and quantity. Some
recreation marketed, some not
market-based with problems of non-
excludability
Scientific method for
valuation of public goods
(available/suitable) (WP4)
Methods: choice experiment,
deliberative valuation
Methods: choice experiment,
deliberative valuation
Mechanism design issues
(WP5)
Policy: PES-like schemes
(Scottish Water Sustainable
Land Management Incentive
Scheme), single-farm payment,
Policy: single-farm payment, agri-
environmental schemes, public
access rights, PES or other market-
based mechanisms (e.g. private
estates investing in biodiversity and

19
agri-environmental schemes. recreation as a source of income,
biodiversity offsetting mechanisms).
Environmental NGOs ownership of
some areas.
Scientific methods for
evaluation of appropriate
governance strategies
(available/suitable) (WP5)
Methods: scenarios,
games/experiments
Methods: scenarios,
games/experiments
Theoretical/conceptual
issues (WP6)
Interaction between different
policies and delivery of multiple
benefits.
Distributional issues: who gains
and who loses? Interplay
between multiple public goods
(or avoided public
bads).Interplay between
different possible policy
instruments.
Interaction of extensive agriculture
and forestry with each other and in
relation to conservation and other
land uses such as recreation.
Justice/equity issues and
distributional issues: who gains and
who loses? Property right issues.
Interplay between multiple public
goods (or avoided public bads).
Interplay between different possible
policy instruments.
Decision
making/information
needs (WP6)
Social acceptability and equity
of policy measures. Social
welfare and economic value.
Prioritizing interventions.
Consideration of multiple
criteria when taking decisions?
Social acceptability of policy
measures (economic value).
Prioritizing interventions.
Consideration of multiple criteria
when taking decisions.
*Preliminary hotspot description which will be subject to refinements following the second regional
stakeholder workshop in June 2016

20
Annex 2 – List of maps available
Map Source Licence issue
1. Publicly available maps http://www.
environment
.scotland.gov
.uk)
Open data
Land cover based on the EUNIS classification of
land uses
http://map.e
nvironment.s
cotland.gov.
uk/seweb/m
ap.htm?men
utype=0&lay
ers=2
Open data
Suitability for crops http://map.e
nvironment.s
cotland.gov.
uk/seweb/m
ap.htm?men
utype=0&lay
ers=2
Open data
Water quality of surface water
http://map.e
nvironment.s
cotland.gov.
uk/seweb/m
ap.htm?men
utype=0&lay
ers=2
Open data
Water quality of ground water http://map.e
nvironment.s
cotland.gov.
uk/seweb/m
ap.htm?men
utype=0&lay
ers=2
Open data
Designations (including National parks, areas of
special scientific interests, national scenic areas,
national nature reserves, special areas of
conservation, special protection areas)
http://map.e
nvironment.s
cotland.gov.
uk/seweb/m
ap.htm?men
utype=0&lay
Open data

21
ers=2
Ancient woodlands http://map.e
nvironment.s
cotland.gov.
uk/seweb/m
ap.htm?men
utype=0&lay
ers=2
Open data
Native woodlands http://map.e
nvironment.s
cotland.gov.
uk/seweb/m
ap.htm?men
utype=0&lay
ers=2
Open data
Green space http://map.e
nvironment.s
cotland.gov.
uk/seweb/m
ap.htm?men
utype=0&lay
ers=2
Open data
Core paths http://map.e
nvironment.s
cotland.gov.
uk/seweb/m
ap.htm?men
utype=0&lay
ers=2
Open data
National Scenic Areas http://map.e
nvironment.s
cotland.gov.
uk/seweb/m
ap.htm?men
utype=0&lay
ers=2
Open data
2. Other maps
Land Cover Map 2000
Centre for
Ecology and
Requires
permission. The
data is for use in

22
Hydrology non-commercial
projects only.
Land Cover Map 2007 Centre for
Ecology and
Hydrology
JHI has licence
for non-
commercial use.
National Forestry Inventory - Scotland Forestry
Commission
License.
Intellectual
Property Rights
Land Capability for Agriculture
Macaulay
Land Use
Research
Institute /
James
Hutton
Institute
Land Capability for Forestry
Macaulay
Land Use
Research
Institute /
James
Hutton
Institute
Land Cover of Scotland 1988 Macaulay
Land Use
Research
Institute /
James
Hutton
Institute
Scotland's Greenspace Map (SGM)
Data distributed by the Central Scotland Green
Network Support Unit, Central Scotland Forest Trust
Licence use: Data
is provided under
the terms of the
One Scotland
Mapping
Agreement. Any
use of the data
should be
accompanied by
a watermark and

23
copyright
statement as
detailed in the
metadata.
Copyight
Statement:
Reproduced by
permission of
Ordnance Survey
on behalf of
HMSO. Crown
copyright and
database right
2011. All rights
reserved.
Ordnance Survey
Licence number
100002151
Indicative River & Coastal Flood Map (Scotland) Scottish
Environment
al Protection
Agency
For non-
commercial
projects only

24
Annex 3 – comparison of downscaled EU level maps and maps produced by
stakeholders.
This section contains digitised images of selected public goods/bads mapped by participants of the
first Aberdeenshire PROVIDE workshop in February 2016 in a participatory mapping exercise, and
downscaled maps based on EU level data produced by the PROVIDE project teams from VU and
LUKE. In most cases, the public goods/bads mapped by the workshop participants do not correspond
directly to the type of data available at the EU level which in itself is an important source of
discrepancies between the two sets of maps. Workshop participants for example often included
several issues in one map (e.g. water quality and quantity in one map; pollution of air, water, and
soil in one map). In addition, the workshop participants were limited to identifying seven good/high,
intermediate and bad/low areas respectively for each selected public good and their maps did
therefore not provide a full coverage of the entire region. In the following we show and compare the
downscaled EU level maps and workshop maps that are most closely related to each other in terms
of their content.
Summary of public goods and bads
The first set of maps is a compilation of all the different public goods (and bads) which were mapped
based on the EU level data and in the workshop, respectively.
Map 11. Summary of public good hotspots based on EU-level data

25
Map 12. Summary of all the public good hot- and coldspots identified by workshop participants
In comparison to the downscaled EU level map, the summary of hot- and coldspots identified by the
workshop participants in Aberdeenshire shows a more spread distribution of both hot- and
coldspots. This is due to both differences in issues which the participants focussed on compared to
the available EU level maps as well as the more detailed local knowledge of the participants. The
latter meant that participants pointed out particular river stretches, lochs, or local areas based on
detailed knowledge about these places. However, it also meant that there were areas that they
knew less well, which were therefore not pointed out on the maps as either hot- or coldspots. This
was especially the case for issues such as soil status, where the participants pointed out that this
often varied from field to field depending on the practices of individual farmers and that they could
hence only talk about localities that they knew well.

26
Biodiversity
The second set of maps relates to biodiversity. Two of the EU level maps (map 13) focus on
agrobiodiversity and farmland birds in particular, while the map produced by the workshop
participants showed hot- and coldspots for biodiversity more generally. Biodiversity in general (as
mapped by the workshop participants, right part of map 14) was seen to be negatively related to
agriculture and participants thus mainly marked non-agricultural areas which they regarded as most
natural as biodiversity hotspots. Agricultural areas were hence generally mapped as biodiversity
coldspots in the workshop. In contrast, agrobiodiversity is per definition linked to agricultural areas.
The two sets of maps thus have opposite focus and indicate different areas as important. Several of
the hotspots indicated by the workshop participants are thus located in the ‘lower’ 20% for
agrobiodiversity, whereas several coldspots identified in the workshop are within the central or
higher 20% areas for agrobiodiversity.
Map 13. Agrobiodiversity (species richness) (left) and species richness of farmland birds (right) based on EU level data
The EU level map most closely comparable to the hot- and coldspots mapped by the workshop
participants is that of habitat suitability for megafauna (left side of Map 14). While there is closer
correspondance for areas such as the Upper Deeside, there are still important differences in what
was mapped. Workshop participants for example also included coastal areas which are well-known
breeding areas for charismatic birds such as puffins. In contrast, intensive agricultural areas are
included in the EU level map as being in the central 60% of habitat suitable for megafauna, while
these areas were generally rated as coldspots by workshop participants. Again, the discrepancy is
most likely due to what species are considered with workshop participants focusing more on the

27
rare and charismatic as well as high biodiversity levels in general, and not on megafauna as such
which in Scotland includes many common species which are considered ‘problem species’ such as
deer, foxes and badgers (due toe their negative impacts on foresry and agriculture).
Map 14. Habitat suitability for megafauna (left) based on EU level data and biodiversity hot- and coldspots identified by worskhop participants (right)
Soil
The map based on EU-level data shows erosion prevention based on work by Pérez-Soba, Verburg
and Koomen (2010)3 (left part of map 15). In contrast, the map produced by workshop participants
shows hot- and coldspots for soil quality, problems and maintenance more generally. Hence, the two
maps show similarities and differences as their content is related though not identical. The EU-based
map identifies areas in the north/northeast portion of Aberdeenshire as areas with a high erosion
prevention capacity, presumably to the relatively level topography in this area. The same area was
pointed out as problem area in the local stakeholder map. This was linked to declining soil quality
linked to the conversion of land from grazing to intensively farmed crop land. Another point of
discrepancy concerns the Deeside and Cairngorm National Park area, which is classified, based on EU
downsized maps, as displaying average erosion prevention properties possibly due to its landscape
structure (altitude), while most of the Cairngorms National Park was by the stakeholders considered
to have good soil status due to the predominance of non-agricultural land use (and hence ‘natural’
3 Pérez-Soba M, Verburg PH, Koomen E. 2010. Land use modeling-implementation. Preserving and enhancing the environmental benefits of “land-use services”. Report to the European Commission DG Environment under contract No.07.0307/2008/511790/SER/G1. Wageningen, The Netherlands

28
or undisturbed nature of the soil). In both cases, these differences in maps can be explained by the
fact that good soil management as mapped by the workshop participants encompassed more than
just erosion control. When mapping soils hot- and coldspots workshop participants pointed out that
soil quality often varies over small distances, and with the geological and physical characteristics of
the specific site as well as on the practices of the individual farmer or forester. Hotspot areas were
indicated by stakeholders to be those with the best management practices, as well as wild areas, as
these are relatively untouched by human interaction. Coldspots, however, are found in areas
identified as most suitable for grazing/ grassland which have subsequently been transformed into
cropland. In both stakeholders and EU-based maps, lower erosion protection is pointed out in areas
with high ground sealing (e.g. Aberdeen city) and good soil conditions were identified in the south-
east of Aberdeenshire.
Map 15. Erosion Prevention in Aberdeenshire (left) based on EU level data and soil maintenance hot- and coldspots (right) identified by workshop participants
Water
The map based on EU level data shows flood regulation supply, while the map produced by local
stakeholders shows areas with issues of water quality as well as water quantity. The two maps are
therefore not directly comparable, though some of the same areas, such as the Deeside, are

29
highlighted in both maps. Based on Stürck et al. (2014)4 high capacity of flood regulation supply is
characterized by large patches of natural vegetation or extensive agriculture, which is the type of
land structure characterizing the Deeside. However, this area was one of the worst hit areas by the
2015/16 winter floods and flooding issues were also highlighted for this area by the workshop
participants. Cold spot areas are pointed out in both maps in the north-east and south-east of
Aberdeenshire. These are areas with intensive used farmland, less natural vegetation and
characterized by problems of water pollution.
Map 16. Flood Regulation Supply (left) based on EU level data and cold- and hotspots for water quality (right) identified by workshop participants
4 Stürck J, Poortinga A, Verburg PH. 2014. Mapping ecosystem services: The supply and demand of flood regulation services in Europe. Ecological Indicators 38: 198211.

30
Carbon sequestration and climate mitgation
The EU-based map of carbon sequestration, based on work developed by Schulp, Nabuurs and
Verburg (2008) is in line with stakeholders-based maps for climate mitigation. Both maps show that
within Aberdeenshire there are hotspot areas of carbon sequestration within the borders of the
Cairngorms National Park and along the Dee River, where forests are abundant, and coldspot areas
in the north-east of Aberdeenshire especially due to intensive farmland practices. In fact, as
reported in Schulp et al. (2008)5, total carbon sequestration is mainly determined by the availability
of forests, the rate of emissions from cropland and deforestation and the small amounts of
sequestration in pastures and abandoned land.
Map 17. Carbon sequestration (left) based on EU level data and hot- and coldspots for climate mitigation (right) identified by workshop participants.
5 Schulp CJE, Nabuurs G-J, Verburg PH. 2008. Future carbon sequestration in Europe-Effect of land use change. Agriculture, Ecosystems & Environment 127:251-264.

Contract no. 633838
PROVIDE
PROVIding smart DElivery of public goods by EU agriculture and forestry
Call identifier: H2020-ISIB-2014-2; Topic: ISIB-01-2014
Funding scheme: Research and Innovation Action (RIA)
Start date of project: 01 September 2015 Duration: 36 months
Document related to Deliverable:
D3.2 - Report synthesizing the findings of the CSR level mapping of public good
demand and supply, its underlying determinants, producers and beneficiaries
CSR REPORT FINLAND
Organisation name of lead beneficiary for this document:
Natural Resources Institute Finland (Luke)
Authors: A. Juutinen, T. Hujala, R. Store, H. Parikka & M. Kurttila
Project funded by the European Commission within the Horizon 2020 Programme (2014- 2020)
Dissemination Level
PU Public X
PP Restricted to other programme participants (Including the
Commission Services)
RE Restricted to a group specified by the consortium (Including the
Commission Services)
CO Confidential, only for members of the consortium (Including the
Commission Services)
PROVIDE CSR North Ostrobothnia
Content
1 Introduction and case study identification ......................................................................................... 3
2 Main maps available ........................................................................................................................... 4
3 Main maps commented ...................................................................................................................... 5
4 Main results of the questionnaire (descriptive average tables) .......................................................11
5 Implications .......................................................................................................................................14
6 Annex 1 – Hotspot description form .................................................................................................15

PROVIDE CSR North Ostrobothnia
1 Introduction and case study identification
This document reports the outcomes of the mapping activities (tasks 3.3-3.4) and some tasks that
supported these activities for the Finnish case study region (CSR) North Ostrobothnia. For this
purpose, the availability of maps and datasets on the provision of Public Goods (and Bads) – PGs/PBs
– in the CSR was explored, with a special emphasis on use pressures (PG demand factors) from
recreation, tourism services, second homes, and visual sensitivity of the landscape. In particular, the
report discusses the most relevant PGs in the regional context, their producers and beneficiaries,
location of supply and demand. It also briefly examines the prime determinants affecting their
provision such as the role of public policy instruments and market-based mechanisms in the light of
the stakeholder survey results.
The report focuses on the PGs/PBs identified as the most relevant in the CSR by the stakeholders
participating to the first and second workshops of the Case Study Stakeholder Platform, which were
held on February 25th and June 14th, 2016 in Oulu, northern Finland.
The report firstly includes a description of the main issues characterizing the CSR itself, then an
overwiew of the available maps and datasets. Subsequently, the maps related to the most relevant
PGs/PBs are presented and commented from the viewpoint of factors affecting their provision.
Finally, the the report provides implications of the results of the mapping activities for the
identification of hotspots, as focus areas of research within the CSR in WPs 4-6, are explained.
The Finnish CSR is region “North Ostrobothnia” (Fig. 1), a sub-national administrative region in
northern Finland (NUTS3 FI1D6). The area has a surface of approx. 44.000 km2 and counts approx.
405.000 inhabitants. It contains 29 municipalities and 11 cities with Oulu as the capital. The share of
forest land in the region is 88%, and typical elements of landscape contain hill areas in the
northeastern part, rivers and river valleys in the western part, and flat peatland areas in the Center.
Figure 1 – Location and typical views of North Ostrobothnia.

PROVIDE CSR North Ostrobothnia
2 Main maps available
In Finland, including the North Ostrobothnia CSR, detailed (20 x 20 m grid) spatial information on
forest resources, based on National Forest Inventory results, is openly available via the map service
of the Natural Resources Institute Finland, currently at http://kartta.luke.fi/index-en.html. In
addition, open spatial data from various sectors, including environmental, geological, and historical
datasets, are available at Paikkatietoikkuna [“Geographic Information Window”] service hub
(http://www.paikkatietoikkuna.fi/web/en/frontpage), maintained by the National Land Survey.
Relating more directly to PG supply, the PROVIDE D3.1 (Komossa et al. 2016) presents twelve
characteristics, for which maps are available in 1km resolution throughout EU27, including North
Ostrobothnia (see Fig. 3), thus allowing comparative analyses. These characteristics include Species
richness – separately for agrobiodiversity, farmland birds and vascular plants, carbon sequestration,
erosion prevention, flood regulation, megafauna, cultural landscape indices for agro and forest,
pollination visitation probability and flows, and nature tourism.
Regarding PG demand, geographical information exists to process and derive maps from the Finnish
CSR for various use pressure characteristics, such as recreation, tourism services, second homes, and
visual sensitivity of the landscape. This work has been carried out in some earlier projects (e.g. Store
et al. 20151), but the results and experiences support the activities of PROVIDE as well. In Kuusamo,
these use pressures relate particularly to the recreational use of forests and nature-based tourism,
and they can be served by smart delivery of landscape and recreational values as well as water
quality, which were the most relevant PGs in North Ostrobothnia according to the workshop
participants. In the following section, examples of the above PG/PB supply and demand maps are
presented both from the eastern part of the CSR, Ruka-Kuusamo and western part (south from Oulu).
Subsequently , these are discussed from the perspectives of hotspot selection, providers and
beneficiaries of PGs, and supporting governance mechanisms.
1 STORE, RON, KARJALAINEN, EEVA, HAARA, ARTO, LESKINEN, PEKKA, NIVALA, VESA. 2015. Producing a
sensitivity assessment method for visual forest landscapes. Landscape and Urban Planning 144: 128-141.

PROVIDE CSR North Ostrobothnia
3 Main maps commented
In this section, maps concerning the level of provision of the EU27-comparable PGs in the Finnish CSR
are first presented, followed by an overlay map of the different PGs aiming to aid clarifying hotspot
areas within the CSR, which were initially identified in the first stakeholder workshop. Two main
hotspots initially identified were Ruka-Kuusamo tourism area (PG: forest landscape), and south-west
river valley and coastal area (PG: water quality).
Figure 2a – PG supply in the Finnish CSR area (source: PROVIDE D3.1; Komossa et al. 2016), part a.

PROVIDE CSR North Ostrobothnia
Figure 2b – PG supply in the Finnish CSR area (source: PROVIDE D3.1; Komossa et al. 2016); part b.
Fig. 2 above shows that indeed, stakeholders’ perception of the PG supply for nature tourism in the
Ruka-Kuusamo area (the northern corner of the CSR) gets support from the map data. That area is
also relatively rich in terms of forest cultural landscape. To summarize, researching the provision of
landscape and recreational values in more detail Ruka-Kuusamo hotspot area appears reasonable.
The other suggested hotspot area, the coastal area and river valleys in the south-west of the CSR, is
in the maps notably rich in pollination, agro landscape, vascular plants, and erosion prevention.
These mapped features have only indirect links to water quality, which was considered the important
PG in the area, affected by intenstive agriculture. The learning here is that in the south-west hotspot
area, multiple-PG provision may be worth investigating.

PROVIDE CSR North Ostrobothnia
Figure 3 – Overlay of different PGs in North Ostrobothnia.
Figure 3 above shows that when overlaying the number of different PGs (among the 12 in Fig. 2) with
high supply in one figure, the potential multi-PG hotspots can be located in a few areas within North
Ostrobothnia. On one hand, the Ruka-Kuusamo area in the north and the river valley are in the south
can be distinguished. On the other hand, there are interesting hotspot candidates in the south of
Ruka-Kuusamo and in the middle of the CSR map. Taken the very high nature-based tourism and thus
PG demand pressure, Ruka-Kuusamo can however be delianed as a smaller PG hotspot. The high
supply zones in the centre of the map may in turn be considered to be included in the river valley
hotspot as those areas mainly follow the rivers and are close to highly populated places.
There exist information also for water quality, which was voted among the most important PGs by
regional stakeholders. The Finnish Environment Institute is publishing through a nationwide service
maps that illustrate the water quality of lakes, rivers and the sea
(http://paikkatieto.ymparisto.fi/vesikartta/). The map service can be zoomed to region and even to
water system-level and it offers information on the properties of the mapped water systems. Figure
4 illustrates the properties of this map service. From figure it can be seen that the condition of river
and sea waters near the case study region is good or moderate and clearly better if compared to
situation e.g. in South-East Finland sea area. However, also locally poor quality river waters can be
seen from the more detailed map from the area located south from the city of Oulu. It can be that
these poor quality water quality rise negative opinions and pressures to improve the situation.

PROVIDE CSR North Ostrobothnia
Figure 4 – Water map from Southern Finland (left) showing the water quality and ecological status and more detailed map on the western part of the North Ostrobotnia CSR (right) area. Orange and red colours indicate poor quality river waters.
Fig. 5 below shows the location of the Kuusamo city, which is the suggested focus area for studying
landscape and recreational values as PGs and how forestry affects them. Figure 6 (a-d) shows the
selected demand factors of these PGs, namely recreation, tourism services, second homes, and the
overall visual sensitivity of the landscape (based on the work by Store et al. 2015).
Figure 5 – Index map of Kuusamo, the landscape and recreational values hotspot.

PROVIDE CSR North Ostrobothnia
a) Use pressure from outdoor recreation in Kuusamo. b) Use pressure from tourism services in Kuusamo.
c) Use pressure from second homes in Kuusamo d) Visual sensitivity of landscape in Kuusamo.
Figure 6. Indications on the demand of PGs related to recreation and landscapes in Kuusamo. The “mini-hotspots” in the maps show the location of the Kuusamo city (in the middle part of the map) and the location of the tourism resort Ruka (northern mini-hotspot). Visual sensitivity of the landscape is a generic indicator based on the demand and supply factors and described in detail by Store et al. (2015).
PROVIDE CSR North Ostrobothnia
Fig. 6a demonstrates the concentration of hiking/skiing routes as well as local population centre and
conservation areas in Ruka-Kuusamo. The map also illustrates that the outdoor recreation pressures
are scattered next to the main lakes of the region and that the large natural park in the north is well
connected from the Ruka skiing resort.
In Fig. 6b the high concentration of major tourism services next to the Ruka skiing resort and to the
centre of Kuusamo city in the middle of the area become evident. However, several tourism services
and places offering e.g. cottage accommodation can be found elsewhere from Kuusamo due to rich
nature and existence of protection areas that are worth visiting. In addition, one should note that
this map only shows the accommodation locations, while the organized tourism activities may be
scattered in the landscape along the hiking/skiing routes and special locations offered by the tourism
entrepreneurs.
Fig. 6c above shows that there are a lot of second homes (summer/winter cottages) around and
between the Ruka skiing resort and Kuusamo city centre, constituting high use pressure for
landscape and recreational values in these areas and also next to the roads that are used to arrive to
these places. It is also notable that many cottages can be found along the shores of the main lakes,
meaning that the use pressures are scattered widely within Kuusamo, as illurstrated by the
numerous small red dots on the map.
Fig. 6d shows, as a result of geographical analysis (Store et al. 2015), how sensitive the visual
landscape is to changes. The sensitivity index is a product of various factors (based on GIS data and
analyses) that were prioritized with multi-criteria based approach. The main factors comprise
visibility, use pressure, and attractiveness of the scenery as the main criteria. The map shows higher
index values around the Ruka ski resort, Kuusamo city centre and along the main roads to
neighbouring cities and to the national park. Relatively high landscape sensitivity can also be found
around the lakes.

PROVIDE CSR North Ostrobothnia
4 Main results of the questionnaire (descriptive average tables)
Figure 9 – The best description for the concept of public goods according to the Finnish respondents (n=9).
Figure 10 – The average importance of PGs in North Ostrobothnia CSR according to the Finnish respondents (n=9).

PROVIDE CSR North Ostrobothnia Table 1 – Perception by the Finnish respondents of which factors contribute to the provision of public goods.
Table 2 – Perception by the Finnish respondents of where public goods are mainly provided in the CSR.
Table 3 – Perception by the Finnish respondents of the main issues concerning PGs in general.
Public goods
PGs are direct results
of land management
by farmers and
foresters complying
with the
environmental
regulations
PGs are direct
result of
agriculture and
forestry fostered by
CAP funding
PGs are direct result
of the increasing
pressure and control
exerted by society on
farmers and
foresters
PGs are direct result
of market demand
for healthier, more
sustainable
agricultural and
forestry products
PGs are direct result
of technological
advancement and
innovation in
agriculture and
forestry
Landscape and scenery 3 3 1 1 1
Farmland biodiversity 7 5 1 2 0
Water quality and availability 7 5 3 1 3
Air quality 2 2 1 1 3
Soil functionality 3 1 1 1 2
Climate stability 2 1 2 1 2
Resilience to flooding and fire 3 0 1 0 1
Rural viability and vitality 2 2 1 1 3
Production quality and security 3 1 2 6 3
Animal health and welfare 5 1 5 5 4
Public goods
On the
riversides
and river
valleys
Hilly
areas
Mountain
areas
Plain
areas
Specific
production
areas
Meadow
and
pasture
areas
Areas with
cultural and
historical
values
Almost
homoge-
neously
widespread
Forest and
woodlands
Landscape and scenery 7 5 0 5 3 6 6 1 8
Farmland biodiversity 6 0 0 4 2 6 1 1 0
Water quality and availability 4 2 0 2 0 0 0 3 4
Air quality 0 3 0 0 0 0 0 4 4
Soil functionality 2 0 0 1 1 2 0 2 3
Climate stability 0 2 0 0 0 0 0 4 5
Resilience to flooding and fire 4 1 0 3 1 1 0 1 5
Rural viability and vitality 4 0 0 5 2 3 2 1 5
Production quality and security 3 0 0 4 1 1 0 3 3
Animal health and welfare 1 0 0 3 2 4 0 2 3
Public goods
PGs are stil l
theoretical concepts,
society has no
perception of the
role of farmers and
foresters as land
managers
Inadequate
funding for
compensation of
farmers and
foresters adopting
sustainable
practices
Conflicts of
interests and
uses between
different
stakeholders
Development
and trade-offs
between
different land
uses
Problems
related to the
urban
sprawling,
rural land
abandonment
Public access
to public
goods; land
tenure and
property
issues
Landscape and scenery 4 5 7 4 2 4
Farmland biodiversity 3 5 3 3 0 0
Water quality and availability 3 5 6 4 0 2
Air quality 3 3 1 0 0 1
Soil functionality 5 4 0 1 0 0
Climate stability 6 4 3 3 0 1
Resilience to flooding and fire 5 4 3 2 0 2
Rural viability and vitality 2 4 3 2 5 1
Production quality and security 3 2 2 0 2 0
Animal health and welfare 1 2 6 1 0 1

PROVIDE CSR North Ostrobothnia Table 4 – Main motivations of farmers and foresters to manage the land for the provision of PGs according to the Finnish stakeholders.
Table 5 – The Finnish respondents’ opinion on which mechanisms could be used to increase the provision of PGs.
Public goods
Compliance
with
regulations
(e.g. land-use
restrictions,
nuisance
taxes)
Desire of
preserving their
own health and
increasing their
working
conditions and
life quality
Market
demand for
high quality
and
sustainable
products (e.g.
local products)
Receiving
advantages for
their activities from
the provision of
PGs (e.g. marketing
through landscape
improvement)
CAP (Common
Agricultural
Policy) direct
payments and
other
incentives
CAP support to
farmers and
foresters
trough Rural
Development
Plans
Landscape and scenery 5 3 2 2 4 4
Farmland biodiversity 3 1 1 0 7 6
Water quality and availability 7 3 1 1 6 7
Air quality 2 2 0 1 2 2
Soil functionality 3 1 1 0 3 3
Climate stability 3 1 2 0 3 3
Resilience to flooding and fire 3 1 0 0 2 2
Rural viability and vitality 2 5 0 1 4 5
Production quality and security 6 2 4 1 4 3
Animal health and welfare 6 2 4 1 4 3
Public goods
Increase
financial
support to
farmers and
foresters
Implement
payments for
environmental
services (PES)
Implement
new market-
based
incentives
Promote
farmers’ and
foresters’
education to
sustainability
Adapt
compensation
schemes and
regulations to
the global
market
Adopt
more
efficient
land use
plans
Pioneer/foster
cross-
compliance in
all public
subsidies
Landscape and scenery 6 5 5 3 1 4 3
Farmland biodiversity 6 6 2 6 2 2 3
Water quality and availability 7 4 4 6 2 3 3
Air quality 3 2 2 3 1 3 3
Soil functionality 3 3 1 5 2 2 2
Climate stability 3 5 3 3 4 1 2
Resilience to flooding and fire 3 2 1 3 1 3 3
Rural viability and vitality 3 4 4 3 3 3 2
Production quality and security 2 2 6 5 3 1 2
Animal health and welfare 2 5 5 5 3 1 3

PROVIDE CSR North Ostrobothnia
5 Implications
Various different maps are available for the CSR. Due to backgrounds of researhcers and also
the participating stakeholders (some of them come from Kuusamo area), forest related
information (maps), forest management as a main factor affecting the supply or demand of
PGs/PBs is emphasized.
In the questionnaire results, landscape and water quality related factors are often
emphasized by respondents.
Demand factors (use-pressures) seem to be particularly helpful to locate hotspots and are
needed to examine the mishmatches.
Tourists, tourism entrepreneurs and cottage owners are relevant beneficiaries and study
objects with respect both PGs (recreation and landscape, and water quality) recognized and
in both potential hotspot sub-areas.
Regulations are useful, but PES and market-based instruments are increasingly demanded
Due to earlier research projects, the Kuusamo area is strongly emphasized by
stakeholders. The earlier experiences and existing results provide synergies for selecting
the Ruka-Kuusamo for the main hotspot area.
Water quality may be an issue locally within the CSR, and thus some of the smaller River
Valleys south from Oulu can be suitable (secondary) hotspots.

PROVIDE CSR North Ostrobothnia
6 Annex 1 – Hotspot description form
Number FI-1 FI-2
Country/region Finland/North Ostrobothnia Finland/North Ostrobothnia
Sub-area North-east hill area (Ruka-Kuusamo) South-west river valley and coastal area
Title Forest landscapes and nature-based
tourism
Water pollution from agriculture
Story (description) Forest landscape is important for
nature-based tourism and visitors in
the area, but given everyman’s
rights, the forest owner will not get
compensated for the provision of
recreational environments and lacks
an incentive to take the landscape
and recreation into account in forest
management beyond his/her own
benefits thereof.
The southern part of the North
Ostrobothnia is widely used for agricultural
production (milk and beef, in particular).
Consequently, the south-west river valley
and coastal areas suffer from water quality
degradation.
Mix of goods (list
relevant goods and bads;
public/private) involved,
under/overprovision,
trends
Public: forest landscape,
recreational opportunities including
a large set of different outdoor
activities, biodiversity, carbon
sequestration
Private: wood production, tourism
Public: water quality degradation,
recreation
Private: food production
Causes of mismatch
between demand and
supply
Due everyman’s right the demand
for beautiful landscape and
recreation is high, but forest
harvesting reduces the supply.
Especially large-scale clearcutting
and site preparation for artificial
regeneration have a negative effect
on the quality of landscape
Natural conditions are suitable for livestock
productions and associated arable farming.
Hence there is a need for intensive
spreading of manure which causes nutrient
loading to the rivers in the area. The
population density is higher than average in
the region along the rivers and on the
coast, and therefore, there is a relatively
high demand for water quality (drinking
water, recreation) in these areas. In
addition, the riversides are typical places
for leisure homes.
Motivation (results of
W3)
Local: High emphasis given by CS-SP
EU: the EU level mapping showed
that this area is a hotspot regarding
many public goods provided by
forests; likely similar issue in a
number of areas in EU that are
important for nature-based tourism
Local: High emphasis given by CS-SP,
perhaps, in response to the high political
attention at EU level.
EU: likely similar issue in a number of
productive areas

PROVIDE CSR North Ostrobothnia
Valuation issues (WP4) Market: lost profit of wood
production, tourism income
Non market: what is the visitor’s
demand (willingness-to-pay) for the
forest landscape and what is the
potential supply (forest owner’s
reservation price)?
Scientific methods for
valuation of public goods
(available/suitable)
(WP4)
Stated and revealed preference
methods to evaluate demand;
stated preference methods to
evaluate potential supply
Stated and revealed preference methods
for water quality; remediation costs;
forgone income
Mechanism design issues
(WP5)
Landscape and Recreational Values
Trading (LRVT) is a new innovative
approach to ensure provision of
public goods in areas that are
important for nature-based tourism.
Scientific methods for
evaluation of
appropriate governance
strategies
(available/suitable)
(WP5)
Valuation methods, cost-efficiency
analysis
Theoretical/conceptual
issues (WP6)
Decision
making/information
needs (WP6)

Contract no. 633838
PROVIDE
PROVIding smart DElivery of public goods by EU agriculture and forestry
Call identifier: H2020-ISIB-2014-2; Topic: ISIB-01-2014
Funding scheme: Research and Innovation Action (RIA)
Start date of project: 01 September 2015 Duration: 36 months
Document related to Deliverable:
D3.2 - Report synthesizing the findings of the CSR level mapping of public good demand and
supply, its underlying determinants, producers and beneficiaries
CSR REPORT ESTONIA
Organisation name of lead beneficiary for this document:
Tallinn University - TLU
Authors: A.Keskpaik, S.Lassur, E.Terk, K.Tafel-Viia,
Project funded by the European Commission within the Horizon 2020 Programme (2014- 2020)
Dissemination Level
PU Public X
PP Restricted to other programme participants (Including the
Commission Services)
RE Restricted to a group specified by the consortium (Including the
Commission Services)
CO Confidential, only for members of the consortium (Including the
Commission Services)

PROVIDE CSR Harju County
Content
Content ................................................................................................................................................................... 2
1 Introduction and case study identification ........................................................................................................ 3
2 Main maps available .......................................................................................................................................... 5
3 Main maps commented ..................................................................................................................................... 6
3.1.1 Est-1: Public good underprovision due to agricultural land abandonment and underuse6
3.1.2 Est- 2: Public good underprovision due to intensive forest management ...................... 7
4 Main results of the questionnaire (descriptive average tables) ........................................................................ 9
5 Annex 1 – Hotspot description form ............................................................................................................... 17
6 Annex 2 – List of maps available ...................................................................................................................... 18

PROVIDE CSR Harju County
1 Introduction and case study identification
This document is a presentation of tasks 3.3 and 3.4 of the PROVIDE project. In this introduction we provide a
short description of the Estonian CSR, Harju County. In section 2, an overview of the available maps related to
public goods and bads provided by agriculture and forestry is given. Section 3 is devoted to commenting some
maps that seem to be the most important in the light of hotspots chosen for Harju County. Section 4 includes
the results of project stakeholders' representatives’ poll. Section 5 presents general conclusions of the work
done.
Harju County is the largest province of Estonia as to the population (576,265 people – 46 % of total population,
in 2016) and the second largest as to the total area (4,333 km²). Harju County includes the capital city of
Tallinn and its surrounding municipalities. The majority of population lives in the capital and other urban
municipalities. Urban sprawl is taking place around Tallinn along the main roads and the seacoast. A number of
former summer cottage areas are in change to places of permanent living too. 116,000 people live in rural
municipalities, which is more than 25% of the total rural population of Estonia. However, quite few of them
are employed in farming.
Figure 1. Harju County
Source: Eesti Entsüklopeedia
The primary production (agriculture, fisheries, forestry) provided 2.6 thousand jobs that made 0.8% of all
employment in the county (2015). It gave only 0.7% of the regional added value of Harju County (2014).
Almost 90% of land is outside urban settlements in rural use in Harju County. There are about 223,000 ha of
forestland (10% of national total) and 70,000 ha of agricultural land in use (7% of national total). The forest
coverage is 51%.

PROVIDE CSR Harju County There is a number of territories under more or less severe protection or officially defined as valuable in Harju
County. In the eastern and western border regions, there are nature conservation areas and nature parks. In
the north-east, the Lahemaa National Park includes part of the coastal area. NATURA 2000 network sites are
numerous. Rebala Heritage Reserve (70 km2) is situated east of Tallinn. The county physical planning
documents define 33 valuable landscapes and 30 valuable traditional landscapes. In addition, the large part of
forests around the capital and its coastal hinterland are defined as the Tallinn’s green belt – the nearest
recreation area for urban population.
Harju County is a region where the vast majority of population has no personal connection with rural
production but is quite sensitive about the recreational, esthetical and cultural heritage features of the rural
and natural environment surrounding the settlements. Therefore, not surprisingly agricultural land
abandonment and too intense forest management has been chosen the hotspot issues of the public goods and
bads provision by the primary production.

PROVIDE CSR Harju County
2 Main maps available
In the light of PROVIDE’s main goal – to develop governance mechanisms for local economies that are
implementable in locally differentiated way, only maps detailed enough deserve attention.
Public web map servers and applications are the main places where maps that are detailed enough and
updated regularly can be found. From the PROVIDE’s viewpoint, maps with several relevant indicators can be
found in: the Estonian Land Board (ELB) Web Map Server (various applications), Estonian Agricultural Registers
and Information Board (ARIB) web map, Environment Agency’s public web service of forest register and web
maps of water bodies. Some other sources of relevant maps can be added: the State Forest Management
Centre web map application of nature tourism destinations, the spatial plan for Harju County „ Environmental
Conditions Framing Settlement and Land Use“ defines valuable landscapes and also some maps produced in
the framework of assessment of local governments competitiveness are available.
More cartographic information about relevant indicators is available about surface and ground waters, soils,
nature protection, land and forest use. However, from the PROVIDE’s viewpoint, a number of relevant aspects
of specific goods/bads are purely covered with indicators. At the same time, e.g no suitable maps for
biodiversity are available. Generally, availability of maps that are suitable for providing systematic and
comprehensive information about producing public goods and bads by agriculture and forestry or specific
drivers influencing those processes is quite limited in Estonia. The level of reflection of different goods/bads is
uneven. Details of maps availability is provided in Annex 2.
As input of task 3.1, a number of EU level maps were also identified to be used in case of missing information
at the local level, or as integrating materials. With respect to the European context, Harju County appears to
be characterized by a relatively high agrobiodiversity, carbon sequestration, erosion prevention and habitat
suitability for megafauna. At the same time, a number of other indicators relating to e.g. farmland birds
biodiversity, flood regulation, cultural heritage, pollinator habitats, nature tourism and wild food provisioning
are rather modest. It all seems reasonable, taking into account its geographical situation, plain terrain,
relatively high share of forests and fragmented agricultural land use. However, it seems that the European
level differentiation scale of indicators is not the best for maps aimed to support designing local governance
instruments. For effective local implementation of maps the differentiation scales used for indicators should
be adapted to reflect local variations of public goods/bads and their drivers because the goods/bads in focus
of PROVIDE are consumed at the local level by local population mainly.

PROVIDE CSR Harju County
3 Main maps commented
In this section maps and statistics concerning both the level of provision of public goods/bads and potential
drivers of provision are presented focusing on the hotspots identified. Two main hotspots are chosen for Harju
County: public good underprovision due to agricultural land abandonment and underuse; public good
underprovision due to intensive forest management.
3.1.1 Est-1: Public good underprovision due to agricultural land abandonment and underuse
Harju County is among regions with the largest share of unused agricultural land - an estimated 32% (31,300
hectares) of arable land and permanent grassland was out of agricultural use in 2013. Detailed spread of the
hotspot (quadrates of 400x400 m = 16 ha) is illustrated only by one map (Fig 2). The map shows the variation
of area of abandoned land in quadrates from 0 ha (blue) to 6 and more ha (red).
Figure 2. Abandoned agricultural land, 2013
Source: Vohu,V. Kasutusest väljas oleva põllumajandusmaa ressurss, struktuur ja paiknemine.2014.
Abandonment of agricultural land brings along decreasing of some public bads - surface and groundwater
pollution and greenhouse gas emissions. Decreases in the availability of some public goods take place too.
Open agricultural landscape disappears, degradation of soil fertility may take place, real estate development
destroys soil, fire safety of the landscape decreases and high nature value farmland suffers from decreasing of

PROVIDE CSR Harju County natural diversity. In places with valuable rural cultural landscape heritage decrease of the cultural and touristic
value of landscape takes place.
Most of those changes are not reflected in GIS and it is even not reasonable to monitor all of them
cartographically. We have maps of water bodies status that are updated periodically. Status of soils changes
too slowly. Unfortunately, esthetical, cultural and tourism values of landscapes as well as agrobiodiversity are
not monitored and mapped systematically.
In fact, we do not have detailed cartographical maps of the main hypothetical drivers of agricultural land
abandonment. It is probably also not rational to monitor drivers like rent prices, property and rent relations,
real estate development etc with such maps, because the data is hard to collect and it also changes too
quickly.
3.1.2 Est- 2: Public good underprovision due to intensive forest management
Substantial part of forests in Harju County have achieved maturity which means that large part of the forests
will go under cutting in the coming 10 years. Partly due to pressure towards more effective and intensive
forest management and partly also due to the species composition of forest (e.g. spruce wood) the most
reasonable cutting method is clear cutting. Clear cutting near settlements and tourism destinations and some
other sensitive places generates conflicts with local people and businesses.
Figure 3. Potentially conflict causing future cutting areas of State Forest Management Centre in Saku
municipality
Source: Metoodika lageraiete mõju hindamiseks ja konfliktide ennetamiseks maastiku tasandil, arvestades sotsiaalseid,
majanduslikke ja ökoloogilisi aspekte, 2015

PROVIDE CSR Harju County So far, potential conflict places have been mapped only in some municipalities, no such comprehensive map of
Harju County exists. Figure 3 presents such places (in violet) in Saku municipality bordering Tallinn.
The most important public bads brought along by clear cutting are: decrease of recreational possibilities and
the variety of recreational/nature tourism services, deterioration of living environment, decrease of ecological
diversity as well landscape value in esthetical/cultural terms and decrease in protection from noise and
pollution. We do not have respective maps and obviously they will not be available for many indicators
reflecting those bads.
At the same time, we have maps reflecting some hypothetical drivers of cutting: e.g., possible wood
regeneration cut parcels, protection regimes (NATURA 2000). However, most potential drivers (cut parcels,
owners structure etc) are not observed with detailed cartographic methods and it would be not necessary, nor
rational as the information is hard to collect and changing quickly.
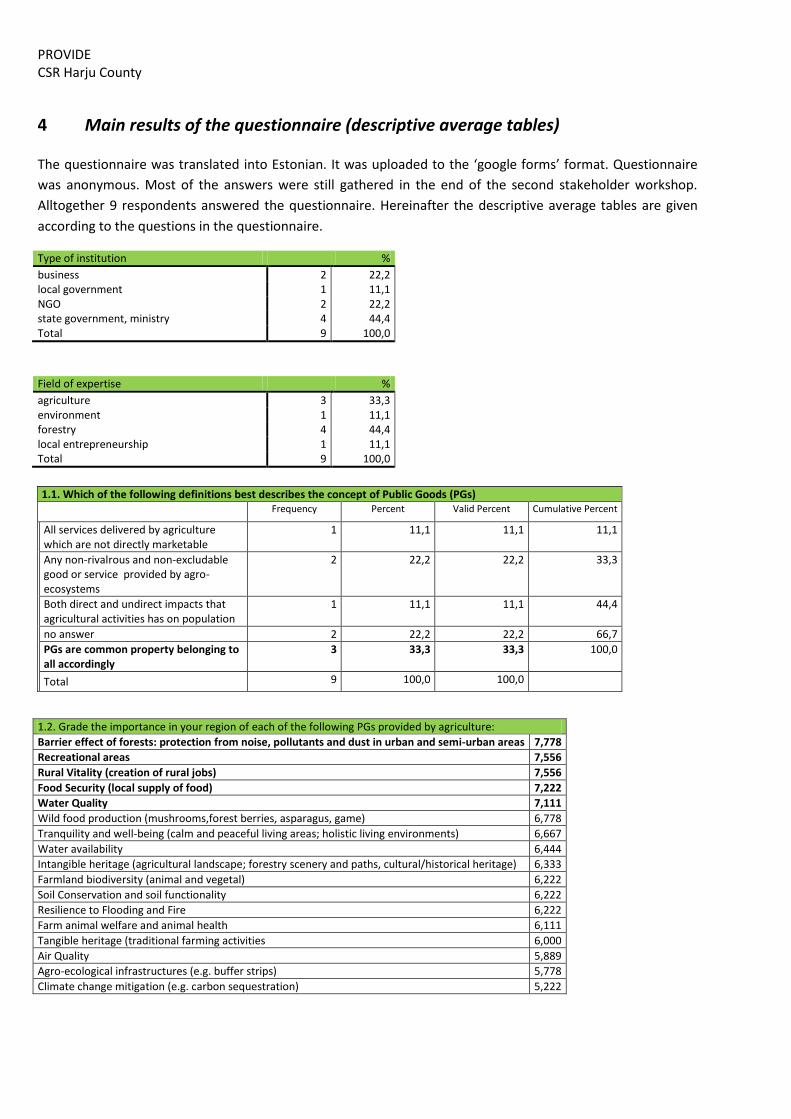
PROVIDE CSR Harju County
4 Main results of the questionnaire (descriptive average tables)
The questionnaire was translated into Estonian. It was uploaded to the ‘google forms’ format. Questionnaire
was anonymous. Most of the answers were still gathered in the end of the second stakeholder workshop.
Alltogether 9 respondents answered the questionnaire. Hereinafter the descriptive average tables are given
according to the questions in the questionnaire.
Type of institution
%
business 2 22,2 local government 1 11,1 NGO 2 22,2 state government, ministry 4 44,4 Total 9 100,0
Field of expertise
%
agriculture 3 33,3 environment 1 11,1 forestry 4 44,4 local entrepreneurship 1 11,1 Total 9 100,0
1.1. Which of the following definitions best describes the concept of Public Goods (PGs)
Frequency Percent Valid Percent Cumulative Percent
All services delivered by agriculture which are not directly marketable
1 11,1 11,1 11,1
Any non-rivalrous and non-excludable good or service provided by agro-ecosystems
2 22,2 22,2 33,3
Both direct and undirect impacts that agricultural activities has on population
1 11,1 11,1 44,4
no answer 2 22,2 22,2 66,7
PGs are common property belonging to all accordingly
3 33,3 33,3 100,0
Total 9 100,0 100,0
1.2. Grade the importance in your region of each of the following PGs provided by agriculture:
Barrier effect of forests: protection from noise, pollutants and dust in urban and semi-urban areas 7,778
Recreational areas 7,556
Rural Vitality (creation of rural jobs) 7,556
Food Security (local supply of food) 7,222
Water Quality 7,111
Wild food production (mushrooms,forest berries, asparagus, game) 6,778
Tranquility and well-being (calm and peaceful living areas; holistic living environments) 6,667
Water availability 6,444
Intangible heritage (agricultural landscape; forestry scenery and paths, cultural/historical heritage) 6,333
Farmland biodiversity (animal and vegetal) 6,222
Soil Conservation and soil functionality 6,222
Resilience to Flooding and Fire 6,222
Farm animal welfare and animal health 6,111
Tangible heritage (traditional farming activities 6,000
Air Quality 5,889
Agro-ecological infrastructures (e.g. buffer strips) 5,778
Climate change mitigation (e.g. carbon sequestration) 5,222
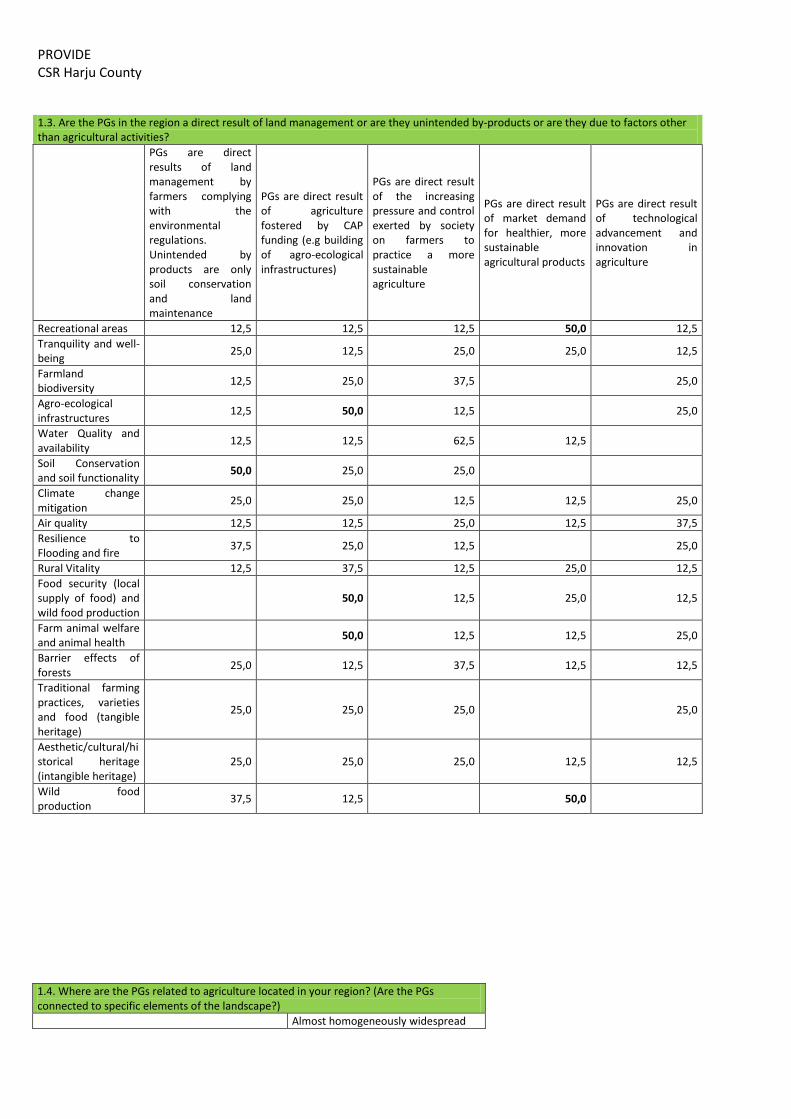
PROVIDE CSR Harju County
1.3. Are the PGs in the region a direct result of land management or are they unintended by-products or are they due to factors other than agricultural activities?
PGs are direct results of land management by farmers complying with the environmental regulations. Unintended by products are only soil conservation and land maintenance
PGs are direct result of agriculture fostered by CAP funding (e.g building of agro-ecological infrastructures)
PGs are direct result of the increasing pressure and control exerted by society on farmers to practice a more sustainable agriculture
PGs are direct result of market demand for healthier, more sustainable agricultural products
PGs are direct result of technological advancement and innovation in agriculture
Recreational areas 12,5 12,5 12,5 50,0 12,5
Tranquility and well-being
25,0 12,5 25,0 25,0 12,5
Farmland biodiversity
12,5 25,0 37,5
25,0
Agro-ecological infrastructures
12,5 50,0 12,5
25,0
Water Quality and availability
12,5 12,5 62,5 12,5
Soil Conservation and soil functionality
50,0 25,0 25,0
Climate change mitigation
25,0 25,0 12,5 12,5 25,0
Air quality 12,5 12,5 25,0 12,5 37,5
Resilience to Flooding and fire
37,5 25,0 12,5
25,0
Rural Vitality 12,5 37,5 12,5 25,0 12,5
Food security (local supply of food) and wild food production
50,0 12,5 25,0 12,5
Farm animal welfare and animal health
50,0 12,5 12,5 25,0
Barrier effects of forests
25,0 12,5 37,5 12,5 12,5
Traditional farming practices, varieties and food (tangible heritage)
25,0 25,0 25,0
25,0
Aesthetic/cultural/historical heritage (intangible heritage)
25,0 25,0 25,0 12,5 12,5
Wild food production
37,5 12,5
50,0
1.4. Where are the PGs related to agriculture located in your region? (Are the PGs connected to specific elements of the landscape?)
Almost homogeneously widespread

PROVIDE CSR Harju County Recreational areas 77,8
Tranquility and well-being 66,7
Farmland biodiversity 77,8
Agro-ecological infrastructures 88,9
Water Quality and availability 77,8
Soil Conservation and soil functionality 88,9
Climate change mitigation 100,0
Air quality 100,0
Resilience to Flooding and fire 77,8
Rural Vitality 100,0
Food security (local supply of food) and wild food production
100,0
Farm animal welfare and animal health 66,7
Barrier effects of forests 77,8
Traditional farming practices, varieties and food (tangible heritage)
88,9
Aesthetic/cultural/historical heritage (intangible heritage)
66,7
Wild food production 88,9
1.5. What are the main issues concerning PGs general? (on the supply side and on the demand side)
PGs are still theoretical concepts, society has no perception of the role of farmers as land managers
Inadequate funding for compensation of farmers practicing sustainable agriculture
Conflicts of interests and uses between different stakeholders in the context of land management and difficulties to implement land management regulations
Development and land use choices in certain regions (e.g. tourism vs agriculture; or loss of traditional agricultural practices)
Problems related to the urban sprawling and agricultural land abandonment (land and infrastructure maintenance)
Public access to public goods, the issue of land tenure and rights
Recreational areas 37,5 25 37,5
Tranquility and well-being 12,5 25,0 25,0 25,0 12,5
Farmland biodiversity 12,5 25,0 12,5 25,0 25,0
Agro-ecological infrastructures 62,5 12,5 25
Water Quality and availability 37,5 25,0 25,0 12,5
Soil Conservation and soil functionality 25,0 12,5 12,5 37,5 12,5
Climate change mitigation 25,0 12,5 12,5 12,5 37,5
Air quality 37,5 12,5 12,5 12,5 12,5 12,5
Resilience to Flooding and fire 50,0 25,0 12,5 12,5
Rural Vitality 12,5 25,0 12,5
12,5 37,5
Food security (local supply of food) and wild food production
37,5 37,5
12,5
12,5
Farm animal welfare and animal health 37,5 25,0 25,0 12,5
Barrier effects of forests 12,5 37,5 37,5 12,5
Traditional farming practices, varieties and food (tangible heritage)
25,0 37,5
25,0
12,5
Aesthetic/cultural/historical heritage (intangible heritage)
37,5
12,5
12,5 37,5
Wild food production 25,0 12,5 12,5 50,0

PROVIDE CSR Harju County
1.6. What are the main motivations to manage the land for the provision of PGs for private land-owners?
Compliance with regulations (e.g. land-use restrictions, nuisance taxes)
Desire of preserving their own health and increasing their working conditions and life quality
Market demand for high quality and sustainable products (e.g. local products)
Receiving advantages for their activities from the provision of PGs (e.g. marketing through landscape improvement)
CAP (Common Agricultural Policy) direct payments and other incentives
CAP (Common Agricultural Policy) support to farmers trough Rural Development Plans
Recreational areas 12,5 25,0 25,0 12,5 25,0
Tranquility and well-being 25,0 12,5 25,0 12,5 25,0
Farmland biodiversity 14,3 57,1 28,6
Agro-ecological infrastructures 14,3 42,9 42,9
Water Quality and availability 14,3 28,6 14,3 14,3 14,3 14,3
Soil Conservation and soil functionality 12,5 12,5 25,0 25,0 25,0
Climate change mitigation 28,6 14,3 14,3 14,3 28,6
Air quality 14,3 28,6 14,3 14,3 28,6
Resilience to Flooding and fire 12,5 12,5 12,5 50,0 12,5
Rural Vitality 25,0 25,0 12,5 37,5
Food security (local supply of food) and wild food production
12,5 25,0 25,0
12,5 25,0
Farm animal welfare and animal health 37,5 25,0 25,0 12,5
Barrier effects of forests 42,9 14,3 14,3 14,3 14,3
Traditional farming practices, varieties and food (tangible heritage)
12,5
12,5 12,5 25,0 37,5
Aesthetic/cultural/historical heritage (intangible heritage)
14,3 28,6 14,3 42,9
Wild food production 25,0 12,5 12,5 12,5 37,5
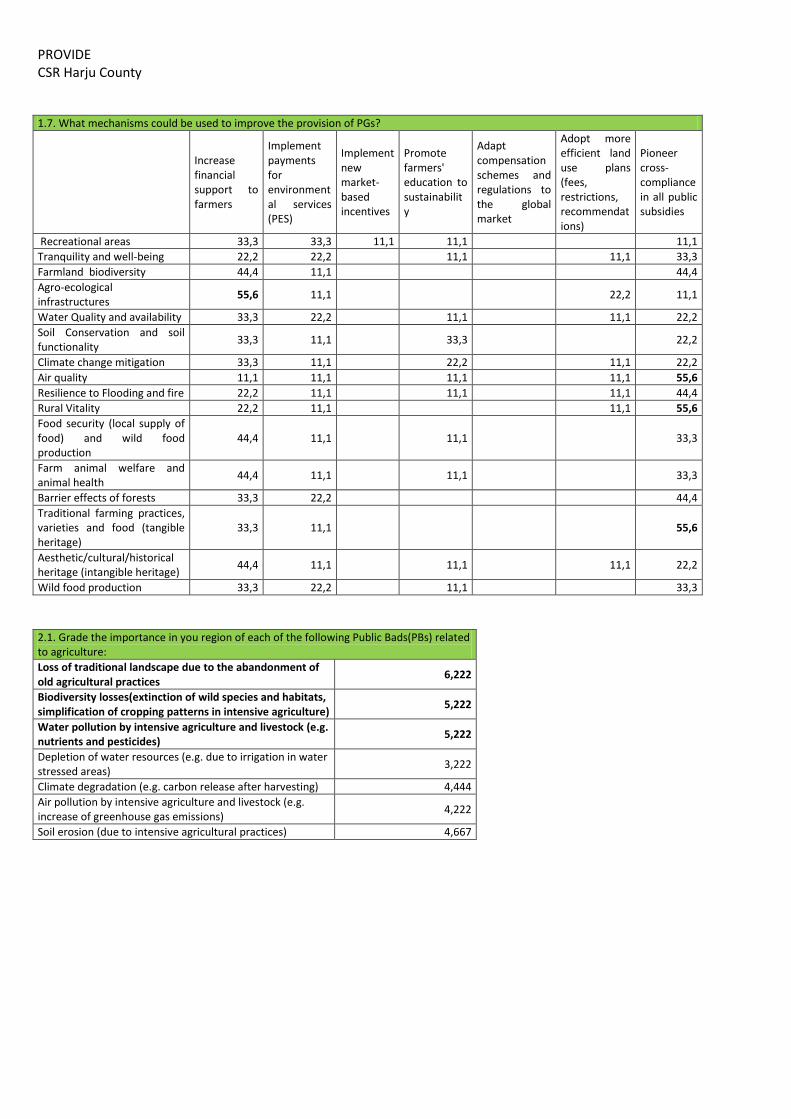
PROVIDE CSR Harju County
1.7. What mechanisms could be used to improve the provision of PGs?
Increase financial support to farmers
Implement payments for environmental services (PES)
Implement new market-based incentives
Promote farmers' education to sustainability
Adapt compensation schemes and regulations to the global market
Adopt more efficient land use plans (fees, restrictions, recommendations)
Pioneer cross-compliance in all public subsidies
Recreational areas 33,3 33,3 11,1 11,1 11,1
Tranquility and well-being 22,2 22,2 11,1 11,1 33,3
Farmland biodiversity 44,4 11,1 44,4
Agro-ecological infrastructures
55,6 11,1
22,2 11,1
Water Quality and availability 33,3 22,2 11,1 11,1 22,2
Soil Conservation and soil functionality
33,3 11,1
33,3
22,2
Climate change mitigation 33,3 11,1 22,2 11,1 22,2
Air quality 11,1 11,1 11,1 11,1 55,6
Resilience to Flooding and fire 22,2 11,1 11,1 11,1 44,4
Rural Vitality 22,2 11,1 11,1 55,6
Food security (local supply of food) and wild food production
44,4 11,1
11,1
33,3
Farm animal welfare and animal health
44,4 11,1
11,1
33,3
Barrier effects of forests 33,3 22,2 44,4
Traditional farming practices, varieties and food (tangible heritage)
33,3 11,1
55,6
Aesthetic/cultural/historical heritage (intangible heritage)
44,4 11,1
11,1
11,1 22,2
Wild food production 33,3 22,2 11,1 33,3
2.1. Grade the importance in you region of each of the following Public Bads(PBs) related to agriculture:
Loss of traditional landscape due to the abandonment of old agricultural practices
6,222
Biodiversity losses(extinction of wild species and habitats, simplification of cropping patterns in intensive agriculture)
5,222
Water pollution by intensive agriculture and livestock (e.g. nutrients and pesticides)
5,222
Depletion of water resources (e.g. due to irrigation in water stressed areas)
3,222
Climate degradation (e.g. carbon release after harvesting) 4,444
Air pollution by intensive agriculture and livestock (e.g. increase of greenhouse gas emissions)
4,222
Soil erosion (due to intensive agricultural practices) 4,667

PROVIDE CSR Harju County
2.2. Are the PBs in the region a direct result of land management or are they unintended by-products or are they due to factors other than agricultural activities?
PBs are mostly unintended by-products from agricultural activities, PBs are direct result of agriculture only when farmers do not comply with the law and the environmental regulations
PBs are never a direct result of agriculture (not even intensive), which do not intend to pollute the environment or to damage the society
PBs are a direct result of land management choices exerted by land-owners (e.g. practising intensive agriculture)
PBs are a consequence of the absence of adequate compensation schemes to farmers
PBs are caused by the rising land-abandonment in rural areas
PBs emerge from the competition between regions/ countries forcing farmers to lower the sustainability of productions
Loss of traditional landscape due to the abandonment of old agricultural practices
33,3
11,1 44,4 11,1
Biodiversity losses(extinction of wild species and habitats, simplification of cropping patterns in intensive agriculture)
12,5 12,5 25,0 12,5 25,0 12,5
Water pollution by intensive agriculture and livestock (e.g. nutrients and pesticides)
37,5 12,5 25,0
12,5 12,5
Depletion of water resources (e.g. due to irrigation in water stressed areas)
37,5 25,0 12,5 12,5 12,5
Climate degradation (e.g. carbon release after harvesting)
25,0 50,0
12,5 12,5
Air pollution by intensive agriculture and livestock (e.g. increase of greenhouse gas emissions)
37,5 25,0 25,0
12,5
Soil erosion (due to intensive agricultural practices)
50,0 12,5 12,5
12,5 12,5

PROVIDE CSR Harju County
2.3. Where are the PBs related to agriculture located in your region? (Are the PBs connected to specific elements of the landscape?
On the riversides and river valleys
Hilly areas
Mountain areas
Plain areas
Specific production areas (e.g.: wine producing areas)
Meadow and pasture areas
Areas with both cultural and historical values
Almost homogeneously widespread
Loss of traditional landscape due to the abandonment of old agricultural practices 12,5 87,5
Biodiversity losses(extinction of wild species and habitats, simplification of cropping patterns in intensive agriculture) 25 75
Water pollution by intensive agriculture and livestock (e.g. nutrients and pesticides)
25,0 25 50
Depletion of water resources (e.g. due to irrigation in water stressed areas) 25 12,5 55,6
Climate degradation (e.g. carbon release after harvesting) 25 75
Air pollution by intensive agriculture and livestock (e.g. increase of greenhouse gas emissions) 37,5 62,5
Soil erosion (due to intensive agricultural practices) 12,5 25 62,5
2.4. What are the main issues concerning PBs general? (on the supply side and on the demand side)
PGs are still theoretical concepts, society has no perception of the role of farmers s as land managers
Inadequate funding for compensation of farmers practicing sustainable agriculture
Conflicts of interests and uses between different stakeholders in the context of land management and difficulties to implement land management regulations
Development and land use choices in certain regions (e.g. tourism vs agriculture; or loss of traditional agricultural practices)
Problems related to the urban sprawling and agricultural land abandonment (land and infrastructure maintenance)
Public access to public goods, the issue of land tenure and rights
Loss of traditional landscape due to the abandonment of old agricultural practices
44,4
11,1 33,3 11,1
Biodiversity losses(extinction of wild species and habitats, simplification of cropping patterns in intensive agriculture)
12,5 25,0 37,5
25,0
Water pollution by intensive agriculture and livestock (e.g. nutrients and pesticides)
12,5 25,0 37,5
25,0
Depletion of water resources (e.g. due to irrigation in water stressed areas)
25,0 12,5 37,5
25,0
Climate degradation (e.g. carbon release after harvesting)
50,0
12,5 25,0 12,5
Air pollution by intensive agriculture and livestock (e.g. increase of greenhouse gas emissions)
50,0
12,5 12,5 25,0
Soil erosion (due to intensive agricultural practices)
12,5 12,5 37,5 12,5 12,5 12,5
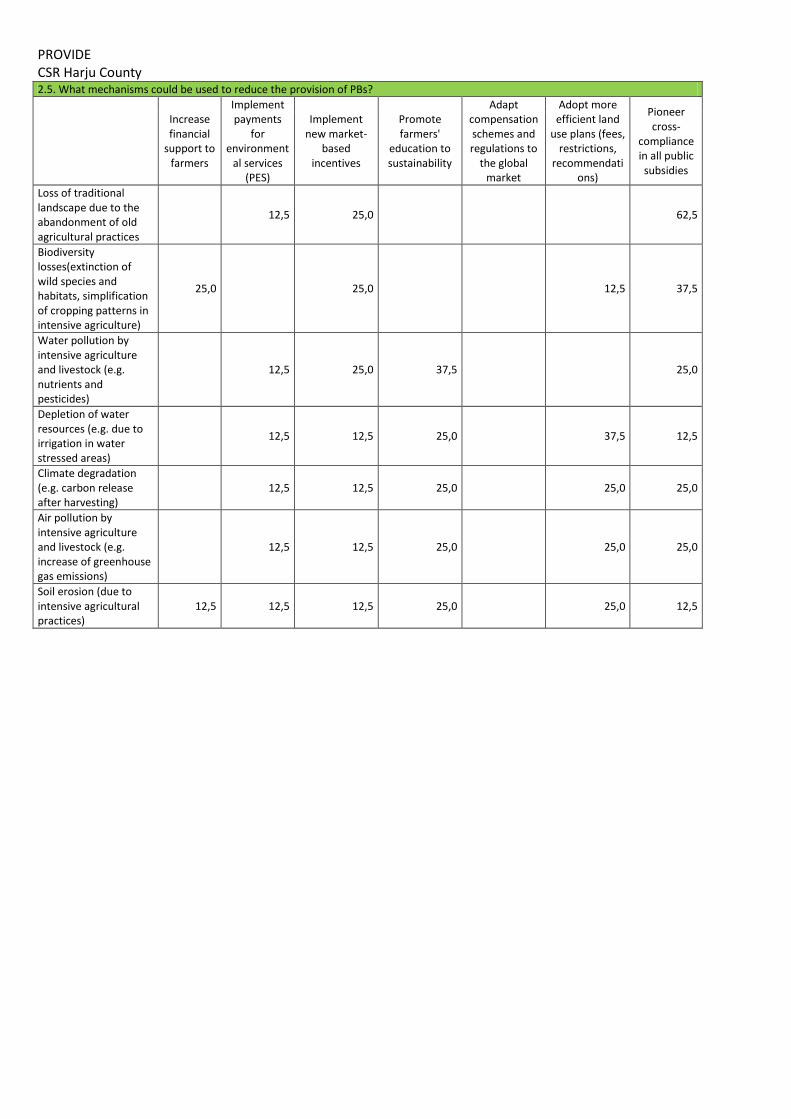
PROVIDE CSR Harju County 2.5. What mechanisms could be used to reduce the provision of PBs?
Increase financial
support to farmers
Implement payments
for environment
al services (PES)
Implement new market-
based incentives
Promote farmers'
education to sustainability
Adapt compensation schemes and regulations to
the global market
Adopt more efficient land
use plans (fees, restrictions,
recommendations)
Pioneer cross-
compliance in all public subsidies
Loss of traditional landscape due to the abandonment of old agricultural practices
12,5 25,0
62,5
Biodiversity losses(extinction of wild species and habitats, simplification of cropping patterns in intensive agriculture)
25,0
25,0
12,5 37,5
Water pollution by intensive agriculture and livestock (e.g. nutrients and pesticides)
12,5 25,0 37,5
25,0
Depletion of water resources (e.g. due to irrigation in water stressed areas)
12,5 12,5 25,0
37,5 12,5
Climate degradation (e.g. carbon release after harvesting)
12,5 12,5 25,0
25,0 25,0
Air pollution by intensive agriculture and livestock (e.g. increase of greenhouse gas emissions)
12,5 12,5 25,0
25,0 25,0
Soil erosion (due to intensive agricultural practices)
12,5 12,5 12,5 25,0
25,0 12,5

PROVIDE CSR Harju County
5 Annex 1 – Hotspot description form
Number EST-1 EST-2
Country/region Estonia, Harju county Estonia, Harju county
Sub-area Western-Harju; Rebala; Vaida Nearby larger residential areas (Aegviidu, Kuusalu, Saku, Kolga)
Title Public good underprovision due to agricultural land abandonment and underuse
Public good underprovision due to intensive forest management (clear-cutting)
Story (description) The agricultural activities in Harju county region have decreased a lot in last 40 years. Therefore a lot of agricultural land is out of use and covered with the brushwood. It is on the one had bad for agricultural scenery and rural viability, less local food, also the risk of wild fire is higher. Another thing is that lot of previous agricultural land has become the industrial or residential areas. This has also an impact on scenery, agricultural biodiversity and rural viability in the region. On the other side the decrease in agricultural activities have improved the water quality.
It is much cheaper to manage forest with machines instead of people, and therefore the trend of clear-cutting is very strong. Very many forests next to residential areas have reached their maturity and need to be managed. People lose their recreational possibilities in the nearby forests.
Mix of goods (list relevant goods and bads; public/private) involved, under/overprovision, trends
Public: landscape quality, rural viability, local food, agricultural biodiversity, water quality, cultural heritage
Private: food production, tourism (showing the cows and farm life etc)
Public: forest landscape, recreation, hiking routes, fresh air, wild animal trajectories etc
Private: forest management, tourism (hiking, riding, hunting etc)
Causes of mismatch between demand and supply
Unused and abandoned land decreases the rural viability, local food (which are increasingly demanded by the nearby city inhabitants). Agricultural small production is not profitable; no people in the countryside.
People don’t like the clear-cut areas; it is much easier to manage forest with clear-cutting;
Motivation (results of W3) Local: high emphasis by local stakeholders – one way to keep rural viability and local food is to start actively using the agricultural land
Local: high emphasis by local communities and tourism (recreation) companies
Valuation issues (WP4) Costs of maintenance actions (also renting price); impacts for rural viability
Possibilities of other forest management methods (instead of clear-cut); the effects on life quality of local people and on local tourism organisations
Scientific methods for valuation of public goods (available/suitable) (WP4)
Stated preference methods to evaluate land stewardship and rural viability;
Valuation of ecosystem services
Mechanism design issues (WP5) Compensatory subsidies; cooperation solutions
Compensatory subsidies; better communication and cooperation with local inhabitants and companies
Scientific methods for evaluation of appropriate governance strategies (available/suitable) (WP5)
Theoretical/conceptual issues (WP6)
Abandonment and issues related to this Interplay of recreation/tourism and forestry
Decision making/information needs (WP6)
Examples of innovative governance; bioeconomy business models, monetary values to motivate actions
Examples of innovative governance; bioeconomy business models, monetary values to motivate actions

6 Annex 2 – List of maps available
PUBLIC GOODS PROVIDED BY AGRICULTURE AND FORESTRY: MAPS FOR HARJU COUNTY, ESTONIA Public good Indicator / proxy
description Map description (original doc name)
Scale Coverage Date Source Notes (Avail-ability)
WATER QUALITY
Station of flowing surface water bodies
Lääne-Eesti vooluveekogumite koondseisund 2013. aastal
Water body West-Estonian river basin district
2013 Environment Agency http://www.Environmental Agency.ee/failid/Laane_vooluveekogumid_KOOND_seisund_2013.pdf
Status of standing surface water bodies
Seisuveekogumite koondseisund 2013. aastal
Water body Estonia 2013 Environment Agency http://www.Environmental Agency.ee/failid/Jarvekogumid_KOOND_seisund_2013.pdf
Status of coastal water bodies
Rannikumerekogumite koondseisund arvestades elavhõbedasisaldust 2013. aastal
Water body Estonia 2013 Environment Agency http://www.Environmental Agency.ee/failid/Rannikumeri_KOOND_HGga_seisund_2013.pdf
Chemical and quantitative status of groundwater body: Cambrian-Vendian
Kambriumi-Vendi põhjaveekogumi üldseisund
Water body West-Estonian river basin district
2013 Lääne-Eesti vesikonna veemajanduskava http://www.envir.ee/sites/default/files/laane-eesti_vesikonna_veemajanduskava.pdf, p. 269
Chemical and quantitative status of groundwater body: Ordovician-Cambrian
Ordoviitsiumi-Kambriumi põhjaveekogumi üldseisund Lääne-Eesti vesikonnas
Water body West-Estonian river basin district
2013 Ibid., p.270 Pdf
Chemical and quantitative status of groundwater body: Silurian-Ordovician
Siluri-Ordoviitsiumi Harju põhjaveekogumi üldseisund
Water body West-Estonian river basin district
2013 Ibid., p. 273 Pdf
CLIMATE STABILITY AND CLIMATE
CHANGE ADAPTATION
Hydrotechnical land amelioration systems
Maaparandussüsteemide kaardirakendus
Detailed Estonia Running year
Map server of Estonian Land Board http://xgis.maaamet.ee/xGIS/XGis?app_id=MA10A&user_id=at&bbox=548572.792152494,6573532.08811788,552351.49404051,6575522.93312087&setlegend=HMAMPSA02_10=1,HMAKAT10A=0&LANG=1
WMS
Hydrotechnical land amelioration systems’ areas
PRIA veebikaart Detailed Estonia Running year
Agricultural Registers and Information Board’s web map https://kls.pria.ee/kaart/
WMS
SOIL CONSERVATION AND FUNCTIONALITY
Soil mapping unit, soil texture, thickness of A horizon
Mullakaart Detailed Estonia 2001 Map server of Estonian Land Board http://xgis.maaamet.ee/xGIS/XGis?app_id=UU38&user_id=at&bbox=570108.399496169,6560258.11085798,576204.995979711,6563470.1606582&setlegend=FUU7550=1&LANG=1
WMS
HIGH NATURE VALUE AREAS
Seminatural communities, NATURA 2000 sites on agricultural land
PRIA veebikaart Detailed Estonia Running year
Agricultural Registers and Information Board’s web map https://kls.pria.ee/kaart/

PROVIDE CSR Harju County
NATURA 2000 sites on forest land
Erametsakeskuse veebiteenus Detailed Estonia Running year
Map server of Estonian Land Board http://xgis.maaamet.ee/xGIS/XGis?app_id=EMK&user_id=at&bbox=558602.778616691,6588890.36401895,570605.060067927,6595213.88007281&LANG=1
WMS
Valuable forest habitats, zones of restrictions and protection
Metsaregistri kaart Detailed Eesti Running year
Environment Agency, public service of forest register http://register.metsad.ee/avalik/
WMS
FARMLAND
BIODIVERSITY
RECREATIONAL ASPECTS LINKED TO
TRADITIONAL AGRICULTURAL
PRODUCTS, FORESTRY
Valuable traditional landscapes
Harju maakonna väärtuslikud maastikud
Landscape Harju County 2003 Maakonna teemaplaneering http://harju.maavalitsus.ee/documents/182179/4211124/Teemaplaneeringu+Asustust+ja+maakasutust+suunavad+keskkonnatingimused_v22rtuslikud+maastikud_rohevorgustik.pdf/fe030f47-85db-447c-b396-6b1aa9d6b2a0 ; väärtuslike maastike kaardikihid Mapinfo http://harju.maavalitsus.ee/asustust-ja-maakasutust-suunavad-keskkonnatingimused-roheline-vorgustik-1
Pdf, Mapinfo
Location of abandoned agricultural land
Kasutusest väljas oleva põllumajandusmaa kaart
400x400 m Estonia 2013 V. Vohu. Kasutusest väljas oleva põllumajandusmaa ressurss, struktuur ja paiknemine http://www.energiatalgud.ee/index.php?title=Pilt:Vohu,_V._Kasutusest_v%C3%A4ljas_olev_p%C3%B5llumajandusmaa_Eestis.pdf
Recreation sites and services in state forest
Riigimetsakeskuse puhkevõimaluste otsing
Recreation sites, routes
Estonia ? State Forest Management Centre‘s map service for hikers http://loodusegakoos.ee/kuhuminna/voimaluste-otsing
DRIVERS / FACTORS POTENTIALLY RELATED TO PUBLIC GOOD PROVISION FROM AGRICULTURE AND FORESTRY
Driver / factor Map description Scale Coverage Date Source Notes

PROVIDE CSR Harju County
description (original doc name) (Availability)
RECREATIONAL
ASPECTS LINKED TO
PROTECTED AREAS
Protected areas, objects,
zones; NATURA 2000 sites
Looduskaitse ja Natura 2000
kaardirakendus
Detailed Estonia Running
year
Map server of Estonian Land Board
http://xgis.maaamet.ee/xGIS/XGis?app_id
=UU62A&user_id=at&bbox=512174.20044
2413,6554033.67346617,585877.1104057
33,6589590.75916128&setlegend=UU62A_
voond=1,UU62A_natura=1&LANG=1
WMS
Forest parcels, forest use
restrictions
Metsaregistri kaart Detailed Estonia Running
year
Environment Agency, public service of
forest register
http://register.metsad.ee/avalik/
WMS
BIODIVERSITY-
NATURAL AND SEMI-
NATURAL AREAS
Green (ecological) network Harju maakonna roheline
võrgustik
Core areas,
corridors
Harju County 2003 Maakonna teemaplaneering
http://harju.maavalitsus.ee/documents/18
2179/4211124/Teemaplaneeringu+Asustus
t+ja+maakasutust+suunavad+keskkonnatin
gimused+kaart_rohevorgustik.pdf/4baf6e8
1-e089-4315-a330-c425f3b47df7 ;
Mapinfo kihid http://harju.maavalitsus.ee/asustust-ja-
maakasutust-suunavad-
keskkonnatingimused-roheline-vorgustik-1
Pdf, Mapinfo
LAND PHYSICAL
ACCESS
(INFRASTRUCTURES)
Roads Maanteeameti kaardirakendus Detailed Estonia Running
year
Map server of Estonian Land Board http://xgis.maaamet.ee/xGIS/XGis?app_id
=UU75&user_id=at&bbox=532618.335506
12,6573015.34921045,544568.182384744,
6579311.23961138&LANG=1
WMS
INFORMATION
ACCESS (WEB AND
TECHNOLOGY)
FARMERS
CHARACTERISTICS

PROVIDE CSR Harju County
FARM
MANAGEMENT AND
FARM STRUCTURAL
CHARACTERISTICS
CAP PAYMENTS
AREAS ELIGIBLE FOR
SPECIFIC SUPPORT
SCHEMES
LAND USE AND
LANDSCAPE
CLASSIFICATIONS
Agricultural land parcels,
plots for which CAP support
has been applied, cattle
sheds, apiaries, nitrate-
sensitive areas
PRIA veebikaart Detailed Estonia Running
year
Agricultural Registers and Information
Board’s web map https://kls.pria.ee/kaart/
WMS
Possible wood regeneration
cut parcels, NATURA 2000
grants for forest land, timber
purchasing places
Metsaregistri kaart Detailed Estonia Running
year Metsaregistri avalik veebiteenus
http://register.metsad.ee/avalik/
WMS
CORINE land cover CORINE kaardirakendus Detailed Estonia 2012 CORINE kaardirakendus
http://ks.keskkonnainfo.ee/website/Corine
service/
WMS
LAND PHYSICAL AND
GEOGRAPHICAL
CHARACTERISTICS
Altitude data Maainfo kaardirakendus Detailed Estonia Running
year
Map server of Estonian Land Board
http://xgis.maaamet.ee/xGIS/XGis?app_id
=UU82&user_id=at&bbox=547317.729027
074,6577988.46467336,548762.27097292
6,6578749.53532665&setlegend=UUKAT1_
l_82=0,UUKAT1L_82=0&LANG=1
WMS
LAND SOCIAL
CHARACTERISTICS
Density of population Eesti rahvastiku paiknemine Municipality Estonia 2011 https://www.stat.ee/67848 Png
Dependency ratio Ülalpeetavate määr Municipality Estonia 2010- Konsultatsiooni- ja koolituskeskus Pdf

PROVIDE CSR Harju County
..
2013 Geomedia. Kohaliku omavalitsuse üksuste
võimekuse indeks, 2013.
http://www.fin.ee/public/KOV/Uuringud_j
a_analuusid/2014_kov_voimekuse_indeks
_loppversioon.pdf , p 40
Reproductive potential of
population (share of young
women)
Rahvastiku
taastootmispotentsiaal
Municipality Estonia 2010-
2013
Ibid., p 41 Pdf
LAND ECONOMIC
CHARACTERISTICS
Active economic units per
100 working age inhabitants
Majandusüksuste arv 15-64-
aastaste elanike kohta
Municipality Estonia 2010-
2013
Ibid., p 42 Pdf
Taxed income and pensions
per inhabitant
Elanike palga- ja pensionitulud
elaniku kohta
Municipality Estonia 2010-
2013
Ibid., p 45 Pdf
Registered unemployment
among working age
population
Registreeritud töötute osakaal
15-64-aastastest elanikest
Municipality Estonia 2010-
2013
Ibid., p 46 Pdf