introducing the establishment survey€¦ · international trends link establishment survey data to...
TRANSCRIPT
INTRODUCING THE ESTABLISHMENT SURVEY

THE ES JOURNEY…
2

FUTURE PROOFING MODEL…
International trends link establishment survey data to a variety of dedicated media surveys via data fusion
Source: Industry meeting July 2013 3

4
GORDON PATTERSON
5 Oct 1960 - 22 July 2016

THE ES JOURNEY…
5
Jul ‘13 Feb-Aug ‘15Oct ‘14 Aug ‘15 Oct-Dec ‘15Oct ‘15
Future proofing model
BRC and PRC begin ES
talks
ES tender process
ES tender
awarded
ES contract signed
ES work begins

THE ES JOURNEY CONTINUED…
6
Jan ‘16 Feb-Mar ‘16Mar ‘16 May ‘16 1 July ‘16June ‘16
Q’redesign
workshop
Sample design
workshop
Pilot study
Pilot debrief
workshop
Inter-viewer training
In field
Final q’re
Sep-Oct ‘16 Mar ‘17Sep-Oct ‘16 May-July ‘17 Sep ‘17
Today
Scrutiny of 2
month data
SEM develop-
ment
Launch (first 6 month data
release)
Full year release
Further industry
workshops

7
REPRESENTATIVE OF THE SA POPULATION
DEMOGRAPHIC / GEOGRAPHIC / LIFESTYLE / PRODUCTS & MULTI-MEDIA LANDSCAPE
CROSS PLATFORM / CROSS DEVICE MEDIA CONSUMPTION
SINGLE SOURCE (IHS POPULATION DATA)
HUB & DONOR
NEW SEGMENTATION MODEL
THE ES…
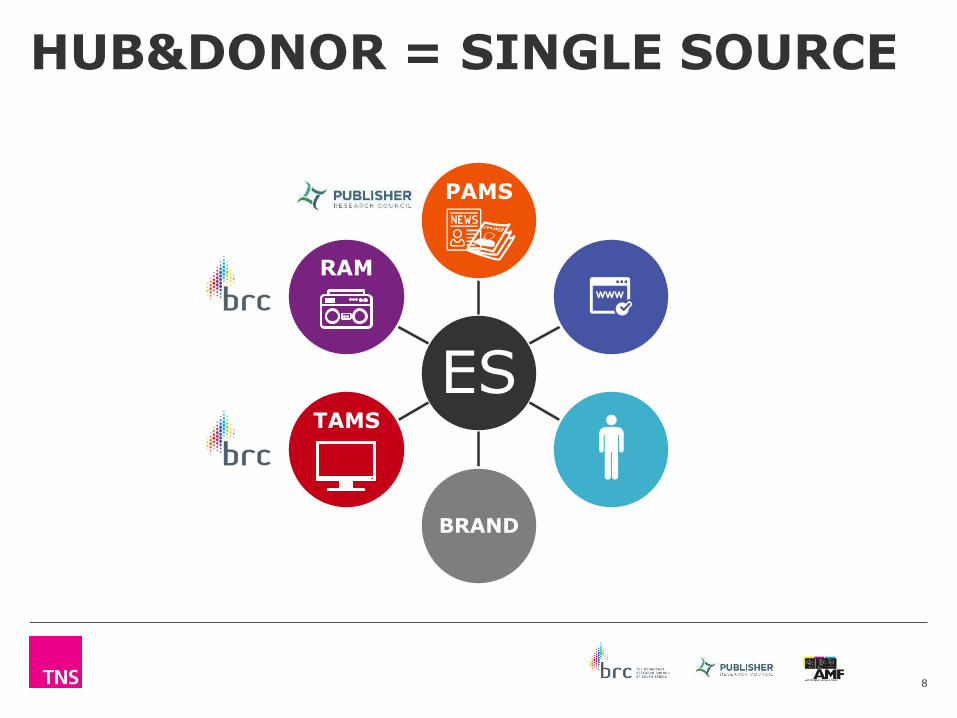
HUB&DONOR = SINGLE SOURCE
ES
PAMS
BRAND
TAMS
RAM
8

ES SAMPLE…
9
CLOSELY REFLECTS THE SA POPULATION
ES (unweighted) IHS Population
Source: ES July-Dec 2016 (n=12,464) Source: IHS Individual Population estimates Dec 2015
Black 81%
Coloured 10%
Indian / Asian 2%
White 7%
Black 78%
Coloured 9%
Indian / Asian 3%
White 10%
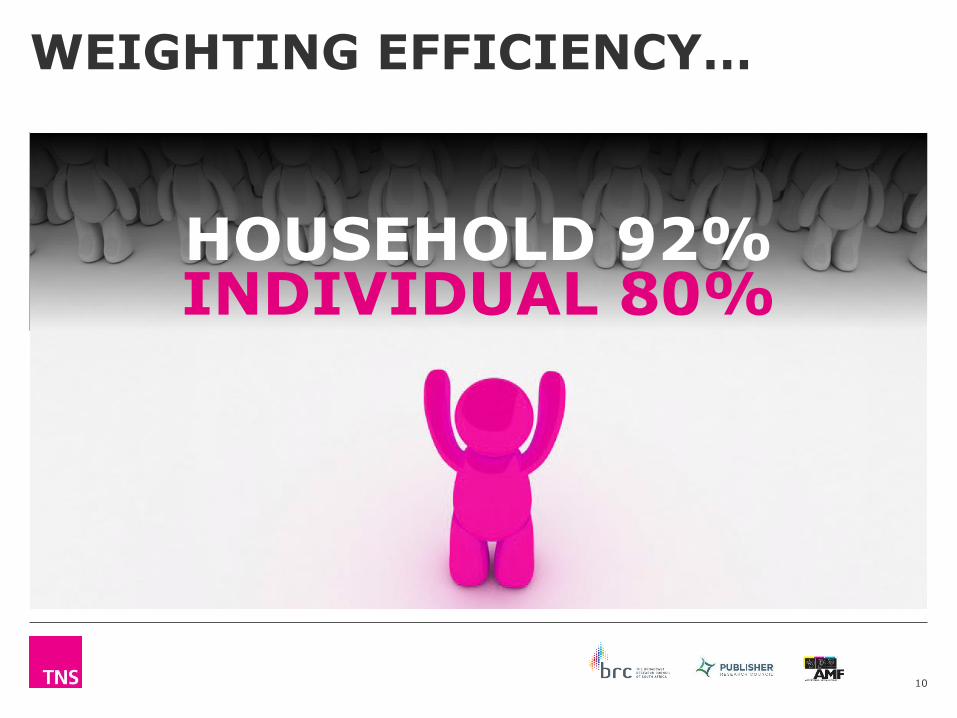
WEIGHTING EFFICIENCY…
10
HOUSEHOLD 92%INDIVIDUAL 80%

Universe: Population age 15+
38.8 million
41% Metro
29% Urban
30% Rural
ES – VITAL SIGNS…
12,464 sampleJUL-DEC 2016
11
NATIONAL SAMPLE

41% Metro
29% Urban
30% Rural
CURRENCY – VITAL SIGNS…
ES SAMPLE
12
60% Metro
20% Urban
20% Rural
BRC RAM
46% Metro
30% Urban
24% Rural
BRC TAMS
50% Metro
30% Urban
20% Rural
PAMS

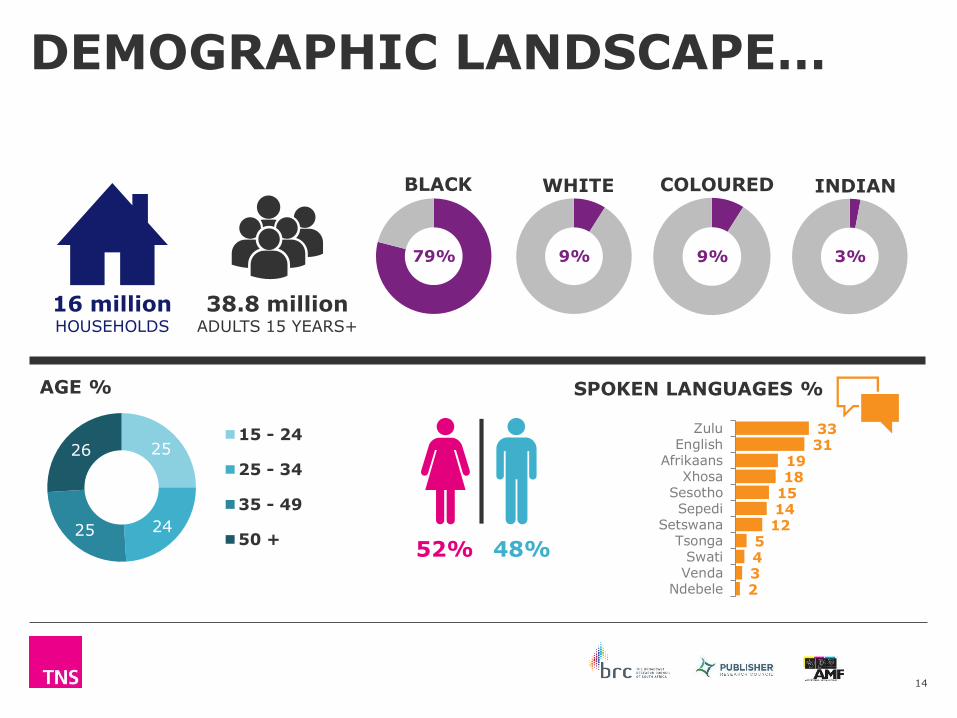
DEMOGRAPHIC LANDSCAPE…
13
14
DEMOGRAPHIC LANDSCAPE…
25
2425
2615 - 24
25 - 34
35 - 49
50 +
16 millionHOUSEHOLDS
38.8 millionADULTS 15 YEARS+
BLACK
79%
WHITE
9%
COLOURED
9%
INDIAN
3%
3331
1918
151412
5432
ZuluEnglish
AfrikaansXhosa
SesothoSepedi
SetswanaTsonga
SwatiVenda
Ndebele
48%52%
AGE % SPOKEN LANGUAGES %

15
DEMOGRAPHIC LANDSCAPE…
46
25
17
8 21
R0 - R4 999
R5 000 - R9 999
R10 000 - R19 999
R20 000 - R39 999
R40 000 - R59 999
R60 000+
MONTHLY HOUSEHOLD INCOME %AVERAGE: R9,885
48% WORKING
52% NOT WORKING
46
41
14
Below Matric
Matric
Tertiary
47% CHILDREN
53% NONE
37
11
25
13
11
4
Working full-time
Working part-time
Not working
Student
Retired
Home executive
CHILDREN UNDER 15 YEARS LIVING AT HOME %
R

GEOGRAPHIC LANDSCAPE…
16

GEOGRAPHIC LANDSCAPE…
41% (15.9m)
30%(11.8m)
29% (11.1m)
PROVINCE % AND POPULATION FIGURES
GP MP
LP
NW
NC
WC
EC
FSKZN
26% (10.2m)
7% (2.6m)
2% (0.8m)
5% (2.0m)
12% (4.6m)
9% (3.6m)
8% (3.0m)
19% (7.2m)
12% (4.6m)
17

PRODUCTS AND LIFESTYLES…
18

46%Shopping mall
73
8
4
15
Black
Coloured
Indian/Asian
White
%
Past week destinations
19
LIFESTYLES…

LIFESTYLES…
10%Restaurant
60
6
5
29
Black
Coloured
Indian/Asian
White
%
Past week destinations
20

Past week destinations
2%Stadium
85
1
1
12
Black
Coloured
Indian/Asian
White
%
21
LIFESTYLES…

37%Home theatre
systemin home
74
7
4
15
Black
Coloured
Indian/Asian
White
%
22
PRODUCT…

68%Microwave oven
in home
72
11
4
14
Black
Coloured
Indian/Asian
White
%
23
PRODUCT…

26%Motor car in home
46
13
7
34
Black
Coloured
Indian/Asian
White
%
24
PRODUCT…
MEDIA LANDSCAPE…
25

▪ Common questions for all media
▪ Number of days used in average week
▪ Time spent per weekday/Sat/Sun
▪ Devices/platforms
▪ Media-specific questions
▪ On the go
▪ Demographics
▪ Geographics
▪ Lifestyles
▪ Products
▪ SEM variables
26
▪ Literacy test
▪ Multi-media screener
▪ Equipment in home
Questionnaire introduction
Media sections Profiling
QUESTIONNAIRE…
DESIGNED BY INDUSTRY THOUGHT LEADERS AND USES A ‘TOP-DOWN’ STRUCTURE

27Note: Devices used in past month amongst past month users of each medium
%
97 11 - - - 3 2
26 44 - 87 75 4
- 21 90 - - 9 6
- 23 81 - - 11 8
- 94 - - - 24 11
TV set CellphonePaper/
printed copyRadio
set/hi-fiCar/taxi/bus radio
Desktop/laptop Tablet
P4WEEK MEDIA LANDSCAPE…DEVICE
28
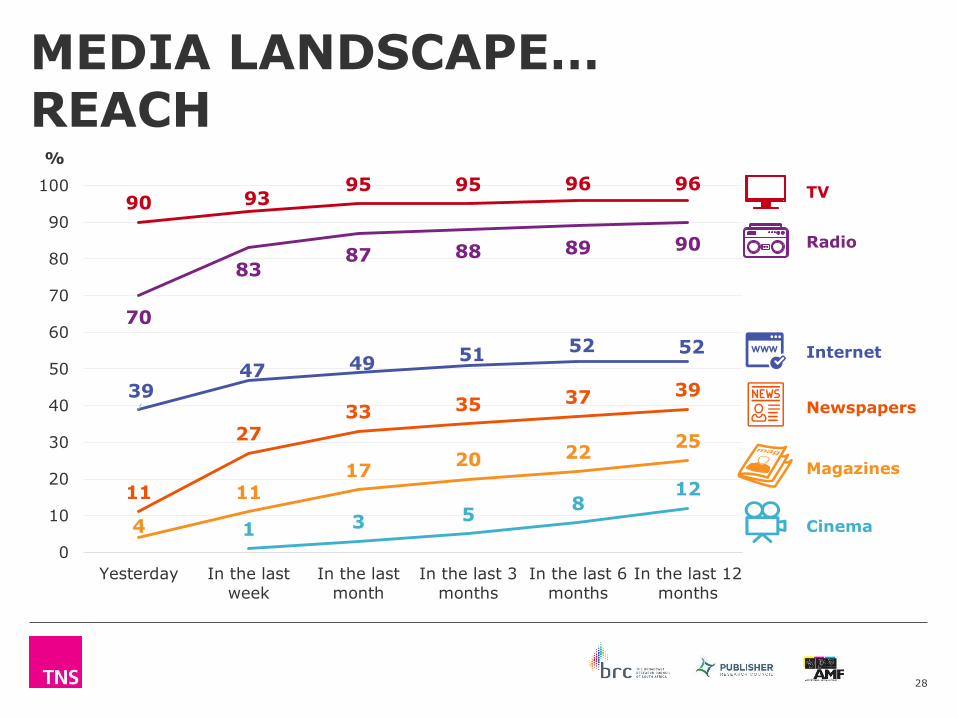
MEDIA LANDSCAPE…REACH
1 3 58
1211
2733 35 37 39
4
1117
20 2225
90 9395 95 96 96
70
8387 88 89 90
3947 49 51 52 52
0
10
20
30
40
50
60
70
80
90
100
Yesterday In the last
week
In the last
month
In the last 3
months
In the last 6
months
In the last 12
months
%
TV
Radio
Newspapers
Magazines
Internet
Cinema

SNAPSHOTS BY MEDIA TYPE…
29

LISTENING…
30
Past 7 days
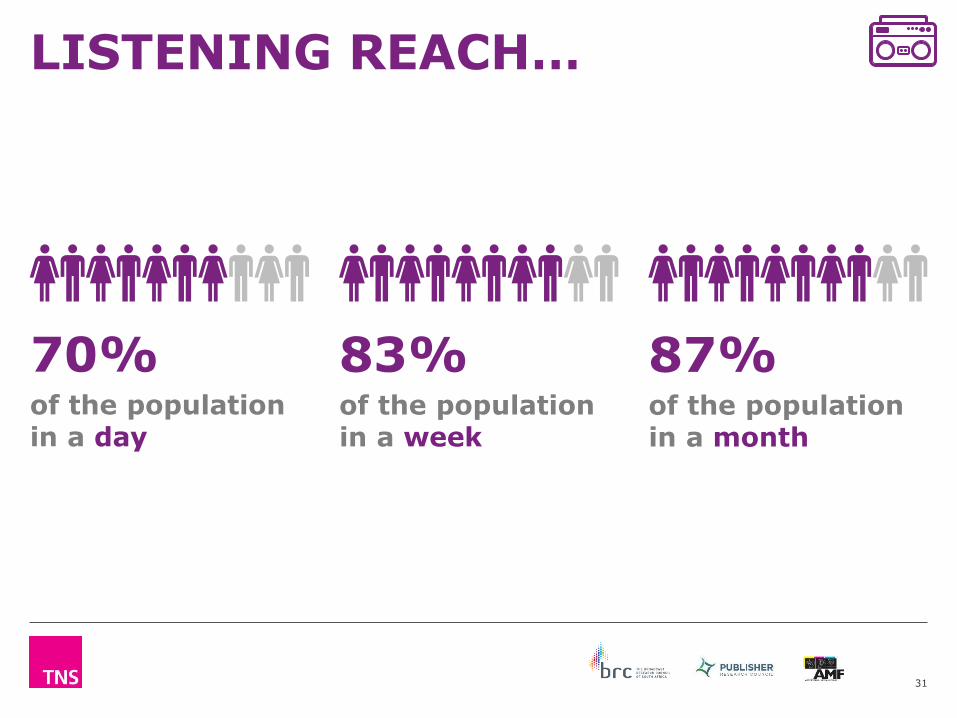
83% of the population in a week
87% of the population in a month
31
70% of the population in a day
LISTENING REACH…

24
2425
2715 - 24
25 - 34
35 - 49
50 +
32
P7D RADIO LISTENERSDEMOGRAPHIC LANDSCAPE…
32.3 millionADULTS 15 YEARS+
WHITE
10%
COLOURED
8%
INDIAN
3%
50%50%
BLACK
79%
AGE %
26
15
12
11
10
9
8
4
3
2
1
Zulu
Xhosa
Afrikaans
English
Sesotho
Sepedi
Setswana
Tsonga
Venda
Swati
Ndebele
HOME LANGUAGE %

33
P7D RADIO LISTENERSDEMOGRAPHIC LANDSCAPE…
45
25
17
9 21
R0 - R4 999
R5 000 - R9 999
R10 000 - R19 999
R20 000 - R39 999
R40 000 - R59 999
R60 000+
MONTHLY HOUSEHOLD INCOME %AVERAGE: R10,115
50% WORKING
50% NOT WORKING
38
12
24
13
11
4
Working full-time
Working part-time
Not working
Student
Retired
Home executive
45
41
14
Below Matric
Matric
Tertiary
46% CHILDREN
54% NONE
CHILDREN UNDER 15 YEARS LIVING AT HOME %
R
34
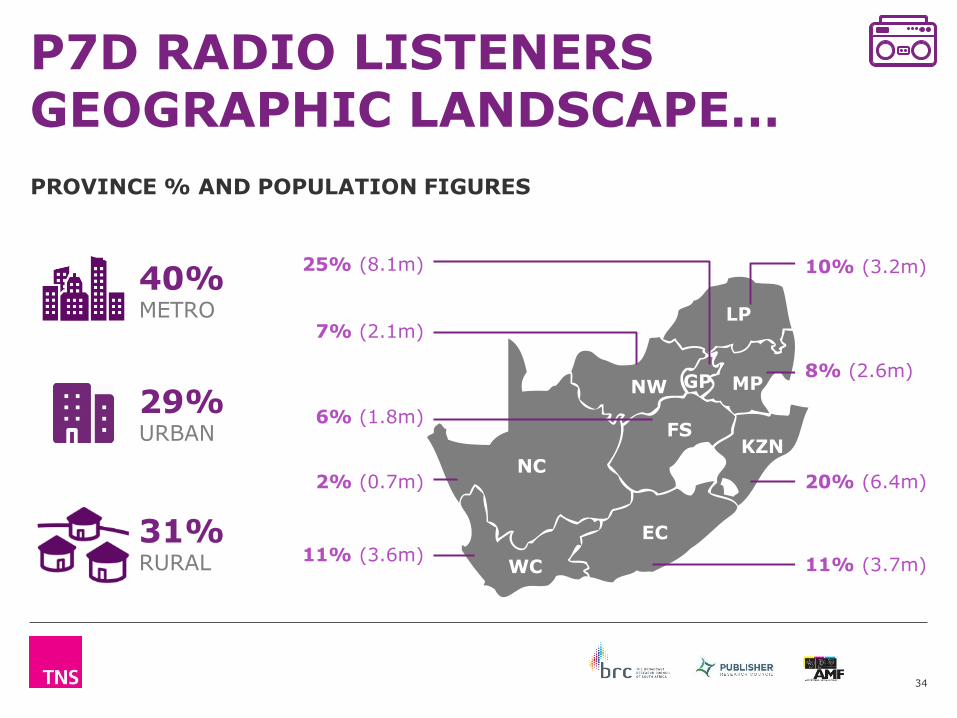
P7D RADIO LISTENERSGEOGRAPHIC LANDSCAPE…
40% METRO
31%RURAL
29% URBAN
GP MP
LP
NW
NC
WC
EC
FSKZN
25% (8.1m)
7% (2.1m)
2% (0.7m)
6% (1.8m)
11% (3.6m)
10% (3.2m)
8% (2.6m)
20% (6.4m)
11% (3.7m)
PROVINCE % AND POPULATION FIGURES
35
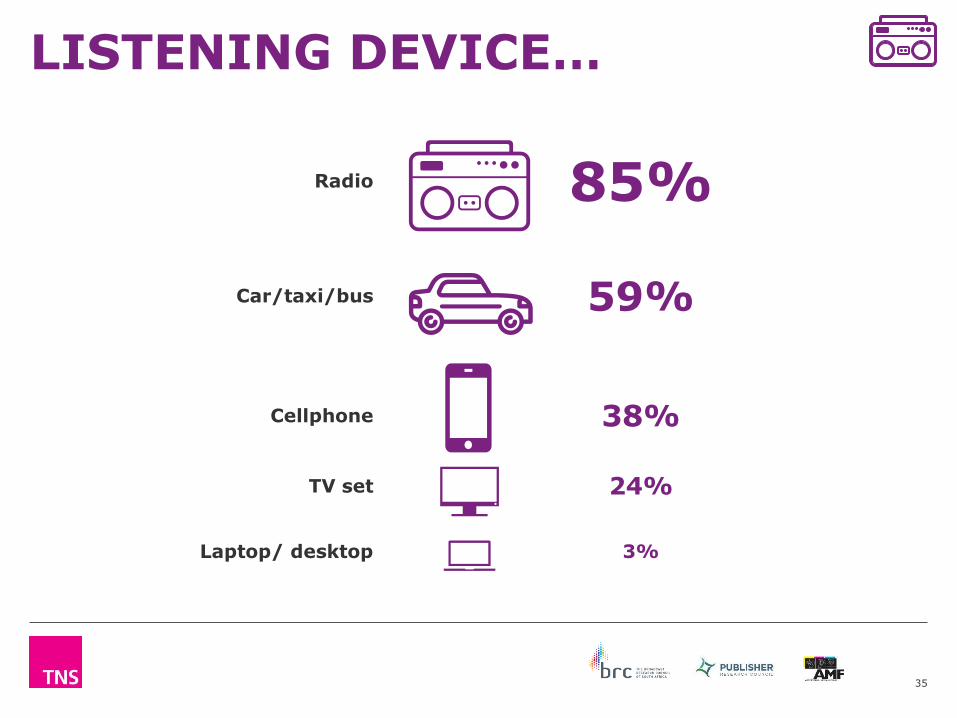
LISTENING DEVICE…
Radio 85%
Car/taxi/bus 59%
Cellphone 38%
TV set 24%
Laptop/ desktop 3%

Home 92%
Car/taxi/bus 33%
Work 11%
University/college 1%
LISTENING LOCATION…
36

Past 7 days
VIEWING…
37
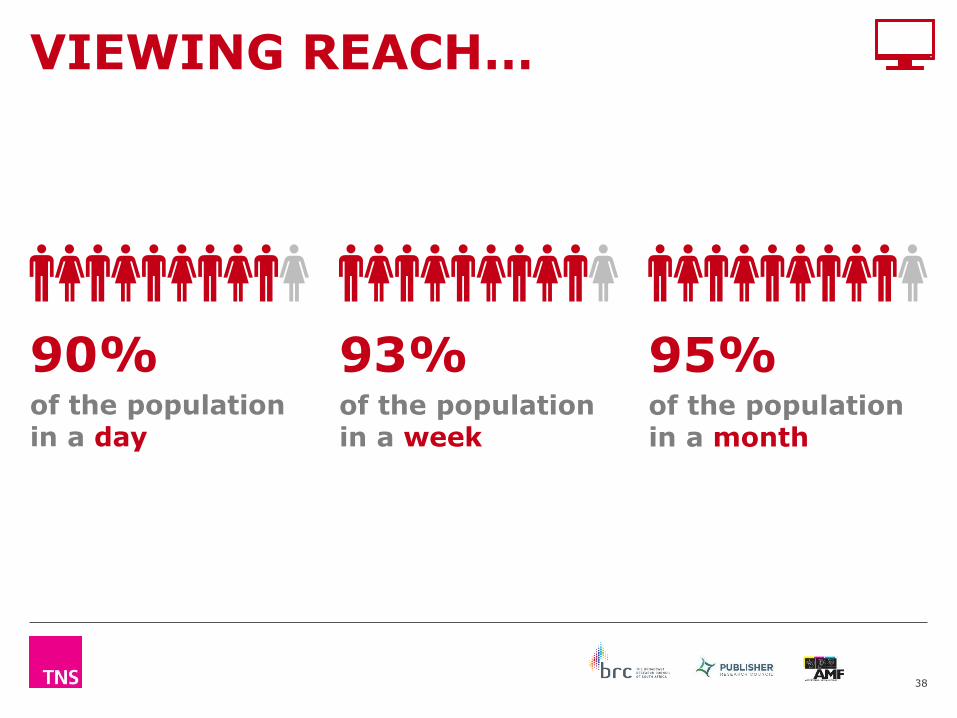
93% of the population in a week
95% of the population in a month
38
90% of the population in a day
VIEWING REACH…

25
2425
2615 - 24
25 - 34
35 - 49
50 +
39
P7D TV VIEWERSDEMOGRAPHIC LANDSCAPE…
36.2 millionADULTS 15 YEARS+
WHITE
10%
COLOURED
9%
INDIAN
3%
48%52%
BLACK
79%
AGE %
26
15
12
11
10
9
8
4
2
2
1
Zulu
Xhosa
Afrikaans
English
Sesotho
Sepedi
Setswana
Tsonga
Swati
Venda
Ndebele
HOME LANGUAGE %

40
P7D TV VIEWERSDEMOGRAPHIC LANDSCAPE…
44
26
18
8 21
R0 - R4 999
R5 000 - R9 999
R10 000 - R19 999
R20 000 - R39 999
R40 000 - R59 999
R60 000+
MONTHLY HOUSEHOLD INCOME %AVERAGE: R10,159
49% WORKING
51% NOT WORKING
38
11
24
13
10
4
Working full-time
Working part-time
Not working
Student
Retired
Home executive
44
42
14
Below Matric
Matric
Tertiary
47% CHILDREN
53% NONE
CHILDREN UNDER 15 YEARS LIVING AT HOME %
R

41
P7D TV VIEWERSGEOGRAPHIC LANDSCAPE…
42% METRO
29%RURAL
29% URBAN
GP MP
LP
NW
NC
WC
EC
FSKZN
27% (9.7m)
7% (2.4m)
2% (0.8m)
5% (1.8m)
12% (4.4m)
9% (3.4m)
8% (2.8m)
19% (6.8m)
11% (4.0m)
PROVINCE % AND POPULATION FIGURES

VIEWING DEVICE…
TV set 97%
Smartphone 10%
Laptop/ desktop 2%
Tablet 1%
Games console 1%
42

VIEWING LOCATION…
Home 97%Shopping centre/shop/bank 7%
Bar/shebeen/pub/café 6%
Work 5%
Restaurant/coffee shop 4%
Car/taxi/bus 3%
School/university/college 1%
43
Past 7 days
READING…
44
45
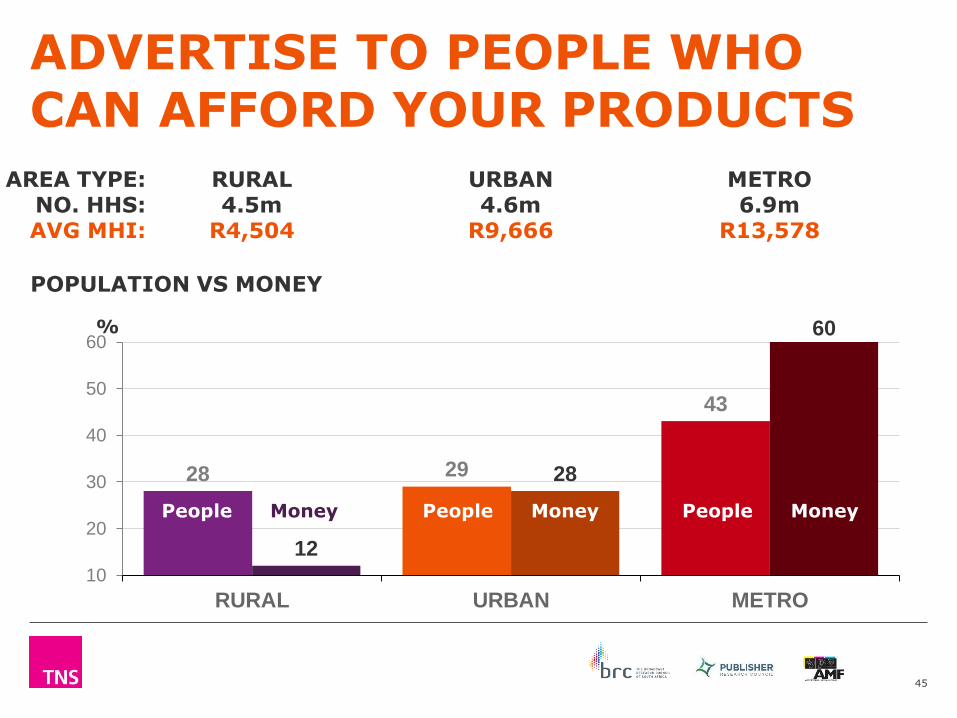
ADVERTISE TO PEOPLE WHO CAN AFFORD YOUR PRODUCTS
RURAL4.5m
R4,504
URBAN4.6m
R9,666
METRO6.9m
R13,578
28 29
43
12
28
60
10
20
30
40
50
60
RURAL URBAN METRO
People Money People MoneyPeople Money
POPULATION VS MONEY
%
AREA TYPE:NO. HHS:AVG MHI:

AVERAGE HOUSEHOLD INCOME…
R 9 885
R 12 883
R 13 348
R 14 445
R 9 000
R 10 000
R 11 000
R 12 000
R 13 000
R 14 000
R 15 000
National Average Newspaper P7D
readers
Internet P7D
users
Magazine P7D
readers
+30%+35%
+46%
46

22
2529
2415 - 24
25 - 34
35 - 49
50 +
47
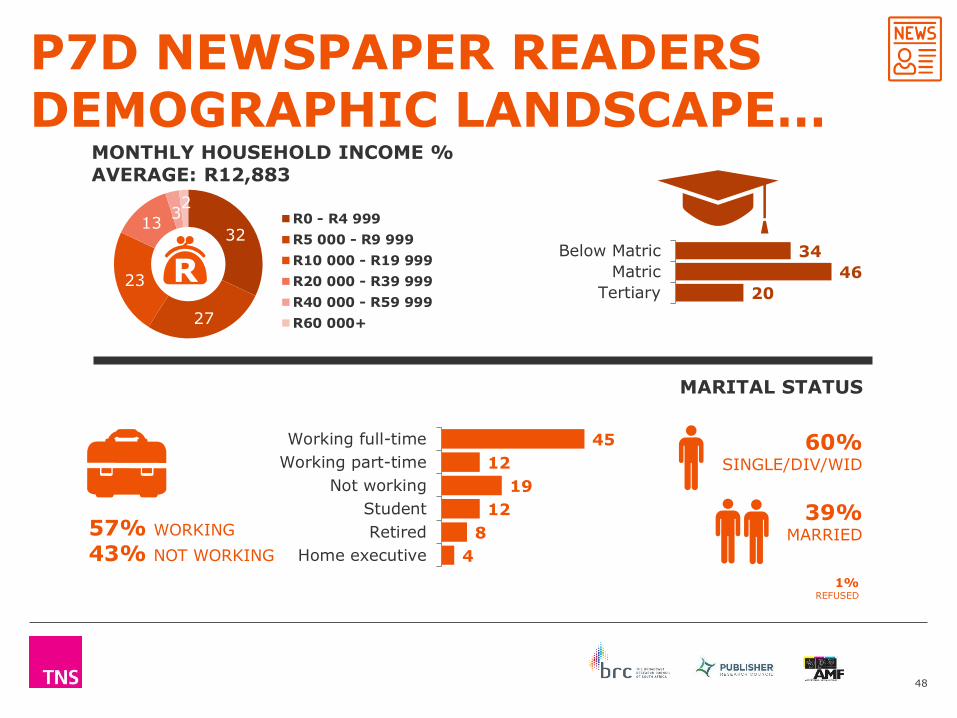
P7D NEWSPAPER READERSDEMOGRAPHIC LANDSCAPE…
10.5 millionADULTS 15 YEARS+
WHITE
14%
COLOURED
12%
INDIAN
4%
54%46%
BLACK
70%
AGE %
93
32
29
15
14
14
13
4
3
2
2
English
Afrikaans
Zulu
Sesotho
Xhosa
Setswana
Sepedi
Tsonga
Swati
Ndebele
Venda
LANGUAGES READ AND UNDERSTAND %
48
P7D NEWSPAPER READERSDEMOGRAPHIC LANDSCAPE…
32
27
23
1332
R0 - R4 999
R5 000 - R9 999
R10 000 - R19 999
R20 000 - R39 999
R40 000 - R59 999
R60 000+
MONTHLY HOUSEHOLD INCOME %AVERAGE: R12,883
57% WORKING
43% NOT WORKING
45
12
19
12
8
4
Working full-time
Working part-time
Not working
Student
Retired
Home executive
34
46
20
Below Matric
Matric
Tertiary
MARITAL STATUS
60% SINGLE/DIV/WID
39% MARRIED
1% REFUSED
R

49
P7D NEWSPAPER READERSGEOGRAPHIC LANDSCAPE…
53% METRO
16%RURAL
31% URBAN
GP MP
LP
NW
NC
WC
EC
FSKZN
33% (3.5m)
7% (0.7m)
2% (0.2m)
5% (0.5m)
17% (1.8m)
6% (0.6m)
7% (0.7m)
17% (1.8m)
7% (0.7m)
PROVINCE % AND POPULATION FIGURES

86 20 7 5
NEWSPAPER PLATFORM USAGE…
50
Multiple platforms
%
CellphonePaper/
printed copyDesktop/
laptop Tablet
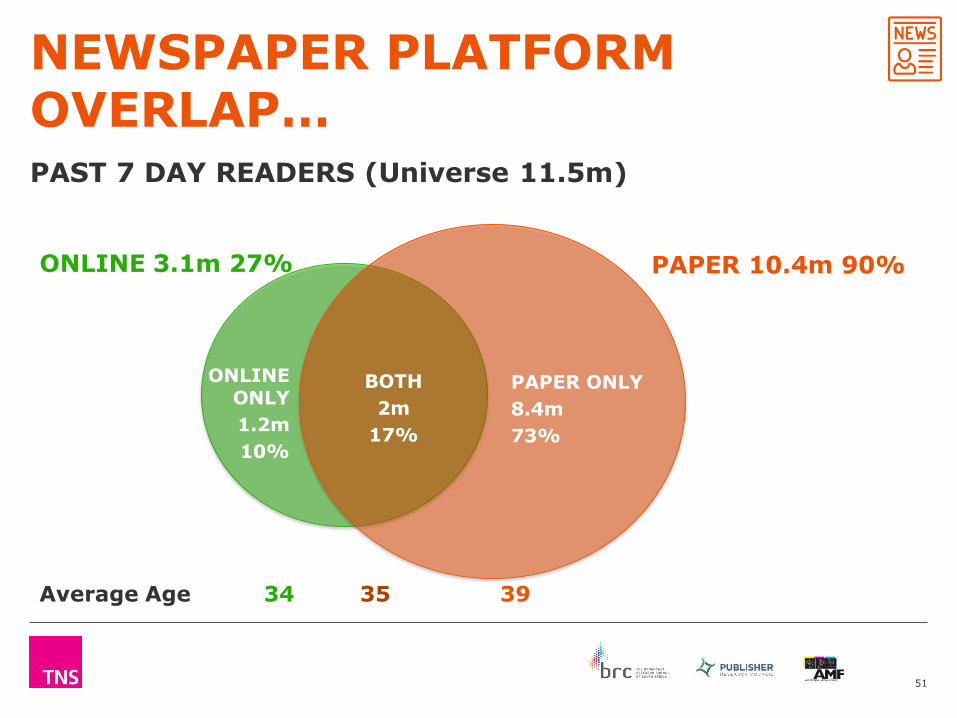
NEWSPAPER PLATFORM OVERLAP…
51
PAST 7 DAY READERS (Universe 11.5m)
PAPER 10.4m 90%ONLINE 3.1m 27%
PAPER ONLY
8.4m
73%
ONLINE ONLY
1.2m
10%
BOTH
2m
17%
Average Age 34 35 39

26
2628
2015 - 24
25 - 34
35 - 49
50 +
52
P7D MAGAZINE READERSDEMOGRAPHIC LANDSCAPE…
4.2 millionADULTS 15 YEARS+
WHITE
18%
COLOURED
10%
INDIAN
3%
41%59%
BLACK
69%
AGE %
91
32
29
17
13
11
11
3
3
3
2
English
Afrikaans
Zulu
Xhosa
Sepedi
Sesotho
Setswana
Tsonga
Swati
Ndebele
Venda
LANGUAGES READ AND UNDERSTAND %

53
P7D MAGAZINE READERSDEMOGRAPHIC LANDSCAPE…
28
2624
165
2R0 - R4 999
R5 000 - R9 999
R10 000 - R19 999
R20 000 - R39 999
R40 000 - R59 999
R60 000+
MONTHLY HOUSEHOLD INCOME %AVERAGE: R14,445
55% WORKING
45% NOT WORKING
45
10
19
15
6
5
Working full-time
Working part-time
Not working
Student
Retired
Home executive
28
46
25
Below Matric
Matric
Tertiary
MARITAL STATUS
62% SINGLE/DIV/WID
37% MARRIED
1% REFUSED
R

54
P7D MAGAZINE READERSGEOGRAPHIC LANDSCAPE…
56% METRO
14%RURAL
30% URBAN
GP MP
LP
NW
NC
WC
EC
FSKZN
35% (1.5m)
4% (0.2m)
2% (0.09m)
4% (0.2m)
18% (0.8m)
6% (0.2m)
8% (0.3m)
15% (0.6m)
8% (0.4m)
PROVINCE % AND POPULATION FIGURES

MAGAZINE PLATFORM USAGE…
55
Multiple platforms
69 23 10 7
%
CellphonePaper/
printed copyDesktop/
laptop Tablet
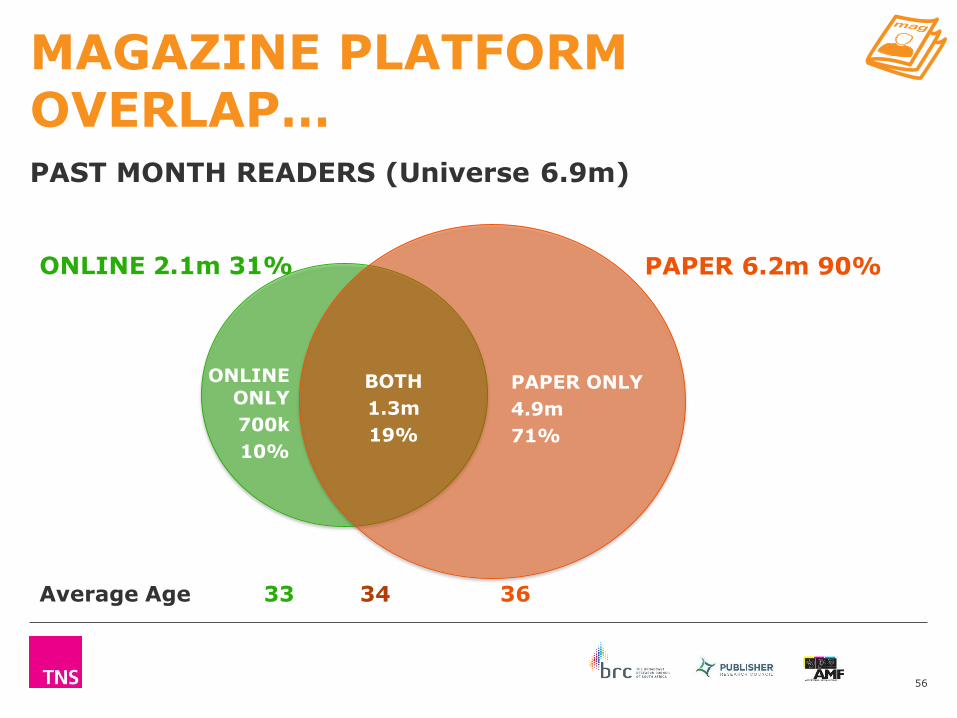
MAGAZINE PLATFORM OVERLAP…
56
PAST MONTH READERS (Universe 6.9m)
PAPER 6.2m 90%ONLINE 2.1m 31%
Average Age 33 34 36
PAPER ONLY
4.9m
71%
ONLINE ONLY
700k
10%
BOTH
1.3m
19%
Past 7 days
DIGITAL
57
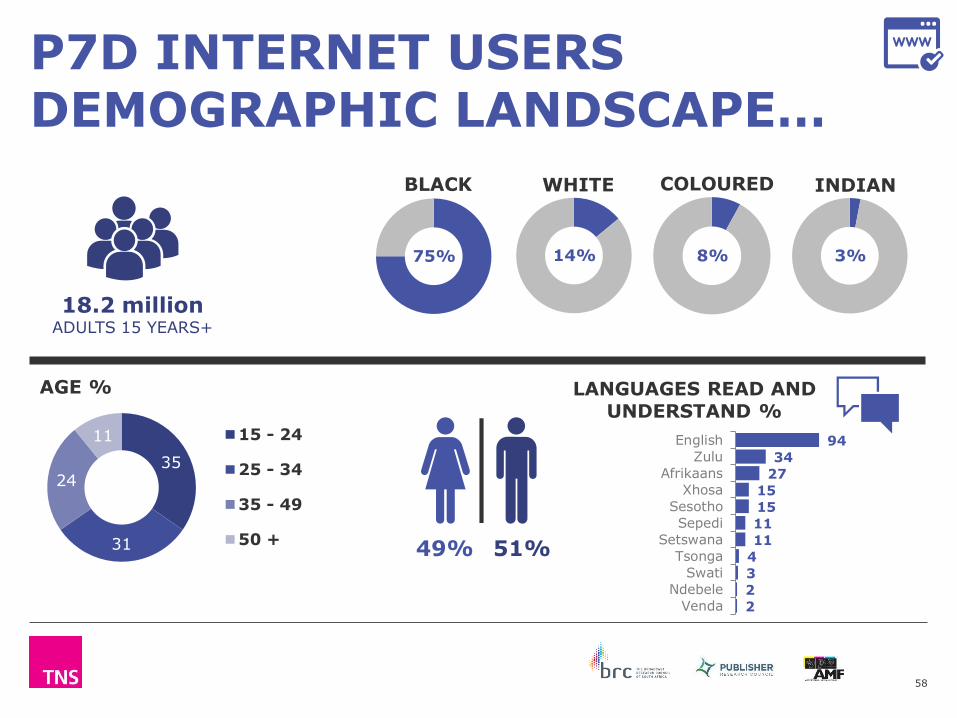
35
31
24
11 15 - 24
25 - 34
35 - 49
50 +
58
P7D INTERNET USERSDEMOGRAPHIC LANDSCAPE…
18.2 millionADULTS 15 YEARS+
WHITE
14%
COLOURED
8%
INDIAN
3%
51%49%
BLACK
75%
AGE %
94
34
27
15
15
11
11
4
3
2
2
English
Zulu
Afrikaans
Xhosa
Sesotho
Sepedi
Setswana
Tsonga
Swati
Ndebele
Venda
LANGUAGES READ AND UNDERSTAND %

59
P7D INTERNET USERSDEMOGRAPHIC LANDSCAPE…
31
27
23
134
2R0 - R4 999
R5 000 - R9 999
R10 000 - R19 999
R20 000 - R39 999
R40 000 - R59 999
R60 000+
MONTHLY HOUSEHOLD INCOME %AVERAGE: R13,348
55% WORKING
45% NOT WORKING
45
10
20
20
3
3
Working full-time
Working part-time
Not working
Student
Retired
Home executive
24
53
23
Below Matric
Matric
Tertiary
MARITAL STATUS
70% SINGLE/DIV/WID
30% MARRIED
R
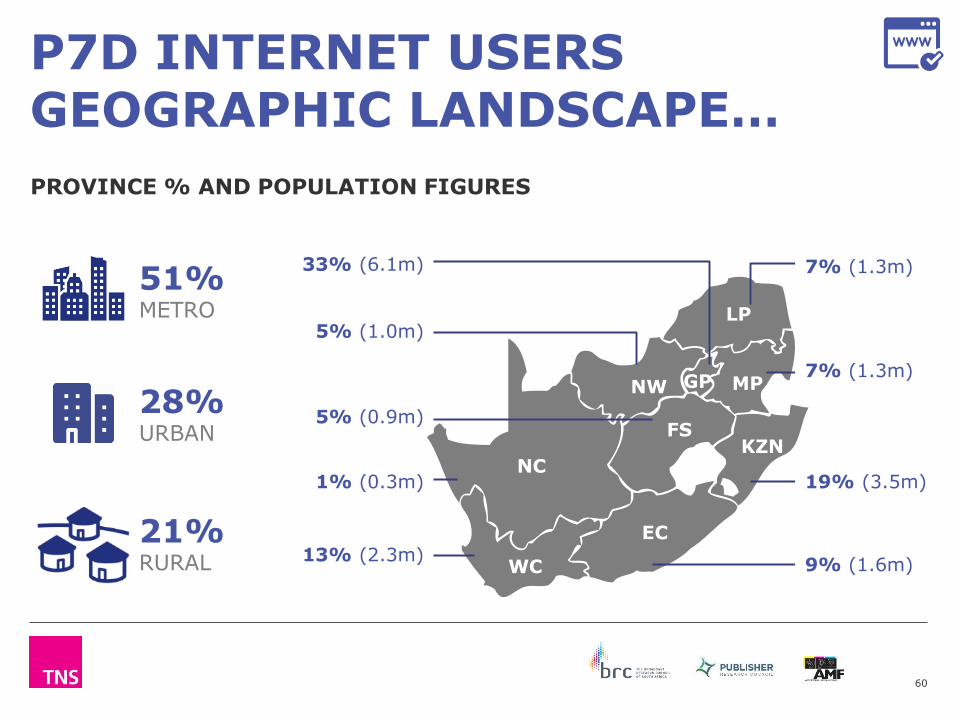
60
P7D INTERNET USERSGEOGRAPHIC LANDSCAPE…
51% METRO
21%RURAL
28% URBAN
GP MP
LP
NW
NC
WC
EC
FSKZN
33% (6.1m)
5% (1.0m)
1% (0.3m)
5% (0.9m)
13% (2.3m)
7% (1.3m)
7% (1.3m)
19% (3.5m)
9% (1.6m)
PROVINCE % AND POPULATION FIGURES
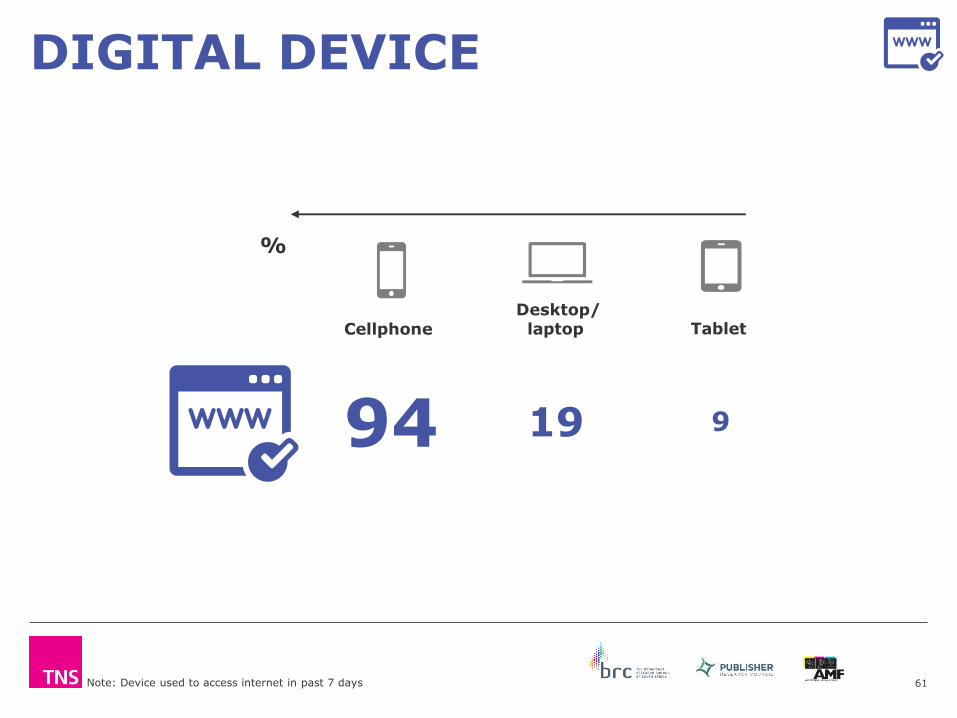
61
DIGITAL DEVICE
Note: Device used to access internet in past 7 days
94 19 9
%
CellphoneDesktop/
laptop Tablet
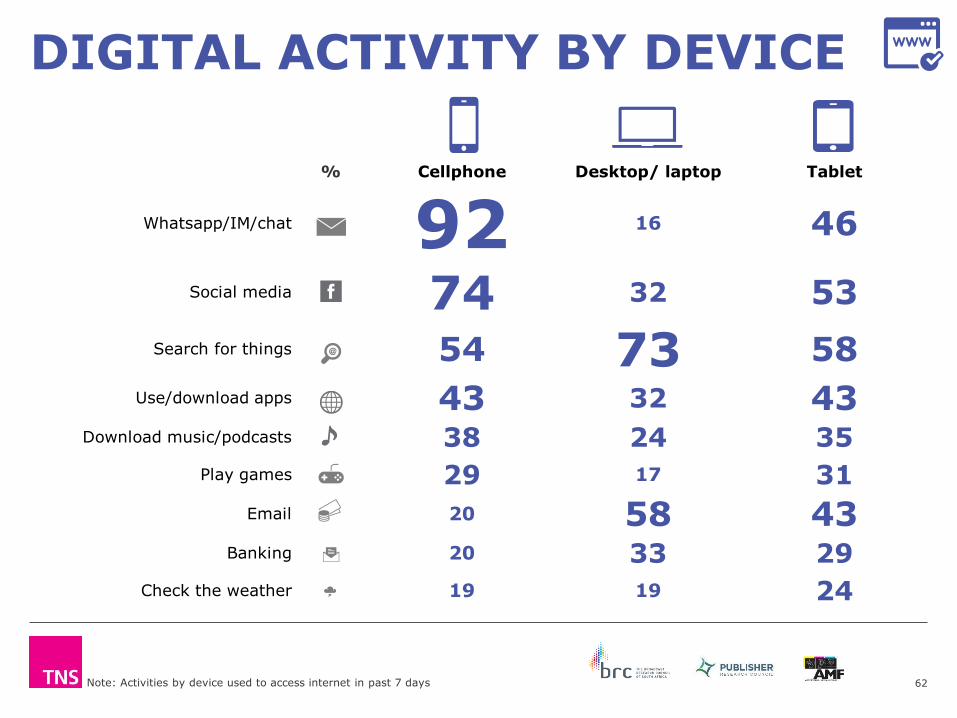
% Cellphone Desktop/ laptop Tablet
Whatsapp/IM/chat 92 16 46
Social media 74 32 53
Search for things 54 73 58
Use/download apps 43 32 43Download music/podcasts 38 24 35
Play games 29 17 31
Email 20 58 43Banking 20 33 29
Check the weather 19 19 24
62
DIGITAL ACTIVITY BY DEVICE
Note: Activities by device used to access internet in past 7 days
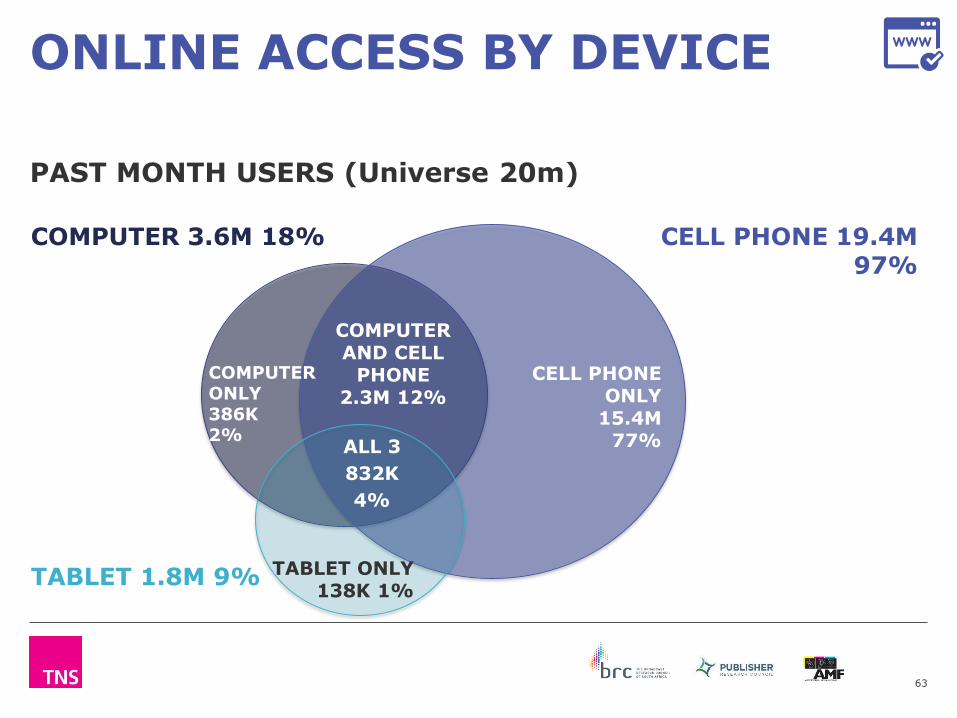
ONLINE ACCESS BY DEVICE
63
CELL PHONE 19.4M 97%
COMPUTER 3.6M 18%
CELL PHONE ONLY
15.4M 77%
COMPUTER ONLY 386K 2%
TABLET ONLY 138K 1%
ALL 3
832K
4%
TABLET 1.8M 9%
COMPUTER AND CELL
PHONE 2.3M 12%
PAST MONTH USERS (Universe 20m)

ONLINE ACTIVITY…MOBILE VS COMPUTER
60% 74%
75%
83%
86%
87%
88%
91%
96%
40% 26%
25%
17%
14%
13%
12%
9% 4%
0%
10%
20%
30%
40%
50%
60%
70%
80%
90%
100%Em
ail
Bankin
g
Searc
h
Check t
he w
eath
er
Use o
r dow
nlo
ad a
pps
Dow
nlo
ad m
usic
or
podcasts
Pla
y g
am
es
Socia
l m
edia
Whats
app/
insta
nt
chat
Series1 Series2
64
Mobile Computer
65
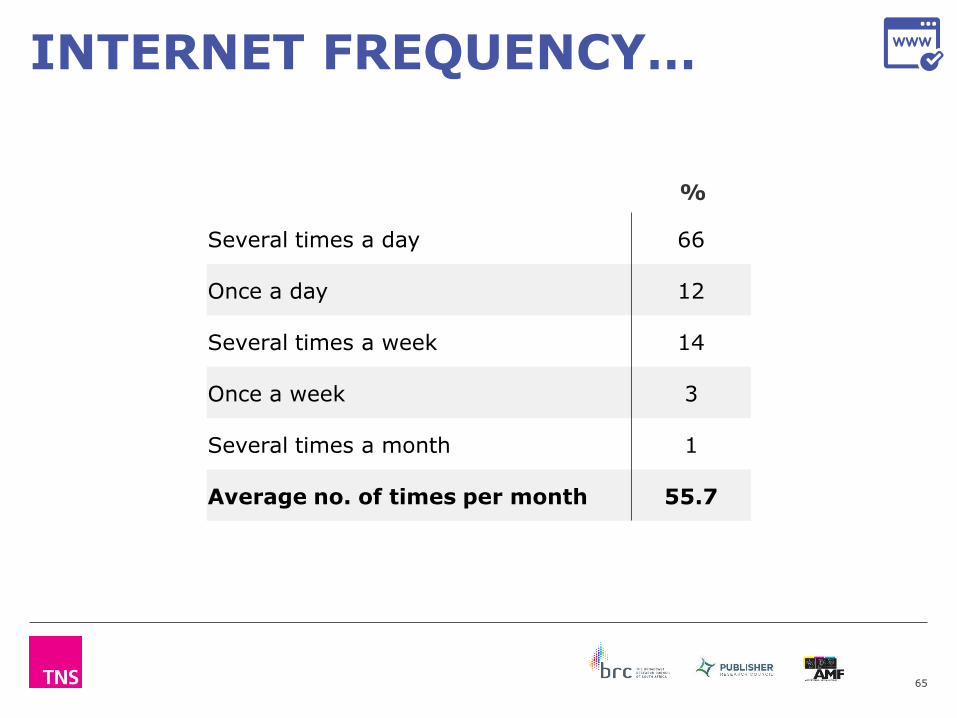
INTERNET FREQUENCY…
Several times a day 66
Once a day 12
Several times a week 14
Once a week 3
Several times a month 1
Average no. of times per month 55.7
%
CINEMA
66
Past month
66

33
30
24
13 15 - 24
25 - 34
35 - 49
50 +
67
PAST MONTH CINEMA GOERSDEMOGRAPHIC LANDSCAPE…
1.1 millionADULTS 15 YEARS+
WHITE
35%
COLOURED
7%
INDIAN
7%
53%47%
BLACK
51%
AGE %
68
37
25
13
9
8
6
2
2
2
2
English
Afrikaans
Zulu
Sepedi
Sesotho
Setswana
Xhosa
Tsonga
Swati
Venda
Ndebele
SPOKEN LANGUAGES %
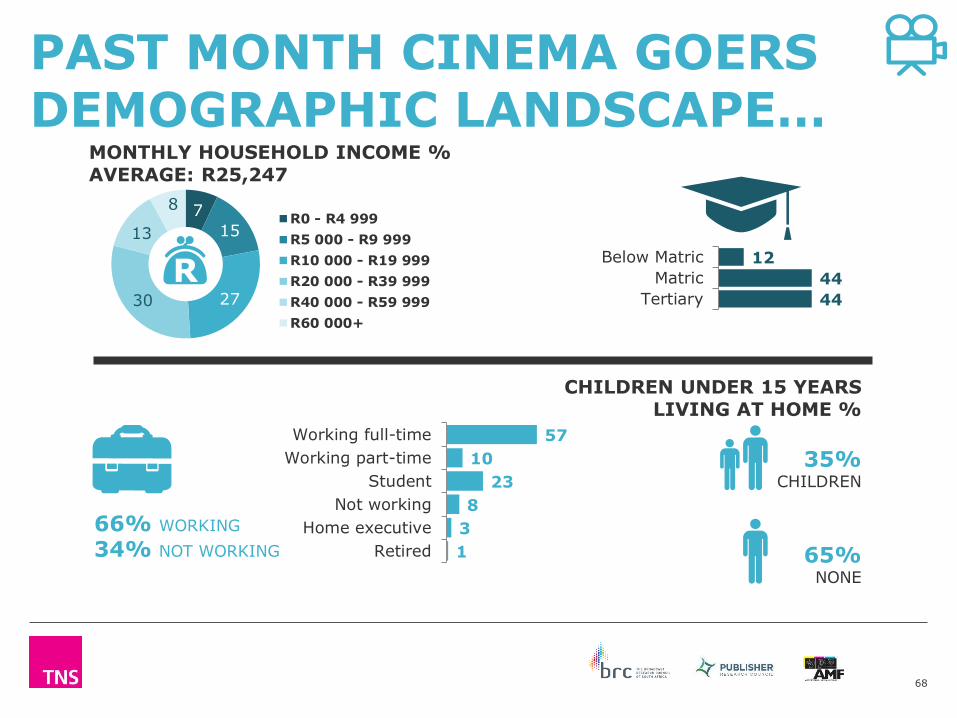
68
PAST MONTH CINEMA GOERSDEMOGRAPHIC LANDSCAPE…
7
15
2730
13
8R0 - R4 999
R5 000 - R9 999
R10 000 - R19 999
R20 000 - R39 999
R40 000 - R59 999
R60 000+
MONTHLY HOUSEHOLD INCOME %AVERAGE: R25,247
66% WORKING
34% NOT WORKING
57
10
23
8
3
1
Working full-time
Working part-time
Student
Not working
Home executive
Retired
12
44
44
Below Matric
Matric
Tertiary
35% CHILDREN
65% NONE
CHILDREN UNDER 15 YEARS LIVING AT HOME %
R

69
PAST MONTH CINEMA GOERSGEOGRAPHIC LANDSCAPE…
68% METRO
4%RURAL
28% URBAN
GP MP
LP
NW
NC
WC
EC
FSKZN
48% (521k)
3% (32k)
1% (8k)
3% (30k)
10% (112k)
7% (71k)
6% (66k)
16% (178k)
6% (67k)
PROVINCE % AND POPULATION FIGURES

70
CINEMA FREQUENCY…
Once a week 1
2-3 times a month 7
Once a month 14
Once every 3 months 23
Once every 6 months 25
Once every 12 months 18
Less than once every 12 months 14
Average no. of visits per year 5.6
%

ON THE GO
71
Past 7 days

72
PAST WEEK DESTINATIONS…
22
13
10
4
3
2
2
2
The bank/ATM
School/college
A restaurant
Bar/shebeen/tavern
Hospital/clinic
Cinema
Stadium
Other/Did not leave home
55
54
46
43
43
41
35
34
Friend's house
Spaza shop
Shopping mall
Store or shop
Church/place of worship
Work
Family member's house
Neighbour's house

73
MODES OF TRANSPORT
Note: Modes of transport to past week destinations
80
56
28
1
1
1
Walked
Taxi or bus
Car
Train
Bicycle or motorbike
Did not leave home
%

INTRODUCING A NEW SOCIO-ECONOMIC SEGMENTATION SYSTEM:
SEM
74
A measure that depicts how you live, not necessarily what you have
75
THE SEM CONCEPTUAL STARTING POINT

0 1Perfectly equal society
Perfectly unequal society
NEEDS TO REFLECT SA SOCIETY
76
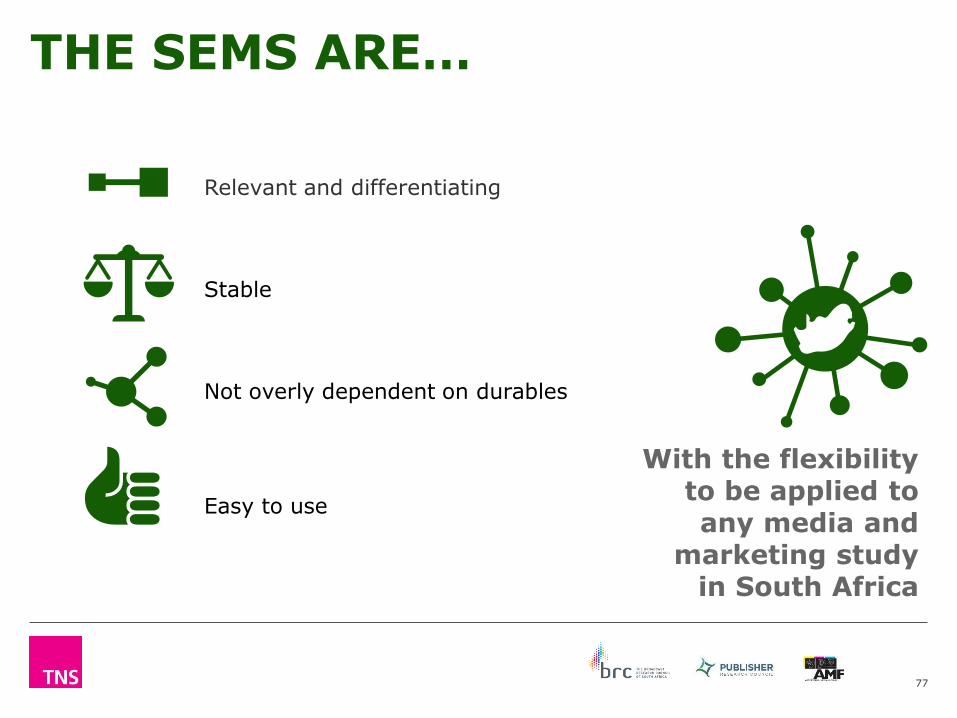
THE SEMS ARE…
Relevant and differentiating
Stable
Not overly dependent on durables
Easy to use
77
With the flexibility to be applied to any media and
marketing study in South Africa

THE SEM DEVELOPMENT PROCESS
78
131
household
variables
Correspon-
dence
analysis
Develop
scoring
system
Continuum
reflective of
SA
1 2 3 4

-0,300
-0,200
-0,100
0,000
0,100
0,200
0,300
0,400
0,500
0,600
0,700
-0,800 -0,600 -0,400 -0,200 0,000 0,200 0,400 0,600 0,800 1,000 1,200 1,400
Dim
en
sio
n 2
(9
.4%
vari
an
ce e
xp
lain
ed
)
Dimension 1 (61.3% variance explained)
79
Desired horseshoe shape
Good inertia
Total inertia 0.08
FIRST ITERATION HAD 131 VARIABLES
No flooring
No water inside
No mains
Thatch/plastic roof 4 or 5 star hotels
Wifi/fibre
Generator
Swimming pool

-0,300
-0,200
-0,100
0,000
0,100
0,200
0,300
0,400
-0,800 -0,600 -0,400 -0,200 0,000 0,200 0,400 0,600 0,800 1,000 1,200
Dim
en
sio
n 2
(5
.7%
varia
nce e
xp
lain
ed
)
Dimension 1 (78.1% variance explained)
Removal of:
Spurious variables
Non-differentiating durables
Overlapping variables at top end
Total inertia 0.19
Low socio-economic living
REMOVAL OF VARIABLES RESULTED IN AN EVEN STRONGER MEASURE
xx
x
No flooring
No police station
No post office
Home security service
Vacuum cleaner
Free standing freezer
Highsocio-economic living
80

Focus on structural items
Low reliance on durables
No reliance on technology items
Short and easy to use
THE 14 SEM VARIABLES…
Final variables:
Post Office nearby
Police station nearby
Built-in kitchen sink
Home security service
Motor car
Deep freezer which is free standing
Microwave oven
Floor polisher or vacuum cleaner
Washing machine
Floor material
Water source
Type of toilet
Roof material
Number of sleeping rooms
81

THE ES SEMs VS THE ES LSMs
82
1317
1410 10 8 9 7 5 7
SEM 1 SEM 2 SEM 3 SEM 4 SEM 5 SEM 6 SEM 7 SEM 8 SEM 9 SEM 10
SEM:
LSM:
02
4
14
22
34
11
5 63
LSM 1 LSM 2 LSM 3 LSM 4 LSM 5 LSM 6 LSM 7 LSM 8 LSM 9 LSM 10
%
%
0 2 4 6 8
10
12
14
16
18
20
22
24
26
28
30
32
34
36
38
40
42
44
46
48
50
52
54
56
58
60
62
64
66
68
70
72
74
76
78
80
82
84
86
88
90
92
94
96
98
100
%
SEM 10 Score
91-100
SEM 9 Score 81-90
SEM 8 Score 71-80
SEM 7 Score 61-70
SEM 6 Score 51-60
SEM 5 Score 41-50
SEM 4 Score 31-40
SEM 3 Score 21-30
SEM 2 Score 11-20
SEM 1 Score 0-10
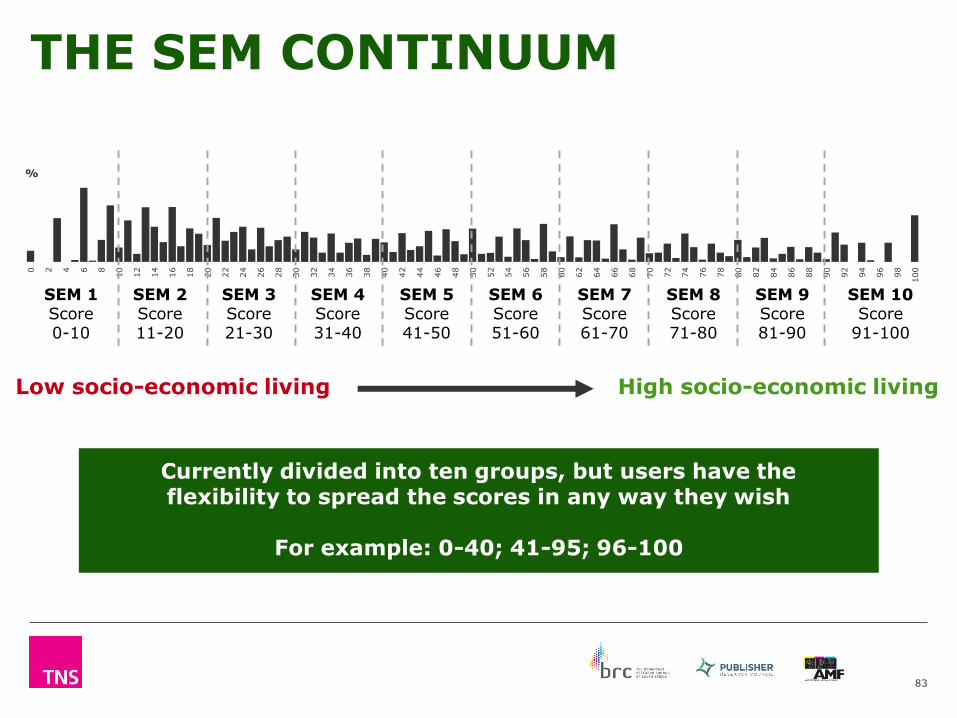
Low socio-economic living High socio-economic living
Currently divided into ten groups, but users have the flexibility to spread the scores in any way they wish
For example: 0-40; 41-95; 96-100
THE SEM CONTINUUM
83

Suppose you wanted to advertise petrol, motor spares or used cars…
SEM TARGETING EXAMPLE…
84
The more precisely one defines the TM, the less the wastage and the better the ROI.
TOTAL SEM1 SEM2 SEM3 SEM4 SEM5 SEM6 SEM7 SEM8 SEM9 SEM10
Motor car in home %Col 26 0 1 4 7 11 20 14 84 95 100
Index 100 0 5 14 27 42 77 164 321 360 380
LSM 7-10 miss out on the top end of SEM 6. So you simply code where the index is 100 or greater (penetration above national average of 26%).
TARGET MARKET IS SEM>=57

Low incidence (%)
High incidence (%)
SEM INPUT VARIABLES…
STRUCTURAL
SEM1 2 3 4 5 6 7 8 9 10
Finished/ sealed floor
4 26 41 51 66 82 89 93 94 98
3+ Sleeping rooms 27 30 39 35 27 43 58 73 85 93
Home security service
0 0 0 1 1 3 8 18 53 89
85
Note: HH weights

SEM INPUT VARIABLES…
DURABLES
SEM1 2 3 4 5 6 7 8 9 10
Washing machine 0 2 14 36 56 72 88 98 99 100
Motor car 0 1 4 7 11 20 43 84 95 100
Microwave 5 32 68 84 92 96 99 99 100 100
86
Low incidence (%)
High incidence (%)
Note: HH weights

SEM INPUT VARIABLES…
INFRASTRUCTURE AND BASIC AMENITIES
Low incidence (%)
High incidence (%)
SEM1 2 3 4 5 6 7 8 9 10
NO Police Station nearby
94 57 48 34 28 23 17 12 10 1
NO Post Office nearby
97 67 55 38 35 30 21 13 12 2
NO Built-in kitchen sink
100 95 77 55 20 7 3 1 0 0
NO Flush toilet inside the house
100 96 82 59 29 13 3 1 1 0
87
Note: HH weights

DEMOGRAPHIC LANDSCAPE BY SEM…
SEM1 2 3 4 5 6 7 8 9 10
Metro 13 19 22 40 53 62 65 63 69 68
Urban 13 21 33 38 35 31 30 34 29 32
Rural 73 60 45 22 12 7 5 3 2 0
88
Note: Individual weights

MONTHLY HH INCOME BY SEM…
89
R3 273 R3 763R4 684
R5 991R7 200
R9 253
R12 734
R18 485
R24 843
R32 259
SEM 1 SEM 2 SEM 3 SEM 4 SEM 5 SEM 6 SEM 7 SEM 8 SEM 9 SEM 10

19
74
56
1
26
72
98
15
Avg. no. of equipment items in home: 2.4 2.6 2.8 2.9 2.9 3.0 3.1 3.3 3.5 4.2
Key equipment penetration:
1317 14
10 10 8 9 7 5 7
SEM 1 SEM 2 SEM 3 SEM 4 SEM 5 SEM 6 SEM 7 SEM 8 SEM 9 SEM 10
%
TV set
Smartphone
Desktop/ laptop
Tablet
Wifi/fibre
11
EQUIPMENT IN HOME BY SEM
90
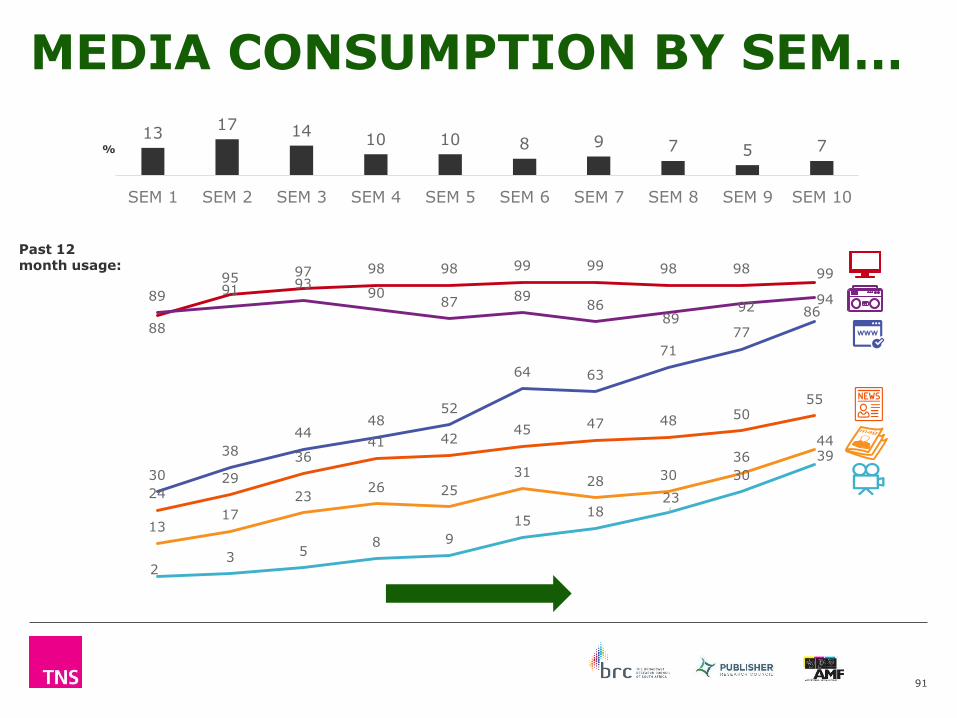
MEDIA CONSUMPTION BY SEM…
91
23 5
8 9
1518
23
30
39
2429
3641 42
45 47 48 5055
1317
2326 25
3128 30
36
44
88
95 97 98 98 99 99 98 98 99
89 91 9390
87 8986
8992
94
30
38
4448
52
64 63
71
77
86
1317 14
10 10 8 9 7 5 7
SEM 1 SEM 2 SEM 3 SEM 4 SEM 5 SEM 6 SEM 7 SEM 8 SEM 9 SEM 10
%
Past 12 month usage:

ES
PAMS
TAMSRAM
SEM INTEGRATION…
SEMs available in September
SEMs in November release
SEMs available in October
92

Thank you
93