introducing lean product development at semcon - …536608/fulltext01.pdf · i introducing lean...
TRANSCRIPT
I
Introducing Lean Product Development at Semcon
- A qualitative study.
David Klamer
Quality Technology & Management
Master’s Thesis
Department of Management and Engineering
LIU-IEI-TEK-A--12/01314--SE
II
ABSTRACT
In today’s market, competition is driving companies to force themselves to constantly
improve. New challenges due to higher competition force engineering companies to reduce
costs, increase their efficiency and decrease time to market. Lean Product Development,
involving powerful methodologies and tools to maximize customer value and eliminate waste,
is being popularised. This Master’s thesis aims to analyse the possibilities of Lean Product
Development in project orientated engineering companies.
Semcon is a global technology company offering engineering services and product
information. It strives to undertake more in-house projects and become a project delivery. A
study was conducted investigating how Semcon and its division TDO can improve its in-
house projects from a resource and time perspective based on Lean Product Development.
Furthermore, it investigates how Lean Product Development can be introduced at Semcon and
during what restrictions. To achieve a deeper understanding of the methodologies and its
possibilities at Semcon, benchmarking was conducted at Autoliv, Saab EDS and Scania,
companies that successfully have initiated Lean transformation in their PD processes.
The study reaches the conclusion that by working with continuous improvement, great
potential exists for Semcon to improve its organisation. No systematic approach for utilising
new ideas exists today and improvements need to be better spread and standardised in the
company. Benchmarking companies have shown remarkable results working with this
methodology and by introducing it at Semcon, it should provide great possibilities.
Furthermore, the study shows that TDO’s ambition is to add much value in the earlier phases
of product development. According to TDO’s management as well as research within the
field, these phases are where most costumer value is created. By working with even more
front-loaded product development, utilising a broader design space, TDO will gain
advantages such as closer customer interaction and more successful results. Set-based design
is a methodology recommended for TDO to avoid long iterative loops. When investigating
what limitations exist when trying to combine XLPM, Semcon’s project model, and Lean
Product Development, no great obstacles are observed. In XLPM, the first tollgates are to be
postponed in comparison to traditional product development, to better suit front-loaded
product development. The benchmarking companies are working with similar stage-gate
project models, and have with satisfying results managed to combine it with Lean Product
Development.
The study reaches the conclusion that by creating a visual organisation, using a so-called
Obeya room, the best possibilities for introducing Lean Product Development at Semcon will
occur. A larger transparency between projects and more spreading of knowledge is requested
by Semcon consultants, which a visual organisation provides. An action plan for an Obeya
room is presented involving tools that support essential Lean methodologies that are
important for TDO, such as continuous improvement, standardisations and knowledge flow.
Visual tools supporting the possibilities to conduct parallel projects and handle resources
more efficient are presented. TDO is recommended to initiate its Lean journey with an Obeya
room.

III
ACKNOWLEDGEMENT
I want to express my gratefulness for the contribution of everyone involved in this thesis.
First of all I like to thank my supervisors, Helene Laurell at Semcon and Jostein Langstrand at
Linköping University, for guidance during the thesis period. I am thankful for all the help and
support during the writing and development of this report.
I also like to thank my opponent Emma Rost for feedback and discussions during the whole
work. It has been very helpful. Thank you also Bozena Poksinska, my university examinator,
for input and guidance during the thesis period.
I like to express my gratefulness to Stefan Bükk, consultant at Swerea IVF, for great ideas and
information. Your help has been much appreciated. Thank you also Andres Laas and Anders
Svantesson at Autoliv for valuable information. Thank you Roine Lundström at Saab EDS for
sharing your knowledge and thoughts, and thank you Peter Palmér at Scania for interesting
information and discussions.
I like to thank everyone at Semcon that have helped me during the thesis period. You all have
been very kind and encouraging.
Finally but not least, I like to thank my family for all the support and encouragement that you
have been given to me during my studies.
Gothenburg, 12 June 2012
David Klamer
iv
Contents Part I INTRODUCTION ........................................................................................................... 1
1 INTRODUCTION ............................................................................................................ 2
1.1 Problem background .................................................................................................... 3
1.2 Purpose and research questions ................................................................................... 3
1.3 Delimitations ............................................................................................................... 4
Part II THEORETICAL FRAMEWORK .................................................................................. 5
2 LEAN PRODUCT DEVELOPMENT .............................................................................. 6
2.1 Lean Product Development – Human perspective ...................................................... 8
2.2 Lean Product Development – Process perspective .................................................... 10
2.2.1 Set-based design ................................................................................................. 12
2.3 Lean Product Development – Tools & Technology perspective ............................... 16
2.3.1 Visual organisation ............................................................................................. 16
2.3.2 Continuous improvement ................................................................................... 20
2.3.3 Standardisations ................................................................................................. 21
2.3.4 Value Stream Mapping ....................................................................................... 21
2.3.5 A3 communication tool ...................................................................................... 22
2.3.6 Chief engineer .................................................................................................... 22
3 PROJECT MANAGEMENT .......................................................................................... 23
3.1 Introduction ............................................................................................................... 23
3.2 Excellence in Project Management (XLPM) ............................................................. 24
3.2.1 Project organisation ............................................................................................ 24
3.2.2 Project life cycle model ...................................................................................... 25
3.2.3 Perspectives ........................................................................................................ 26
Part III METHODOLOGY ...................................................................................................... 28
4 INTRODUCTION .......................................................................................................... 29
4.1 Research design ......................................................................................................... 29
4.2 Research orientation .................................................................................................. 29
4.3 Approach of the study ................................................................................................ 30
4.4 Qualitative study ........................................................................................................ 30
4.5 Methods ..................................................................................................................... 31
4.5.1 Interviews ........................................................................................................... 31
4.5.2 Workshops .......................................................................................................... 33
4.5.3 Observations ....................................................................................................... 33
4.6 Method reflection ...................................................................................................... 33
4.7 Validity and reliability ............................................................................................... 34
Part IV EMPIRICAL FINDINGS ............................................................................................ 35
v
5 EXPLORATORY STUDY SEMCON ........................................................................... 36
5.1 Total Design Office ................................................................................................... 36
5.2 Project methodology .................................................................................................. 37
5.3 Product development ................................................................................................. 39
5.4 Communication and project organisation .................................................................. 40
5.5 Resource utilisation ................................................................................................... 41
5.6 Quote ......................................................................................................................... 41
6 BENCHMARKING ........................................................................................................ 42
6.1 Autoliv ....................................................................................................................... 42
6.1.1 Lean Product Development at Autoliv ............................................................... 42
6.1.2 Lean Product development combined with Autoliv’s project model ................. 43
6.1.3 Introducing Lean Product Development at Autoliv ........................................... 44
6.2 Saab EDS ................................................................................................................... 45
6.2.1 Lean Product Development at Saab EDS ........................................................... 45
6.2.2 Lean Product development combined with Saab EDS’s project model ............. 46
6.2.3 Introducing Lean Product Development at Saab EDS ....................................... 46
6.3 Scania ......................................................................................................................... 47
6.3.1 Lean Product Development at Scania ................................................................ 47
6.3.2 Lean Product development combined with Scania’s project model .................. 48
6.3.3 Introducing Lean Product Development at Scania ............................................. 48
Part V DISCUSSION ............................................................................................................... 50
7 ANALYSIS ..................................................................................................................... 51
7.1 Lean Product Development – Human perspective .................................................... 51
7.2 Lean Product Development – Process perspective .................................................... 53
7.2.1 Excellence in Project Management (XLPM) combined with Lean Product
Development ....................................................................................................... 54
7.3 Lean Product Development – Tools and Technology perspective ............................ 59
8 ACTION PLAN .............................................................................................................. 62
8.1 Visual organisation, a first step introducing LPD ..................................................... 63
8.2 Justification for the action ......................................................................................... 63
8.3 Design of Obeya room ............................................................................................... 64
8.4 Introducing the Obeya room ...................................................................................... 67
8.5 Possible effects .......................................................................................................... 67
9 CONCLUSIONS ............................................................................................................ 69
9.1 Lean Product Development – Human perspective .................................................... 69
9.2 Lean Product Development – Process perspective .................................................... 70
9.3 Lean Product Development – Tools and Technology perspective ............................ 71

vi
9.4 General conclusions ................................................................................................... 72
10 REFERENCES ............................................................................................................... 73
1 APPENDIX ..................................................................................................................... 77
1.1 Air-cleaner project ..................................................................................................... 77
1.1.1 Purpose following project air-cleaner ................................................................ 77
1.1.2 Method ............................................................................................................... 78
1.1.3 Project model ...................................................................................................... 78
1.1.4 Concept phase .................................................................................................... 79
1.1.5 Development phase ............................................................................................ 79
1.1.6 Process Air-cleaner project ................................................................................ 80
1.1.7 Results ................................................................................................................ 81
2 APPENDIX ..................................................................................................................... 82
2.1 A3 Obeya room ......................................................................................................... 82
3 APPENDIX ..................................................................................................................... 84
3.1 Interview guide benchmarking companies ................................................................ 84

vii
Figures
Figure 2-1. LPD system. ............................................................................................................ 7
Figure 2-2. The Toyota Way 2001. ........................................................................................... 9 Figure 2-3. Queue phenomenon. .............................................................................................. 10 Figure 2-4. LPD-process five phases. ...................................................................................... 11 Figure 2-5. LPD-model with knowledge flow (Kennedy model). ........................................... 11 Figure 2-6. Back-loaded VS Front-loaded PD. ........................................................................ 12
Figure 2-7. Traditional PD VS Set-based PD. ......................................................................... 13 Figure 2-8. Set-based design principles. .................................................................................. 13 Figure 2-9. Innovation/Risk Set-based design. ........................................................................ 15 Figure 2-10. Obeya room. ........................................................................................................ 18
Figure 2-11. PDCA-cycle. ........................................................................................................ 20 Figure 3-1. General project model. .......................................................................................... 23 Figure 3-2. XLPM - Project organisation model. ..................................................................... 24
Figure 3-3. XLPM life cycle model. ........................................................................................ 25 Figure 3-4. Project process reliability. ..................................................................................... 26 Figure 5-2. TDO’s participation in external customer's project. .............................................. 38 Figure 6-1. LPD-tools Autoliv. ................................................................................................ 43 Figure 6-2. LPD-tools Saab EDS. ............................................................................................ 45 Figure 6-3. Scania product development approach. ................................................................. 47 Figure 6-4. LPD-tools Scania. .................................................................................................. 48
Figure 8-1. Effects of visual organisation. ............................................................................... 63 Figure 8-2. Planning board. ...................................................................................................... 64
Figure 8-3. Resource board. ..................................................................................................... 65 Figure 8-4. Quote board. .......................................................................................................... 65
Figure 8-5. Vision board. ......................................................................................................... 65 Figure 8-6. Issue board. ............................................................................................................ 66
Figure 8-7. Improvement board. .............................................................................................. 66
Tables
Table 2-1.Waste in PD. .............................................................................................................. 7
Table 4-1. An overview of the study design. ........................................................................... 29 Table 4-3. Interviews at Semcon. ............................................................................................. 31
Table 4-4. Interviews at benchmarking companies. ................................................................. 32 Table 7-1. XLPM tollgates VS LPD phases. ........................................................................... 57

viii
Glossary
Back-loaded PD PD-process with resources concentrated late in the project.
Compass Semcon’s management system.
Direct service Product development projects conducted for an external customer
at customer’s premises.
Front-loaded PD PD-process with resources concentrated early in the project.
In-house project Product development projects conducted for an external customer
at Semcon’s premises.
Point-based design Single PD-solution which aims to reach a single point in the design
space.
Set-based design Parallel PD-solutions reduced gradually to receive an optimal
solution in the design space.
Abbreviations
D&D Design & Development
EDS Electronic Defence System
LP Lean Production
LPD Lean Product Development
PD Product Development
PEAQ Project, Engineering and Quality
Q&E Quality & Environment
SPM Semcon Project Management
TDO Total Design Office
TPS Toyota Production System
VM Visual Management
VSM Value Stream Mapping
VP Visual Planning
XLPM Excellence in Project Management

1
Part I
INTRODUCTION
In the initial chapter the background, problem background, purpose and research questions,
and delimitations are presented.

2
1 INTRODUCTION
To discover working methodologies that enable higher innovations, quality and customer
value, demanding less resources and delivery time, is an aim and ambition among the
majority of companies around the world. It would provide competitive advantages without
opposition. How this is managed is however a complex matter, making it difficult to initiate,
and even more difficult to implement, into an organisation. Many companies have tried, but
few have succeeded. Researchers have explored and searched for the definitions behind truly
successful organisations, but much understanding behind the mechanisms are not yet
identified. Perhaps we are now beginning to see parts of the explanations as the top of an
iceberg, but with much water still hiding the base.
The Machine that Changed the World (Womack et al., 1990) took the automotive industry by
storm introducing how Toyota was performing more efficient and economical than their
European and U.S competitors. The research was based on the largest study ever undertaken
of any industry and included the fourteen-countries International Motor Vehicle Program1
lead by Massachusetts Institute of Technology. The Machine popularized the term Lean
Production (LP), describing a faster, more efficient and more economical production system
than the traditional known to the western world. LP created a revolution in the manufactory
industries leading to great improvements in several different sectors. The Machine did not
only describe the superior manufacturing capabilities among Japanese automakers, but also
their product development (PD). The less known concept entitled Lean Product Development
(LPD) was presented based on Toyota Product Development System, involving powerful
methodologies and tools to maximize customer value and contribute to long term solutions.
Morgan & Liker (2006) argue that these ideas can provide large improvements in PD.
Nowadays, companies have a greater variation in product development than in manufacturing,
leading to huge strategic possibilities and potential competitive advantages.
In today’s market, competition is driving companies to force themselves to improve
constantly. Organisations face an intense pressure to reduce costs, decrease time to market
and maximize stakeholder’s value in product development. (Letens et al., 2011) PD is rapidly
becoming a more important industrial competence than manufacturing, creating new
competitive advantages. It can be argued that PD will be the next dominant competence in the
industry within a near future, since there are much more possibilities for competitive
advantages there, than anywhere else. (Morgan & Liker, 2006) However, despite a lot of
research in the field, there is still little understanding of the characteristics of efficient PD
compared to efficient manufacturing. Many studies have been conducted investigating how
Lean Production significantly has improved efficiency in manufacturing, while Lean Product
Development still is a relative unknown area of possibilities. (Letens et al., 2011)
1 Research program initiated 1985, exploring the fundamental forces of industrial change. The program is based
on research from the factory floor to the executive management, including motor vehicle companies across the
world. (Womack et al., 1990)
3
1.1 Problem background
Engineering companies are facing new challenges due to higher competition on today’s
international markets. Reduction of costs, efficient resource utilisation and decreased time to
market are becoming more vital criteria for successful product development. A study
investigating if PD can be improved and the competitive advantages strengthen, using Lean
Product Development methodologies, is therefore of great interest.
In this study, the possibilities of Lean Product Development have been examined at Semcon,
a global technology company offering engineering services and product information. Semcon
is active in several different areas, providing a wide range of expertise with its 3 000
employees. The company’s customers are mainly in development-intensive industries, e.g. in
the automotive, offshore and energy sectors. Semcon has offices in Sweden, Germany, UK,
Brazil, Hungary, India, China, Spain and Russia. Sweden represents around fifty percent of
the sales and is where the company originally was launched. The headquarter is located at
Norra Älvstranden in Gothenburg, Sweden. Semcon consists of three business areas: (1)
Automotive, (2) Design and Development and (3) Informatics.
Semcon is a project centred organisation. The company uses a well established and developed
project model, Excellence in Project Management (XLPM®), which is used for projects both
internal and external (if customers prefers). XLPM was first developed for Ericsson under the
name PROPS™ and is a methodology for control and management of projects. It is designed
to suit different sizes of projects and organisations and is adapted to international standards
such as PMI® and ISO. Semcon’s management has decided that all in-house projects (PD
projects conducted for an external customer at Semcon’s premises) should be executed using
XLPM as project model, a decision leading to certain difficulties. Due to the high variation of
projects (size, technology, time to delivery, available competence, geographical distribution
etc.), standardised project execution may be problematic.
Product development projects executed in-house are often managed simultaneously at
Semcon. Several projects are executed parallel (independently from each other) and might
require the same resources, leading to limitations in projects. Resources in form of expertise
and time can be insufficient. Semcon has as strategy to undertake more and larger in-house
projects, and an efficient project handling is therefore becoming a more vital criterion for
Semcon’s future success.
1.2 Purpose and research questions
The thesis aims to examine how an introduction of Lean Product Development can be
initiated. The ambition is to develop suggestions, based on LPD, presenting how Semcon in a
resource efficient way can conduct parallel projects. The suggestions are based on analyses of
the current working situation at Semcon, benchmarking from companies that have
successfully initiated Lean transformation into their product development processes,
interviews with experts and theory within the related field.

4
The two main questions for this thesis are:
1. How can Semcon improve its in-house projects from a resource and time perspective
based on Lean Product Development?
a. Human perspective.
b. Process perspective.
c. Tools and Technology perspective.
Due to the width of LPD, the first question is divided into three categories. This aims to
provide a better understanding of the methodologies in the empirical framework and
discussion.
2. How can Lean Product Development be introduced at Semcon and during what
restrictions?
The second question aims to explore the restrictions for an introduction of LPD at Semcon,
focusing on what must be considered when combining Semcon’s project model (XLPM) and
LPD.
By answering these research questions, the ambition is partly to present how Semcon in a
resource efficient way can conduct parallel projects, yet also contribute to the understanding
of LPD possibilities in project centred companies.
1.3 Delimitations
The study will mainly focus at product development and project management in so-called in-
house projects at Semcon.
The investigations, analyses and introduction strategies associated with Semcon will mainly
involve the department Total Design Office (TDO), part of the business area Design and
Development (D&D).
The suggested action plan for initiating LPD transformation at Semcon will not involve an
actual implementation.
Benchmarking will mainly focus on engineering company’s product development and project
management, and will comprise a limited part of the thesis.
5
Part II
THEORETICAL FRAMEWORK
Theory regarding Lean Product Development as well as project management is presented in
this chapter.
Based on the LPD description by Morgan & Liker (2006), the theoretical framework
concerning LPD is presented in three perspectives: (1) Human, (2) Processes and (3) Tools &
Technology.
The theoretical framework concerning project management mainly focuses on Semcon’s
project model XLPM.

6
2 LEAN PRODUCT DEVELOPMENT
The market is forcing industrial companies to improve themselves constantly in order to stay
in business. Product development is rapidly becoming a more important competence than
manufacturing, creating new competitive opportunities. Companies have a greater variation in
PD than in manufacturing and PD is therefore of huge strategic significance. The greatest
competitive advantage for any technical and consumer driven company, is by far Lean
Product Development. (Morgan & Liker, 2006)
Much of the Lean philosophy was originally developed by Toyota, which after World War II
suffered from a great economical crisis. The company had problems to afford material for
production and was in a problematic situation. Toyota needed to sell its products before it
could buy the material and start with the production process. (Post, 2011) The lack of
Japanese natural resources and the magnitude of raw material import to Japan made Toyota
aware of the importance not to waste material in the production. In order to face the new
challenges, focus was directed towards the value adding activities taking part in the processes
and Toyota made significant efforts in making quality products with lower costs. Toyota
developed much of the new ways of working, which today is the basis of the Lean
philosophy. (Sugimori et al., 1977)
Lean aims to maximize customer value and minimize waste (Womack & Jones, 1996). Wang
et al. (2012) define Lean Product Development as an “application of Lean principles to the
product development process to eliminate waste”. LPD helps companies to develop a value
stream in the PD process, pulled by the customer, and with minimal waste. It is based on the
elimination of waste and introduction of performance improvements regarding products,
processes and organisations.
Clark et al. (1987) was first to form the concept of LPD, although their findings were not yet
termed this way. In their study Product Development in the World Auto Industry, they
investigated the PD in 22 projects among international automotive manufacturers in North
America, Europe and Japan. They found that Japanese companies performed significant better
than their western competitors regarding engineering hours and lead times. In western
automotive companies, the average lead time was approximately 62 months with 3.5 million
engineering hours developing new models. Japanese car manufacturers managed their PD
projects with an average of 42.6 months and 1.2 million engineering hours. Clark et al. (1987)
ascribed these differences to the strong involvement of the processes’ suppliers. Furthermore,
they argued that the role of heavy project management and overlapping PD had a significant
role in the Japanese efficiency.
Morgan & Liker (2006) state that conventional PD are not Lean, but full of waste (muda in
Japanese). Waste in PD processes are activities that consume resources without adding value
to the final customer. Waste in product development is often defined as the seven first
categories in Table 2-1.Waste in PD. Berglund & Westling (2009) argue that the same main
categories can be used to define waste in e.g. manufacturing, administration, information, sell
and management, but the categories are then composed differently.

7
Table 2-1.Waste in PD.
Source: Waste 1-7, Morgan & Liker (2006), p. 72; Waste 8-9, Berglund & Westling (2009), p. 57.
Toyota’s product development system is a sociotechnical system, consisting of three primary
subsystems: (1) Human (entitled people by Morgan & Liker, 2006), (2) Process and (3) Tools
& Technology, see Figure 2-1. LPD system. These three perspectives are related and
interdependent on each other to create a truly successful organisation. (Morgan & Liker,
2006) Following assumptions are divided in these three perspectives in the theoretical
chapter.
Figure 2-1. LPD system.
Source: Based on Morgan & Liker (2006), p. 16; Berglund & Westling (2009), p. 49.
Waste categories Waste in PD
Waiting Waiting for decisions, information distribution
Motion Long travel distances/redundant meetings
Conveyance Hand-offs/excessive information distribution
Overproducing Batching, unsynchronized concurrent task
Processing Reinvention, process variation, lack of standardisation
Correction Internal quality enforcement, correction and rework
Inventory Batching, system overutilisation, arrival variation
Unused creativeness Ideas are not utilised
Knowledge loss
Knowledge disappear between projects, not reused

8
2.1 Lean Product Development – Human perspective
The culture in an organisation defines the success in a company. Lean cannot be developed
without a strong culture that influences the decision making in the entire organisation. To
have a broadly spread and shared cultural DNA (fundamental company value) is essential for
the success of Lean thinking. (Liker & Meier, 2006) To properly apply the Lean thinking into
companies, the whole company needs to start thinking and making its decisions based on the
Lean philosophy, and not only by applying limited parts of the theory. To change the thinking
and philosophy in the whole company might take many years and this is why initiating Lean
is not a fast process. (Post, 2011).
The spine of the Lean philosophy, originally from the Toyota Production System (TPS), is the
four Ps model (often referenced to as five Ps model). The four Ps set the cornerstones in the
TPS and are seen as a cultural explanation to Toyota’s great success in automotive
manufacturing. (Liker & Meier, 2006)
In TPS, the philosophy is to add value to the customers, associates, society and
community. Decision making should be made for a long term vision, even though it
might cost on short time goals.
The process is of great importance in a Lean culture. Short and long time solutions
should contribute to eliminate waste and enable cost reduction as well as quality
improvements. By working with Lean methodologies such as continuous improvement
(kaizen) for improving processes, pull-systems for reducing costs, standardisations for
simplifying and visual planning for communication, the quality of the process can be
improved.
Creating challenges for people and partners makes them grow and adds value to the
organisation. Respect for people and partners are of great importance in the TPS and
Lean-philosophy.
Problem solving is the key to learn. In TPS, going and seeing (genchi genbutsu in
Japanese) the reality is a fundamental element. Investigating the problem down to its
roots and understanding the actual reason through direct observations, and then
sharing the lessons with the rest of the organisation, create a learning organisation and
continuous improvement.
(Liker & Meier, 2006)
In 2001, Toyota defined the most important slogans and phrases from the company’s culture,
called The Toyota Way 2001. They wanted to define the core value of the company’s culture
and what value phrases that should not be changed in the company. This consists of two key
principles; continuous improvement and respect for people. (Hino, 2006)
9
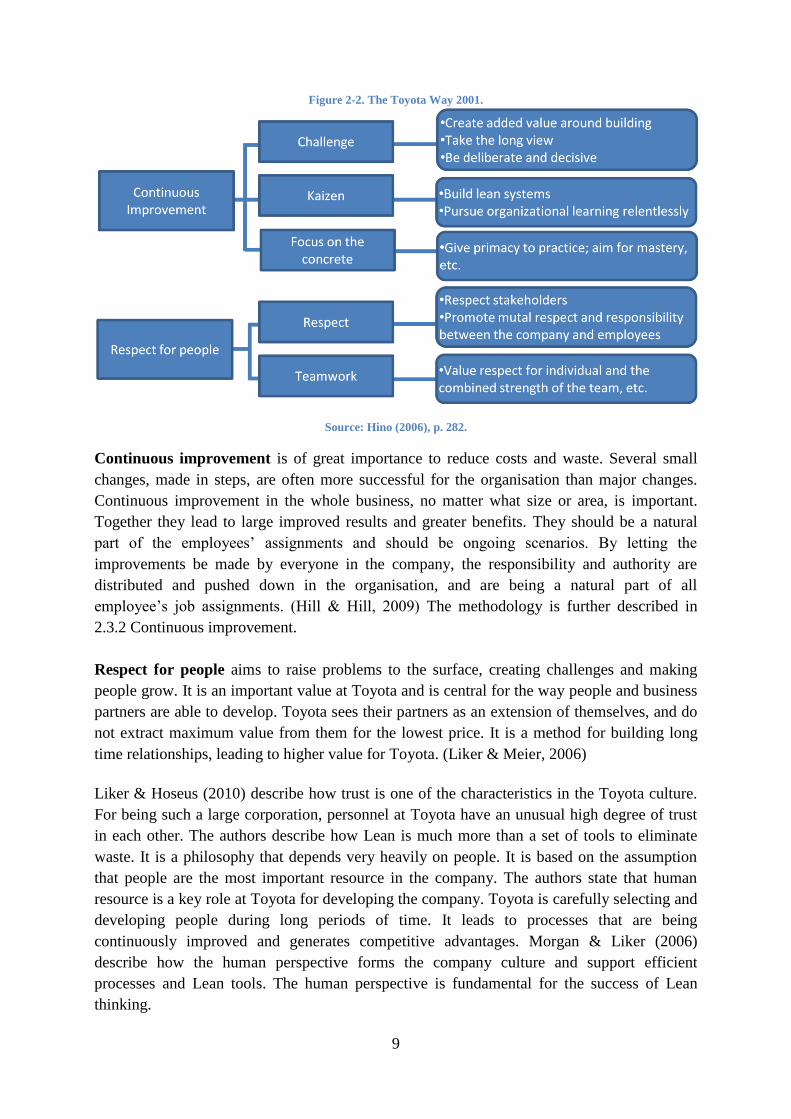
Figure 2-2. The Toyota Way 2001.
Source: Hino (2006), p. 282.
Continuous improvement is of great importance to reduce costs and waste. Several small
changes, made in steps, are often more successful for the organisation than major changes.
Continuous improvement in the whole business, no matter what size or area, is important.
Together they lead to large improved results and greater benefits. They should be a natural
part of the employees’ assignments and should be ongoing scenarios. By letting the
improvements be made by everyone in the company, the responsibility and authority are
distributed and pushed down in the organisation, and are being a natural part of all
employee’s job assignments. (Hill & Hill, 2009) The methodology is further described in
2.3.2 Continuous improvement.
Respect for people aims to raise problems to the surface, creating challenges and making
people grow. It is an important value at Toyota and is central for the way people and business
partners are able to develop. Toyota sees their partners as an extension of themselves, and do
not extract maximum value from them for the lowest price. It is a method for building long
time relationships, leading to higher value for Toyota. (Liker & Meier, 2006)
Liker & Hoseus (2010) describe how trust is one of the characteristics in the Toyota culture.
For being such a large corporation, personnel at Toyota have an unusual high degree of trust
in each other. The authors describe how Lean is much more than a set of tools to eliminate
waste. It is a philosophy that depends very heavily on people. It is based on the assumption
that people are the most important resource in the company. The authors state that human
resource is a key role at Toyota for developing the company. Toyota is carefully selecting and
developing people during long periods of time. It leads to processes that are being
continuously improved and generates competitive advantages. Morgan & Liker (2006)
describe how the human perspective forms the company culture and support efficient
processes and Lean tools. The human perspective is fundamental for the success of Lean
thinking.

10
2.2 Lean Product Development – Process perspective
A well functioning process is fundamental for an efficient PD (Berglund & Westling, 2009).
In the 4 Ps model, developed by Toyota, the process is of great importance leading to the right
results. Short and long time solutions should contribute to eliminate waste and enable cost
reduction as well as quality improvements. To make it possible, Toyota uses methods such as
pull systems, levelled out workload, a culture of stopping and fixing problems, continuous
improvement and highlighting of abnormalities. Creating a continuous flow is one of the most
importance factors in creating a Lean process. It is a link connecting processes and people
together, creating continuous improvement in the organisation. (Liker & Meier, 2006)
Morgan & Liker (2006) describes the phenomenon of flow in PD processes as traffic on a
highway, making it easy to compare. If little traffic utilises the highway and one line is closed
due to a traffic accident, no great delays or traffic jam occur. Driver’s only change lane and
continue with the same speed. If the same traffic accident occurs during rush hours, it causes
major queues and large delays. This happens since the queuing dramatically increases when
reaching approximately 80 percent utilisation of the system, as can be seen in Figure 2-3.
Queue phenomenon. Alder et al. (1996) present striking evidence for the queuing phenomena
in PD. Projects proceed smoothly during periods of moderate workload, but when high
utilisation occurs (70-80 percent), the lead time increases dramatically. This leads to quality
issues and project delays. Figure 2-3. Queue phenomenon.
Source: Morgan & Liker (2006), p. 80; Alder et al. (1996), p. 5.
To enable efficient utilisation of resources, standardised PD processes that are understandable
for everyone in the organisation are necessary. Stakeholders both upstream (manufacturing)
and downstream (market) need to be included in the PD process. An efficient collaboration
between the different stakeholders without complicated routines and communication is vital
for successful PD. (Berglund & Westling, 2009)
11
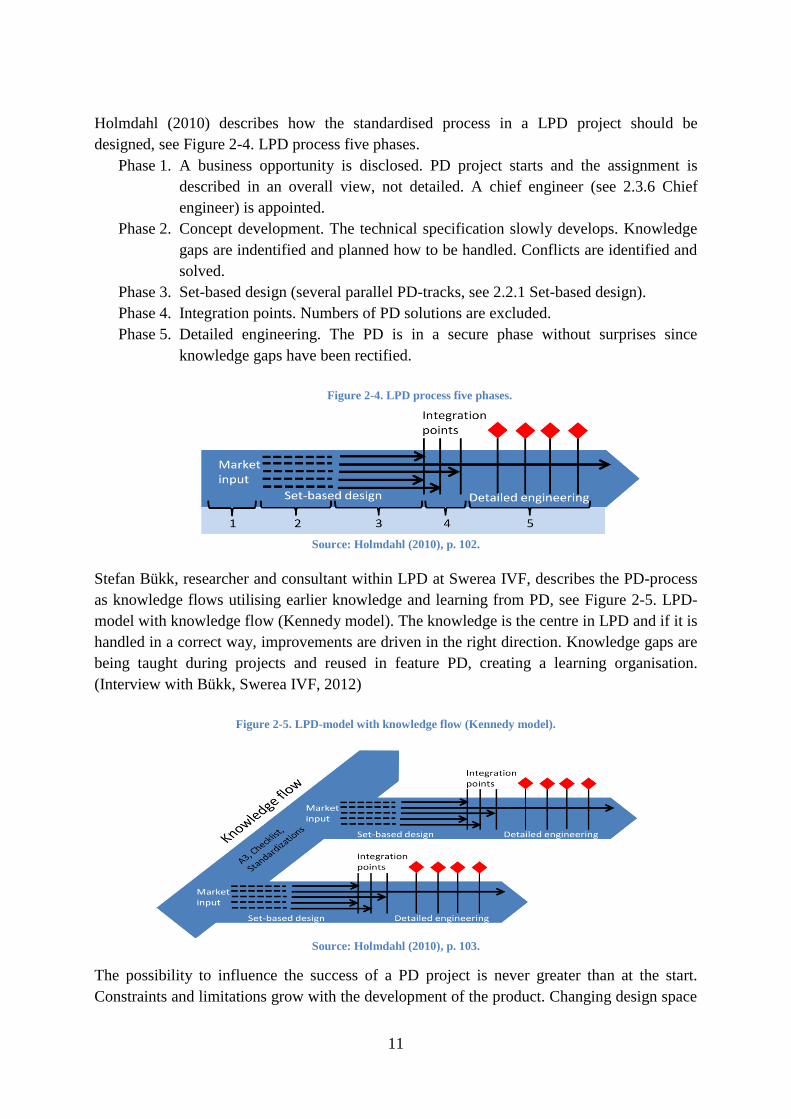
Holmdahl (2010) describes how the standardised process in a LPD project should be
designed, see Figure 2-4. LPD process five phases.
Phase 1. A business opportunity is disclosed. PD project starts and the assignment is
described in an overall view, not detailed. A chief engineer (see 2.3.6 Chief
engineer) is appointed.
Phase 2. Concept development. The technical specification slowly develops. Knowledge
gaps are indentified and planned how to be handled. Conflicts are identified and
solved.
Phase 3. Set-based design (several parallel PD-tracks, see 2.2.1 Set-based design).
Phase 4. Integration points. Numbers of PD solutions are excluded.
Phase 5. Detailed engineering. The PD is in a secure phase without surprises since
knowledge gaps have been rectified.
Figure 2-4. LPD process five phases.
Source: Holmdahl (2010), p. 102.
Stefan Bükk, researcher and consultant within LPD at Swerea IVF, describes the PD-process
as knowledge flows utilising earlier knowledge and learning from PD, see Figure 2-5. LPD-
model with knowledge flow (Kennedy model). The knowledge is the centre in LPD and if it is
handled in a correct way, improvements are driven in the right direction. Knowledge gaps are
being taught during projects and reused in feature PD, creating a learning organisation.
(Interview with Bükk, Swerea IVF, 2012)
Figure 2-5. LPD-model with knowledge flow (Kennedy model).
Source: Holmdahl (2010), p. 103.
The possibility to influence the success of a PD project is never greater than at the start.
Constraints and limitations grow with the development of the product. Changing design space

12
or investments becomes more expensive, time consuming and impact the quality negative, the
longer into the PD process as the changes are made. Studies show that poor decisions early in
the PD have an exponential impact as the project develops; costs and time might increase
drastically. (Morgan & Liker, 2006)
The resource utilisation in PD should be front-loaded (see Figure 2-6. Back-loaded VS Front-
loaded PD.) to minimize risks for long and expensive solutions. By using several resources
parallel in the beginning of new projects, risks of choosing wrong solutions are minimized
and chances of finding optimal solutions increase. In situations with short
development/delivery time, Set-based design with parallel concepts has great advantages,
since choosing the wrong alternative could lead to extensive consequences. (Berglund &
Westling, 2009)
Figure 2-6. Back-loaded VS Front-loaded PD.
Source: Berglund & Westling (2009), p. 54.
2.2.1 Set-based design
In the article The Second Toyota Paradox: How Delaying Decisions Can Make Better Cars
Faster Ward et al. (1995), the authors compare Toyota and U.S. automakers and argue that
Set-based design can be used to make the PD process more efficient. Holmdahl (2010)
describes how Set-based design is an important Lean tool, enabling more possibilities, and
prevents several issues that exist in traditional PD.
In traditional PD, the technical concept is chosen early in the PD process. Decisions are made
based on the limited knowledge and information available at the moment. Technical concept,
architecture and design, which are the most important decisions, are made in stages of the PD
when the knowledge and information is very low. The rest of the PD is then focused on
iterations and optimisation of the chosen preferences, see Figure 2-7. Traditional PD VS Set-
based PD. (Holmdahl, 2010)

13
Figure 2-7. Traditional PD VS Set-based PD.
Source: Berglund & Westling (2009), p. 54.
When the PD solution is selected early in the PD processes, large iterative cycles are often
necessary to be able to correct problems that occur. The solution involves errors that were not
visible or known when the solution was selected, and a lot of the PD has to be re-worked.
Since several different technology alternatives are not analysed systematically in traditional
PD, and the first possible solution often is chosen instead of the optimal solution, it is highly
likely that it will not be the optimal concept that reaches the market. In Set-based design the
organisation strives to make decisions as late as possible, but not too late. Knowledge about
the product, system and components is being learned during the PD project. By delaying
certain decisions as late as possible, more basis for the decisions exists. Delaying design
decisions can be extremely important if it leads to an improved foundation for making
decisions. (Holmdahl, 2010)
Set-based design consists of broadly developing sets of possible solutions, see Figure 2-7.
Traditional PD VS Set-based PD. The solutions are then gradually narrowed down and a final
solution is chosen. By investigating a wide net of solutions initially, and gradually narrowing
it down eliminating insufficient solutions, it becomes more likely to find the optimal solution.
Set-based design often requires more time early in the PD-process (front-loaded PD, see
Figure 2-6 Back-loaded VS Front-loaded PD.) to be able to define several different solutions,
but can then move more quickly, converging towards the optimal solution. (Sobek II et al.,
1999)
Ward et al. (1995) have identified three broad principles of Set-based design. Together these
principles create a framework in which the design teams can work parallel and yet unite
solutions into a system. Figure 2-8. Set-based design principles.
Source: Holmdahl (2010), p. 148-149.
14
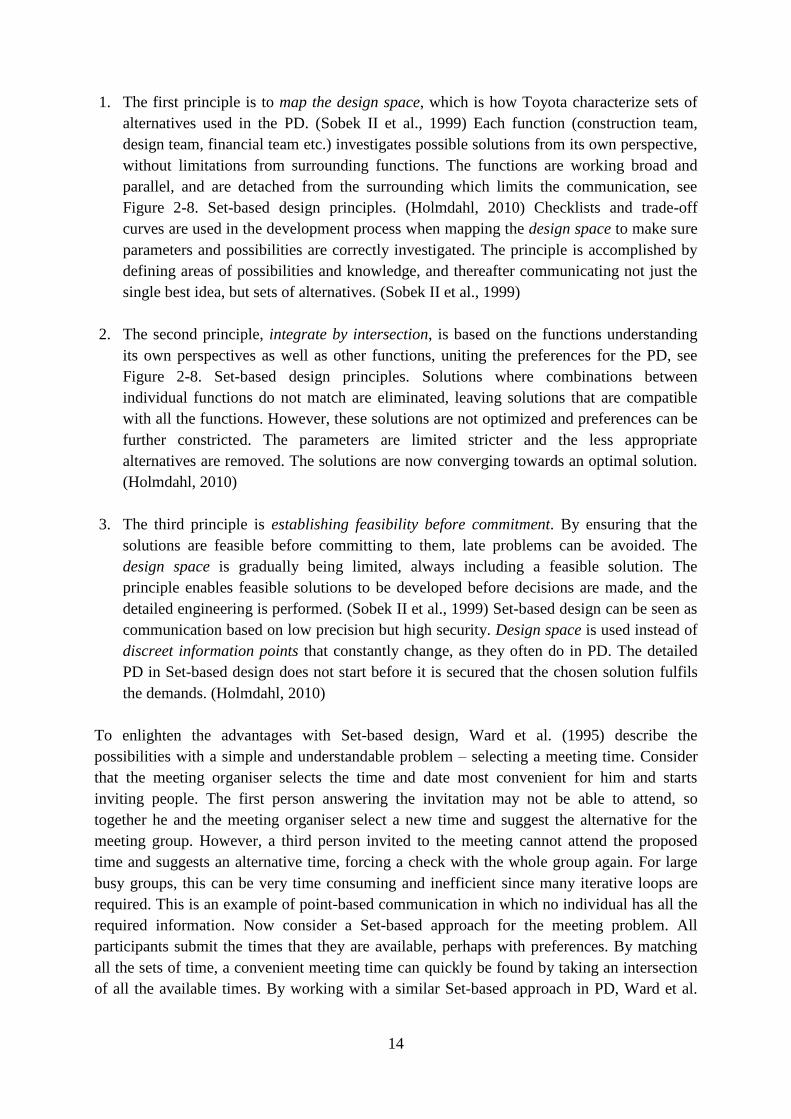
1. The first principle is to map the design space, which is how Toyota characterize sets of
alternatives used in the PD. (Sobek II et al., 1999) Each function (construction team,
design team, financial team etc.) investigates possible solutions from its own perspective,
without limitations from surrounding functions. The functions are working broad and
parallel, and are detached from the surrounding which limits the communication, see
Figure 2-8. Set-based design principles. (Holmdahl, 2010) Checklists and trade-off
curves are used in the development process when mapping the design space to make sure
parameters and possibilities are correctly investigated. The principle is accomplished by
defining areas of possibilities and knowledge, and thereafter communicating not just the
single best idea, but sets of alternatives. (Sobek II et al., 1999)
2. The second principle, integrate by intersection, is based on the functions understanding
its own perspectives as well as other functions, uniting the preferences for the PD, see
Figure 2-8. Set-based design principles. Solutions where combinations between
individual functions do not match are eliminated, leaving solutions that are compatible
with all the functions. However, these solutions are not optimized and preferences can be
further constricted. The parameters are limited stricter and the less appropriate
alternatives are removed. The solutions are now converging towards an optimal solution.
(Holmdahl, 2010)
3. The third principle is establishing feasibility before commitment. By ensuring that the
solutions are feasible before committing to them, late problems can be avoided. The
design space is gradually being limited, always including a feasible solution. The
principle enables feasible solutions to be developed before decisions are made, and the
detailed engineering is performed. (Sobek II et al., 1999) Set-based design can be seen as
communication based on low precision but high security. Design space is used instead of
discreet information points that constantly change, as they often do in PD. The detailed
PD in Set-based design does not start before it is secured that the chosen solution fulfils
the demands. (Holmdahl, 2010)
To enlighten the advantages with Set-based design, Ward et al. (1995) describe the
possibilities with a simple and understandable problem – selecting a meeting time. Consider
that the meeting organiser selects the time and date most convenient for him and starts
inviting people. The first person answering the invitation may not be able to attend, so
together he and the meeting organiser select a new time and suggest the alternative for the
meeting group. However, a third person invited to the meeting cannot attend the proposed
time and suggests an alternative time, forcing a check with the whole group again. For large
busy groups, this can be very time consuming and inefficient since many iterative loops are
required. This is an example of point-based communication in which no individual has all the
required information. Now consider a Set-based approach for the meeting problem. All
participants submit the times that they are available, perhaps with preferences. By matching
all the sets of time, a convenient meeting time can quickly be found by taking an intersection
of all the available times. By working with a similar Set-based approach in PD, Ward et al.

15
(1995) claim that sets of possible solutions are explored, rather than modifying a point-
solution.
According to Holmdahl (2010), all product development involves risks. Unless one is willing
to take risks, no great innovative products can be developed. Without innovative PD the
competitive advantages are limited to price and development/delivery time. By using Set-
based instead of point-based design, large risks can be managed in individual solutions and
ideas without risking the whole PD project, see
Figure 2-9. Innovation/Risk Set-based design. Secure alternatives as well as innovative
solutions can be developed parallel (Set-based concurrent engineering), securing a feasible
solution as well as innovative possibilities.
Figure 2-9. Innovation/Risk Set-based design.
Source: Holmdahl (2010), p. 141.

16
2.3 Lean Product Development – Tools & Technology perspective
Tools and methods are presented as support techniques for LPD. Semcon has expressed an
interest for investigating possibilities for creating a more visual organisation. Much focus is
therefore directed towards visualisation tools and its possible effects.
2.3.1 Visual organisation
Visual management
Hemmant (2007) describes a functioning visual management (VM) system as a traffic light.
When approaching an intersection, you know directly if and how you should proceed based
on the colour of the traffic light. It gives you the necessary information to make the best
possible choice with minimum effort. Visual communication enables you to make information
available to more people who need it, and doing so efficiently. According to Mann (2010),
visual management is a powerful contributor to a Lean organisation. It reflects the human
activity and processes, connecting them together. In doing so, VM transforms abstract
concepts of discipline into direct observable information. It is the basis for comparing actual
versus expected performance, making it possible to comprehend. VM highlights parts of the
process that are not performing as expected, and informs where improvements might be
necessary. The usage of visual communication tools has no limits in an organisation. Variety
and applications can be transformed where ever they are needed.
At a first glance, visual communication tools can be seen as a primitive mechanism trying to
express a complex business or technology. But visual communication provides much of the
basis for a Lean management system and contributes to the robustness in a Lean organisation.
In today’s technology focused organisations, communication using white-boards or posters
can be seen as an embarrassing return to the Stone Age. From an IT perspective, it does not
include as many applications or is visualised as neat. But by working with physical visual
communication tools, people are actually contributing to the communication system. People
are counting things, writing them down, and are expected to own their communication
system. Changes can be made easily and little complexity exists in the communication tools.
Personnel contribute to the system and distribute responsibility in the organisation, making
information available to more people. If information is accessible to only a few, only those
can take responsibility for it. (Mann, 2010)
Ljungberg (2000) characterizes the purpose of visual management in five steps:
1. By using visual means, information is more available, leading to an increased
purposefulness and responsibility among the employees. It stimulates achievements of
goals and targets.
2. Visual management increases the understanding of problems and results among more
people. More employees are active and involved in finding solutions and greater
possibilities to discuss solutions exist. The speed of finding solutions enhances.
3. A competitive environment between different groups is generated, leading to higher
performance.

17
4. Improved communication is generated between different working shifts.
5. If a group stops using the visual communication tool, it signals a lack of motivation,
showing the management that something is wrong.
Ljungberg (2000) states that visualisation creates an increased information flow requiring less
resource. Visualised information works as a communication tool both within and between
groups, in all levels of an organisation. It creates an information flow between the steering,
managing and operative functions (see 3.2.1 Project organisation), leading to more knowledge
and understanding. It is important that the steering and managing functions show great
interest in the visualisation tools, motivating and urging the operative function to
communicate more.
When new visualisation tools are to be implemented, obstacles can occur. It is necessary to
argue for the need and purpose of the tool. People often find it inconvenient to release the
information and knowledge they possess, as well as sharing their responsibilities and making
their actions more transparent. It is a natural reaction that causes a certain resistance since the
future state is unknown. (Ljungberg, 2000)
Visual planning
Holmdahl (2010) stretches the significances of why planning product development is
important. One of the most important reasons is that plans create expectations, leading to
actions. Plans also help steering and coordinating activities as well as detecting abnormalities.
According to Holmhdahl’s research, visual planning (VP) leads to more efficient utilisation of
resources, fewer delays, improved participation, improved understanding, levelled out
workload and increased flexibility (p. 128).
In visual planning, the focus is directed towards resources and not towards activities. The
resources are engaged with activities (often symbolised with post-it notes), in collaboration
with the project members. VP creates an intense information flow where dialogs occur,
knowledge is spread and viewpoints are noted. The great difference from traditional planning
(Gantt scheme, Pert etc.) is that VP focuses on resources and time. Group members decide
what and when activities should be processed, taking the responsibility for the execution.
(Holmdahl, 2010)
There is a problematic situation when too much information is added to the planning board,
making it too complicated. There is a great advantage in keeping the boards uncomplicated in
order to increase the level of understanding among the viewers and to simplify the usages.
The boards should include colour signals, but too much can create unclearness. Headlines
should be used to appeal reading. To use pictures and symbols that describe situations
increases the level of understanding. If possible, pictures and symbols should be used instead
of long lines of text. The employees are supposed to understand the board message by just
passing it. (Ljungberg, 2000) Information should be visualised as widely as possible using
everything from physical models to data summaries. Humans perceive pictures easier than

18
text, and visualisation techniques easy to understand are therefore of importance. (IVF
Industriforskning och utveckling AB, 2006)
Obeya
Horikiri et al. (2008) claim that business in Europe and in the United States can gain great
advantages by using similar Obeya rooms as the Japanese automakers utilise. It is a powerful
tool since most businesses lose huge amounts of time in their PD-projects. The reason is lack
of clarity and coordination. Morgan & Liker (2006) state that the Obeya room is an essential
part of Toyota’s great success in reducing lead time. It is a room filled with information that is
relevant for the project, see
Figure 2-10. Obeya room. Visual management on paper and boards are fundamental tools in
the Obeya room, but digital projectors and CAD computers to enable real-time viewing of
designs and test results are also suitable tools. Cross-functional meetings are held in the
Obeya room informing management and engineers, leading to quick decision making.
Experiences show that an Obeya room is an excellent tool to steer projects, since an overview
understanding is attained. The Obeya room makes it possible to coordinate activities and units
in an efficient way, leading to improvements for the individuals, groups and managers. Group
members can quickly grasp a situation that requires their comprehension, or intervene when
colleagues have problems. Several different functions (market, sales, purchasing, finance,
production, logistic etc.) should engage in the Obeya room to create cross-functional
communication. (Holmdahl, 2010) Figure 2-10. Obeya room.
Source: Based on Horikiri et al. (2008), p. 4.
Horikiri, Kieffer & Tanaka (2008) state that the Obeya room quickly highlights the real value
added work and increases the pull effect. In their article “Oobeya – Next Generation of Fast
in Product Development”, they compare the structure in an Obeya room with the Apollo 13

19
space program. There is a sense of urgency in the assignment, goals and targets are clear to
everyone. The leadership and decision making is obvious, but titles are not important. The
project members are working as a team. If somebody falls behind, everyone pitches in to help.
Minimum bureaucracy is utilised and creative use of expertise and working tools are
emphasised. There are large consequences for the “customer” if quality mistakes or delays
occur, leading to maximum performance among the team members.
Horikiri et al. (2008) describe the Obeya room layout with the following contents, see
Figure 2-10. Obeya room.
Prototype model. At the centre of the Obeya room is a prototype model, drawing or
other visual description of the output for the project. Having a visualised
representation of the output leads to discussion and quick identification and solving of
problems.
Project objectives. Team members are more motivated when there are clear and
realistic targets, creating a feeling of working for the customer and not for the
company’s manager. The project objectives should be linked to the corporate strategy
as well as to the product plan, creating an important communication with both the
voice of the organisation and the voice of the customer.
Metric board. The project’s status is visualised through the metric board. Normal
attributes presented are quality, cost and time. Colour codes are used to present the
status. Green visualises the status as ahead while red signals behind.
Action board. All the participating activities are shown on the action board. These
can be activities from project members and teams (marketing, design, engineering,
sales, supplier etc.). The board describe the necessary activities that are critical for
meeting the targets. The team members present the necessary actions to achieve the
goal, creating a transparent atmosphere where the plans are presented in a simple way.
It allows team members and leaders to understand the complexity of the project and
how well the activities will meet the target. If the action board is done correctly, there
will be a good dialogue between the leaders and the project members to ensure that the
board represent the best way to meet the target, based on a united performance.
Decomposition board. Sub-projects or areas that require specific attention are
visualised by the decomposition board. Different contents might be presented at the
board during different stages of the project.
Issue board. Critical problems are visualised at the issue board. Each new issue is
reviewed during the meetings, clarifying the problems and countermeasures. If a
problem cannot be solved on the organisational level, it is moved up or down to the
next level, creating a flow in the organisation.
Project members update the boards and charts in the Obeya room before each meeting.
During the meeting, a short presentation informing about the current situation is held by team
members from each area. New issues on the issue board are reviewed and dealt with. The
team will be more skilled and efficient after several meetings, thus shortening the meeting
time. The meeting value is increasing and real value is delivered to the organisation. Shorter
20
meetings that include more value are most often welcomed by everyone involved. (Horikiri et
al., 2008)
A meeting point helps to create a united atmosphere among the employees as well as
spreading a feeling of belonging. It creates a feeling of fellowship and increases the
satisfaction level. It is important that the meeting point is located in a geographical attractive
and reachable point, to clearly show the importance of the meeting. (Ljungberg, 2000)
2.3.2 Continuous improvement
Creating a built in learning system may be the most important LPD principle when
introducing Lean to PD. Learning from experience by repetition and learning cycles, supports
continuous improvement. The ability to learn is a competitive weapon for technical
competence, leading to continuous improvement and problem solving. By having deep
technical understanding, fewer guesses, reviews and audits are needed in PD, creating a more
efficient process. (Morgan & Liker, 2006) Liker & Meier (2006) describe Toyota’s
philosophy as a never ending problem solving. By working with short-term and long-term
countermeasures, Toyota is creating possibilities for the ultimate solutions to be implemented.
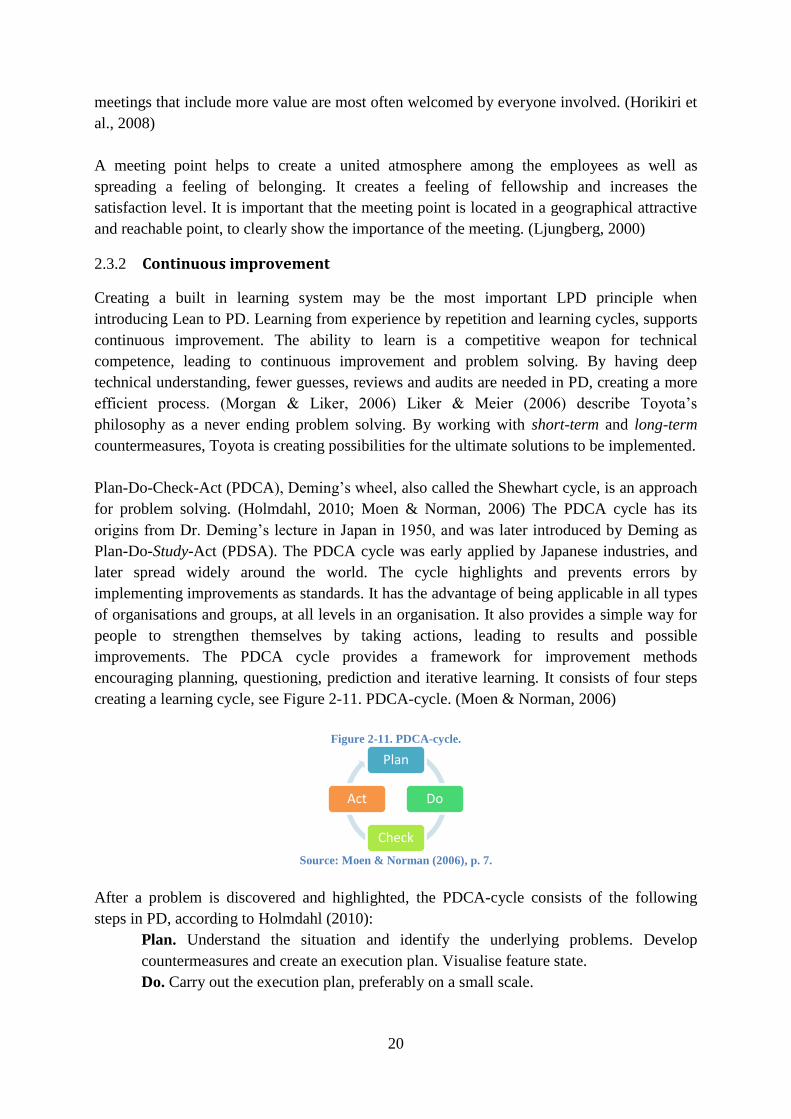
Plan-Do-Check-Act (PDCA), Deming’s wheel, also called the Shewhart cycle, is an approach
for problem solving. (Holmdahl, 2010; Moen & Norman, 2006) The PDCA cycle has its
origins from Dr. Deming’s lecture in Japan in 1950, and was later introduced by Deming as
Plan-Do-Study-Act (PDSA). The PDCA cycle was early applied by Japanese industries, and
later spread widely around the world. The cycle highlights and prevents errors by
implementing improvements as standards. It has the advantage of being applicable in all types
of organisations and groups, at all levels in an organisation. It also provides a simple way for
people to strengthen themselves by taking actions, leading to results and possible
improvements. The PDCA cycle provides a framework for improvement methods
encouraging planning, questioning, prediction and iterative learning. It consists of four steps
creating a learning cycle, see Figure 2-11. PDCA-cycle. (Moen & Norman, 2006)
Figure 2-11. PDCA-cycle.
Source: Moen & Norman (2006), p. 7.
After a problem is discovered and highlighted, the PDCA-cycle consists of the following
steps in PD, according to Holmdahl (2010):
Plan. Understand the situation and identify the underlying problems. Develop
countermeasures and create an execution plan. Visualise feature state.
Do. Carry out the execution plan, preferably on a small scale.
Plan
Do
Check
Act

21
Check. Investigate if the targets have been reached. If not, start over. (Deming
replaced the check stage with study instead, meaning the result should be studied and
learnt from. Moen & Norman, 2006)
Act. Establish the new process and solution as standards in the organisation.
2.3.3 Standardisations
Liker & Meier (2006) have in their studies of Toyota discovered that standardised work leads
to continuous improvement (kaizen). Standardising today’s best practices provides a
launching point for lasting innovations, and creates a learning organisation. By exploiting
great ideas and improvements, spreading them as standards in the company, more workforces
will learn from them and knowledge will not be lost due to working rotations.
Morgan & Liker (2006) claim that standardised work combined with a culture of discipline, is
the most powerful weapon for an efficient PD organisation with minimum waste.
Standardised work is one of the reasons behind Toyota Production Systems great success.
However, it is not easy to implement into PD. When trying to implement standardised work to
PD, engineers often react with arguments such as creative engineers need freedom in their
work to be innovative. It is understandable that engineers find it difficult to standardise
innovative work. On the other hand, Toyota’s PD-system shows that standardised work in fact
leads to flexibility, speed, precise execution, higher quality and waste elimination.
According to Holmdahl (2010) standardised PD work and shared methods for performing
assignments, lead to fewer abnormalities. It creates advantages such as: Easy detection of
abnormalities, improved forecasting, quality secured work, favoured communication and
facilitated training (p. 166-167). If everyone is working according to the same standards and
little deviations occur, the managing and control functions do not need to intervene as often,
creating an efficient organisation.
2.3.4 Value Stream Mapping
The basic concept of Value Stream Mapping (VSM) was introduced by Womack & Jones
(1996) in Lean Thinking. The method is based on a simple premise:
Just as activities that can't be measured can't be properly managed, the activities
necessary to create, order, and produce a specific product which can’t be precisely
identified, analyzed, and linked together cannot be challenged, improved (or eliminated
altogether), and, eventually perfected. (Womack & Jones, 1996, p. 37)
When improvements are to be made, isolated processes seem to be more natural to start with
than improving flow across the whole value stream. Improvements are normally carried out
isolated and small efforts are made to understand the “big picture”. VSM is a method that
enables highlighting and detecting waste, across the whole value stream. It helps linking
chains of processes and creates opportunities for improvements. It is a guide showing the road
of the process and showing what actions create value and what actions create waste. (Liker &
Meier, 2006)
22
VSM has been used extensively in manufacturing, and utilising the same methods in PD
cannot be made easily. In manufacturing, the physical product and material are measured with
an often linear flow. In PD, virtual data are measured with nonlinear and multidirectional
flows. PD involves iterative loops with data and information that are flowing back and
forward, creating a complex web of activities, making it more difficult to measure. (Morgan
& Liker, 2006)
Morgan & Liker (2006) claim that VSM is an extremely powerful tool in PD, perhaps even
more powerful than in manufacturing. Stefan Bükk (Interview Bükk, Swerea IVF, 2012)
claims that there are great difficulties applying VSM to product development, since too great
complexities exist.
2.3.5 A3 communication tool
The term A3 normally refers to an international-sized paper, but within Toyota and the Lean-
philosophy it refers to much more. Toyota’s vision is that every issue should be captured on a
single piece of paper, an A3 report. The A3 becomes a summary, following a standard format
and structure, which enables everyone in the organisation to capture the information (see
example in APPENDIX 2.1 A3 Obeya room). Using A3 reports is a simple communication
tool or problem-solving technique that leads to instant gains. Creating A3 reports is a first step
towards learning and capturing the essentials. It improves the problem-solving, the decision-
making and communication ability in the organisation. (Shook, 2008)
The A3 report normally includes elements such as: Title, owner and date, background,
current conditions, goals/targets, analysis, proposed countermeasures, plan and follow-up.
(Shook, 2008, p. 7) Depending on type the of A3 report (proposal of solution, action plan,
project plan etc.) the structure of the A3 might vary. Pictures and diagrams should be used in
the A3 to create an understandable and clear report that can be red and understood with a
quick glance. (Holmdahl, 2010)
2.3.6
2.3.6
2.3.6 Chief engineer
When Toyota is developing new products, a chief engineer is appointed. The chief engineer is
often the most competent engineer and should be seen as a role model in the company. Often,
the engineers are promoted from line manager to chief engineer when they have proven they
are highly competent engineers. A difference between many European project managers and
chief engineers at Toyota, is the area of responsibility. A chief engineer focuses more on the
technical perspective, while a project manager on top of this, also handles surrounding aspects
such as politics, manufacturing and customers. At Toyota, the team manager, product
manager etc., has greater responsibilities for this aspects and the chief engineer can fully
focus on developing new products. (Holmdahl, 2010)

23
3 PROJECT MANAGEMENT
3.1 Introduction
Project management is today a highly relevant topic with strong growth in several sectors.
Finding the optimal project path is a difficult task affecting the whole organisation, from top
management to the individual project member. Today’s competitive market forces businesses
to move fast and quickly launch new ideas. A project organisation is temporary and easier to
initiate than creating new divisions and departments. It is focused towards clear targets
creating more customer value with shorter throughput time, and therefore strengthens the
competitive advantages. (Tonnquist, 2010)
Maylor (1999) defines a project as a “non-repetitive activity”. A project is further defined by
characteristics such as: Goal oriented (particular goal or end defined), constraints (time,
resources etc.), measurable output (quality, quantity etc.), changes (something is being
changed throughout the project).
Projects are from an economical view perceived as important activities. Around 50 percent of
all work is being carried out through projects. Project management is no longer only about
managing a sequence of steps required to complete a project, but is systematically involving
the voice of the customer, prioritising efforts, working concurrently in multi-functional teams
etc. Today’s project management requires a closer link between upstream and downstream
activities involving product development, manufacturing, logistics, support etc. (Maylor,
1999)
Many project models exist today, but most of them have great similarities when it comes to
structure and context, see Figure 3-1. General project model. The model defines projects into
four different stages: (1) exploratory phase, (2) planning phase, (3) execution phase and (4)
closing phase, creating a homogeneity making it easier to communicate between different
companies, organisations and project models. Most models have clear hierarchic levels such
as steering, managing and operative functions performing different tasks and carrying
different responsibilities. (Tonnquist, 2010)
Figure 3-1. General project model.
Source: Tonnquist (2010), p. 16.

24
3.2 Excellence in Project Management (XLPM)
Excellence in Project Management (XLPM) is a project model for business controlled
management. It is a project standard that describes how to realise projects. XLPM is
developed and owned by Semcon Project Management AB and is based on PROPS™ that
was developed by Ericsson. PROPS has been used in various branches and sectors all over the
world since 1988 and has been further developed to fit standards and practices within project
management. XLPM is a generic project model, making it suitable for different kinds of
projects, not only product development. (Semcon Project Management AB, 2010a)
3.2.1 Project organisation
XLPM defines three different levels in a project (see Figure 3-2. XLPM - Project organisation
model.): (1) project steering function, (2) project managing function and (3) project operative
function. Each level’s responsibility, authorities and rolls are well defined for each project.
XLPM helps to steer projects in a standardised way but does not control the project’s
resources or complexity. (Semcon Project Management AB, 2010c)
Figure 3-2. XLPM - Project organisation model.
Source: Semcon Project Management AB (2010c), p. 5.
The project organisation is built of individuals, teams and units and is a temporary
organisation. It should be well customised to fit individual competence and authorities. Each
function in the project organisation has different responsibilities and tasks in the project
process:
1. The project steering function (red) is responsible for the activities in the steering
process. It has the authority to start and stop projects, and has the possibility to add
more resources to the project. The project steering function consists of managers with
the right authorities.
2. The project managing function (blue) is responsible for the activities in the leading
process and helps to direct the project towards its goal. The project managing function
is the centre in the project organisation and helps integrating different interests in the
project.

25
3. The project operative function (yellow) is responsible for activities in the project’s
working model. The function helps to realise and accomplish the requirements and
specifications made by the project managing function.
(Semcon Project Management AB, 2010c)
3.2.2 Project life cycle model
The life cycle model of XLPM involves those processes, activities, decisions and
documentations necessary to secure that the demands and business idea is well integrated into
the project. The project life cycle is divided into four phases: (1) analysing phase, (2)
planning phase, (3) execution phase and (4) closing phase. The project phases consist of three
parallel responsibility levels, each connected to three functions in the project organisation, see
life cycle model. (Semcon Project Management AB, 2010c)
Figure 3-3. XLPM life cycle model.
Source: Semcon Project Management AB (2010c), p. 35.
Tollgate decisions are large decisions that involve the whole project prospect. It is a well
defined decision point where decisions about the project’s goals and resources are
determined. In each tollgate, the project’s expected values and risks are determined and
evaluated. Before tollgate decisions are made, the project should be considered from several
different aspects: the business aspect, project portfolio status, project status and the
stakeholder’s engagement and confidence. Depending on projects, different tollgates might be
used. In XLPM, it is recommended that at least the following six tollgates are used for all
projects:
TG 0. Decision to start project analysis.
TG 1. Decision to start project planning.
TG 2. Decision to establish project and start project execution.
TG 3. Decision to continue project execution from the original or modified plan.
TG 4. Decision to submit the project results to the final receiver.
TG 5. The project’s final result is accepted, decision to start project closure.
(Semcon Project Management AB, 2010c)

26
Information quality is getting more detailed and reliable during the progression of the project.
This leads to less uncertainty in the decision making. For each tollgate the uncertainty in the
project decreases, see Figure 3-4. Project process reliability. (Semcon Project Management
AB, 2010c) Figure 3-4. Project process reliability.
Source: Semcon Project Management AB (2010c), p. 41.
3.2.3 Perspectives
XLPM includes two perspectives: (1) business perspective and (2) human perspective. By
describing projects and their organisation from these two perspectives, a complementary
statement is formed leading to a multi diverse view of the project work. (Semcon Project
Management AB, 2010b)
Business perspective
The business perspective in XLPM describes how the resources of the organisation should be
coordinated so that they contribute towards the vision and targets of the company. An
important perspective is to clarify the management’s responsibility to create the right
conditions for the organisation’s development and progression. It is also of great importance
to clarify the needs and requirements for each project, so that value can be created for the
organisation and customer. By focusing on the customer’s needs (both implicit and explicit)
and at the same time satisfy the needs in the own organisation, an effective utilisation of
resources and economical means are achieved. To handle efficient utilisation of the resources
in the organisation, clear strategic plans are needed. An organisation’s capability is limited by
economical circumstances and the competence of the personnel. Furthermore, the profitability
needs to be clearly defined and should be followed-up with a profitability analysis after the
work is completed. (Semcon Project Management AB, 2010b)
Human perspective
The human perspective in XLPM focuses on highlighting each individual’s meaning and
importance for the organisation’s success. A precondition for an effective usage of individual
competence is to develop a project culture with a united and coaching approach among
leaders, teams and individuals, on all levels in the organisation. The purpose is to make sure
that individual knowledge, talent and experience is viewed as the organisation’s most
valuable assets. (Semcon Project Management AB, 2010d)
27
The culture in XLPM is based on the company’s common terminologies, roles and processes.
It is based on a united approach that characterises the collaboration between individuals,
teams and leaders in all levels in the organisation. In XLPM, the project culture is based on
five keywords that should be encouraged and attained by the organisation:
Consensus
Trust
Involvement
Respect
Participation
(Semcon Project Management AB, 2010d)
Leaders, teams, individuals and project culture are important elements in the human
perspective of XLPM. The leader’s roll is of great significance to establish a harmonic
organisation. Leaders in all levels of the organisation are role models and their actions and
attitudes have a strong effect on the project culture. In a well functioning team, more
contribution can be obtained by each team member. A culture that supports continuous
learning and continuous improvement is vital to support the individuals. The future of an
organisation depends on the ability to hire and recruit creative and competent personnel, and
support to the individual therefore becomes essential. Leaders, teams and individuals
characterise and generate the project culture in the organisation. (Semcon Project
Management AB, 2010a)
28
Part III
METHODOLOGY
This chapter presents the research procedure, research orientation, approach of the study,
motivations to the chosen methodology, the study’s execution and method critics.

29
4 INTRODUCTION
This Master’s thesis has been conducted in collaboration with Semcon, within the business
area Design & Development, involving the divisions PEAQ and TDO in Gothenburg.
Together with Linköping University, department of Management and Engineering, division
Quality Technology and Management, the study was completed between January and June
2012.
To achieve a deep insight and understanding of the problem, as well as creating a personal
view of the existing situation, most of the work was conducted at Semcon’s premises in
Gothenburg. It facilitated questioning of the current situation and future actions. Field visits
where conducted to benchmarking companies’ premises to achieve a personal view of their
conditions.
4.1 Research design
The work was divided into three phases: (1) Exploratory study within Semcon, (2)
Benchmarking and analyses of LPD possibilities at Semcon and (3) Action plan for initiating
LPD transformation at Semcon. Depending on phase, different methods for collecting data
was used, see Table 4-1. An overview of the study design.
Table 4-1. An overview of the study design.
Phase 1 Exploratory study within Semcon
Phase 2 Benchmarking and analyses of LPD possibilities at Semcon
Phase 3 Action plan for initiating LPD transformation at Semcon
Time period w 1-5 w 6-15 w 15-21
Data types Interviews Documents
Interviews Observations Workshops
Interviews Workshops
Sampling
-Managers Semcon organisation -Managers TDO -LPD researcher
-Managers TDO -Managers benchmarking companies
-Managers TDO
4.2 Research orientation
When choosing what form of study to conduct, the existing knowledge is of importance. If
little knowledge exists within the area, an exploratory approach is made where the purpose is
to reach a basic understanding within the research field. If fundamental understandings exist
within the research area, descriptive studies with the purpose of describing but not explaining
are performed. Explanatory studies are used for the purpose to both describe and explain, and
when deeper understanding is sought. Normative studies are performed when knowledge and
understanding within the research area already exist and when the aim is to provide guidance
and suggest measures. (Björklund & Paulsson, 2003) It can be argued that different research
approaches where used in the three different phases of this study. The first part of the thesis
can be seen as an exploratory study, where the purpose was to describe the current situation at
30
Semcon when it comes to handling resources and following their management system. The
second part can be seen as a descriptive study where the purpose was to describe
benchmarking companies’ PD processes as well as different LPD possibilities at Semcon. The
third part of the thesis is a normative study with the purpose to suggest an action plan and
guidance for future actions.
4.3 Approach of the study
During most studies, the level of abstraction varies between different levels of general
(theoretical) and concrete (empiric) approaches. Abduction is an approach when the study
varies between the different levels of abstraction. It is a combination between deduction and
induction. Deduction is based on existing theories and empirical assumptions, and is predicted
from those theories, and verified through acquired information. Conclusions can then be made
about occurrence, based on the theoretical frameworks. In inductive approaches, the theory is
formulated from the empirical information that has been acquired. (Björklund & Paulsson,
2003)
The approach of this study can be seen as abductive, since both deductive and inductive
approaches have been made. The approach was initial inductive when the current status was
examined and summarized in models and theory. It was thereafter transformed to a deductive
approach when existing theories have been used to describe the company’s situation and
prospect, based on LPD.
4.4 Qualitative study
Qualitative methods are used when a deeper understanding is requested within a research area
or a specific problem situation. Depending on the purpose of the study, qualitative or
quantitative approaches can be used. In qualitative studies, data collecting types such as
interviews and observations are suitable tools. (Björklund & Paulsson, 2003) The approach of
this study can be seen as qualitative, since a deeper understanding of the conditions where
requested. Results were difficult to obtain in a numerical appearance and a more broad
approach was desired during the whole study. Interviews and observations where the easiest
way to extract information. Ryen (2004) describes the advantages with qualitative studies as
the deeper social phenomena that can be interpreted compared with quantitative studies. It
was necessary to achieve an understanding of social phenomena at both Semcon and
benchmarking companies during all three phases of the study.
Merriam (2009, p. 16.) describes ideals for qualitative research as studies “…emergent and
flexible, responsive to changing conditions of the study in progress”. Furthermore, Merriam
(2009) describes how questions in interviews, that often are primary data sources, should be
well chosen with an open ending that can be followed up with more investigations and
requests for more details. This approach has been used for all interviews conducted in the
study. Interviews have mostly been semi-structured, functioning more as a guide than a
precise course of action. The interviews have then been responsive to changing conditions and
topics with the respondent, providing more opportunity.

31
Merriam (2009) claims that analysis in qualitative studies should move from specific raw data
to more abstract concept levels, in order to better support its purpose. Since the researcher is
the primary instrument for qualitative studies, the process is inductive and this characterises
the results. The focus is on the process, understanding and interpretation, which makes the
qualitative study more inductive than deductive, since the objective is to discover rather than
prove. The study’s two first phases focused on interpretation and understanding, making it
more inductive than deductive. The last phase in the study was however having a more
deductive approach, where focus no longer where aiming towards understanding and
interpretation, but rather demonstrating.
4.5 Methods
Interviews, workshops, observations, internal documents and literature studies were used to
gather and evaluate information. The main focus was directed towards interviews and
literature studies as suppliers of information, since these methods provided much of the
sought information.
4.5.1 Interviews
As discussed earlier, interviews were seen as a suitable qualitative method for receiving
information. Interviews were conducted with personnel at Semcon, Quality managers at
benchmarking companies, and with a LPD researcher.
Interviews Semcon
In order to receive information about the existing situation as well as possibilities for
improvements, personnel at Semcon was interviewed. The interviews were conducted with
personnel at Semcon’s headquarter in Gothenburg and took place at the divisions Total
Design Office, Project Engineering and Quality, as well as among quality Managers at
Semcon. Professionals within the fields of engineering and management where interviewed,
see Table 4-2. Interviews at Semcon. The interviews were semi-structured, allowing new
questions to be brought up as a result of what the interviewee said. Specific questions were
asked concerning each specific position and a standardised interview guide was not followed.
Several of the respondents were interviewed more than one time.
Table 4-3. Interviews at Semcon.
Name Position Section Location
Henrik Augustsson R&D Manager TDO Gothenburg
Inger Bergman Senior Project Manager Consultant
PEAQ Gothenburg
Lena Emriksson Q&E Manager Semcon Gothenburg
Joakim Lindgren Q&E / PMO D&D Gothenburg
Henrik Lysell Project Manager TDO Gothenburg
Ismael Ruiz Project Manager PEAQ Gothenburg
Roger Kraft Team Manager TDO Gothenburg

32
Interviews benchmarking
Benchmarking took place at Autoliv in Vårgårda, Saab Electronic Defence System (Saab
EDS) in Gothenburg and Scania in Södertälje. The companies where chosen for
benchmarking mainly due to successful initiation of LPD in their organisations. Interviews
were primarily performed at the companies R&D departments, but certain learning was taken
from the company’s manufacture and administration sections as well. The same interview
guide existed for all three benchmarking companies (see Appendix 3.1 Interview guide
benchmarking companies), but the interviews were flexible and semi-structured, allowing
follow up questions.
Table 4-4. Interviews at benchmarking companies.
Company Contact Position Location
Autoliv Andreas Laas APS Engineer
Vårgårda Anders Svantesson Quality Development
Saab EDS Roine Lundström Quality Management & Operational Excellence
Gothenburg
Scania Peter Palmér Senior Manager Process Support
Södertälje
Interview researcher LPD
An interview was conducted with Stefan Bükk, researcher within LPD at Swerea IVF2. The
interview focused on providing a different view of LPD and its possibilities, compared with
the benchmarking companies. In collaboration with Lars Holmdahl and Swerea IVF, Bükk
provided a three days long course entitle Lean Product Development in Mölndal. Information
and literature provided at the course has been utilised in this thesis.
4.5.2 Workshops
Workshops were conducted at the department TDO at Semcon. The workshops were divided
into two parts with different purposes. The first workshop focused on analysing the current
PD situation at Semcon, leading to basic understanding of the situation and contributing to the
progress of the study. During the first workshop, a flow analyses was conducted and
discussed regarding one of TDO’s PD projects, see Appendix 1.1 Air-cleaner project. The
second workshop focused on analysing visual management tools and creating discussions for
future ideas that could lead to possible improvements for Semcon. The second workshop
contributed largely to the execution plan developed in this thesis.
2 Swerea IVF is a research and consultancies group offering services to the manufacturing and developing
industries. It is a part of the Swerea Group conveying knowledge within material, process, product and
production techniques. (www.swerea.se/ivf/, 2012)
33
4.5.3 Observations
As discussed earlier, the advantage with qualitative studies is the deeper social phenomena
that can be interpreted compared with quantitative studies. Observations were conducted at
Semcon’s site in Gothenburg during the research to result in a more profound understanding
of the organisation. The observations focused on meetings and presentations regarding PD
processes at TDO. Observations following a PD project were performed during 19 weeks (see
Appendix 1.1 Air-cleaner project). The project was considered to provide a clear picture of
the PD process at Semcon as well as reflecting a “typical” PD assignment at TDO.
4.6 Method reflection
As discussed earlier, a qualitative study is largely characterised by the researcher since focus
is directed towards understanding and interpretation. The researcher’s methods and approach
have an effect on the results. Gillham (2000) describes scientific evidence:
...‘scientific’ evidence is, in a sense, manufactured. It is an outcome of the investigative
methods used: it didn’t exist before. Judical evidence is there in the case being
investigated and has to be uncovered and tested, usually by reasonable argument.
Evidence that is a result of the techniques of investigation (for example, asking the wrong
kind of questions, or aggressive interviewing) would be disallowed. (Gillham, 2000, p. 3)
In this study, interviews have been a primary method for collecting data. Because of earlier
perceptions (conscious and unconscious) among the interview conductor, the interviewees
might have been affected and answer thereafter. Asking more open questions could have been
an approach for minimizing the effect of the researcher’s opinion in the matter. On the other
hand, this would have made the answers more diverse, making them difficult to compare.
All interviews with Semcon’s personnel were conducted with managers or senior consultants.
On an operational level, project managers were interviewed but not members of the project
groups. Managers often have a different approach compared to their team (Liker & Meier,
2006), which could reflect the results in the study. To achieve a deeper understanding of the
fundamental forces in the organisation, interviewing a broader span of consultants from more
hierarchical levels, could have been a sufficient method.
When investigating benchmarking companies, opinions from a limited group were utilised. At
Scania, only one person was interviewed, limiting the deviation among opinions. At Saab
EDS and Autoliv, more personnel were met with and discussed, raising the credibility. In
similarity with Semcon, mostly managers at the benchmarking companies were interviewed
which might have narrowed down the opinions about LPD. Furthermore, all the three
benchmarking companies might have seen the meetings as a part of a promotion of their
companies, and therefore not “showing the whole picture”. Or, they might have seen Semcon
as a competitor, not sharing information because of that.
By interviewing a researcher within LPD representing Swerea IVF (research and
consultancies group), as well as participating in Swerea IVF’s course in Lean Product
34
Development, a different understanding of the area was obtained. The acquired information
had a larger focus on a “quick fix”, focusing more on tools and actions than the philosophy
behind Lean. By interviewing both benchmarking companies and Swerea IVF, a broader
understanding of different LPD approaches and possibilities was obtained. To achieve an
even broader understanding of LPD, different types of companies (such as consultants and
software companies) could have been investigated. Due to time restrictions in this study, this
was unfortunately not possible.
Literature from several different sources was reviewed during the study. Since LPD largely
depends on the human and cultural aspects, it was important to consider cultural influences
among the authors. Several of the most famous authors within LPD are from the United
States. It was therefore significant to also include Swedish and Japanese authors, since
cultural perceptions might be diverse. The research is thought to be able to improve further if
literature from surrounding fields such as Scrum and Agile was reviewed in a larger extend.
Literature available regarding LPD is so far relative limited.
When observing the PD processes at TDO, a single project was chosen to investigate deeper.
It was chosen since it symbolised a typical assignment for the department’s in-house group
(according to the department’s managers). The PD project was followed during the whole
research phase, providing an understanding of the projects execution, problems, possibilities
etc. However, since only one PD project was followed and investigated, much of the
conclusions concerning Semcon’s PD process are based on this single project. To enable more
substantial arguments regarding TDO’s PD processes, more PD projects should be examined.
4.7 Validity and reliability
In order to avoid validity problems, different methods were used to gather empirical
information. By using several methods for gathering data in the study, and comparing the
information, the validity is believed to increase. Björklund & Paulsson (2003) claim that the
validity can increase by using different perspectives, such as triangulation (two or more
methods are used to achieve the same purpose). During interviews, the validity can increase
further by clear, not directional questions. This knowledge was utilised in the study and a mix
between interviews, observations and workshops was performed to achieve trustful qualitative
data.
To increase the reliability in a study, Björklund & Paulsson (2003) argue that repetition and
control questions help investigate aspects again. Also triangulation helps increasing the
reliability. During the study, several persons were interviewed more than once. During
different meetings, some questions were repeated to increase the reliability. In situations
where it was possible, control questions were asked to clearly define the interviewee’s
standpoint.

35
Part IV
EMPIRICAL FINDINGS
Empirical findings from interviews, observations and workshops conducted at Semcon are
presented in the first chapter. Empirical findings from benchmarking companies are
presented in the second chapter.

36
5 EXPLORATORY STUDY SEMCON
An exploratory study was conducted at Semcon in Gothenburg during the first phase of this
thesis. The aim of the exploratory study was to investigate the project organisation, utilisation
of resources and usage of Semcon’s management system (primary the project methodology
XLPM, as a support function to the management system). The exploratory study was mainly
conducted at the division TDO, focusing on in-house projects. Additional interviews were
performed with surrounding divisions (PEAQ and Q&E Management) to acquire a more
credible view. The aim was to investigate how Semcon currently is handling its resources and
following its management system. The majority of the empirical findings concerns TDO in
Gothenburg.
5.1 Total Design Office
Total Design Office with its 60 employees is a division within the business area Design &
Development. TDO consists of four subgroups that mainly perform engineering services as
in-house projects. Projects include assignments from industrial design to product development
and construction. Earlier projects have involved products from kitchen equipment to advanced
technical machinery. (Interview with Manager A, Semcon, 2012a)
Figure 5-1. Earlier projects conducted at TDO.
Source: Interview with Manager A (Semcon 2012a); Semcon@TDO presentation för kunder (2012).
TDO’s core competence exists within the fields of industrial design, mechanical construction,
project management and product development. By close collaboration with other divisions,
competences and resources within several fields can be added to the project. (Semcon@TDO
presentation för kunder, 2012)

37
Figure 5-2. Developing process at TDO.
Source: Based on Semcon@TDO presentation för kunder (2012), s. 5-6.
“TDO’s vision is to add much value to the product development process in the research and
concept phases, since these phases mainly contribute to the project’s value.” R&D Manager,
Manager A, Semcon, 2012a.
By focusing on customer demand and technical possibilities in the research phase, as well as
idea generation and technical concepts in the concept phase, the customer and technical focus
can be integrated to raise the value of the final product (see Figure 5-2. Developing process at
TDO.). (Semcon@TDO presentation för kunder, 2012)
5.2 Project methodology
“It is important to have a central decision of how to handle projects in order to standardise
the working methods.” Senior Project Manager Consultant, Consultant A, Semcon, 2012.
Semcon’s management has decided that all internal projects should follow the project
methodology XLPM. The project model is not focusing on utilisation of the resources, but
should rather be seen as a tool of how to manage projects. XLPM as a project model has
influenced Semcon’s project organisation. However, it is the way of thinking and acting
around projects that has changed the working structure in the organisation over time.
(Interview with Consultant A, Semcon, 2012)
XLPM steers projects in a standardised way and it has the strength to define on which quality
level the project should focus. It is developed to manage large projects and a lot of the
material and process support is therefore often seen as redundant in smaller projects. It leads
to a higher complexity in certain projects, and managers often feel that XLPM gets to
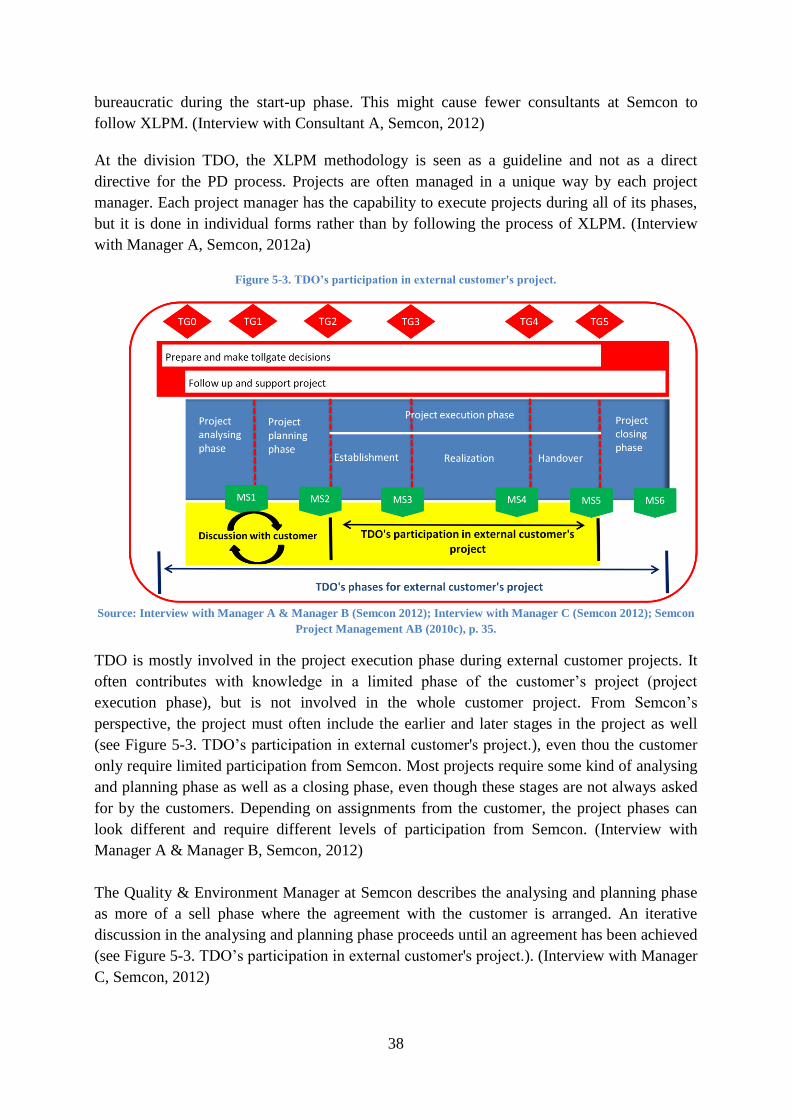
38
bureaucratic during the start-up phase. This might cause fewer consultants at Semcon to
follow XLPM. (Interview with Consultant A, Semcon, 2012)
At the division TDO, the XLPM methodology is seen as a guideline and not as a direct
directive for the PD process. Projects are often managed in a unique way by each project
manager. Each project manager has the capability to execute projects during all of its phases,
but it is done in individual forms rather than by following the process of XLPM. (Interview
with Manager A, Semcon, 2012a)
Figure 5-3. TDO’s participation in external customer's project.
Source: Interview with Manager A & Manager B (Semcon 2012); Interview with Manager C (Semcon 2012); Semcon
Project Management AB (2010c), p. 35.
TDO is mostly involved in the project execution phase during external customer projects. It
often contributes with knowledge in a limited phase of the customer’s project (project
execution phase), but is not involved in the whole customer project. From Semcon’s
perspective, the project must often include the earlier and later stages in the project as well
(see Figure 5-3. TDO’s participation in external customer's project.), even thou the customer
only require limited participation from Semcon. Most projects require some kind of analysing
and planning phase as well as a closing phase, even though these stages are not always asked
for by the customers. Depending on assignments from the customer, the project phases can
look different and require different levels of participation from Semcon. (Interview with
Manager A & Manager B, Semcon, 2012)
The Quality & Environment Manager at Semcon describes the analysing and planning phase
as more of a sell phase where the agreement with the customer is arranged. An iterative
discussion in the analysing and planning phase proceeds until an agreement has been achieved
(see Figure 5-3. TDO’s participation in external customer's project.). (Interview with Manager
C, Semcon, 2012)

39
There are usually two different situations during projects: (1) when the customer has its own
project process with tollgates and requests Semcon to follow it and (2) when the customer
does not have an established project process and requests Semcon to lead it. In the first case,
consultants from Semcon are advised to follow the customer’s project process but should
follow its own project methodology as well, for an internal control. If the customer does not
have an established project process, Semcon follows its own project methodology both
internal and external towards customers. (Interview with Manager C, Semcon, 2012)
During the time of writing, Semcon is currently working with the development of new
standardisations for six different branches. The new standardisations takes count of what kind
of project that is being executed, something that XLPM has not considered previously. XLPM
is a generic project methodology and do not manage what kind of orientation the project has
(medical technology, offshore etc.). The new standardisations, entitled Delivery in this report,
are mostly focusing on the Delivery process in Semcon’s management system Compass. The
idea is to develop those areas that are not specified in XLPM. Delivery is a tool that supports
the process and helps consultants perform their work better, by offering checklists and
standardisations relevant to specific branches. (Interview with Consultant B, Semcon, 2012)
5.3 Product development
A PD project conducted by TDO requires from a few weeks up to two years of processing,
depending on size and available resources. A standard project most often takes between four
to six months to execute and several projects are often conducted simultaneously within the
department, but with different project leaders. Much of the PD process is unique depending
on the product, business agreement and competence within Semcon. This leads to a high
variety between PD projects which complicate the ability to standardise the PD execution.
Due to various aspects, PD projects sometimes changes from the original plan. (Interview
with Manager A, Semcon, 2012a)
Depending on the project, the technical solutions are freezed at different stages. Conservative
technologies (e.g. carpenter tools) are often fixed early in the project while innovative
products (e.g. new design products) are fixed in a later stage of the developing process. Most
often, technologies and methods are decided early in the projects by TDO. Semcon often
requires a well prepared technical specification from the customer to better meet the customer
demand. Depending on the project, a quotation for each stage of the project (exploratory
study, concept development, construction etc.) might be completed. By doing so, the
customer has a better control of the project. (Interview with Manager A & Manager B,
Semcon, 2012)
Documentation of projects is rarely done thoroughly at TDO. A story of the project are
sometimes published on the intranet to spread what kind of earlier assignments and
competence exists in the department, but most often no documentation is completed. TDO’s
Managers state that it is the project leader’s responsibility to document each PD project.
Consultants at TDO often use journals to document technical details and meetings. In
discussions with customers, the journals can help during uncertainties concerning what has
40
been decided or when complaints arise. No process to investigate quality defects exists today.
Countermeasures during quality defects are often solved by a brainstorming meeting
involving experienced engineers. (Interview with Manager A & Manager B, Semcon, 2012)
5.4 Communication and project organisation
Semcon aims towards undertaking more in-house projects, and strive to become a project
delivery. To do so, it is necessary to strengthen the internal processes. Divisions need to
standardise their processes towards a shared working process to favour communication within
the company. The higher in the divisions, the more standardised routines and structures are
needed. On a local and individual level, more varying processes are accepted. Standards for
processes exist today and the main work is directed towards implementing the methods in the
divisions. (Interview with Manager C, Semcon, 2012)
Improvements and new methods developed by individuals at TDO are not often spread in the
department. Consultants often develop their own systems for e.g. protocols and routine tasks,
but do not to spread their solutions to co-workers. This creates waste in the organisation, since
the same work is performed several times and knowledge is lost. (Meeting with Manager A et
al., Semcon, 2012)
The team managers at TDO work as a support function to the project group, but do not lead
the operative work. They focus on sales and quality and have partly divided the
responsibilities areas between them. The team managers set the framework for new projects.
They often establish a rough timetable and thereafter deliver the material to the project
manager. The team managers aim is to involve the project manager as early as possible in
new projects, to get his or her input and opinion for the further project planning. Projects with
fixed prices need to have a dedicated project manager during the whole project, while
engineers and designers often lead projects with ongoing pricing by them self. (Interview with
Manager A & Manger B, Semcon, 2012)
Manager A and Manager B state that a standardised project organisation is difficult to achieve
at TDO, due to the high variety among projects and project configurations. Roles,
responsibilities and authorities are not always clarified in projects. The project configurations
vary and it would be difficult to easily standardise roles and responsibility among the project
members. In larger projects that extend over a long period of time, a project configuration
involving a communication plan is occasionally realised. Project members’ authorities is
thought to be able to standardise in a higher level than today. The level of authority among
personnel normally stays the same for different projects and configurations, and might not be
necessary to redefine for each new project. (Interview with Manager A & Manager B,
Semcon, 2012)
A close dialogue with customer is required in most projects. By keeping a close reconciliation
with the customers, a more satisfying result and less misunderstanding is obtained. Projects
with a high level of communication between Semcon and the customers have a higher grade
of satisfied customers. (Interview with Manager A & Manager B, Semcon, 2012)
41
5.5 Resource utilisation
PD projects are in a first stage planed by the team manager who makes a rough project plan.
By using a resource system once a week, the utilisation of each employee in the department is
visualised. Resources are often available, but difficulty in finding a “perfect match” between
the project and available resources often occurs. In those cases, sufficient results can be
achieved by being dynamic, letting project members bounce ideas with more knowledgeable
consultants (occupied by other projects). Extra resources to in-house projects are often
managed within the division and external resources are rarely needed. The level of occupancy
is often between 85-90 percent at TDO. (Interview with Manager A & Manager B, Semcon,
2012)
A balance between direct service and in-house projects needs to be obtained. Assignments
involving direct service are often easier to obtain than in-house projects. But if the majority of
the consultancies are occupied with direct service, a lack of resources for in-house projects
occurs. On the other hand, it is not affordable to have large resources in-house without a
project to process. It takes time to change the strategy from direct services and in a higher
grade rely on in-house projects. The strategy to focus more on in-house projects might be
expensive, especially on a short term basis. (Interview with Manager C, Semcon, 2012)
5.6 Quote
Two types of pricing exist during in-house projects at TDO, fixed pricing and continuously
pricing. Projects with a fixed pricing require a project manager while continuously pricing can
be managed by engineers and designers. (Interview with Manager A & Manager B, Semcon,
2012) There are large risks involved with PD projects involving fixed pricing, since costs
might accelerate. (Interview with Consultant A, Semcon, 2012)
Quotations are often divided between different phases in the project. Quotations for e.g. the
exploratory study, concept development and construction stage can be divided to give the
customer higher financial control of the project. Manager A and Manager B states that the
budgets are not always managed correctly and Semcon looses revenue in certain projects,
mainly because of unforeseen circumstances in the PD process. It is often more difficult to
manage the quote when technologies are freezed late in the PD process. Managers at TDO
therefore prefer to handle the quotation early in projects and try to adapt to its preferences
during the development process. (Interview with Manager A & Manager B, Semcon, 2012)

42
6 BENCHMARKING
Benchmarking was performed among engineering companies that successfully have managed
to introduce Lean into their product development.
6.1 Autoliv
Autoliv is a worldwide leader in automotive safety. The company develop, market and
manufacture products such as seatbelts, airbags, safety electronics, seat components, vision
and radar systems etc. Out of approximately 48 000 employees, 4 400 are working with
research, development and engineering. The company exists in 29 countries with
approximately 80 plants. (http://www.autoliv.com/wps/wcm/connect/autoliv/Home/
Who+We+Are/ Fast%20Facts, 2012) The following findings concern Autoliv Sverige AB in
Vårgårda.
Autoliv’s Lean journey started during the nineties and has today spread widely in the
company. In 2010, Autoliv Sverige AB in Vårgårda received the Swedish Lean Prize,
awarded by Lean Forum3. The motivation where as follow:
...Distinctive is the structural and standardised working approach that follows processes
from product development to manufacturing, with cross functional as a natural ingredient.
Autoliv shows good examples in how Lean-tools are used. They are able to show
quantitative changes in their result and have received large cost reductions.... Autoliv is a
role model to be inspired and learn from... (Lean Forum, Press release, 2010)4
6.1.1 Lean Product Development at Autoliv
Autoliv in Vårgårda is working with Lean in many different areas in the organisation
(manufacturing, product development, finance, human resources etc.). The Lean philosophy is
seen as something that affects the whole company, rather than limited areas, and therefore
needs to be widely spread. By working cross functional between different sections, Autoliv
believe that the whole process can be continuously improved. Lean as a concept was initially
introduced in manufacturing at Autoliv, but after a few years the company realised that the
methodologies needed to be further spread to integrate in the whole organisation. (Interview
with Laas & Svantesson, Autoliv, 2012)
3 Lean Forum is a leading inspirer and educator within Lean. The organisation conducts activities within
research, development, education, training and guidance, and awards the Swedish Lean Prize.
(http://www.leanforum.se/andamal.asp, 2012) 4 Note! Translated from Swedish to English.
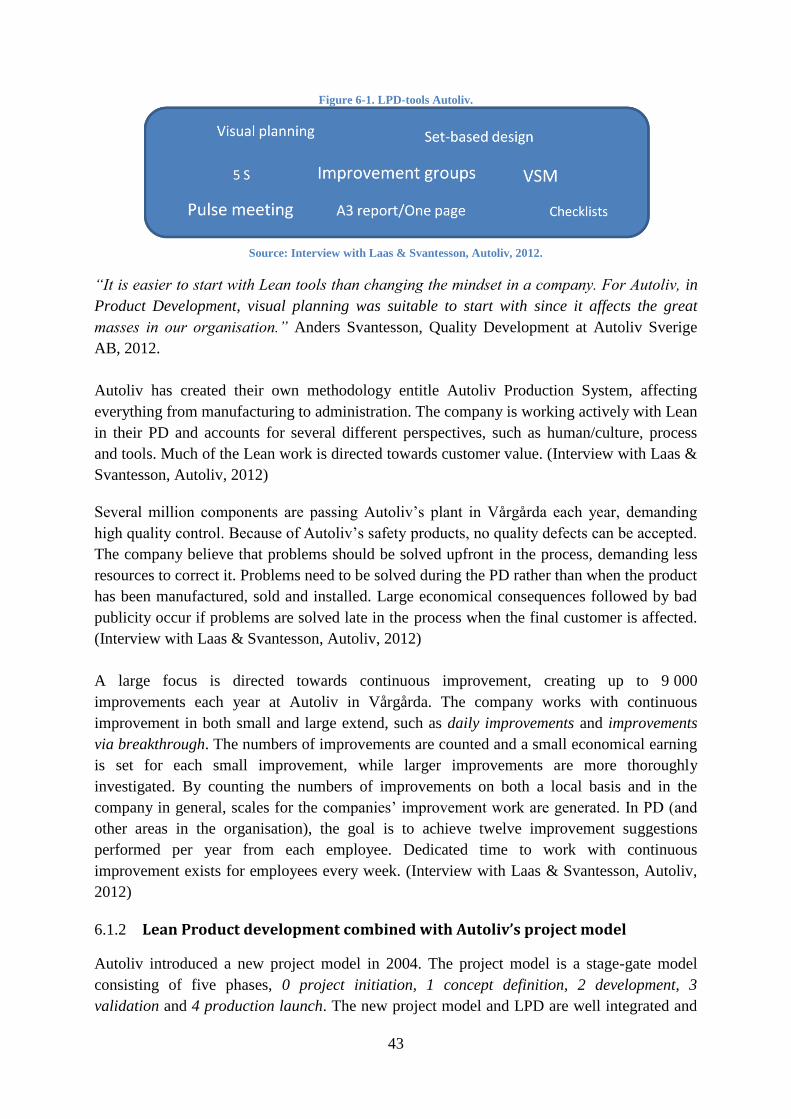
43
Figure 6-1. LPD-tools Autoliv.
Source: Interview with Laas & Svantesson, Autoliv, 2012.
“It is easier to start with Lean tools than changing the mindset in a company. For Autoliv, in
Product Development, visual planning was suitable to start with since it affects the great
masses in our organisation.” Anders Svantesson, Quality Development at Autoliv Sverige
AB, 2012.
Autoliv has created their own methodology entitle Autoliv Production System, affecting
everything from manufacturing to administration. The company is working actively with Lean
in their PD and accounts for several different perspectives, such as human/culture, process
and tools. Much of the Lean work is directed towards customer value. (Interview with Laas &
Svantesson, Autoliv, 2012)
Several million components are passing Autoliv’s plant in Vårgårda each year, demanding
high quality control. Because of Autoliv’s safety products, no quality defects can be accepted.
The company believe that problems should be solved upfront in the process, demanding less
resources to correct it. Problems need to be solved during the PD rather than when the product
has been manufactured, sold and installed. Large economical consequences followed by bad
publicity occur if problems are solved late in the process when the final customer is affected.
(Interview with Laas & Svantesson, Autoliv, 2012)
A large focus is directed towards continuous improvement, creating up to 9 000
improvements each year at Autoliv in Vårgårda. The company works with continuous
improvement in both small and large extend, such as daily improvements and improvements
via breakthrough. The numbers of improvements are counted and a small economical earning
is set for each small improvement, while larger improvements are more thoroughly
investigated. By counting the numbers of improvements on both a local basis and in the
company in general, scales for the companies’ improvement work are generated. In PD (and
other areas in the organisation), the goal is to achieve twelve improvement suggestions
performed per year from each employee. Dedicated time to work with continuous
improvement exists for employees every week. (Interview with Laas & Svantesson, Autoliv,
2012)
6.1.2 Lean Product development combined with Autoliv’s project model
Autoliv introduced a new project model in 2004. The project model is a stage-gate model
consisting of five phases, 0 project initiation, 1 concept definition, 2 development, 3
validation and 4 production launch. The new project model and LPD are well integrated and
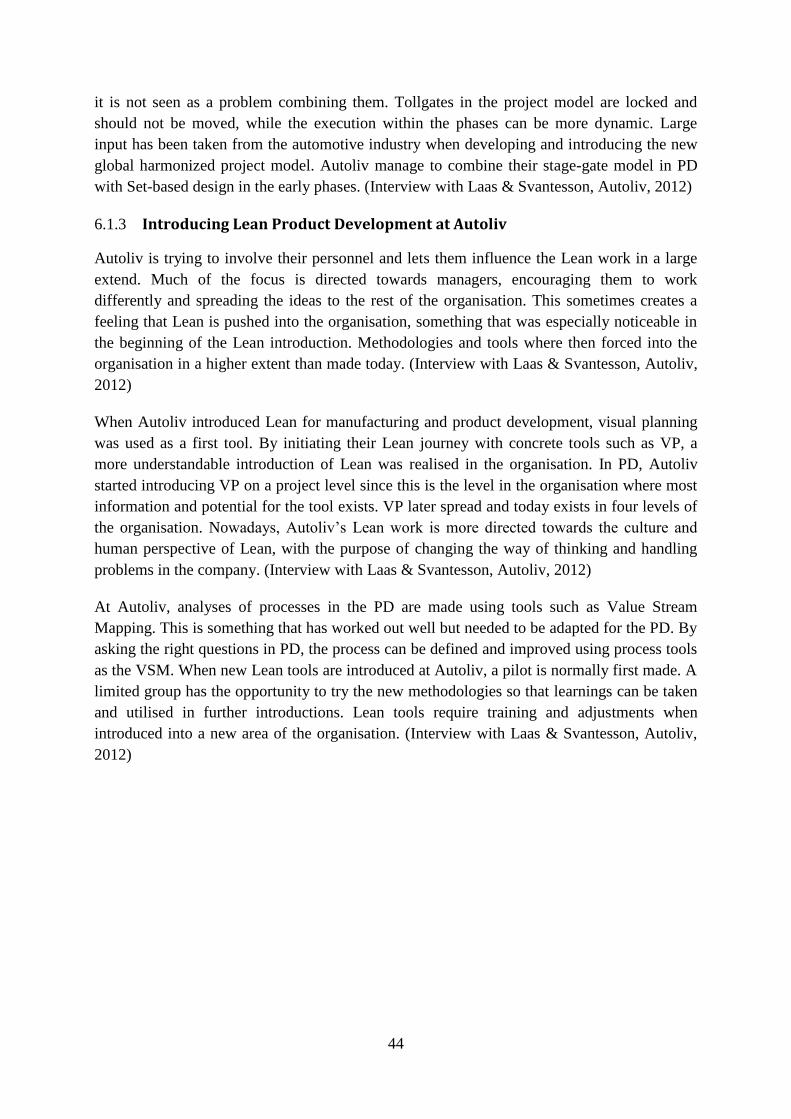
44
it is not seen as a problem combining them. Tollgates in the project model are locked and
should not be moved, while the execution within the phases can be more dynamic. Large
input has been taken from the automotive industry when developing and introducing the new
global harmonized project model. Autoliv manage to combine their stage-gate model in PD
with Set-based design in the early phases. (Interview with Laas & Svantesson, Autoliv, 2012)
6.1.3 Introducing Lean Product Development at Autoliv
Autoliv is trying to involve their personnel and lets them influence the Lean work in a large
extend. Much of the focus is directed towards managers, encouraging them to work
differently and spreading the ideas to the rest of the organisation. This sometimes creates a
feeling that Lean is pushed into the organisation, something that was especially noticeable in
the beginning of the Lean introduction. Methodologies and tools where then forced into the
organisation in a higher extent than made today. (Interview with Laas & Svantesson, Autoliv,
2012)
When Autoliv introduced Lean for manufacturing and product development, visual planning
was used as a first tool. By initiating their Lean journey with concrete tools such as VP, a
more understandable introduction of Lean was realised in the organisation. In PD, Autoliv
started introducing VP on a project level since this is the level in the organisation where most
information and potential for the tool exists. VP later spread and today exists in four levels of
the organisation. Nowadays, Autoliv’s Lean work is more directed towards the culture and
human perspective of Lean, with the purpose of changing the way of thinking and handling
problems in the company. (Interview with Laas & Svantesson, Autoliv, 2012)
At Autoliv, analyses of processes in the PD are made using tools such as Value Stream
Mapping. This is something that has worked out well but needed to be adapted for the PD. By
asking the right questions in PD, the process can be defined and improved using process tools
as the VSM. When new Lean tools are introduced at Autoliv, a pilot is normally first made. A
limited group has the opportunity to try the new methodologies so that learnings can be taken
and utilised in further introductions. Lean tools require training and adjustments when
introduced into a new area of the organisation. (Interview with Laas & Svantesson, Autoliv,
2012)
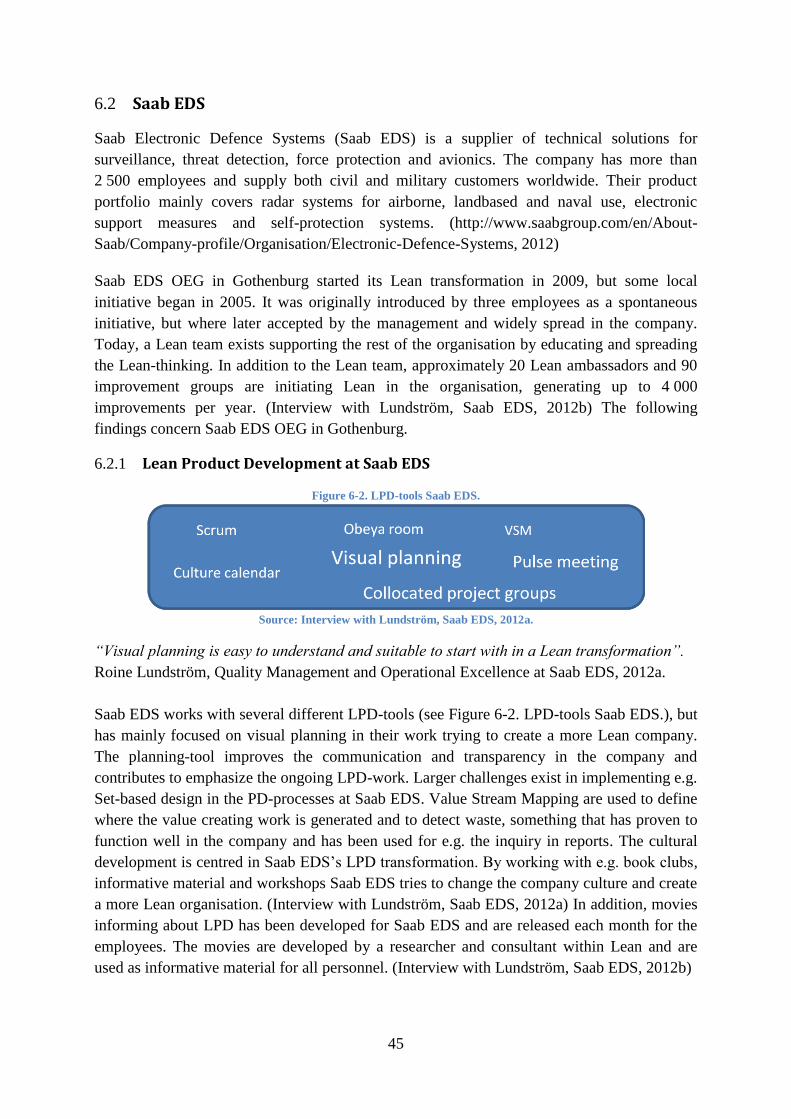
45
6.2 Saab EDS
Saab Electronic Defence Systems (Saab EDS) is a supplier of technical solutions for
surveillance, threat detection, force protection and avionics. The company has more than
2 500 employees and supply both civil and military customers worldwide. Their product
portfolio mainly covers radar systems for airborne, landbased and naval use, electronic
support measures and self-protection systems. (http://www.saabgroup.com/en/About-
Saab/Company-profile/Organisation/Electronic-Defence-Systems, 2012)
Saab EDS OEG in Gothenburg started its Lean transformation in 2009, but some local
initiative began in 2005. It was originally introduced by three employees as a spontaneous
initiative, but where later accepted by the management and widely spread in the company.
Today, a Lean team exists supporting the rest of the organisation by educating and spreading
the Lean-thinking. In addition to the Lean team, approximately 20 Lean ambassadors and 90
improvement groups are initiating Lean in the organisation, generating up to 4 000
improvements per year. (Interview with Lundström, Saab EDS, 2012b) The following
findings concern Saab EDS OEG in Gothenburg.
6.2.1 Lean Product Development at Saab EDS
Figure 6-2. LPD-tools Saab EDS.
Source: Interview with Lundström, Saab EDS, 2012a.
“Visual planning is easy to understand and suitable to start with in a Lean transformation”.
Roine Lundström, Quality Management and Operational Excellence at Saab EDS, 2012a.
Saab EDS works with several different LPD-tools (see Figure 6-2. LPD-tools Saab EDS.), but
has mainly focused on visual planning in their work trying to create a more Lean company.
The planning-tool improves the communication and transparency in the company and
contributes to emphasize the ongoing LPD-work. Larger challenges exist in implementing e.g.
Set-based design in the PD-processes at Saab EDS. Value Stream Mapping are used to define
where the value creating work is generated and to detect waste, something that has proven to
function well in the company and has been used for e.g. the inquiry in reports. The cultural
development is centred in Saab EDS’s LPD transformation. By working with e.g. book clubs,
informative material and workshops Saab EDS tries to change the company culture and create
a more Lean organisation. (Interview with Lundström, Saab EDS, 2012a) In addition, movies
informing about LPD has been developed for Saab EDS and are released each month for the
employees. The movies are developed by a researcher and consultant within Lean and are
used as informative material for all personnel. (Interview with Lundström, Saab EDS, 2012b)
46
6.2.2 Lean Product development combined with Saab EDS’s project model
“In most projects, processes are well defined in a water fall based model with clear
changeovers. The reality is more agile with continuous deliveries and overlapping.” Roine
Lundström, Quality Management and Operational Excellence at Saab EDS, 2012a.
Roine Lundström argue that there are not any great difficulties in combining LPD and Saab
EDS’s existing project methodology, but adjustments might be necessary. The project
methodology is not always followed and processes are overlapped in today’s working
methods. By starting future operations before the tollgates, the project execution’s flow is
enhanced. (Interview with Lundström, Saab EDS, 2012a)
6.2.3 Introducing Lean Product Development at Saab EDS
Roine Lundström describes the Lean philosophy as the most important factor for LPD tools to
remain in the organisation. It changes the way employees act and help introducing new LPD
tools. The culture makes people question old methods and procedures and helps open up for
changes. When new methods are to be introduced, Saab EDS uses people and groups with
curiosity in LPD to test. New ideas are encouraged and often start on a local basis in the
organisation, but it is important to embed the changes with the management. Saab EDS’s
Lean expertise works as a support function to the rest of the organisation and tries to involve
and encourage local initiative as much as possible. All employees are encouraged to
participate in Saab EDS’s LPD course to spread the knowledge in the whole organisation.
(Interview with Lundström, Saab EDS, 2012a)
Saab EDS uses economical performance indicators to measure the Lean-transformation. An
economical earning is determinant for each LPD related change made in the organisation,
something that is often difficult to estimate. The number of executed improvements, the well
being among employees (measured through employee satisfaction surveys) and deliveries are
also used as performance indicators in Saab EDS’s Lean transformation. (Interview with
Lundström, Saab EDS, 2012a) By investigating projects delays before and after the Lean
introduction, significant improvements can be interpreted. (Interview with Lundström, Saab
EDS, 2012b)

47
6.3 Scania
Scania is a leading actor in manufacturing of trucks, buses and marine engines. The company
operates in about 100 countries worldwide and provide a wide range of service related
products and financial services. Scania has more than 35 000 employees with 2 400 working
within R&D, most of them at the plant in Sweden in Södertälje. (http://www.scania.se/om-
scania/scaniakoncernen, 2012)
“Scania’s philosophy aims to minimize waste and place the costumer first. We want to work
with problem solving and maximize the customer value”. Peter Palmér, Senior Manager
Process Support R&D at Scania, 2012.
Scania initiated their Lean transformation during the end of 1980, but their aim to create a
resource efficient company started long before. Modularization as a working technique in
product development was introduced before World War II and the customer focus during the
thirties. Scania developed the production philosophy (Scania Production System) as well as
retail philosophy (Scania Retail System). Both systems focus on the processes and aim to
work with continuous improvement. (Interview with Palmér, Scania, 2012)
The purpose of Scania Production System is to eliminate waste and make the production more
efficient. The employees are encouraged to find deviations and improve the current working
situation. By doing so, continuous improvement are managed. Scania Production System is
based on three core values: (1) The customer first, (2) respect for the individual and (3)
elimination of waste. They are working with production methodologies such as standardised
work, right from me, production on-demand and continuous improvement.
(http://se.scania.com/scania-group/philosophy/scania-production-system, 2012)
The purpose of Scania Retail System is to improve the efficiency and service to customers.
The philosophy is applied on the whole sell and service networks and is based on keystones
such as customer perspective, continuous improvement and elimination of waste.
(http://se.scania.com/scania-group/philosophy/scania-retail-system, 2012)
6.3.1 Lean Product Development at Scania
Figure 6-3. Scania product development approach.
Source: Interview with Palmér, Scania, 2012.
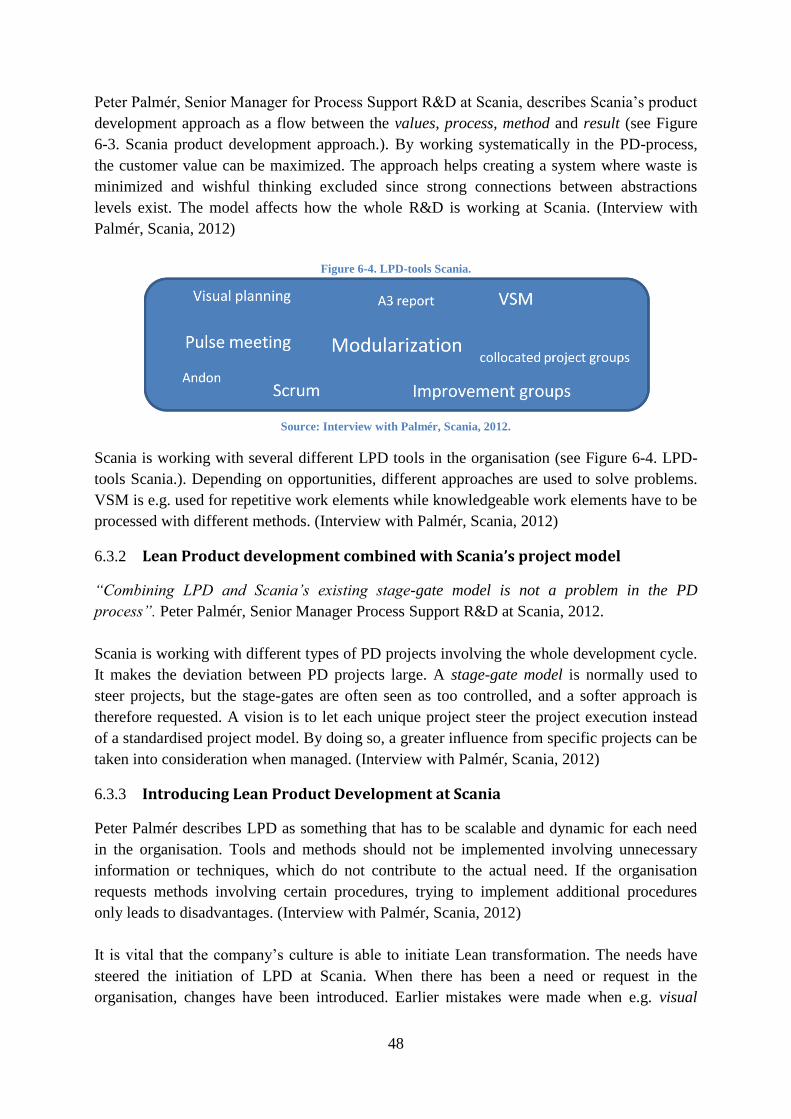
48
Peter Palmér, Senior Manager for Process Support R&D at Scania, describes Scania’s product
development approach as a flow between the values, process, method and result (see Figure
6-3. Scania product development approach.). By working systematically in the PD-process,
the customer value can be maximized. The approach helps creating a system where waste is
minimized and wishful thinking excluded since strong connections between abstractions
levels exist. The model affects how the whole R&D is working at Scania. (Interview with
Palmér, Scania, 2012)
Figure 6-4. LPD-tools Scania.
Source: Interview with Palmér, Scania, 2012.
Scania is working with several different LPD tools in the organisation (see Figure 6-4. LPD-
tools Scania.). Depending on opportunities, different approaches are used to solve problems.
VSM is e.g. used for repetitive work elements while knowledgeable work elements have to be
processed with different methods. (Interview with Palmér, Scania, 2012)
6.3.2 Lean Product development combined with Scania’s project model
“Combining LPD and Scania’s existing stage-gate model is not a problem in the PD
process”. Peter Palmér, Senior Manager Process Support R&D at Scania, 2012.
Scania is working with different types of PD projects involving the whole development cycle.
It makes the deviation between PD projects large. A stage-gate model is normally used to
steer projects, but the stage-gates are often seen as too controlled, and a softer approach is
therefore requested. A vision is to let each unique project steer the project execution instead
of a standardised project model. By doing so, a greater influence from specific projects can be
taken into consideration when managed. (Interview with Palmér, Scania, 2012)
6.3.3 Introducing Lean Product Development at Scania
Peter Palmér describes LPD as something that has to be scalable and dynamic for each need
in the organisation. Tools and methods should not be implemented involving unnecessary
information or techniques, which do not contribute to the actual need. If the organisation
requests methods involving certain procedures, trying to implement additional procedures
only leads to disadvantages. (Interview with Palmér, Scania, 2012)
It is vital that the company’s culture is able to initiate Lean transformation. The needs have
steered the initiation of LPD at Scania. When there has been a need or request in the
organisation, changes have been introduced. Earlier mistakes were made when e.g. visual
49
planning was forced into the organisation by external consultants. LPD-tools have to be
adapted to fit the organisation and contribute with improvements. (Interview with Palmér,
Scania, 2012)
Measuring results of an LPD transformation and identifying the right performance indicators
are difficult. At Scania, the level of well being among employees is measured through
employee satisfaction surveys which are believed to reflect a credible view of the LPD
transformations success. (Interview with Palmér, Scania, 2012)
50
Part V
DISCUSSION
In this chapter the collected information is analysed using the theoretical framework and
empirical findings. Furthermore an action plan for introducing LPD at Semcon is presented.
51
7 ANALYSIS
The analysis derives from reviews from Part II THEORETICAL FRAMEWORK and Part IV
EMPIRICAL FINDINGS. The analysis is divided in the three perspectives: (1) Human, (2)
Process and (3) Tools and Technology.
7.1 Lean Product Development – Human perspective
Liker & Meier (2006) discuss how the culture in an organisation to a large extent defines the
company’s success. The authors discuss how it forms the way decisions are being made and
therefore the future state. To have a shared DNA in the corporation helps when introducing
Lean thinking into an organisation. Semcon is actively working with its cultural development.
They are introducing new working techniques and are trying to define their company culture.
It leads to a shared DNA which is believed to help them in their Lean transformation. If
everyone in the company is aware of the core values that define their organisation, decisions
supporting those values will easier be managed. Consultants at Semcon are to a large extent
working with direct-service at the customer’s premises, leading to a less united culture and
atmosphere within Semcon. It is therefore of great importance to continue spreading the
cultural constitutes, creating a more united philosophy. Something that is important when
spreading the Lean philosophy.
The spine of the Toyota Production System, the four Ps model, reflects the Lean philosophy
extensively according to Liker & Meier (2006). The first P, the philosophy, aims to add value
to the customers, associates, society and community. Semcon is creating value for the
customers and associates. The company aim to undertake more and larger in-house projects,
something that is unlikely to succeed if value is not generated for both customers and
associates. The second P in TPS, the process, aims to eliminate waste, enabling cost reduction
as well as enabling quality improvements (Liker & Meier, 2006). The study indicates that this
is something Semcon is working actively with. A well defined management system exist
(Compass), presenting clear procedures and courses of action. Semcon has a well defined
project model, XLPM, which defines the process of projects. However, the project model is
not always followed, something that creates unclearness during the project execution. If
XLPM is not followed, guarantees cannot be given that the project provides the right quality.
XLPM presents a standardised way to execute projects. Tonnquist (2010) claims it to be
important, enabling more customer value with shorter throughput time, and that it therefore
strengthens the competitive advantages. The third P in TPS, people and partners, aims to
make them grow and generate value for the organisation (Liker & Meier, 2006). Semcon
consists of professionals that set high demands on their employer. Education and personal
development exist. Involvement of collaboration partners such as suppliers and customers,
something that Toyota has shown great success in (Liker & Meier, 2006), can be extended
more than today at Semcon. Projects are sometimes executed with little collaboration with the
customer (e.g. see 1.1 Air-cleaner project). This leads to limited information and potential for
the PD. Manager A at TDO (2012a), states that customers in general are more satisfied with
the result when they have had a large involvement in the PD process. Improved collaboration

52
with suppliers and customers does not only lead to greater results in the PD, but also to more
knowledge among Semcon consultants. By learning from suppliers and customers (often best
in practice), more knowledge gaps within projects can be filled leading to a higher internal
competence at Semcon. Problem Solving, the fourth P in TPS, means investigating problems
down to the roots and understanding the actual reason, and then sharing the knowledge with
the rest of the organisation (Liker & Meier, 2006). This creates a learning organisation which
generates continuous improvement. In this area, Semcon has a large potential to develop.
Problems are not always investigated down to the root cause, leading to reappearance.
Semcon has great possibilities to improve its organisation by applying continuous
improvement in the problem solving. Systematic approaches for problem solving, something
that does not exist in the organisation today, could be a suitable starting. By standardising
solutions as today’s best practice, a launching point for further development will be reached,
creating a learning organisation.
When Toyota defines its two most important phrases in the company, continuous
improvement is one. The methodology adds value to the organisation (Hino, 2006) and
reduces costs and waste (Hill & Hill, 2009). Saab EDS has created a well functioning system
in order to exploit ideas of the employees, leading to continuous improvement in the
company. The 4 000 improvements that are generated by the employees each year leads to
huge progress and savings. (Interview Lundström, Saab EDS, 2012a) Autoliv in Vårgårda has
shown even greater results, handling up to 9 000 improvements per year, with much of the
improvements generated in Autoliv’s PD process (Interview with Laas & Svantesson,
Autoliv, 2012). Also Scania is working actively with continuous improvement (Interview
with Palmér, Scania, 2012). Morgan & Liker (2006) discuss how a built in learning system
that encourage continuous improvement may be the most important LPD principle when
introducing Lean to PD, and their viewpoint is likely to correspond with the three
benchmarking companies’ attitude. From this perception, Semcon has great possibilities to
learn. By working with improvements in both small and large scales, Semcon can most likely
gain large positive effects by organising their improvements in a more controlled and
systematised way than made today. With a built in learning system, a structured and organised
method to encourage, process and display improvements, large savings might be possible.
Waste in several forms (unused creativity, correction, processing, waiting etc.) can be
reduced. Today at Semcon, new ideas are not exploited as much as they could. New
improvements often stay on a local basis at TDO, and are not spread in the organisation. This
means that “the wheel” often needs to be reinvented, even though the knowledge and
information exist within the company. This creates waste and can be managed better. By
encouraging ideas from Semcon’s employees, and then realising them and spreading the
results in the company, great outcome are thought to be possible.
53
7.2 Lean Product Development – Process perspective
Stefan Bükk, researcher and consultant within LPD at Swerea IVF, as well as Holmdahl
(2010), emphasize the importance of spreading knowledge in PD (2.2 Lean Product
Development – Process perspective). They highlight the knowledge flow as one of the most
important factors in successful PD. But how the knowledge flow should be realised is
complex and difficult to achieve. Currently, Semcon is not used to spread knowledge from
earlier projects (5.3 Product development). Little documentation about earlier projects and
experiences are spread in the organisation. By improving the knowledge flow within Semcon,
great potential may exist. In a large company like Semcon, it is not only important to spread
knowledge about new learnings, but also knowledge about “who knows what”. Spreading
what kind of knowledge and competence exist in the organisation might create a more
transparent organisation that invites more possibilities. If consultants know what knowledge
exists among their colleagues, it facilitates search of information, leading to continuous
learning. A higher competence is generated among Semcon’s consultants creating higher
value for the organisation. Offers from customers can easier be handled since the knowledge
and competence existing within Semcon is more widely known.
By using the full design space (including a lot of possibilities) when developing new
products, instead of single points in the design space (limiting the potential), more
possibilities exist in PD (Holmdahl, 2010). Sobek II et al. (1999) describe how the design
space gradually should be limited, always including a feasible solution. By working with this
approach, always having a feasible solution available (Set-based concurrent engineering),
higher risks can be taken and more successful innovative heights can be reached. Possibilities
exist in Semcon’s PD processes if the work is done with a more open design space than today.
However, the possibility for doing this heavily depends on the customers preferences.
Depending on projects, customers can request specific tasks allowing only single points in the
design space to be utilised, as well as allowing utilisation of the whole design space. Earlier
projects show that Semcon is capable of doing both (5.3 Product Development). In projects
were customers request Semcon to perform only detailed engineering, not including the
earlier PD phases, the potential for Semcon to utilise a large design space as well as Set-based
design is limited. TDO’s strategy is to use the full design space, when possible, in order to
deliver high value for the customer (Semcon@TDO presentation för kunder, 2012). A
conclusion is that Semcon needs to convince their customers to provide a more broad design
space for Semcon to work in, instead of being given limited opportunities to affect the final
result. By doing so, it is likely that both the customer and Semcon will be more satisfied with
the PD result. This is however a cultural change that Semcon must convince their customers
of, something that is not believed to be easy. But if Semcon can provide satisfying results
working with a broad design space, customers might be convinced to provide a broader range
of design possibilities for future projects. Semcon must clarify the advantages of working
with a large design space for the customers, instead of being given limited opportunities to
impact the result of the PD. However, it is important to emphasise that all customers do not
wish Semcon to perform entire PD projects, but only needs Semcon to complete specific tasks
(e.g. detailed engineering). During these assignments, a broader design space is not possible

54
for Semcon. Nevertheless, assignments like these can be improved by standardisations,
leading to higher quality and waste elimination (Morgan & Liker, 2006).
7.2.1 Excellence in Project Management (XLPM) combined with Lean Product Development
Manager A at TDO (2012a) states that TDO’s strategy is to add much value to the PD process
in the research and concept phase, the early stages of the PD. TDO’s opinion is that these
phases to a great extent contribute to the project’s final value, a view shared with many
researchers within the field. The possibility to influence the success of a PD project is never
greater than in the start, creating potential to find the optimal solution (Berglund & Westling,
2009; Morgan & Liker, 2006; Sobek II et al., 1999). Working with Set-based design is an
excellent method for creating high value early in the PD. The resources are front-loaded and
possibilities to minimize risks increase. (Berglund & Westling, 2009) Adding great value to
the PD in the beginning of the project and working with different parallel concepts is an
ambition at TDO (5.3 Product development) and something that create successful PD (see
Appendix 1.1 Air-cleaner project). There are clear advantages when working with front-
loaded PD and Set-based design. But according to Semcon’s management, it is decided that
all internal projects should follow the project model XLPM (Interview with Consultant A,
Semcon, 2012). This raises the issue if it is possible to combine front-loaded PD and Set-
based design with Semcon’s project model XLPM? This would be ideal for TDO, and
probably for other departments at Semcon. When analysing the possibilities to combine LPD
with XLPM, two sub questions arise. Is XLPM allowing front-loaded PD (as normally
performed in LPD) and is XLPM dynamic enough to be compatible with LPD? The questions
are discussed in each paragraph below.
The first question, if XLPM is compatible with front-loaded PD, concerns the structure of
XLPM. XLPM consists of tollgates that are large, predesigned, decision points where the
whole prospect of the project is evaluated (3.2.2 Project life cycle model). Large similarities
exist between XLPM and other project models when it comes to structure and context
(Tonnquist, 2010). In LPD, decision points are not used in the same way as tollgates are used
in XLPM and in most other project models. Instead of tollgates, more dynamic phases and
integration points are used. Integration points in LPD are, according to Holmdahl (2010),
where parameters are limited and concepts excluded. It is first when parameters have been
limited to single points in the design space and the final concept is chosen, that the product
specification is completed and ready for detailed engineering. According to both XLPM and
LPD, the insecurity in projects decreases with the number of tollgates/phases completed and
the project converge towards a solution. However, based on how the methodologies
traditionally are used, the speed at which the project converges towards a solution is different.
PD projects performed at Semcon, using XLPM, have a more limited analyse phase compared
to LPD. Traditionally when XLPM are used, concepts are limited earlier in the process and
the PD therefore converges towards a solution faster. In LPD, more focus is directed towards
the first phases to develop a broad range of solutions, leaving many options available.
However, it is not due to XLPM that PD projects by tradition are not front-loaded. XLPM
55
does not limit the potential for conducting front-loaded PD, but it is because of traditional
planning that XLPM are used in this way. In XLPM, projects can be planned with much focus
towards the earlier phases and converge more slowly towards a solution. It is not the project
model that limits the potential for conducting front-loaded PD, but the way projects by
tradition are being planned. It is important to emphasise that the tollgates location in XLPM
are not chronological standardised in the PD process, but is decided for each specific project.
Since XLPM as project model is developed to fit more projects than only PD (3.2 Excellence
in Project Management), the tollgate locations cannot be fully standardised, and need to be
adaptable. By positioning the tollgates with much focus towards the beginning of projects,
front-loaded PD is thought to be possible. It can therefore be argued that tollgates can be
positioned to link with LPD and Set-based design, allowing for front-loaded PD and a more
slowly convergence towards a solution. Tollgates in XLPM are normally set to fit traditional
PD, but have just as well the possibility to fit front-loaded PD. Based on this, it is thought that
tollgates in XLPM can be adjusted to fit the PD process of LPD and front-loaded PD.
The second question that arises when trying to combine XLPM and LPD, is whether XLPM is
dynamic enough? LPD is dynamic (Holmdahl, 2010) while XLPM is a stage-gate model,
having well defined tollgates where decisions determining the future road of the PD are taken
(Semcon Project Management AB, 2010d). XLPM requires tollgates decisions about for
example concepts to be made before the project continues, which contradicts the idea of Set-
based design. In Set-based design, several concepts are developed simultaneously and the
decision of which concept should proceed to detailed engineering, is taken late in the PD
process (Sobek II et al., 1999). LPD is thought to be more dynamic than XLPM, allowing for
vital decisions to be managed gradually and not predetermined. Decision points in LPD are
not as controlled as in XLPM, allowing for more adjustments to be made during the project
execution. Holmdahl (2010) and Bükk (Interview with Bükk, Swerea IVF, 2012) argue that
approaches with stage-gate models often limit the potential of PD. They claim that stage-gate
models limit PD because of their lack of ability to be dynamic. However, even though XLPM
is a stage-gate model and includes well defined decision points, changes in projects are
allowed. The project model includes possibilities for e.g. PD solutions to be changed during
the project execution, and even though it might not be as dynamic as LPD, it accepts
modifications. Based on this, even though XLPM is not as dynamic as LPD, the models are
believed to be compatible.
Scania, Saab EDS and Autoliv are all using stage-gate models in their PD processes. The
companies have shown that combining their project model and LPD is possible, but
restrictions in the dynamics exist. Peter Palmér, Senior Manager for Process Support R&D at
Scania, claims that LPD and Scania’s existing stage-gate model can be combined. However, a
more dynamic and agile approach of the model is requested to provide better conditions for
the PD projects. Roine Lundström, Quality Management and Operational Excellence at Saab
EDS, argues that there are no great difficulties in combining Saab EDS’s stage-gate model
with LPD. But in similarity with Scania, a more dynamic approach is thought to be more
suitable for the PD processes. In addition, Lundström adds that more overlapping of project
phases exists in reality than the project model allows for, which enhances the project
56
execution. The PD phases are more dynamic and deliveries, as well as changes, of
information occur frequently. Andres Laas and Anders Svantesson at Autoliv state that their
new project model is well integrated with LPD, and combining the methodologies is not a
problem. Furthermore, Autoliv manages to combine its stage-gate model with Set-based
design, something that according to Holmdahl (2010) is problematic and difficult. How this is
managed and what learning can be taken from Autoliv’s success in combining its stage-gate
model with LPD and Set-based design, is an interesting area for further investigations.
When investigating how XLPM relates to Holmdahl’s (2010) LPD process, certain
similarities can be interpreted (see Table 7-1. XLPM tollgates VS LPD phases.). The first
three stages have large similarities while stage 4 differs significantly. When analysing XLPM
from a product development approach, it is important to be aware of the fact that the project
model is not designed and dedicated for PD, but is general and exists in several different
project areas (3.2. Excellence in Project Management). In the comparison between XLPM and
LPD below, the process of XLPM is described as it is defined, not as it necessary is being
used.

57
Table 7-1. XLPM tollgates VS LPD phases.
Source: Semcon Project Management AB (2010c), p. 41; Holmdahl (2010), p. 102.
1. The first stage in XLPM (initiated with TG 0) and LPD has large similarities.
Semcon’s Quality & Environment Manager describes the first two phases in XLPM as
discussion phases with the customer (Interview with Manager C, Semcon, 2012).
Similarities can be seen in LPD, where the first two phases contribute to create an
overview of the project. At TDO, the team manager’s aim is to involve the prospected
project manager as early as possible in new projects, to get his or her input and
opinion for the further planning (Interview with Manager A & Manager B, Semcon,
2012). Similarities can be interpreted with phase 1 in LPD, where a chief engineer is
appointed. It can be possible for TDO to involve the project manager even earlier in
projects in order to gain a better control of the assignment from the start, both from a
technical and economical perspective.
Stage Tollgates XLPM
Semcon Project Management AB (2010d).
Phases LPD
Holmdahl (2010).
1
TG 0. Decision to start project analysis. Phase 1. A business opportunity is disclosed.
PD-project starts and the
assignment is described in an
overall view, not detailed. A chief
engineer (2.3.6 Chief engineer) is
appointed.
2
TG 1. Decision to start project planning. Phase 2. Concept development. The
technical specification slowly
develops. Knowledge gaps are
indentified and planned how to be
handled. Conflicts are identified and
solved.
3 TG 2. Decision to establish project and
start project execution.
Phase 3. Set-based design (several parallel
PD-tracks, see 2.2.1 Set-based
design).
4
TG 3. Decision to continue project
execution from the original or
modified plan (realisation).
Phase 4. Integration points. Numbers of PD
solutions are excluded.
Phase 5. Detailed engineering. The PD is in a
secure phase without surprises since
knowledge gaps have been rectified.
5 TG 4. Decision to submit the projects
result to the final receiver.
6 TG 5. The project’s final result is
accepted, decision to start project
closure.
58
2. The next tollgate is according to Semcon’s Quality & Environment Manager often
included in the selling phase. It can be interpreted from earlier PD projects that the
time between TG 1 (project is planned) and TG 2 (start of project execution) is not as
time consuming as the matching phase in LPD (phase 2). In LPD, phase 2 includes
identification of knowledge gaps, planning of how to handle knowledge gaps and
elimination of conflicts. The LPD stage is more extensive than traditional PD in
XLPM, and therefore requires more time. More effort is directed towards the
beginning of the project in LPD (front-loaded PD), to properly identify and plan all
knowledge gaps. This is done to eliminate surprises later in the PD. However, XLPM
do not limit the potential for having a wider concept phase. This stage is therefore
possible to extend (compared with traditional PD) to fit front-loaded PD.
3. Similarities are found to exist between XLPM and LPD in stage 3. Both
methodologies aim to start project execution (TG 2 in XLPM). LPD is having very
wide perceptions in this phase, focusing on Set-based design, and converging towards
a single solution more slowly than traditional PD.
4. In stage four, XLPM initiates with TG 3 and focus on the decision to continue project
execution from the original or modified plan as well as on the realization of the
project. In Holmdahl’s (2010) LPD model, stage 4 includes integration points where
parallel PD solutions are eliminated step by step. Integration points in LPD are much
smaller decision points (solutions are analysed and excluded) than tollgates are in
XLPM. LPD strives to delay decision making of a single solution. When comparing
XLPM and LPD, it can be argued that phase 4 in XLPM includes both phase 4 and
phase 5 in the LPD process. In XLPM, the realisation of the project is completed in
phase 4, while the detailed engineering is not performed until phase 5 in the LPD
model.
5-6. The phases and tollgates are well described in XLPM, but corresponding phases are
not further developed in Holmdahl’s (2010) LPD process and can therefore not be
evaluated and discussed.
XLPM has two aspects, the business and human aspect. Both aspects have large similarities
with several perceptions in the Lean philosophy. Both XLPM’s business aspect and the
philosophy in Toyota’s 4P model aim to generate value for the customer and create conditions
for the organisation to develop and progress. XLPM’s business perspective is thought to have
a larger focus on the steering of an organisation while Lean focuses more on elimination of
waste and customer value. XLPM’s human perspective focuses largely at combining the
individual competence with the strength of the team. It highlights that people are the most
valuable asset in an organisation and uses keywords such as consensus, trust and respect.
Similarities can be seen in TPS where respect is an important factor in Toyota’s 4P model and
is one of Toyota’s must honoured keywords in The Toyota way 2001 (2.1 Lean Product
Development – Human perspective). Combining XLPM’s business and human aspects with
the Lean philosophy is not to be seen as a problem. The values are believed to complement
each other rather than counteract, and they often resembles in their viewpoints. However, in
what extent Semcon’s company philosophy resembles to XLPM’s aspects, and in what extent
XLPM’s aspects resembles to the Lean philosophy, require deeper analyses.

59
7.3 Lean Product Development – Tools and Technology perspective
Mann (2010) describes how visual management is a powerful contributor to a Lean
organisation. The author argues that VM reflects the human activity and processes,
connecting them together. By doing so, VM transforms abstract concepts of discipline into
direct observable practices, an important factor in Lean. Even though VM consisting of tools
such as boards and posters can be seen as “Stone Age” technology in our high-tech society, it
leads to great effects. Something happens when introducing a physical planning system in an
organisation. People are counting, writing and moving actions physically on the board. They
start to own their system, taking responsibility for their actions. Planning becomes more
substantial when moving physical symbols, than planning in an IT-software. In Ljunberg’s
(2010) research, advantages with visual management are clearly revealed. By working with
visualisation, more information is easily available, leading to higher understanding of
problems which enhances solutions and stimulation of goals and targets. TDO has
approximately 60 employees working with a broad mix of product development in different
projects. By utilising a VM system, a more transparent organisation could emerge, creating
new possibilities. Scania, Saab EDS and Autoliv have all introduced VM in their
organisations, something that has become an ordinary working technique. Visual planning
and pulse meetings are used by the companies to create a more transparent organisation,
where knowledge and possibilities are spread more easily. According to Holmhdahl (2010)
VP leads to a more efficient utilisation of resources, less project delays, improved
participation, improved understanding, levelled out workload and increased flexibility. These
are all important factors that could improve quality, utilisation and throughput time in PD,
something that Semcon wants to improve within their organisation. Introducing VM could
therefore be a sufficient method for Semcon to reach these goals.
Larger transparencies between projects at TDO are requested by several consultants. Little
knowledge often exists concerning TDO’s different projects. Problems, solutions and
documentation are not spread in the organisation (5.3 Product development; 5.4
Communication and project organisation), which is believed to limit the knowledge flow
described by Stefan Bükk (Interview with Bükk, Swerea IVF, 2012). Bükk claims that
knowledge is the centre in LPD, since it contributes to a learning organisation. By improving
the knowledge flow at Semcon, great possibilities exist. It leads to continuous learning and
higher competence among consultants, as discussed in 7.2 Lean Product Development –
Process perspective. An Obeya room involving several different projects is a powerful tool to
enhance the knowledge flow in Semcon’s PD. Horikiri, et al. (2008) states that the Obeya
room quickly highlights the real value added work and increases the pull effect in PD projects
and Morgan & Liker (2006) state that the Obeya room is a critical part of Toyota’s great
success in reducing lead time. These are desires requested by Semcon that could help Semcon
improve the project execution from a resource and time perspective. For TDO’s in-house
group, an Obeya room could contribute with information that supports project steering and
sharing of information. Andres Laas and Anders Svantesson at Autoliv explain how visual
tools helped the company to initiate its Lean journey, and a more comprehensible introduction
of Lean was obtained in the organisation. Autoliv started introducing visual planning on a

60
project level, since this is the level in the organisation where most information and potential
for the tool exists. Semcon have similar circumstances and the introduction of visual
communication on a project level could provide high potential. Holmdahl (2010) describes
that many experiences show how an Obeya room is an excellent tool to steer projects, since
an overall understanding is attained.
In Liker & Meier (2006) study of Toyota they discovered the great benefits of standardised
work. By constantly standardising new improvements and implementing best practices as
standard, organisations develops continually. But difficulties in standardising product
development compared with manufacturing may exist, since PD is a creative and complex
procedure. Morgan & Liker (2006) state how engineers often have a negative comprehension
about standardisations in their work. However, standardising repetitive PD work such as
documentation, planning, checklists etc., is thought to have a great significance for raising the
efficiency and quality. According to Holmdahl (2010) standardised PD and shared methods
for performing assignments lead to fewer abnormalities. Semcon recently initiated new
standards referred to as Delivery (5.2 Project methodology) involving checklists and
standardised work for specific branches (medical technology, offshore etc.). These branches
involve strict regulations and laws making standardisations valuable. Standardisations
increase throughput time, precise execution, quality and reduce waste in PD (Morgan &
Liker, 2006). Semcon is therefore working with important improvements when developing its
new standards, having the possibility to create huge enhancement in their PD processes. The
new standards might especially be important in the high regulated industries. Furthermore,
standardising Semcon’s PD is thought to provide better opportunities for successful
communication between Semcon’s different departments. Information (cad-files, reports,
technical specifications etc.) sent in a standardised format is thought to provide an enhanced
launching point for the next PD step.
To enable standards and continuous improvement to be made, the Plan-Do-Check-Act cycle
is an efficient tool (highlighted by benchmarking companies). Moen & Norman (2006)
describe it as a framework for improvements, encouraging planning, questioning, prediction
and iterative learning. Semcon is currently not working with this model. Based on interviews,
a conclusion is that Semcon is executing the first three steps in the PDCA-cycle relative
sufficiently, but could possibly improve further in the last step, the Act-stage. Semcon often
plans new changes, realises them and checks the outcome, but misses to spread the changes in
the company. Several improvements are made but do not always reach out in the organisation,
and often stay on a local or personal level. Standards for documentation and protocol
configuration for example, are valuable for TDO. These are actions that consultants either
avoid or solve by developing their own individual systems (5.4 Communication and project
organisation). In the Act-stage of the PDCA-cycle, new processes and solutions are to be
standardised in the organisation in order to spread the improvements (Holmdahl, 2010). In
this stage, Semcon is believed to have potential to improve.
Womack & Jones (1996, p. 37) describe the value of using Value Stream Mapping and claim
that “...activities that can’t be measured can’t be properly managed...”. They state that if

61
activities necessary to refine a process cannot be precisely identified, the activities cannot be
challenged or improved. According to this argument, the processes in Semcon’s PD should be
analysed and the value adding activities and waste investigated. But researchers within the
field have split opinions about the possibilities to generate Value Stream Mapping in product
development. Stefan Bükk, researcher within LPD at Swerea IVF, states that PD is too
complex for being investigated with methods such as VSM (Interview Bükk, Swerea IVF,
2012). However, Morgan & Liker (2006) claim that VSM is an extremely powerful tool in
PD, perhaps even more powerful than in manufacturing. Strong separate opinions exist about
VSM for PD among the researchers. But when investigating how some large Swedish
companies are working to detect waste in their PD processes, it turns out several are using
VSM as a tool to map their processes. Scania is using VSM in PD for repetitive work
elements but not for more knowledgeable work (Interview with Palmér, Scania, 2012). Saab
EDS uses VSM to examine the value adding activities in their PD processes (Interview with
Lundström, Saab EDS, 2012a) as well as Autoliv that has shown great success using VSM to
analyse its PD processes (Interview with Laas & Svantesson, Autoliv, 2012). This emphasises
that using VSM to investigate Semcon’s PD processes might be successful. On the other
hand, Semcon’s PD processes often include highly variable procedures since projects and
customers often changes (5.2 Project methodology). Semcon works as technical consultants,
leading to high differences among tasks and projects. This could make the VSM less usable
for Semcon’s processes, due to the high variation in PD projects. But VSM is still believed to
be sufficient when examining Semcon’s repetitive work elements, something that does not
vary highly with different kinds of projects. The tool would then be used to examine the
processes in the same arrangement as Scania does (6.3.1 Lean Product Development at
Scania), focusing on repetitive work rather than the more variable and creative PD work.
62
8 Action plan
When introducing LPD methodologies in an organisation, it is important to prioritise what
actions to initiate with. The concept is too extensive and complex to enable an introduction of
several methodologies simultaneously. The first step introducing LPD at Semcon needs to be
determent based on the opportunities with the suggested methodology and needs to support
additional LPD methodologies. It should be seen as an action for advancing the position for
further development, and need to endorse LPD perspectives and methodologies.
As discuses previously, the three perspectives in LPD (Human, Process and Tools and
Technology) are related and interdependent of each other. They all contribute to create a
sociotechnical system, necessary for creating a truly successful Lean organisation. The first
action for introducing LPD should aim to support all three perspectives, making the first
action multifaceted. It needs to support soft values (philosophy, mindset etc.) as well as
concrete actions (planning, steering etc.). The procedure most suitable for achieving this at
Semcon, is according to this study, by creating a more transparent organisation (7.3 Lean
Product Development – Tools and Technology perspective). It is thought to support the three
perspectives of LPD and provide a launching point for feature introductions of LPD
methodologies.
To enable a more transparent organisation, allowing new opportunities and improvements,
methodologies for creating a visual organisation are seen as a primary action for initiating
Lean transformation in Semcon’s organisation, see Figure 8-1. Effects of visual organisation.
Elementary methodologies behind successful LPD such as continuous improvement,
knowledge flow and standardisation are believed to be supported by visual aids. According to
Mann (2010), visual management connect processes and human activities, composing an
important factor in Lean. A more transparent organisation that supports questioning and
information exchange is generated, improving communication. Researchers claims that
visualisation tools such as visual planning leads to more efficient utilisation of resources,
fewer delays, improved participation, improved understanding, levelled out workload and
increased flexibility (Holmdahl, 2010). By working towards a more visual organisation,
Semcon’s vision to handle projects more efficient from a resource and time perspective, is
supported.

63
Figure 8-1. Effects of visual organisation.
By introducing visual communication tools, creating a more visual and transparent
organisation, different perspectives of LPD are believed to be supported (see Figure 8-1.
Effects of visual organisation.). It helps sharing values and knowledge as well as inviting for
possibilities to improve and standardise in the organisation. An action plan motivating an
introduction of visual communication tools is presented as a first step initiating Semcon’s
Lean transformation. By introducing an Obeya room, consisting of several visual
communication tools that support various aspects of LPD, the effects are to be significant. A
summary of the structure and effects of an Obeya room is presented in APPENDIX 2.1 A3
Obeya room.
8.1 Visual organisation, a first step introducing LPD
Ideas regarding the design of visual communication tools and how to introduce them have
been taken from Autoliv in Vårgårda and Saab EDS OEG in Gothenburg. The article Oobeya
– Next Generation of Fast in Product Development by Horikiri et al. (2008) has worked as a
guideline for creating the structure in the Obeya room. Several of the communication tools
used in the Obeya room were used during a workshop in the course Lean Product
Development arranged by Swerea IVF in Mölndal during the spring of 2012. In the workshop,
important insights and opinions were utilised from managers at Semcon’s department TDO,
as well as input from participants from Saab EDS who had experience from earlier
introductions of visual communication tools.
8.2 Justification for the action
Creating a visual organisation, by using an Obeya room, ought to be the most suitable action
for introducing LPD at Semcon’s department TDO. It derives from several different aspects
that together provide demonstrative arguments for the action.
A great interest exists among consultants for introducing visual communication tools
to enable a more transparent organisation.
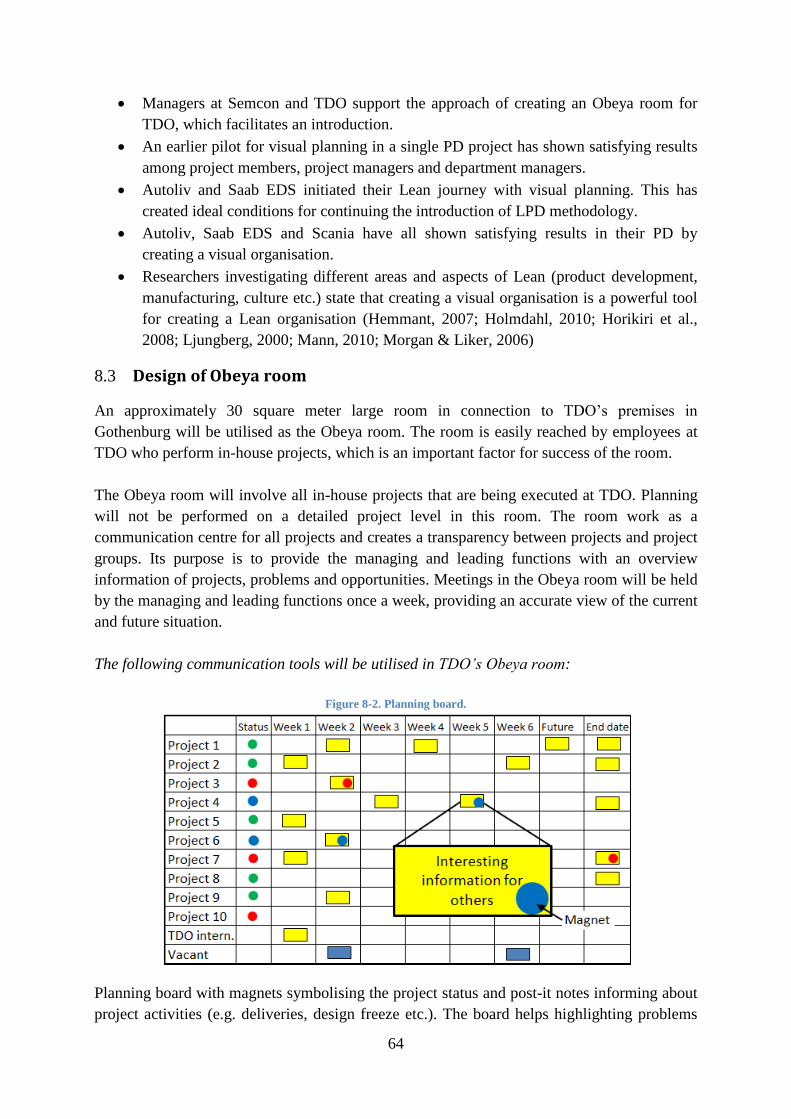
64
Managers at Semcon and TDO support the approach of creating an Obeya room for
TDO, which facilitates an introduction.
An earlier pilot for visual planning in a single PD project has shown satisfying results
among project members, project managers and department managers.
Autoliv and Saab EDS initiated their Lean journey with visual planning. This has
created ideal conditions for continuing the introduction of LPD methodology.
Autoliv, Saab EDS and Scania have all shown satisfying results in their PD by
creating a visual organisation.
Researchers investigating different areas and aspects of Lean (product development,
manufacturing, culture etc.) state that creating a visual organisation is a powerful tool
for creating a Lean organisation (Hemmant, 2007; Holmdahl, 2010; Horikiri et al.,
2008; Ljungberg, 2000; Mann, 2010; Morgan & Liker, 2006)
8.3 Design of Obeya room
An approximately 30 square meter large room in connection to TDO’s premises in
Gothenburg will be utilised as the Obeya room. The room is easily reached by employees at
TDO who perform in-house projects, which is an important factor for success of the room.
The Obeya room will involve all in-house projects that are being executed at TDO. Planning
will not be performed on a detailed project level in this room. The room work as a
communication centre for all projects and creates a transparency between projects and project
groups. Its purpose is to provide the managing and leading functions with an overview
information of projects, problems and opportunities. Meetings in the Obeya room will be held
by the managing and leading functions once a week, providing an accurate view of the current
and future situation.
The following communication tools will be utilised in TDO’s Obeya room:
Figure 8-2. Planning board.
Planning board with magnets symbolising the project status and post-it notes informing about
project activities (e.g. deliveries, design freeze etc.). The board helps highlighting problems
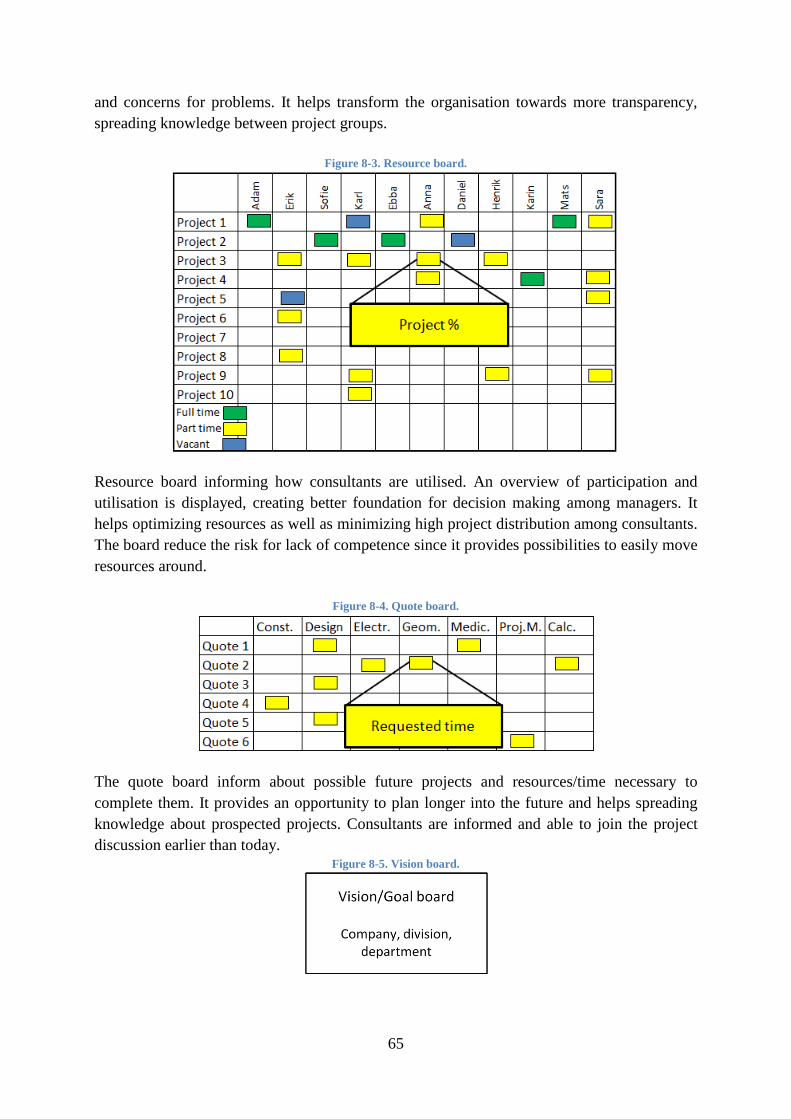
65
and concerns for problems. It helps transform the organisation towards more transparency,
spreading knowledge between project groups.
Figure 8-3. Resource board.
Resource board informing how consultants are utilised. An overview of participation and
utilisation is displayed, creating better foundation for decision making among managers. It
helps optimizing resources as well as minimizing high project distribution among consultants.
The board reduce the risk for lack of competence since it provides possibilities to easily move
resources around.
Figure 8-4. Quote board.
The quote board inform about possible future projects and resources/time necessary to
complete them. It provides an opportunity to plan longer into the future and helps spreading
knowledge about prospected projects. Consultants are informed and able to join the project
discussion earlier than today. Figure 8-5. Vision board.
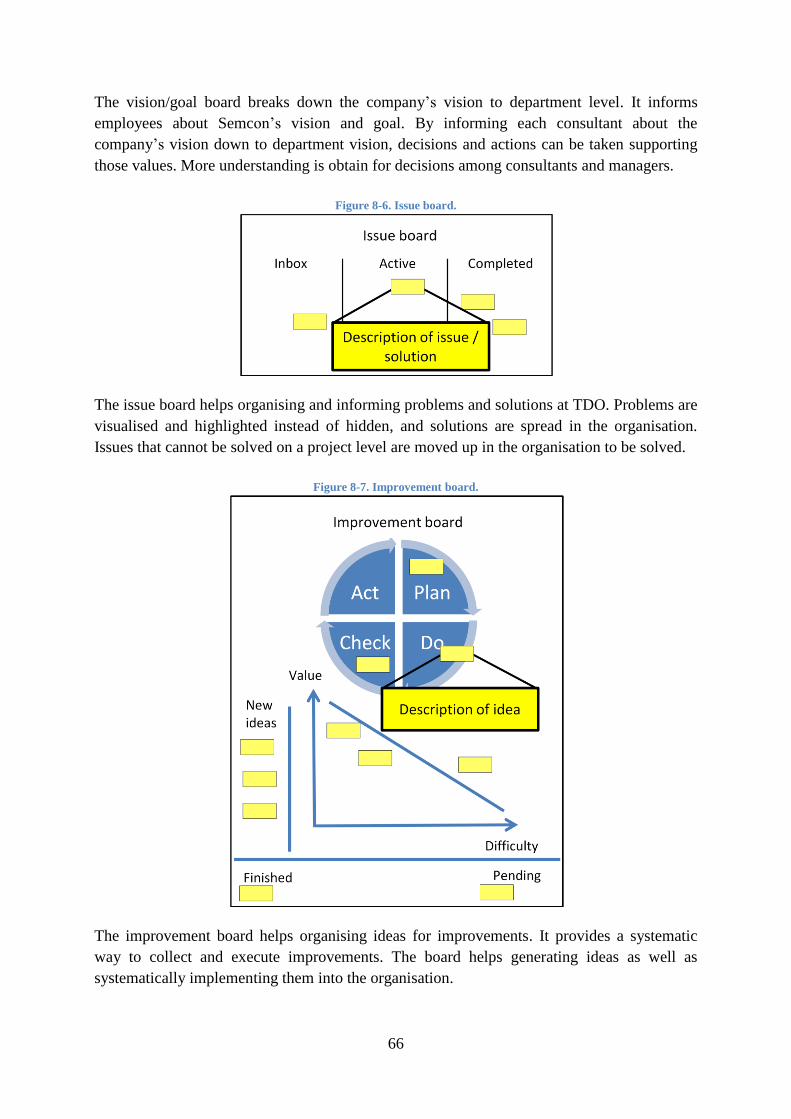
66
The vision/goal board breaks down the company’s vision to department level. It informs
employees about Semcon’s vision and goal. By informing each consultant about the
company’s vision down to department vision, decisions and actions can be taken supporting
those values. More understanding is obtain for decisions among consultants and managers.
Figure 8-6. Issue board.
The issue board helps organising and informing problems and solutions at TDO. Problems are
visualised and highlighted instead of hidden, and solutions are spread in the organisation.
Issues that cannot be solved on a project level are moved up in the organisation to be solved.
Figure 8-7. Improvement board.
The improvement board helps organising ideas for improvements. It provides a systematic
way to collect and execute improvements. The board helps generating ideas as well as
systematically implementing them into the organisation.
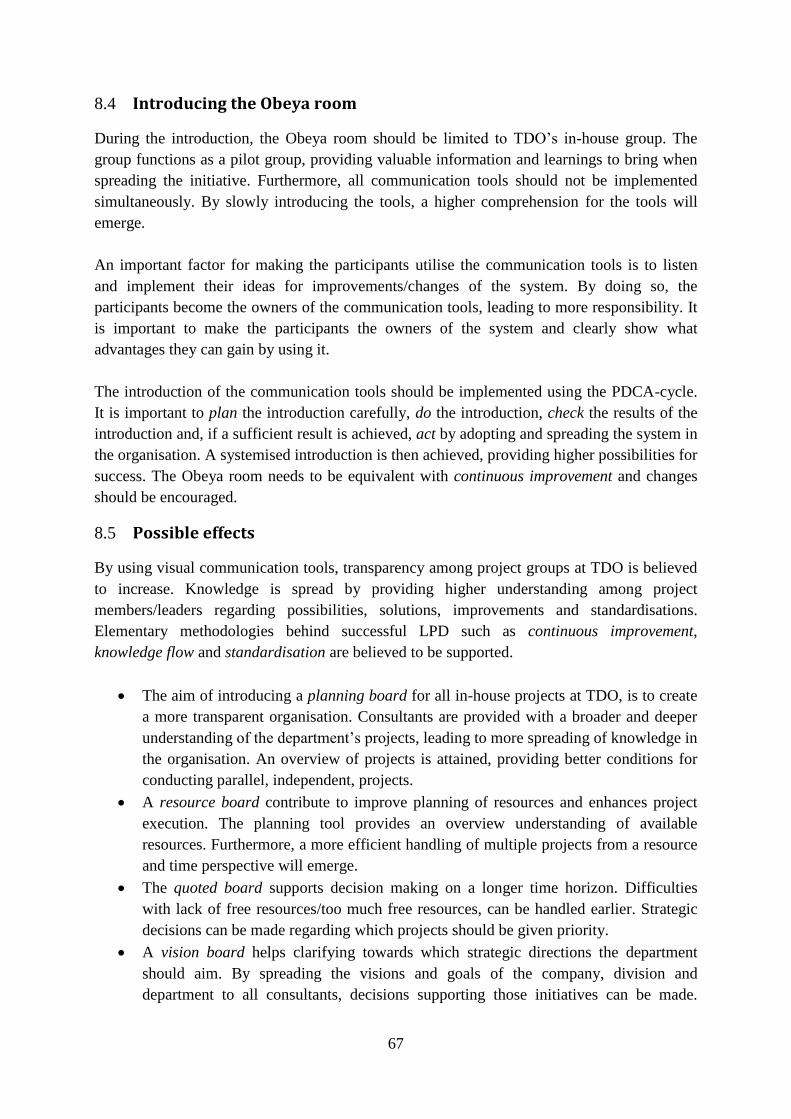
67
8.4 Introducing the Obeya room
During the introduction, the Obeya room should be limited to TDO’s in-house group. The
group functions as a pilot group, providing valuable information and learnings to bring when
spreading the initiative. Furthermore, all communication tools should not be implemented
simultaneously. By slowly introducing the tools, a higher comprehension for the tools will
emerge.
An important factor for making the participants utilise the communication tools is to listen
and implement their ideas for improvements/changes of the system. By doing so, the
participants become the owners of the communication tools, leading to more responsibility. It
is important to make the participants the owners of the system and clearly show what
advantages they can gain by using it.
The introduction of the communication tools should be implemented using the PDCA-cycle.
It is important to plan the introduction carefully, do the introduction, check the results of the
introduction and, if a sufficient result is achieved, act by adopting and spreading the system in
the organisation. A systemised introduction is then achieved, providing higher possibilities for
success. The Obeya room needs to be equivalent with continuous improvement and changes
should be encouraged.
8.5 Possible effects
By using visual communication tools, transparency among project groups at TDO is believed
to increase. Knowledge is spread by providing higher understanding among project
members/leaders regarding possibilities, solutions, improvements and standardisations.
Elementary methodologies behind successful LPD such as continuous improvement,
knowledge flow and standardisation are believed to be supported.
The aim of introducing a planning board for all in-house projects at TDO, is to create
a more transparent organisation. Consultants are provided with a broader and deeper
understanding of the department’s projects, leading to more spreading of knowledge in
the organisation. An overview of projects is attained, providing better conditions for
conducting parallel, independent, projects.
A resource board contribute to improve planning of resources and enhances project
execution. The planning tool provides an overview understanding of available
resources. Furthermore, a more efficient handling of multiple projects from a resource
and time perspective will emerge.
The quoted board supports decision making on a longer time horizon. Difficulties
with lack of free resources/too much free resources, can be handled earlier. Strategic
decisions can be made regarding which projects should be given priority.
A vision board helps clarifying towards which strategic directions the department
should aim. By spreading the visions and goals of the company, division and
department to all consultants, decisions supporting those initiatives can be made.

68
Visions and goals reach more consultants in the organisation and a deeper
understanding of the company is generated.
By introducing an issue and improvement board, the aim is to encourage continuous
improvement. By working with continuous improvement using a systemised and
supporting approach, large results are possible. It supports standardisations in the
organisation, providing a launching point for new possibilities. Using the employee’s
knowledge for improvements has a vital effect for creating a successful organisation.
When the Obeya room is introduced and up running at TDO, the aim is that it should work as
an example and motivator for other departments and divisions at Semcon. Organised guidance
of the Obeya room should be conducted for Semcon’s personnel. Confidential information in
the Obeya room must however be handled carefully.
69
9 CONCLUSIONS
Semcon is a global technology company active in the areas of engineering services and
product information. New challenges arise due to higher competition on today’s international
markets. Therefore reduction of costs, more efficient resource utilisation and decreased time
to market are becoming more vital criteria for success. The study aimed to investigate how
Semcon can improve its projects from a resource and time perspective based on Lean Product
Development (from a Human, Process and Tools and Technology perspective). Furthermore,
the study has investigated how LPD can be introduced at Semcon and during what
restrictions.
From various interviews and workshops with Semcon personnel, interviews and
investigations of benchmarking companies, and literatures reviews, the possibilities of LPD
have been analysed. The following conclusions are intended for product development projects
at Semcon, but can likely benefit additional organisations. The following conclusions have
been made.
9.1 Lean Product Development – Human perspective
The study has investigated the potentials of working with continuous improvement. The
methodology is one of Toyotas most valuable keywords and defines the company. It adds
value and constantly enhances the capability in the organisation. Continuous improvement
has, because of its capability to improve an organisation, become one of the most important
aspects in LPD. When some of Sweden’s leading engineering companies were investigated
(Autoliv, Saab EDS and Scania), their work with continuous improvement was a recurring
factor. By working with continuous improvement, some of the benchmarking companies
managed to execute several thousand improvements each year, which together generated great
success for the organisations. It is a methodology that all three benchmarking companies
actively is working with, and which has been highlighted as an important factor for their LPD
success. This study indicates that continuous improvement is a methodology providing high
potential for Semcon. Creating a built in learning system may be one of the most important
principles when introducing Lean to PD, and it has the ability to enhance Semcon’s processes
on both local and international basis. Semcon can with small actions organise a structured
method to encourage, process and spread improvements in the company. According to this
study, many improvements are not spread and standardised in the company and large potential
exist working with continuous improvements. Several of the most common waste in PD
(unused creativity, correction, processing, waiting etc.) could be reduced with the
methodology, allowing huge savings. Based on investigations of benchmarking companies, as
well as literature within the field, this study draws the conclusion that the continuous
improvement methodology has the potential to generate great outcome for Semcon.

70
9.2 Lean Product Development – Process perspective
The strategy of TDO is to generate high customer value early in PD processes. Focus is
directed towards the research and concept phases, enabling more possibilities later in the PD
process. This corresponds largely with the viewpoint of Set-based design, where front-loaded
PD is requested. Research indicates that the possibility to influence the success of a PD
project never is greater than in the start, creating potential to find the optimal solution
(Berglund & Westling, 2009; Morgan & Liker, 2006; Sobek II et al., 1999). Several concepts
should be investigated and the design space broadened. Depending on project at Semcon, and
depending on customer, the possibilities to increase the design space varies. However, the
view by Semcon consultants is that projects are executed more successful when a broader
design space is allowed, something that the customers do not always realise. With a broader
design space allowing more possibilities, the PD process as well as the final PD result, has the
potential to improve. Literature within the field claim that by working with this approach,
higher risks can be taken and more successful innovative heights can be reached (Sobek II et
al., 1999). This is a competitive advantage that Semcon could utilise. Convincing Semcon’s
customers of the potential of a broader design space and the possibilities of Set-based design,
is an important action. It encourages the customer to provide Semcon with a larger
responsibility, but also links Semcon closer to their customers. By convincing Semcon’s
customers to provide a larger design space for Semcon when conducting PD projects, not only
greater results in PD are generated, but also a stronger relationship between Semcon and its
customers is achieved.
In interviews, Autoliv, Saab EDS and Scania state that they have managed to combine LPD
with their stage-gate project models, similar to Semcon’s project model XLPM. Researches
claim that stage-gate models limit the potential for PD (interview with Bükk, Swerea IVF,
2012; Holmdahl, 2010), and when analysing XLPM and LPD, certain aspects have to be
taken into consideration. XLPM has clear tollgates determining when decisions should be
made, while LPD methodologies require a more dynamic approach. XLPM needs to be more
agile to fully be integrated with LPD. But in similarity with the benchmarking companies, this
study indicates that Semcon’s project model and the reality do not always correspond. In
reality, overlapping and a more dynamic approach are used, allowing more changes to be
made. The main difficulties in combining XLPM and LPD is seen to be early in projects,
since LPD is front-loaded demanding more resources in these stages. Compared to traditional
PD, TG 2 in XLPM should be postponed, and thereby generate more capacity for front-loaded
PD in the earlier phases. This is possible to accomplish, but requires that traditional PD are
avoided and the decisions delayed. This should be taken into consideration when trying to
combine the two principles. Conducting a try-out project, combining XLPM and LPD, is
recommended for Semcon to proceed with. XLPM includes the business and human
perspectives, which are thought to be well compatible with the Lean philosophy. The
principles are believed to complement each other rather than counteract, and resemble largely
with each other’s viewpoints. However, in what extent Semcon is working accordingly to
XLPM’s business and human perspectives is not investigated in this study.
71
9.3 Lean Product Development – Tools and Technology perspective
When investigating LPD methodologies among Autoliv, Saab EDS and Scania, visual tools
were a recurrent technique. It is an appropriate method to initiate Lean transformation in PD,
according to several of the benchmarking companies. For Semcon’s department TDO, visual
management is thought to be a good methodology for initiating its Lean journey. It creates a
transparent organisation, enabling more efficient utilisation of resources, fewer delays,
improved understanding and increased flexibility. It supports Semcon’s objective to improve
its project execution from a resource and time perspective. Introducing visual communication
tools for in-house projects at TDO, is recommended as a first step initiating LPD. It will work
as a pilot project from where learnings can be taken and later spread in the organisation. This
study includes an action plan regarding an introduction of an Obeya room at TDO, leading to
a more transparent organisation. The Obeya room support several of the essential LPD
methodologies (continuous improvement, knowledge flow and standardisation) and is a
launching point for introducing further LPD methodologies. The action plan in this report is
developed for TDO’s specific needs, but learnings can most likely be utilised in other
organisations.
Semcon is working towards several different branches with varying methods and regulations
for project execution. It increases the deviation in Semcon’s PD processes, making it difficult
to comprehend and execute successfully. To achieve a more efficient PD execution, as well as
improving the quality in PD, standardisations in Semcon’s processes need to be made.
Semcon’s new standardisations, entitled Delivery in this report, include checklists and
standardised work for specific branches and are thought to be of great importance. The new
standardisations might especially be important in the high regulated industries (medical
technology, offshore etc.). According to research within the field, standardisations in PD
enhance throughput time, precise execution, improve quality and reduce waste (see 2.3.3
Standardisations). Standardisations are therefore a strong supporter of Semcon’s vision to
improve projects from a resource and time perspective. It is recommended for Semcon to
proceed with more standardisations.
Introducing a methodology for Semcon to handle standardisations and continuous
improvement is thought to have a large potential for Semcon’s PD processes. The Plan-Do-
Check-Act cycle (successfully used by benchmarking companies and recommended in
literature), is a sufficient method describing a framework for improvements. Improvements
need to be encouraged, processed and standardised in the organisation, enabling more
possibilities. It generates an improved launching point for future actions and is recommended
for Semcon as an early LPD methodology to introduce.
Measuring the PD processes is according to researchers essential for being able to improve
the system (Womack & Jones, 1996). Even though researchers have different opinions about
the possibilities with Value Stream Mapping for PD, this study indicates that it is successfully
used by all three benchmarking companies. Semcon’s PD projects are more variable than the
benchmarking companies’ (more variable engineering services and more variable customers),
72
but a large potential exist with the tool when measuring its standardised PD activities. The
VSM methodology should be used to examine the processes in the same arrangement as
Scania does, focusing on repetitive work rather than the more variable and creative PD
activities. By applying the VSM methodology to Semcon’s PD processes, and analysing the
results, waste will be detected. First then, great possibilities to improve the processes exist.
9.4 General conclusions
A united viewpoint concerning the structure of LPD does not exist among researchers today.
LPD is not as well defined as Lean manufacturing, and clear procedures of the underlying
methodologies do not exist. Much research remains before discovering the true factors behind
successful PD and the effects of LPD. As the knowledge about LPD grows, the philosophy is
thought to grow within engineering companies that are looking to improve, and better face
new challenges.
Few studies have thoroughly investigated the real effects of initiating Lean to PD. The reason
is the high complexity in conducting such a research, involving a long time investigation
comparing before and after effects that might take decades. Several researchers and authors
within the field claim that by working with LPD, a more efficient PD can be gained including
results with higher quality (Holmdahl, 2010; Morgan & Liker, 2006; Womack et al., 1990).
But to truly clarify what elements in LPD create those effects and in what kind of PD, needs
to be further investigated. Before more studies are conducted, investigating before and after
results, few secure conclusions can be made. The area requires deeper investigations before
answering if LPD is more than only the top of an iceberg, with much more to come.

73
10 References
Articles
Adler, P.S., Mandelbaum, A., Nguyen, V., Schwerer, E., 1996. Getting the most out of your
product development process. Harvard Business Review, March-April, 1996, pp 4-15.
Clark, K.B., Chew, W.B., Fujimoto, T., 1987. Product Development in the World Auto Industry.
Brookings Papers on Economic Activity; 1987 Special Issue, Issue 3, p729, 53p.
Hemmant, R., 2007. Continuous Improvement Through Visual Systems. Circuits Assembly,
Oct2007, Vol. 18 Issue 10, p50-51, 2p.
Horikiri, T., Kieffer, D., Tanaka, T., 2008. Oobeya – Next Generation of Fast in Product
Retrieved Mars 28, 2012, from http://leansi.wp.mines-telecom.fr//files/2009
/11/Oobeya-article-2009.pdf
Letens, G., Farris, J.A., Van Aken, E.M., 2011. A Multilevel Framework for Lean Product
Development System Design. Engineering Management Journal, Mar2011, Vol. 23 Issue 1,
p69-85, 17p.
Liker, J.K., Hoseus, M., 2010. Human Resource development in Toyota culture. Int. J. Human
Resources Development and Management, 2010, Vol. 10, No. 1, pp. 34-50.
Liker, J.K., Morgan, J.M., 2006. The Toyota Way in Services: The Case of Lean Product
Development. The Academy of Management, Volume 20, Number 2 / May 2006, pp. 5-20.
Moen, R., Norman, C., 2006. Evolution of the PDCA Cycle. Retrieved Mars 22, 2012, from
http://pkpinc.com/files/NA01_Moen_Norman_fullpaper.pdf.
Sobek II, D.K., Ward, A.C., Liker, J.K., 1999. Toyota’s Principles of Set-Based Concurrent
Engineering. Sloan Management Review; Winter 1999; 40, 2; ABI/INFORM Global pg. 67.
Sugimori, Y., Kusunoki, K., Cho, F., Uchikawa, S., 1977. Toyota production system and kanban
system materialization of just-in-time and respect-for-human system. International Journal of
Production Research, Vol. 15 No. 6, pp. 553-564.
Wang, L., Ming, X.., Kong, F.., D, L., Wang, P.., 2012. Focus on implementation: a framework
for lean product development. Journal of Manufacturing Technology Management; 2012,
Vol. 23 Issue 1, p4-24, 21p.
Ward, A.C., Liker, J.K., Cristiano, J.J., Sobek II, D.K., 1995. The Second Toyota Paradox: How
Delaying Decisions Can Make Better Cars Faster. Sloan Management Review; Spring 1995;
36, 3; p43.
Womack, J., Jones, D., 1996. Beyond Toyota: how to root out waste and pursue perfection.
Harvard Business Review, Vol. 74 No. 5, pp. 140–158.

74
Books
Berglund, R., Westling, B., 2009. Lean i ledningen Utmana hela organisationen. Swerea IVF
AB, Mölndal.
Björklund, M., Paulsson, U., 2003. Seminarieboken -att skriva, presentera och opponera.
Studentlitteratur, Lund.
Gillham, B., 2000. Case Study Research Methods. Continuum International Publishing Group,
London.
Hill, A., Hill, T., 2009. Manufacturing Operations Strategy. Palgrave Macmillan, New York.
Hino, S., 2006. Inside the mind of Toyota: management principles for enduring growth.
Productivity Press, New York.
Holmdahl, L., 2010. Lean Product Development På Svenska, 1.5 ed. Lars Holmdahl,
Gothenburg.
Liker, J.K., Meier, D., 2006. The Toyota Way Fieldbook. McGraw-Hill, New York.
Ljungberg, Ö., 2000. TPM, Vägen till ständiga förbättringar. Studentlitteratur, Lund.
Mann, D., 2010. Creating a Lean Culture, Tools to Sustain Lean Conversions, 2nd ed.
Productivity Press, New York.
Maylor, H., 1999. Project management, 2nd ed. Financial Times Management, London.
Merriam, S.B., 2009. Qualitative research: a guide to design and implementation. John Wiley
and Sons, San Francisco.
Morgan, J.M., Liker, J.K., 2006. The Toyota Product Development System Integrating People,
Process, and Technology. Productivity Press, New York.
Ryen, A., 2004. Kvalititativ Intervju-från vetenskapsteori till fältstudier, 1st ed. Liber Ekonomi,
Malmö.
Semcon Project Management AB, 2010a. EXCELLENCE IN PROJECT MANAGEMENT -
XLPM Introduktion. Semcon Project Management AB Förlag, Gothenburg.
Semcon Project Management AB, 2010b. EXCELLENCE IN PROJECT MANAGEMENT -
XLPM Affärsperspektiv. Semcon Project Management AB Förlag, Gothenburg.
Semcon Project Management AB, 2010c. EXCELLENCE IN PROJECT MANAGEMENT -
XLPM Projekt. Semcon Project Management AB Förlag, Gothenburg.
Semcon Project Management AB, 2010d. EXCELLENCE IN PROJECT MANAGEMENT -
XLPM Mänskligt Perspektiv. Semcon Project Management AB Förlag, Gothenburg.
Shook, J., 2008. Managing to learn: using the A3 management process to solve problems, gain
agreement, mentor and lead. Lean Enterprise Institute, Cambridge.
75
Tonnquist, B., 2012. Projektledning, 3rd ed. Bonnier Utbildning, Stockholm.
Womack, J., Jones, D., Roos, D., 1990. The Machine That Changed The World. Free Press, New
York.
Womack, J.P., Jones, D.T., 1996. Lean Thinking, Banish waste and create wealth in your
corporation. Free Press, New York.
Documents
McManus, H.L., 2005. Product Development Value Stream Mapping (PDVSM) Manual. Lean
Aerospace Initiative Center for Technology, Policy, and Industrial Development
Massachusetts Institute of Technology.
IVF Industriforskning och utveckling AB., 2006. Resurseffektiv och robust produktutveckling
som skapar kundvärde, Lean Produktutveckling.
Interviews and Workshops
Semcon:
Consultant A, I., 2012. Semcon XLPM. Interview date: 18 January 2012
Consultant B., 2012. Semcon Exploratory study. Interview date: 5 Mars 2012
Manager A., 2012a. Semcon Exploratory study. Interview date: 19 January 2012
Manager A., 2012b. Semcon Visual Management. Interview date: 05 April 2012
Manager A., Manager B., 2012. Semcon Exploratory study. Interview date: 2 February 2012
Manager A., Project Manager D., 2012a. Semcon Workshop Visual Management. Interview
date: 7 Mars 2012
Manager A., Project Manager D., Manager B., Project Manager A., 2012. Semcon Visual
Management. 13 April 2012
Manager C., 2012. Semcon Exploratory study. Interview date: 8 February 2012
Project Manager A., 2012a. Semcon Exploratory study. 1 February 2012
Project Manager A., 2012b. Workshop VSM Air-cleaner project. 16 February 2012
Project Manager A., 2012c. Workshop VSM Air-cleaner project. Interview date: 3 May 2012
Project Manager B., 2012a. Semcon Exploratory study. Interview date: 18 January 2012
Project Manager B., 2012b. Semcon Introducing Visual Management. Interview date: 25 April
2012
Organisations and benchmarking companies:
Bükk, S., 2012. Swerea IVF. Interview date: 3 January 2012
Laas, A., Svantesson, A., 2012. Autoliv. Interview date: 26 April 2012
Lundström, R., 2012a. Saab Electronic Defence Systems. Interview date: 9 February 2012
Lundström, R., 2012b. Saab Electronic Defence Systems. Interview date: 11 April 2012
Palmér, P., 2012. Scania. Interview date: 8 Mars 2012
76
Presentations
Post, P.O., Toyota Production System. Toyota Material Handling, Mjölby, 8 October 2011.
Manager A., Semcon@TDO presentation för kunder.pptx. Semcon, Gothenburg, 19 January
2012.
Websites
Autoliv Inc - Who We Are - Fast Facts [WWW Document], 2012. . URL
http://www.autoliv.com/wps/wcm/connect/autoliv/Home/Who+We+Are/Fast%20Facts
Visited: 27 April 2012
Autoliv Sverige och Capio S:t Görans Sjukhus vinnare av Svenska Leanpriset, 2010. Lean
Forum Pressmeddelande 5 oktober 2010,
http://www.leanforum.se/LF_dokumentation10/Vinnare_Svenska_Leanpriset2010.pdf.
Visited: 27 April 2012
IVF - Swerea [WWW Document], 2012. . URL http://www.swerea.se/ivf/
Visited: 15 February 2012
Lean Forum: Vår uppgift, verksamhet och värderingar [WWW Document], 2012. . URL
http://www.leanforum.se/andamal.asp
Visited: 2 May 2012
Saab business area Electronic Defence Systems [WWW Document], 2012. . URL
http://www.saabgroup.com/en/About-Saab/Company-profile/Organisation/Electronic-
Defence-Systems/
Visited: 12 Mars 2012
Scania Production System - Scania [WWW Document], 2012. . URL http://se.scania.com/scania-
group/philosophy/scania-production-system/
Visited: 9 Mars 2012
Scania Retail System - Scania [WWW Document], 2012. . URL http://se.scania.com/scania-
group/philosophy/scania-retail-system/
Visited: 9 Mars 2012
Scaniakoncernen - scania.se [WWW Document], 2012. . URL http://www.scania.se/om-
scania/scaniakoncernen/
Visited: 9 Mars 2012
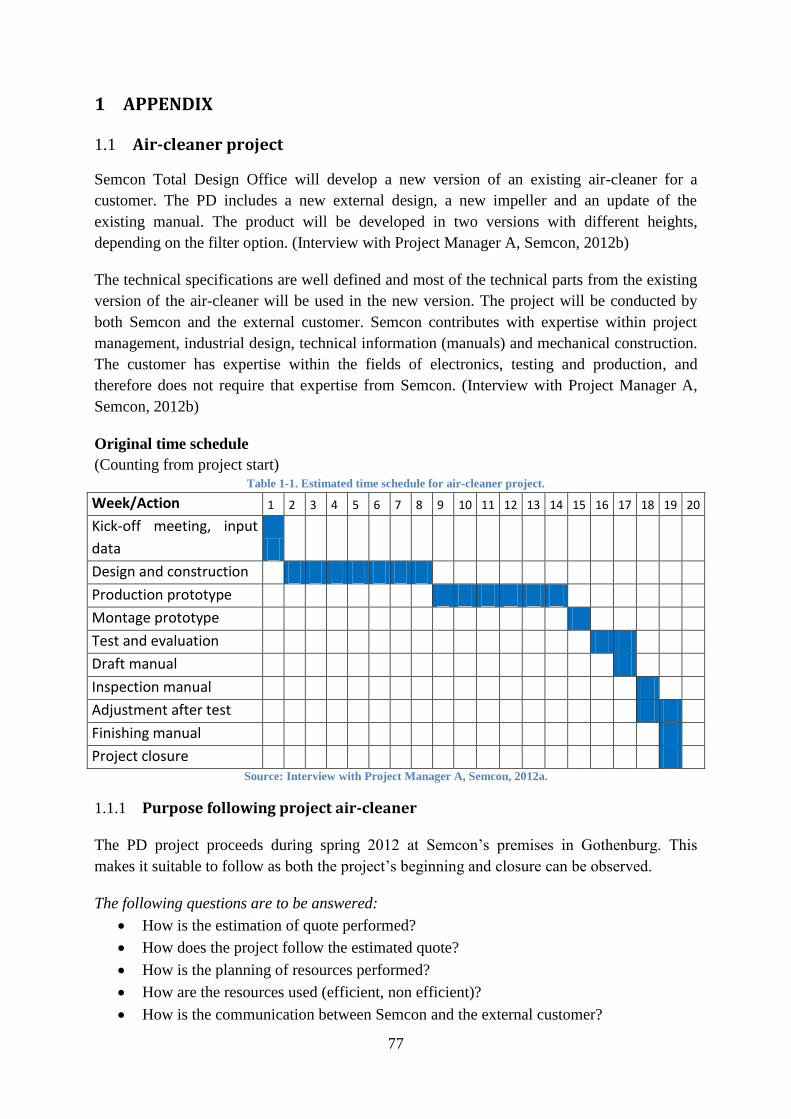
77
1 APPENDIX
1.1 Air-cleaner project
Semcon Total Design Office will develop a new version of an existing air-cleaner for a
customer. The PD includes a new external design, a new impeller and an update of the
existing manual. The product will be developed in two versions with different heights,
depending on the filter option. (Interview with Project Manager A, Semcon, 2012b)
The technical specifications are well defined and most of the technical parts from the existing
version of the air-cleaner will be used in the new version. The project will be conducted by
both Semcon and the external customer. Semcon contributes with expertise within project
management, industrial design, technical information (manuals) and mechanical construction.
The customer has expertise within the fields of electronics, testing and production, and
therefore does not require that expertise from Semcon. (Interview with Project Manager A,
Semcon, 2012b)
Original time schedule
(Counting from project start) Table 1-1. Estimated time schedule for air-cleaner project.
Week/Action 1 2 3 4 5 6 7 8 9 10 11 12 13 14 15 16 17 18 19 20
Kick-off meeting, input
data
Design and construction
Production prototype
Montage prototype
Test and evaluation
Draft manual
Inspection manual
Adjustment after test
Finishing manual
Project closure Source: Interview with Project Manager A, Semcon, 2012a.
1.1.1 Purpose following project air-cleaner
The PD project proceeds during spring 2012 at Semcon’s premises in Gothenburg. This
makes it suitable to follow as both the project’s beginning and closure can be observed.
The following questions are to be answered:
How is the estimation of quote performed?
How does the project follow the estimated quote?
How is the planning of resources performed?
How are the resources used (efficient, non efficient)?
How is the communication between Semcon and the external customer?
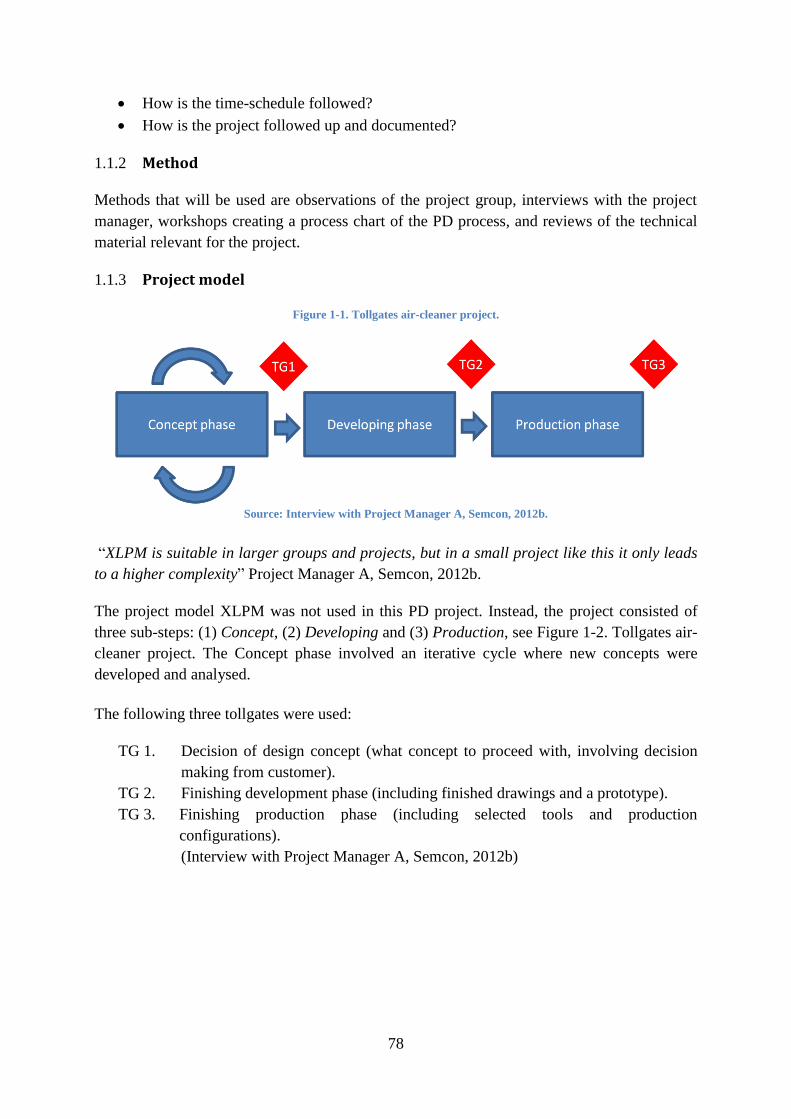
78
How is the time-schedule followed?
How is the project followed up and documented?
1.1.2 Method
Methods that will be used are observations of the project group, interviews with the project
manager, workshops creating a process chart of the PD process, and reviews of the technical
material relevant for the project.
1.1.3 Project model
Figure 1-1. Tollgates air-cleaner project.
Source: Interview with Project Manager A, Semcon, 2012b.
“XLPM is suitable in larger groups and projects, but in a small project like this it only leads
to a higher complexity” Project Manager A, Semcon, 2012b.
The project model XLPM was not used in this PD project. Instead, the project consisted of
three sub-steps: (1) Concept, (2) Developing and (3) Production, see Figure 1-2. Tollgates air-
cleaner project. The Concept phase involved an iterative cycle where new concepts were
developed and analysed.
The following three tollgates were used:
TG 1. Decision of design concept (what concept to proceed with, involving decision
making from customer).
TG 2. Finishing development phase (including finished drawings and a prototype).
TG 3. Finishing production phase (including selected tools and production
configurations).
(Interview with Project Manager A, Semcon, 2012b)
79
1.1.4 Concept phase
Semcon in Stockholm was given the original design task from the customer to develop a new
version of the air-cleaner. However, the customer was not satisfied with the design solutions
that were presented and the task was forwarded to Semcon’s department TDO in Gothenburg.
A basic design draft was developed by a designer at TDO and the concept was accepted by
the customer. The customer requested further development of the product. (Interview with
Project Manager A, Semcon, 2012b)
After a first meeting with the customer, when information about technical data, delimitations,
tools, material etc. was collected, a first brainstorming meeting was conducted at Semcon. In
the brainstorming meeting the designer, constructor and project leader were participating.
From the basic design solution three concepts and two sub-concepts were developed for
further progress. (Interview with Project Manager A, Semcon, 2012c) A meeting was set with
the customer to determine what concept to proceed with to detailed engineering. However, the
customer postponed the meeting with 10 days. The project group could then either stop the
project execution during this period and wait for the customer to make a decision, or proceed
with the concept that was most likely to be accepted by the customer. Semcon chose the
second alternative and proceeded with detailed engineering. However, when Semcon and the
customer finally had a concept meeting the customer added new, essential, technical
information to the project. This forced Semcon to develop a new concept based on the new
information. All the detailed engineering that was performed from the concept therefore
needed to be redone, and weeks of detailed development work were lost. A meeting was now
conducted between Semcon and the subcontractors (assigned to produce the necessary parts
for the air-cleaner). After this meeting and when technical information from the
subcontractors was analysed, the project could proceed to the next phase, the development
phase. (Interview with Project Manager A, Semcon, 2012d)
1.1.5 Development phase
In the development phase, detailed engineering of the air-cleaner is performed. Drawings are
made for the product. A discussion was held between Semcon and the subcontractors that
were to produce the parts for the air-cleaner. Input about production techniques etc. was
utilised from the subcontractors to enable uncomplicated production and a more acceptable
result of the final product. A prototype of certain parts of the air-cleaner was to be developed
by one of the subcontractors. The prototype was to be tested in order to reduce the risk of
problems later in the PD process. However, the prototype was three weeks delayed and
therefore did not fully fulfil its purpose to reduce risks in the later stages of the PD. (Interview
with Project Manager A, Semcon, 2012d)
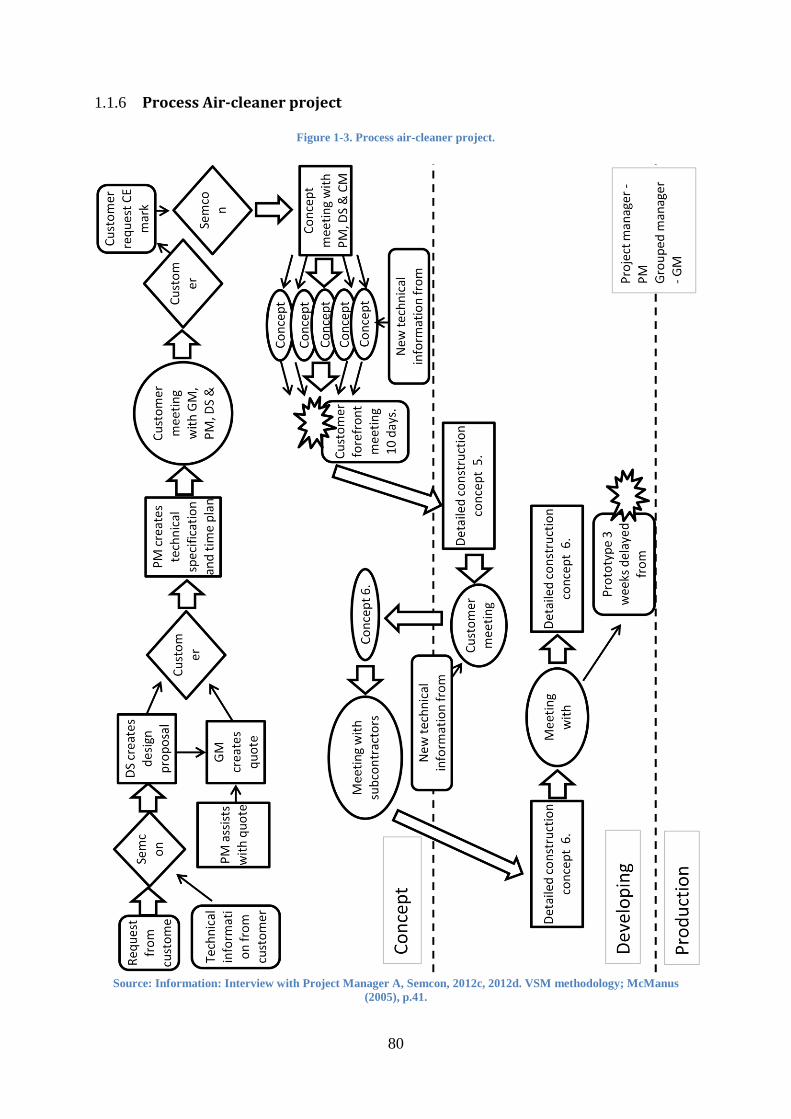
80
1.1.6 Process Air-cleaner project
Figure 1-3. Process air-cleaner project.
Source: Information: Interview with Project Manager A, Semcon, 2012c, 2012d. VSM methodology; McManus
(2005), p.41.

81
1.1.7 Results
Due to late technical information that was essential for the PD project, and due to the new
requests made by the customer regarding further assignments in the project, the PD project
was not completed in time. At the time of writing, three different time plans have been
completed during the project and in the last time plan the project exceed the original time plan
with approximately 100 percent. The costs for the customer increased drastically, but this is
mainly because of extra PD assignments that Semcon has been requested to perform.
Unfortunately, the final result of the PD project cannot be observed and documented in this
research since this Master’s thesis is completed before the PD project ends. Only the two first
phases of the project (Concept and Developing phases) could be observed, while the
Production phase remains unexamined.

82
2 APPENDIX
2.1 A3 Obeya room

83
Obeya room
Background
Semcon’s division Total Design Office (TDO) focus on improving its project execution and
utilization of resources in product development projects. TDO wish to spread knowledge among its
personnel and improve the project planning.
Current situation (Problem background)
Limited transparency among different project groups
o Knowledge
o Assignments
o Possibilities
Difficulties in planning resources
o Short term
o Long term
No methodical approach for improvements
o Organization of ideas for improvement
o Realization of ideas for improvement
Limited knowledge about company vision/goal
o Company, department, division
Proposal
An Obeya room consisting of visual managing tools, located at the division TDO. Information is to be
visualised by using Whiteboards, Post-it notes and Projector. Pulse-meetings for the Operative,
Managing and Leading functions ones a week in the Obeya room, to provide an accurate view of the
current situation.
Whiteboard suggestions:
Analysis
By using Visual Managing tools, transparency among different project groups at TDO is believed to
increase. Knowledge is spread by providing better understanding among project members/leaders
regarding possibilities, improvements and company vision/goals.
Visual Planning boards contribute to improve planning of resources at TDO and enhance project
execution. It results in clearer responsibilities and directives, and helps providing a more efficient
utilization of resources.
Unresolved issues
How can it be guaranteed that the Obeya room is being used?
How will confidential information be handled in the Obeya room?
How will the information be documented?
Implementation schedule
Build Obeya room with visual managing tools
(Whiteboards, Post-it notes and Projector).
Start introduction of the Obeya room and pulse meetings with
project groups.
Follow up results. Does it work? If not, redo Obeya room/structure
of pulse meetings and reintroduce.
Initiate Obeya room and pulse meetings for all project
groups at TDO.
Follow up results. If successful, spread the ideas to the rest of the
organization.
Continuous improvement.
Plan
Do Check
Act
Semcon: Lean Product Development, Obeya room By: Semcon, David Klamer Date: 26 May 2012
Accepted: Date:

84
3 APPENDIX
3.1 Interview guide benchmarking companies
The same interview guide has been used for all three benchmarking companies. Since the
interviews have been semi-structured, the questions might not have been formulated or
approached in the order they are listed. The questions have been used more as a guide than a
precise course of action.
Background
1. When did your company start working with LPD?
2. Why did your company start working with LPD?
3. What area is your LPD transformation focusing on?
a. Human perspective.
b. Process perspective.
c. Tools and Technology perspective.
LPD methodologies
4. What LPD methodologies are used?
a. Why are these methodologies used?
b. What was the problem cause?
c. What was the purpose by introducing these LPD methodologies?
5. Did you have a priority list when introducing new LPD methodologies?
d. What did you start with?
e. Why did you start with it?
Project management
6. Did you have a project model before starting to work with LPD?
7. If yes on question 6, are you using the same project model today as before?
8. If yes on question 7, did you have difficulties in combining LPD with your project
model?
9. If yes on question 8, what difficulties have emerged combining LPD with your project
model?
10. If yes on question 8, how did you solve the problems?
11. Are you working with an overlap in your projects or fixed tollgates?
12. Does LPD work on varying projects?
Management system
13. Does it work combining LPD with your management system?
14. Do changes have to be made in order to combine them?
Introducing LPD
15. How have you worked to introduce LPD?
16. Why has the introduction been formed like this?
17. What difficulties have you experienced during your LPD introduction?
18. How did you solve these difficulties?
19. What results have you achieved from LPD?
20. How have you measured the effects of LPD?
21. Did the LPD initiative come from the steering, managing or operative level?