introducing a very large dataset of handwritten farsi
TRANSCRIPT
www.elsevier.com/locate/patrec
Pattern Recognition Letters 28 (2007) 1133–1141
Introducing a very large dataset of handwritten Farsi digitsand a study on their varieties
Hossein Khosravi a,b,*, Ehsanollah Kabir a
a Department of Electrical Engineering, Tarbiat Modarres University, Tehran, Iranb Research and Development Unit, HODA System Co., Tehran, Iran
Received 5 September 2005; received in revised form 24 September 2006Available online 21 February 2007
Communicated by A. M. Alimi
Abstract
A very large dataset of handwritten Farsi digits is introduced. Binary images of 102,352 digits were extracted from about 12,000 reg-istration forms of two types, filled by B.Sc. and senior high school students. These forms were scanned at 200 dpi with a high speed scan-ner. A method for finding variety of handwritten digits in a typical dataset is proposed. Based on this method, training and test subsetsare provided to facilitate sharing of results among researchers as well as performance comparison.� 2007 Elsevier B.V. All rights reserved.
Keywords: Farsi digits; Persian; Arabic; Handwriting; Dataset; Digit variety
1. Introduction
Recognition of handwritten characters is one of themost interesting topics in pattern recognition domain. InOCR applications, handwritten character recognition,especially digit recognition, is dealt with in postal mail sort-ing, bank check processing, form data entry, etc. In recentdecades many researchers worked on this topic (for exam-ple see (Liu, 2003; Mayraz and Hinton, 2002; Oliveira,2002; Trier et al., 1996)). During these years standard data-sets were developed to help researchers sharing their resultson the same dataset and comparing performance of theirclassifiers.
For some scripts such as English, there are standarddatasets available that we will review some of them in thenext section, but in the case of Farsi script there exists nofreely or commercially available large dataset.
0167-8655/$ - see front matter � 2007 Elsevier B.V. All rights reserved.
doi:10.1016/j.patrec.2006.12.022
* Corresponding author. Address: Department of Electrical Engineer-ing, Tarbiat Modarres University, Tehran, Iran. Fax: +98 21 8800 5040.
E-mail addresses: [email protected], [email protected] (H. Khosravi), [email protected] (E. Kabir).
The rest of this paper is organized as follows. In Section2, we review some existing English datasets. Section 3describes the background of this work and the procedureof data collection. In Section 4, a method for finding vari-ety of samples in the dataset is described. In Section 5, weuse the result of this method to divide the dataset intotraining and test sets. Conclusion follows in Section 6and finally in Appendix A, we describe the dataset format.
2. Handwritten digit datasets
There are several datasets of digits and letters in English.We review those commonly used by researchers.
The CENPARMI1 digit dataset (Suen, 1992) is availablefrom CENPARMI, Concordia University. It contains 6000digits collected from the envelop images of USPS2, scannedat 166 dpi. In this dataset 4000 images, 400 samples perclass, are specified for training and the remaining 2000images for test.
1 Center for Pattern Recognition and Machine Intelligence.2 United States Postal Service.
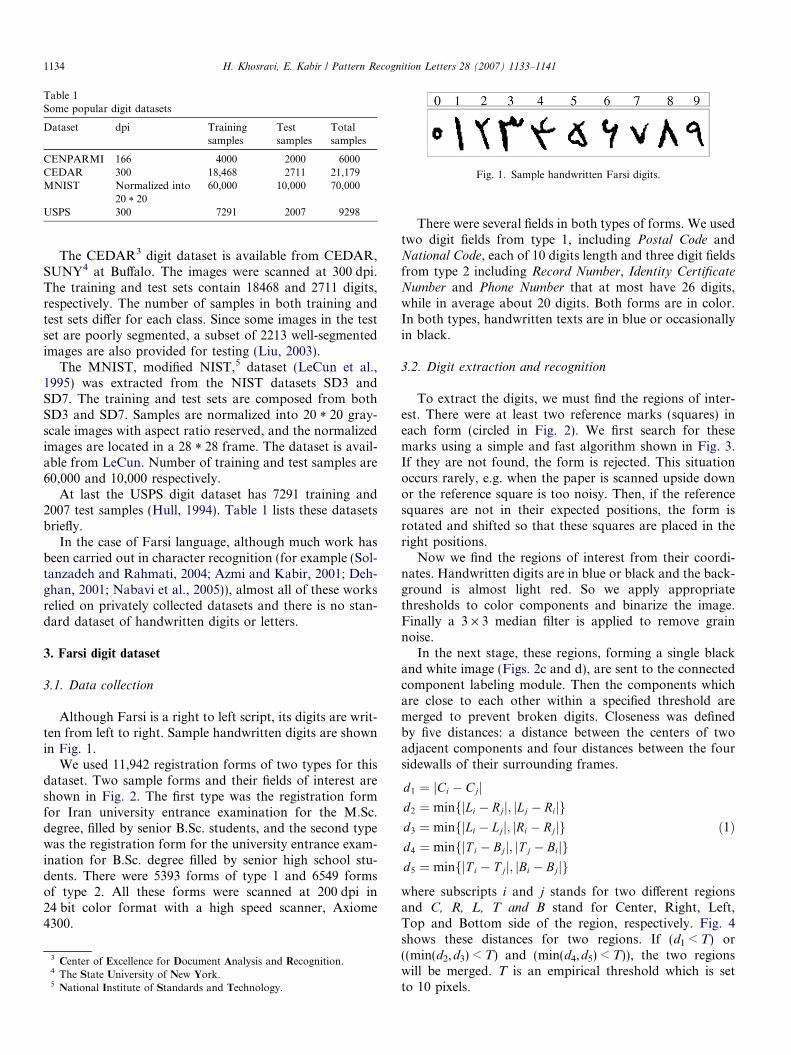
Table 1Some popular digit datasets
Dataset dpi Trainingsamples
Testsamples
Totalsamples
CENPARMI 166 4000 2000 6000CEDAR 300 18,468 2711 21,179MNIST Normalized into
20 * 2060,000 10,000 70,000
USPS 300 7291 2007 9298
Fig. 1. Sample handwritten Farsi digits.
1134 H. Khosravi, E. Kabir / Pattern Recognition Letters 28 (2007) 1133–1141
The CEDAR3 digit dataset is available from CEDAR,SUNY4 at Buffalo. The images were scanned at 300 dpi.The training and test sets contain 18468 and 2711 digits,respectively. The number of samples in both training andtest sets differ for each class. Since some images in the testset are poorly segmented, a subset of 2213 well-segmentedimages are also provided for testing (Liu, 2003).
The MNIST, modified NIST,5 dataset (LeCun et al.,1995) was extracted from the NIST datasets SD3 andSD7. The training and test sets are composed from bothSD3 and SD7. Samples are normalized into 20 * 20 gray-scale images with aspect ratio reserved, and the normalizedimages are located in a 28 * 28 frame. The dataset is avail-able from LeCun. Number of training and test samples are60,000 and 10,000 respectively.
At last the USPS digit dataset has 7291 training and2007 test samples (Hull, 1994). Table 1 lists these datasetsbriefly.
In the case of Farsi language, although much work hasbeen carried out in character recognition (for example (Sol-tanzadeh and Rahmati, 2004; Azmi and Kabir, 2001; Deh-ghan, 2001; Nabavi et al., 2005)), almost all of these worksrelied on privately collected datasets and there is no stan-dard dataset of handwritten digits or letters.
3. Farsi digit dataset
3.1. Data collection
Although Farsi is a right to left script, its digits are writ-ten from left to right. Sample handwritten digits are shownin Fig. 1.
We used 11,942 registration forms of two types for thisdataset. Two sample forms and their fields of interest areshown in Fig. 2. The first type was the registration formfor Iran university entrance examination for the M.Sc.degree, filled by senior B.Sc. students, and the second typewas the registration form for the university entrance exam-ination for B.Sc. degree filled by senior high school stu-dents. There were 5393 forms of type 1 and 6549 formsof type 2. All these forms were scanned at 200 dpi in24 bit color format with a high speed scanner, Axiome4300.
3 Center of Excellence for Document Analysis and Recognition.4 The State University of New York.5 National Institute of Standards and Technology.
There were several fields in both types of forms. We usedtwo digit fields from type 1, including Postal Code andNational Code, each of 10 digits length and three digit fieldsfrom type 2 including Record Number, Identity Certificate
Number and Phone Number that at most have 26 digits,while in average about 20 digits. Both forms are in color.In both types, handwritten texts are in blue or occasionallyin black.
3.2. Digit extraction and recognition
To extract the digits, we must find the regions of inter-est. There were at least two reference marks (squares) ineach form (circled in Fig. 2). We first search for thesemarks using a simple and fast algorithm shown in Fig. 3.If they are not found, the form is rejected. This situationoccurs rarely, e.g. when the paper is scanned upside downor the reference square is too noisy. Then, if the referencesquares are not in their expected positions, the form isrotated and shifted so that these squares are placed in theright positions.
Now we find the regions of interest from their coordi-nates. Handwritten digits are in blue or black and the back-ground is almost light red. So we apply appropriatethresholds to color components and binarize the image.Finally a 3 · 3 median filter is applied to remove grainnoise.
In the next stage, these regions, forming a single blackand white image (Figs. 2c and d), are sent to the connectedcomponent labeling module. Then the components whichare close to each other within a specified threshold aremerged to prevent broken digits. Closeness was definedby five distances: a distance between the centers of twoadjacent components and four distances between the foursidewalls of their surrounding frames.
d1 ¼ jCi � Cjjd2 ¼ minfjLi � Rjj; jLj � Rijgd3 ¼ minfjLi � Ljj; jRi � Rjjgd4 ¼ minfjT i � Bjj; jT j � Bijgd5 ¼ minfjT i � T jj; jBi � Bjjg
ð1Þ
where subscripts i and j stands for two different regionsand C, R, L, T and B stand for Center, Right, Left,Top and Bottom side of the region, respectively. Fig. 4shows these distances for two regions. If (d1 < T) or((min(d2,d3) < T) and (min(d4,d5) < T)), the two regionswill be merged. T is an empirical threshold which is setto 10 pixels.

Fig. 2. Sample form images. (a) Type 1. (b) Type 2. (c) and (d) Binary images extracted from fields of interest.
R1
d1
d3
d4
H. Khosravi, E. Kabir / Pattern Recognition Letters 28 (2007) 1133–1141 1135
An example of a digit, broken to three parts due tobinarization, that is merged by these distance rules isshown in Fig. 5. In this figure, regions 1 and 2 satisfy bothconditions, so they are merged. Also regions 2 and 3 satisfythe second condition and are merged.
• Select a search area, about 20 times of the reference mark (square), around its expected position.
• Perform binarization using simple thresholding. • Remove noise (dot noise and lines). This is done by
horizontal and vertical cumulative projection and removing the objects that their width or height is less than a threshold.
• Move a sliding window larger than the reference square, assuming that the target square is located in the center of this window, and compute the following value:DIF = number of black pixels inside the target square
– number of black pixels outside the target square• If DIF is less than a threshold (0.4 of reference square
area), reject the form, else select the window with the largest DIF.
Reference square Matched sliding window
Search area Sliding window
Fig. 3. Procedure of searching for a reference square.
R2
d2
d5
Fig. 4. Distances between two regions R1 and R2.
Fig. 5. A broken digit of 3 parts that is merged by the distance rules.
The extracted digits were passed to a recognition engineto be labeled and stored. The recognition engine was a mul-tiple classifier system consisting of four MLP classifiers cre-ated based on AdaBoost.M2 algorithm (Freund and

Find regions of interest
Performbinarization
Perform component labeling and locate
each digit
Remove grain noise
Recognize digitsand store them
Fig. 6. Process diagram of extracting the digits from registration formsand recognizing them.
1136 H. Khosravi, E. Kabir / Pattern Recognition Letters 28 (2007) 1133–1141
Schapire, 1996). These classifiers were trained with a pri-vate dataset of digits containing 15,000 training and 5000test samples. We used a modified gradient technique forfeature extraction (Trier et al., 1996). The recognition ratewas 100% on the training set and 98.8% on the test set. Theprocess diagram for dataset collection is shown in Fig. 6.
3.3. Manual refinement
After processing all forms, we had 94,530 digits fromtype 1 and 128,203 digits from type 2. We randomly took60,000 digits from each form. Then we corrected the errorsmanually. This process was done using a verification pro-gram that shows the digits of same class on the screen sothat the user can simply spot the errors and correct themusing keyboard (Fig. 7). The process took about 16 man-hours. The digits with very poor quality, not recognizableby human, and noise objects were removed (see Fig. 8).
After manual refinement stage, we had 102,352 digits ofreasonable quality with correct labels. Some samples of dif-
Fig. 7. Screen designed fo
ferent qualities are shown in Fig. 9. Number of digits ineach class is listed in Table 2.
In Section 4 we will describe a method for finding differ-ent variety of samples in the dataset.
4. Finding variety of digits in each class
There are some previous works in the field of style rec-ognition (e.g. Franke and Oberlander, 1993; Crettez,1995; Ma and Doermann, 2004; Tanprasert and Tang,1999), mainly in word or paragraph level. Franke andOberlander (1993) proposes a method to find whether ascript is handwritten or machine printed. Crettez (1995)and Ma and Doermann (2004) propose two methods thatdistinguish between different handwriting styles in wordlevel. In (Tanprasert and Tang, 1999) a method for findingdifferent font styles, regular, bold and italic, in a Thaiprinted script is proposed.
In (Suen et al., 1977) a quantitative measure, dispersionfactor, was proposed for the quality of handprinted charac-ters. This measure was based on the frequency diagram. In(Downton et al., 1988), the idea of frequency diagram wasused to define a similarity factor for character recognition.In this paper, we use a modified version of frequency dia-gram and propose a similarity factor to find the varietyof the digits in our dataset (Fig. 10). This helps us in divid-ing the dataset into training and test sets.
4.1. The modified frequency diagram
The frequency diagram depicts the density of the blackpixels of the samples. The lower the frequency is, thegreater the samples differ from one another (Suen et al.,1977). To compute frequency diagram, we normalized the
r manual refinement.
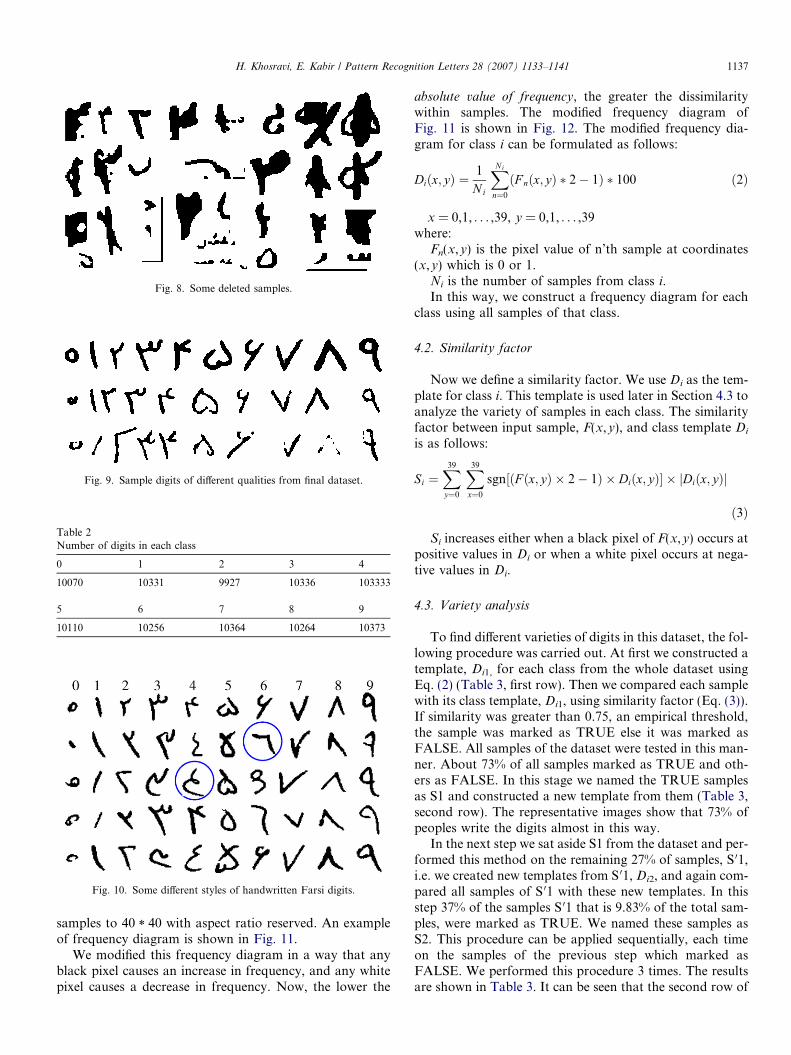
Fig. 8. Some deleted samples.
Table 2Number of digits in each class
0 1 2 3 4
10070 10331 9927 10336 103333
5 6 7 8 9
10110 10256 10364 10264 10373
Fig. 10. Some different styles of handwritten Farsi digits.
Fig. 9. Sample digits of different qualities from final dataset.
H. Khosravi, E. Kabir / Pattern Recognition Letters 28 (2007) 1133–1141 1137
samples to 40 * 40 with aspect ratio reserved. An exampleof frequency diagram is shown in Fig. 11.
We modified this frequency diagram in a way that anyblack pixel causes an increase in frequency, and any whitepixel causes a decrease in frequency. Now, the lower the
absolute value of frequency, the greater the dissimilaritywithin samples. The modified frequency diagram ofFig. 11 is shown in Fig. 12. The modified frequency dia-gram for class i can be formulated as follows:
Diðx; yÞ ¼1
N i
XNi
n¼0
ðF nðx; yÞ � 2� 1Þ � 100 ð2Þ
x = 0,1, . . . ,39, y = 0,1, . . . ,39where:
Fn(x,y) is the pixel value of n’th sample at coordinates(x,y) which is 0 or 1.
Ni is the number of samples from class i.In this way, we construct a frequency diagram for each
class using all samples of that class.
4.2. Similarity factor
Now we define a similarity factor. We use Di as the tem-plate for class i. This template is used later in Section 4.3 toanalyze the variety of samples in each class. The similarityfactor between input sample, F(x,y), and class template Di
is as follows:
Si ¼X39
y¼0
X39
x¼0
sgn½ðF ðx; yÞ � 2� 1Þ � Diðx; yÞ� � Diðx; yÞj j
ð3Þ
Si increases either when a black pixel of F(x,y) occurs atpositive values in Di or when a white pixel occurs at nega-tive values in Di.
4.3. Variety analysis
To find different varieties of digits in this dataset, the fol-lowing procedure was carried out. At first we constructed atemplate, Di1, for each class from the whole dataset usingEq. (2) (Table 3, first row). Then we compared each samplewith its class template, Di1, using similarity factor (Eq. (3)).If similarity was greater than 0.75, an empirical threshold,the sample was marked as TRUE else it was marked asFALSE. All samples of the dataset were tested in this man-ner. About 73% of all samples marked as TRUE and oth-ers as FALSE. In this stage we named the TRUE samplesas S1 and constructed a new template from them (Table 3,second row). The representative images show that 73% ofpeoples write the digits almost in this way.
In the next step we sat aside S1 from the dataset and per-formed this method on the remaining 27% of samples, S 01,i.e. we created new templates from S 01, Di2, and again com-pared all samples of S 01 with these new templates. In thisstep 37% of the samples S 01 that is 9.83% of the total sam-ples, were marked as TRUE. We named these samples asS2. This procedure can be applied sequentially, each timeon the samples of the previous step which marked asFALSE. We performed this procedure 3 times. The resultsare shown in Table 3. It can be seen that the second row of
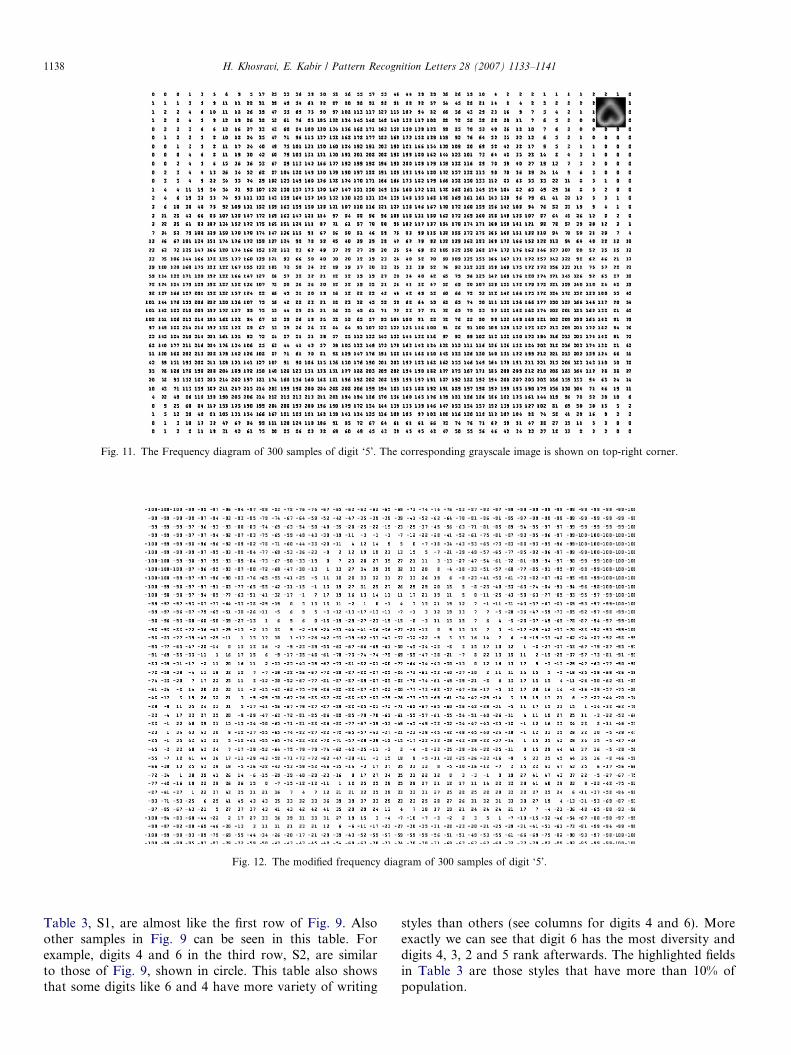
Fig. 12. The modified frequency diagram of 300 samples of digit ‘5’.
Fig. 11. The Frequency diagram of 300 samples of digit ‘5’. The corresponding grayscale image is shown on top-right corner.
1138 H. Khosravi, E. Kabir / Pattern Recognition Letters 28 (2007) 1133–1141
Table 3, S1, are almost like the first row of Fig. 9. Alsoother samples in Fig. 9 can be seen in this table. Forexample, digits 4 and 6 in the third row, S2, are similarto those of Fig. 9, shown in circle. This table also showsthat some digits like 6 and 4 have more variety of writing
styles than others (see columns for digits 4 and 6). Moreexactly we can see that digit 6 has the most diversity anddigits 4, 3, 2 and 5 rank afterwards. The highlighted fieldsin Table 3 are those styles that have more than 10% ofpopulation.
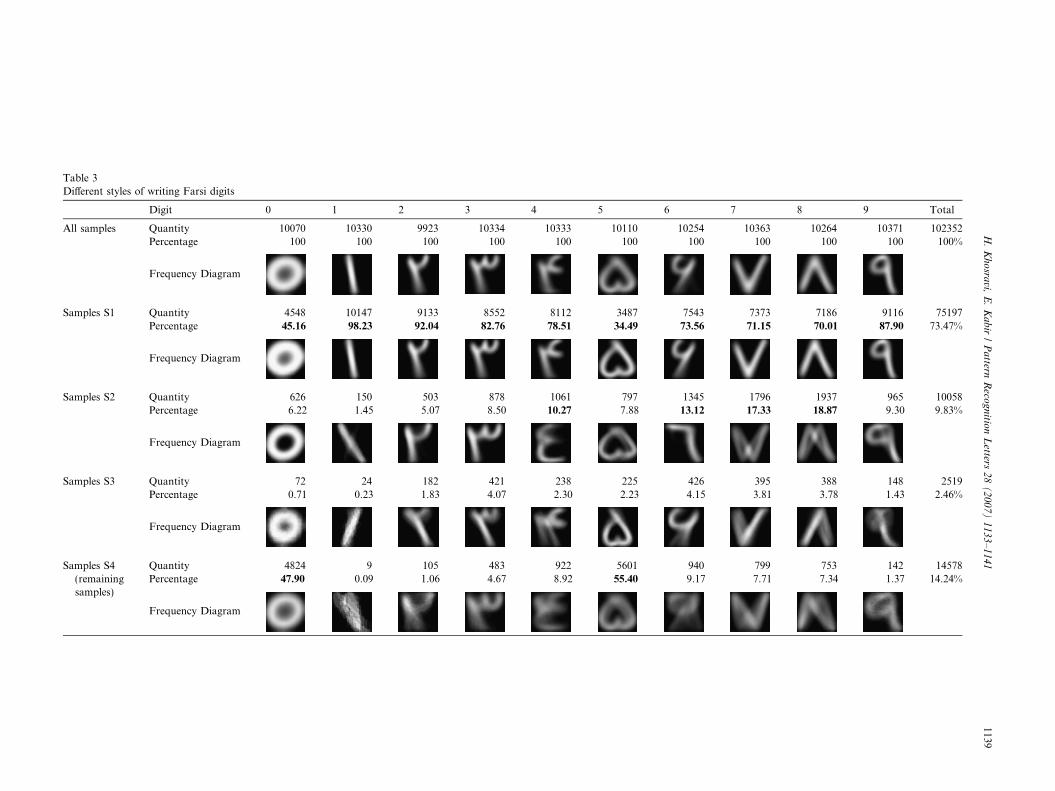
Table 3Different styles of writing Farsi digits
Digit 0 1 2 3 4 5 6 7 8 9 Total
All samples Quantity 10070 10330 9923 10334 10333 10110 10254 10363 10264 10371 102352Percentage 100 100 100 100 100 100 100 100 100 100 100%
Frequency Diagram
Samples S1 Quantity 4548 10147 9133 8552 8112 3487 7543 7373 7186 9116 75197Percentage 45.16 98.23 92.04 82.76 78.51 34.49 73.56 71.15 70.01 87.90 73.47%
Frequency Diagram
Samples S2 Quantity 626 150 503 878 1061 797 1345 1796 1937 965 10058Percentage 6.22 1.45 5.07 8.50 10.27 7.88 13.12 17.33 18.87 9.30 9.83%
Frequency Diagram
Samples S3 Quantity 72 24 182 421 238 225 426 395 388 148 2519Percentage 0.71 0.23 1.83 4.07 2.30 2.23 4.15 3.81 3.78 1.43 2.46%
Frequency Diagram
Samples S4(remainingsamples)
Quantity 4824 9 105 483 922 5601 940 799 753 142 14578Percentage 47.90 0.09 1.06 4.67 8.92 55.40 9.17 7.71 7.34 1.37 14.24%
Frequency Diagram
H.
Kh
osra
vi,E
.K
ab
ir/
Pa
tternR
ecog
nitio
nL
etters2
8(
20
07
)1
13
3–
114
11139
1140 H. Khosravi, E. Kabir / Pattern Recognition Letters 28 (2007) 1133–1141
5. Choosing the training and test sets
To facilitate sharing of results on this dataset betweenresearchers, we provide two distinct datasets for trainingand test.
From Table 3 it can be seen that the most usual stylesare fallen into samples S1, and other varieties are falleninto S2, S3 and S4. So we tried to select most of trainingsamples from S1. To be more accurate we selected fromeach category a number of samples equal to their propor-tion in total samples, i.e. 73.47% of training samples wereselected from S1, 9.83% from S2 and so on. Then we sataside training samples and select test samples from theremaining samples, randomly. In this way the trainingset is a true representation of the whole population,while the test set is selected without any predefined infor-mation.
We selected 60,000 samples for training set and 20,000for test. The remaining samples are also available inanother subset (see Appendix A).
6. Conclusion
In this paper, we introduced a very large dataset ofhandwritten Farsi digits. The dataset samples wereextracted from about 12,000 registration forms of twotypes. The procedure of preprocessing, finding areas ofinterest and digit extraction was described. We also pro-posed a method for finding different digit varieties in atypical dataset, based on modified frequency diagramand an appropriate similarity factor. We applied thismethod on Farsi digit dataset to divide it into two distinctsubsets of training and test. The final subsets are asfollows.
Total samples:
102,352 digits Training set: 60,000 digits Test set: 20,000 digits Remaining samples: 22,352 digitsAppendix A. Dataset specification and availability
The dataset is available in four separate files, Total.cdb,
Training.cdb, Test.cdb, Remaining.cdb. The file format isdescribed here with a pseudo code:
Skip Header (1024 bytes)while not End of File{
read Start Byte: (1 byte) 0xFF thatspecifies the start of new imageread Label: (1 byte) character labelread Width: (1 byte) character widthread Height: (1 byte) character height
read Byte Count: (2 bytes) number of bytes for thischaracter.//Runlength coding on each rowfor y = 0 to Height
while(x < Width){
read NumOfWhitePixels,read NumOfBlackPixels;
}}
Source codes for reading the dataset files are available inMatlab, C++ and Pascal. To get the dataset please [email protected]. or see the homepage http://www.modares.ac.ir/eng/kabir.
References
Azmi, R., Kabir, E., 2001. A new segmentation technique for omnifontFarsi text. Pattern Recognition Lett. 22, 97–104.
Crettez, J. 1995. A set of handwriting families, style recognition. In: ThirdInternational Conference on Document Analysis and Recognition, pp.489–494.
Dehghan, M. et al., 2001. Unconstrained Farsi handwritten wordrecognition using fuzzy vector quantization and hidden Markovmodels. Pattern Recognition Lett. 22, 209–214.
Downton, A.C., Kabir, E., Guillevic, D. 1988. Syntactic and contextualpost-processing of handwritten addresses for optical character recog-nition. In: 9th International Conference on Pattern Recognition, pp.1072–1076.
Franke, J., Oberlander, M. 1993. Writing style detection by statisticalcombination of classifiers in form reader applications. In: SecondInternational Conference on Document Analysis and Recognition, pp.581–584.
Freund, Y., Schapire, R.E. 1996. Experiments with a new boostingalgorithm. In: International Conference on Machine Learning, Italy,pp. 148–156.
Hull, J.J., 1994. A database for handwritten text recognition. IEEE Trans.Pattern Anal. Machine Intell. 16 (5), 550–554.
LeCun, Y., MNIST OCR data, http://www.research.att.com/yann/exdb/mnist/index.html.
LeCun, Y. et al., 1995. Comparison of learning algorithms for handwrit-ten digit recognition. In: International conference on Artificial Neuralnetworks, France, pp. 53–60.
Liu, C.L. et al., 2003. Handwritten digit recognition: Benchmark-ing of state-of-the-art techniques. Pattern Recognition 36, 2271–2285.
Ma, H., Doermann, D. 2004. Adaptive word style classification using aGaussian mixture model. In: 17th International Conference on PatternRecognition, pp. 606–609.
Mayraz, G., Hinton, G.E., 2002. Recognizing handwritten digits usinghierarchical products of experts. IEEE Trans. Pattern Anal. MachineIntell. 24 (2), 189–197.
Nabavi, S.H., Ebrahimpour, R., Kabir, E. 2005. Recognition of hand-written Farsi digits using classifier combination. In: 3rd Conference onMachine Vision, Image Processing and Applications, Tehran, pp. 116–119 (in Farsi).
Oliveira, L.S. et al., 2002. Automatic recognition of handwritten numer-ical strings, a recognition and verification strategy. IEEE Trans.Pattern Anal. Machine Intell. 24 (11), 1438–1454.
Soltanzadeh, H., Rahmati, M., 2004. Recognition of Persian handwrittendigits using image profiles of multiple orientations. Pattern Recogni-tion Lett. 25 (14), 1569–1576.

H. Khosravi, E. Kabir / Pattern Recognition Letters 28 (2007) 1133–1141 1141
Suen, C.Y. et al., 1992. Computer recognition of unconstrained hand-written numerals. Proc. IEEE 80 (7), 1162–1180.
Suen, C.Y., Shinghal, R., Kwan, C.C. 1977. Dispersion factor, aquantitative measurement of the quality of handprinted characters.In: International Conference of Cybernetics and Society, pp. 681–685.
Tanprasert, C., Sae Tang, S. 1999. Thai type style recognition.In: IEEE International Symposium on Circuits and Systems, pp.336–339.
Trier, O.D., Jain, A.K., Taxt, T., 1996. Feature extraction methods forcharacter recognition – a survey. Pattern Recognit. 29 (4), 641–662.