intro to human geography. evolution of mapmaking babylonians – 2300 bc earliest surviving maps...
TRANSCRIPT
Intro to Human GeographyIntro to Human Geography
Evolution of MapmakingEvolution of Mapmaking Babylonians – 2300 BC earliest surviving Babylonians – 2300 BC earliest surviving
maps written on clay tablets.maps written on clay tablets. AristotleAristotle – 384-322 BC demonstrated earth – 384-322 BC demonstrated earth
was spherical through maps.was spherical through maps. EratosthenesEratosthenes – 276-194 BC first person to use – 276-194 BC first person to use
the word the word geography.geography. Also the first person to Also the first person to correctly divide earth into 5 climatic regions.correctly divide earth into 5 climatic regions.
Ptolemy – 100-170 AD Ptolemy – 100-170 AD Guide to GeographyGuide to Geography Age of Exploration – by the 17th century, Age of Exploration – by the 17th century,
most continents and oceans were accurately most continents and oceans were accurately displayed.displayed.
Human Geography: Five Human Geography: Five ThemesThemes
LocationLocation – the space that is occupied in – the space that is occupied in the universe (absolute/relative).the universe (absolute/relative).
PlacePlace – physical and human – physical and human characteristics: space after humans.characteristics: space after humans.
Human/Environment InteractionsHuman/Environment Interactions – – how humans depend, modify, and adapt how humans depend, modify, and adapt to their environments.to their environments.
MovementMovement – how humans interact on – how humans interact on earth, the diffusion of religion or trade earth, the diffusion of religion or trade patterns through connections of patterns through connections of peoples.peoples.
RegionsRegions – an area with one or more – an area with one or more shared characteristics.shared characteristics.
How to Lie with mapsHow to Lie with maps A map is a generalization or representation of A map is a generalization or representation of
the real world.the real world. Cartography – the science of mapmaking.Cartography – the science of mapmaking. Contemporary Mapping – Contemporary Mapping –
Remote Sensing SatellitesRemote Sensing Satellites GIS (geographic information systems)GIS (geographic information systems) GPS (global positioning system) GPS (global positioning system)
All maps lie flat and all maps lieAll maps lie flat and all maps lie. They . They contain distortions. You cannot represent the contain distortions. You cannot represent the three-dimensional earth on a flat surface three-dimensional earth on a flat surface without distorting reality.without distorting reality.
Any useful map is selective in what is put in Any useful map is selective in what is put in and left out. Example: road or subway map.and left out. Example: road or subway map.
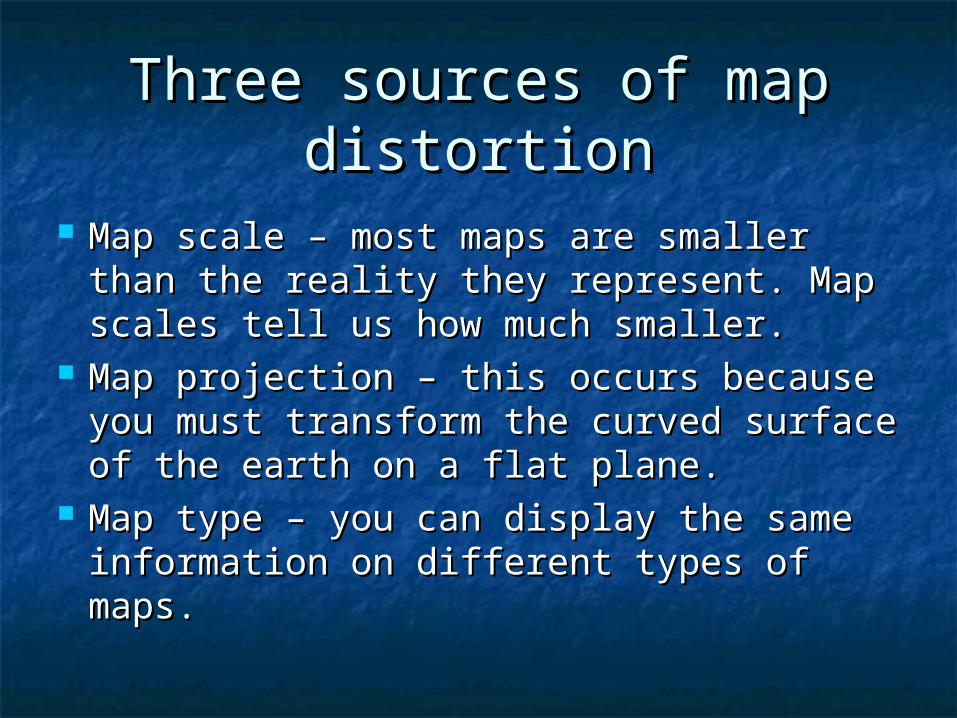
Three sources of map Three sources of map distortiondistortion
Map scale – most maps are smaller Map scale – most maps are smaller than the reality they represent. Map than the reality they represent. Map scales tell us how much smaller.scales tell us how much smaller.
Map projection – this occurs because Map projection – this occurs because you must transform the curved surface you must transform the curved surface of the earth on a flat plane.of the earth on a flat plane.
Map type – you can display the same Map type – you can display the same information on different types of maps.information on different types of maps.

All Maps should HaveAll Maps should Have
CartographerCartographer TitleTitle ScaleScale KeyKey
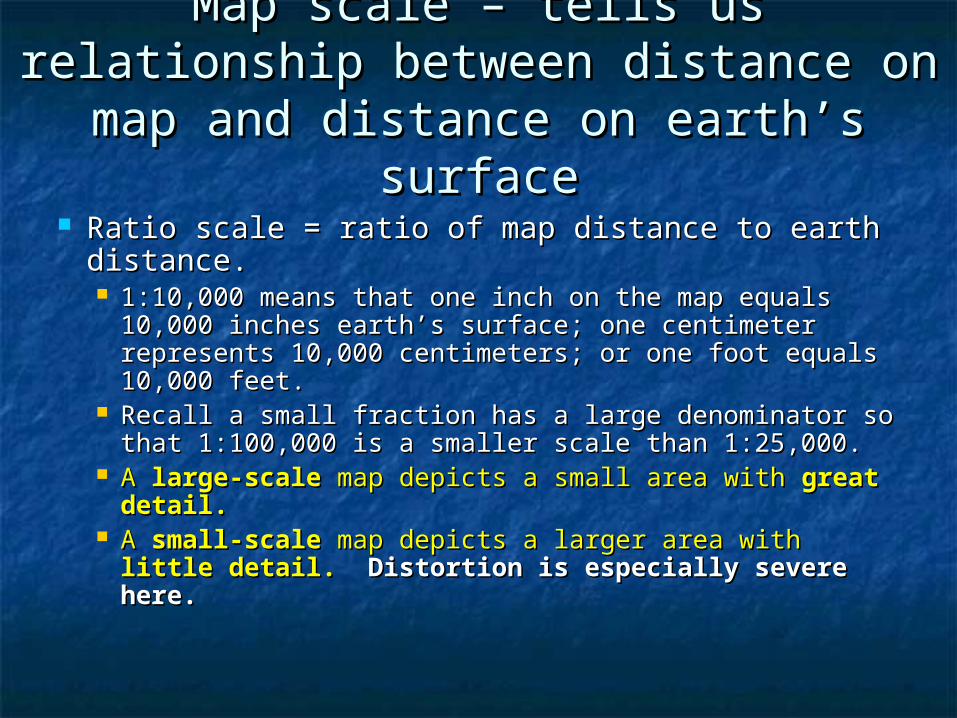
Map scale – tells us relationship Map scale – tells us relationship between distance on map and between distance on map and
distance on earth’s surfacedistance on earth’s surface
Ratio scale = ratio of map distance to earth Ratio scale = ratio of map distance to earth distance.distance. 1:10,000 means that one inch on the map equals 1:10,000 means that one inch on the map equals
10,000 inches earth’s surface; one centimeter 10,000 inches earth’s surface; one centimeter represents 10,000 centimeters; or one foot equals represents 10,000 centimeters; or one foot equals 10,000 feet.10,000 feet.
Recall a small fraction has a large denominator so Recall a small fraction has a large denominator so that 1:100,000 is a smaller scale than 1:25,000.that 1:100,000 is a smaller scale than 1:25,000.
A A large-scalelarge-scale map depicts a small area with map depicts a small area with great great detail.detail.
A A small-scalesmall-scale map depicts a larger area with map depicts a larger area with little little detail.detail. Distortion is especially severe here. Distortion is especially severe here.
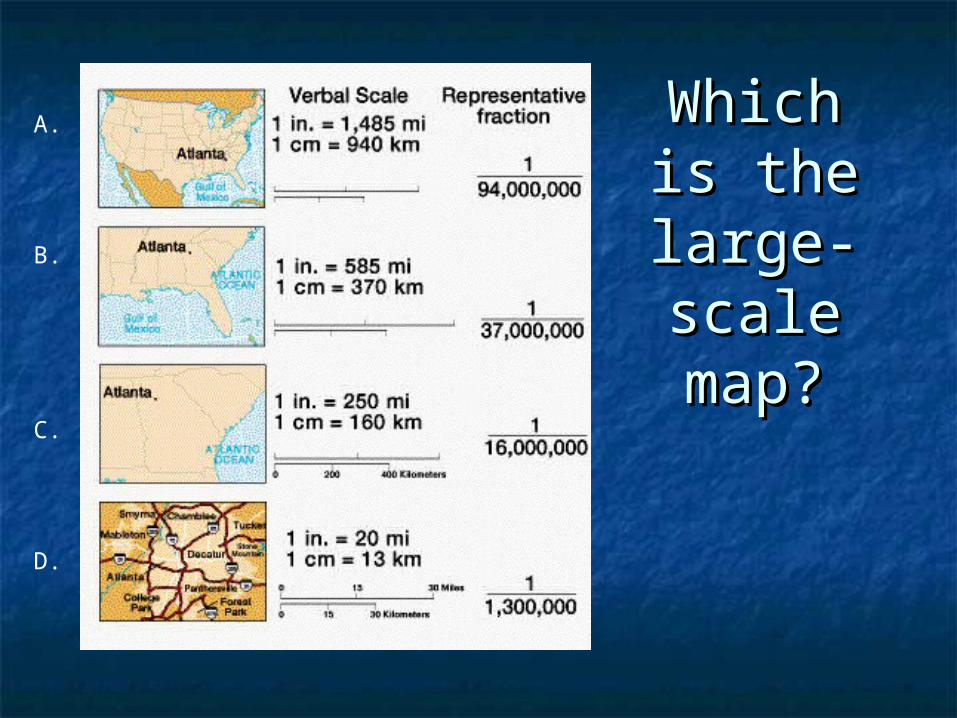
Which Which is the is the large-large-scale scale map?map?
A.
B.
C.
D.
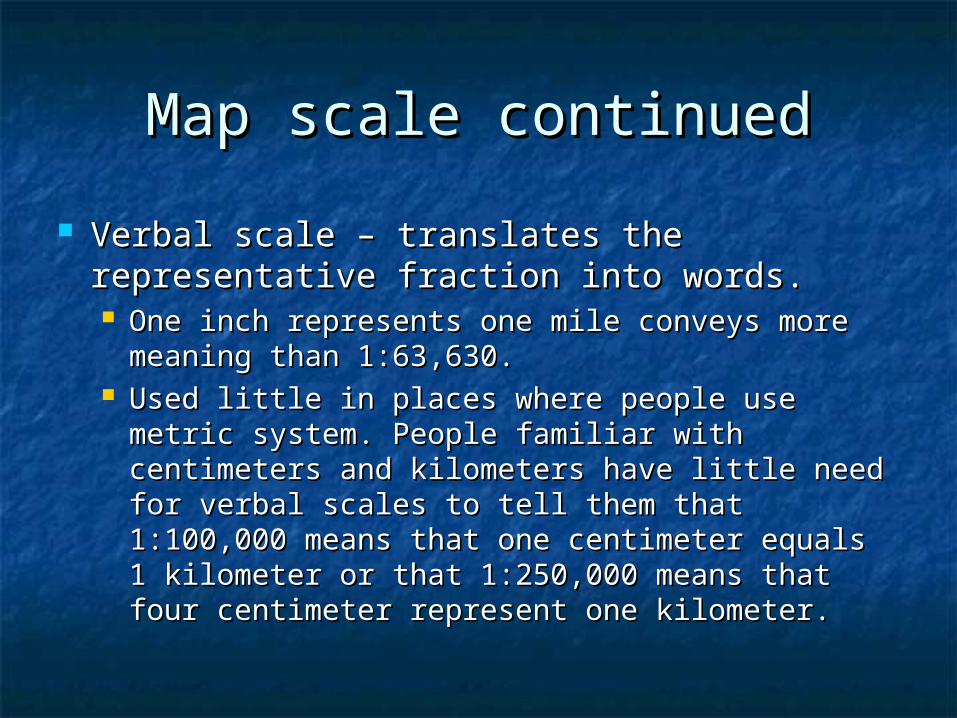
Map scale continuedMap scale continued
Verbal scale – translates the representative Verbal scale – translates the representative fraction into words.fraction into words. One inch represents one mile conveys more One inch represents one mile conveys more
meaning than 1:63,630.meaning than 1:63,630. Used little in places where people use metric Used little in places where people use metric
system. People familiar with centimeters and system. People familiar with centimeters and kilometers have little need for verbal scales to kilometers have little need for verbal scales to tell them that 1:100,000 means that one tell them that 1:100,000 means that one centimeter equals 1 kilometer or that 1:250,000 centimeter equals 1 kilometer or that 1:250,000 means that four centimeter represent one means that four centimeter represent one kilometer.kilometer.
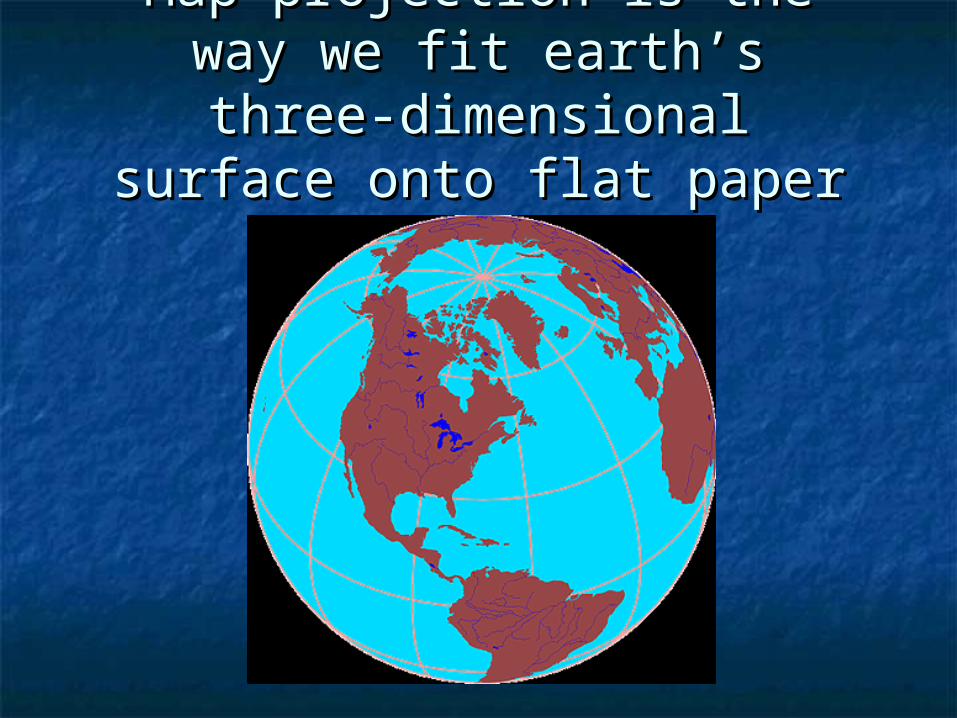
Map projection is the way we Map projection is the way we fit earth’s three-dimensional fit earth’s three-dimensional surface onto flat paper or a surface onto flat paper or a
screenscreen

Goode’s ProjectionGoode’s Projection
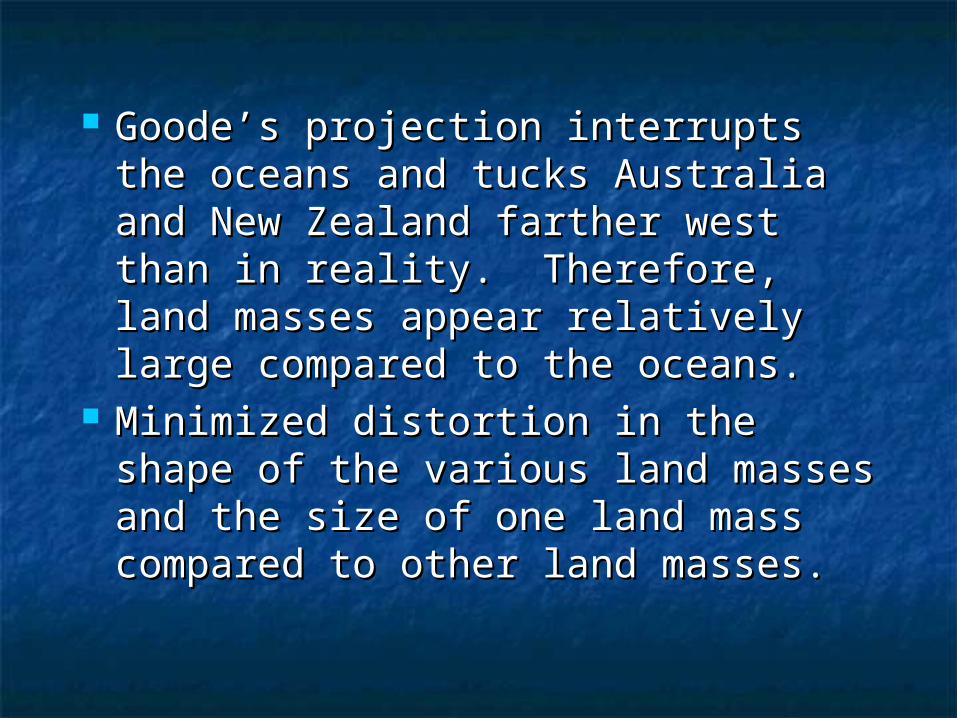
Goode’s projection interrupts the Goode’s projection interrupts the oceans and tucks Australia and oceans and tucks Australia and New Zealand farther west than in New Zealand farther west than in reality. Therefore, land masses reality. Therefore, land masses appear relatively large compared appear relatively large compared to the oceans.to the oceans.
Minimized distortion in the shape Minimized distortion in the shape of the various land masses and the of the various land masses and the size of one land mass compared to size of one land mass compared to other land masses.other land masses.
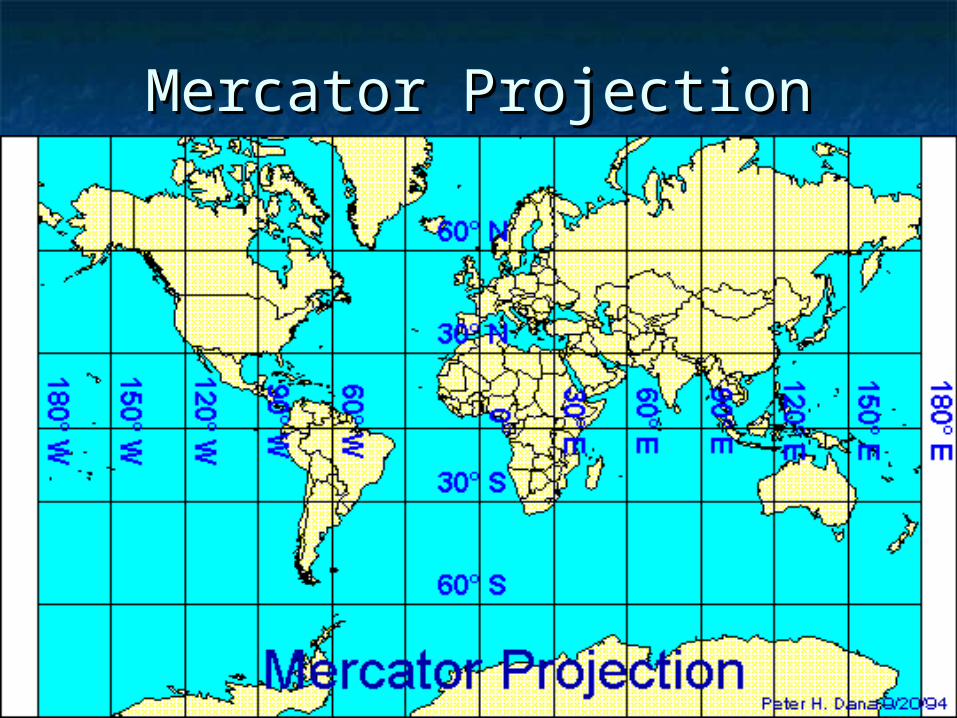
Mercator ProjectionMercator Projection
Mercator ProjectionMercator Projection Stretches the poles from one length to the Stretches the poles from one length to the
size of the equator. The north-south scale is size of the equator. The north-south scale is constant, but east-west scale increases to constant, but east-west scale increases to twice the north-south scale at 60 degrees N twice the north-south scale at 60 degrees N and infinitely at the poles.and infinitely at the poles.
Shapes are correct for all areas, and map has Shapes are correct for all areas, and map has correct directional relationships.correct directional relationships.
Look at the size of Greenland and Antarctica.Look at the size of Greenland and Antarctica. Map exaggerates the distance between Map exaggerates the distance between
Chicago and Stockholm, both in northern Chicago and Stockholm, both in northern latitudes.latitudes.
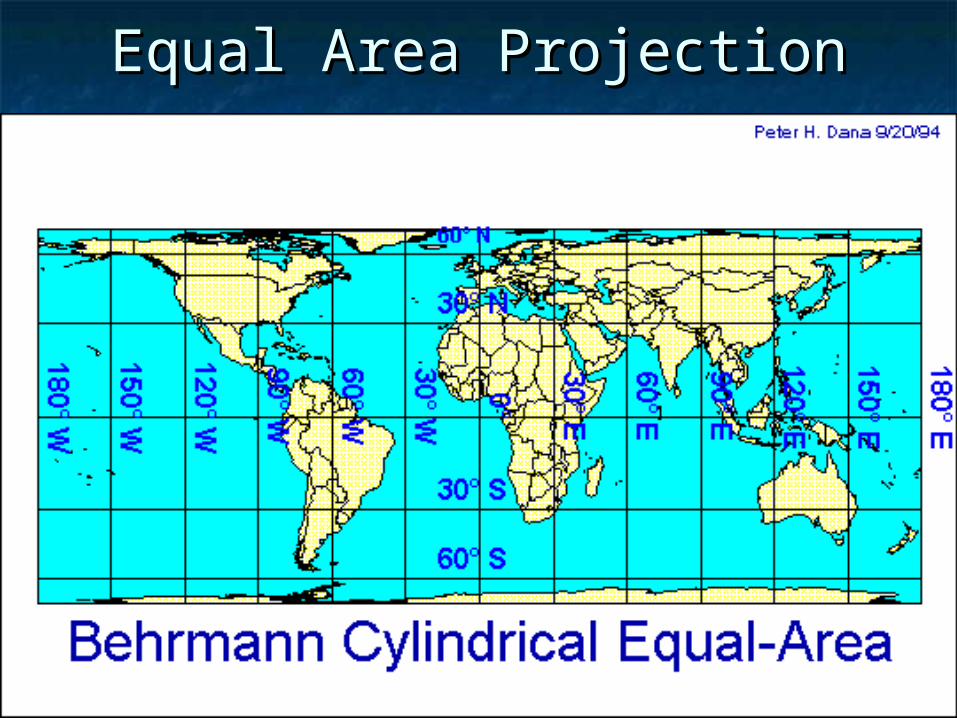
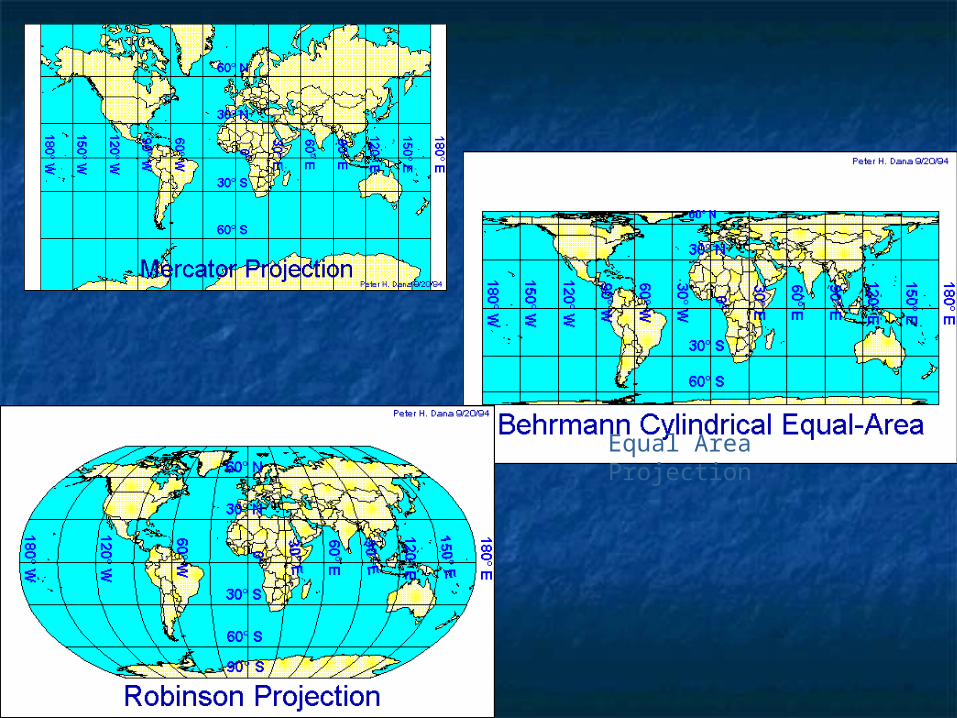
Equal Area ProjectionEqual Area Projection
Equal Area ProjectionEqual Area Projection
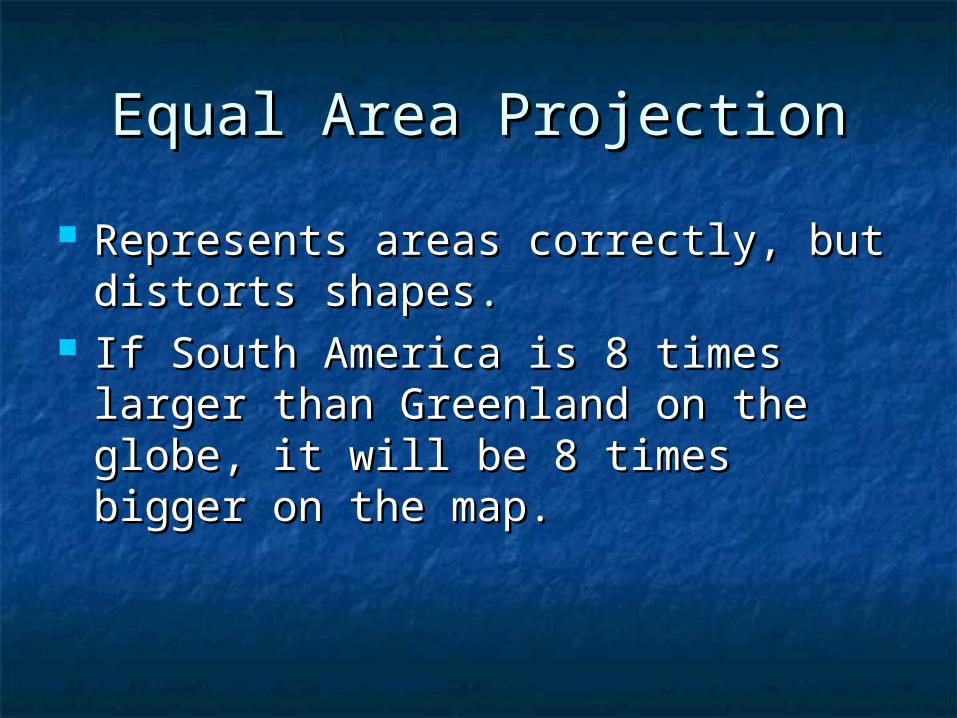
Represents areas correctly, but Represents areas correctly, but distorts shapes.distorts shapes.
If South America is 8 times larger If South America is 8 times larger than Greenland on the globe, it will than Greenland on the globe, it will be 8 times bigger on the map.be 8 times bigger on the map.
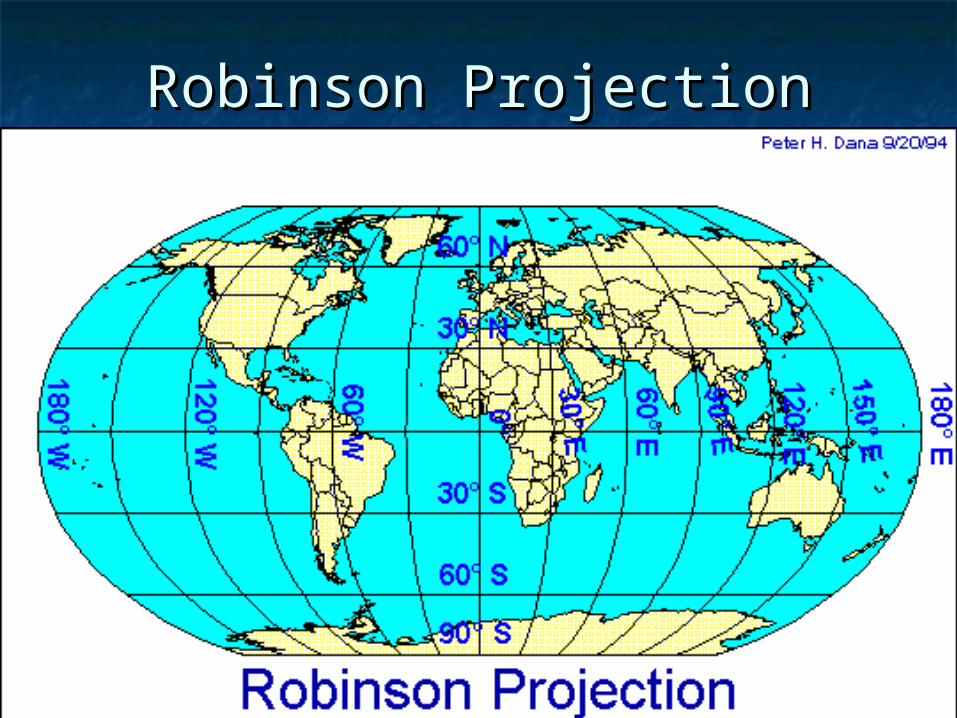
Robinson ProjectionRobinson Projection
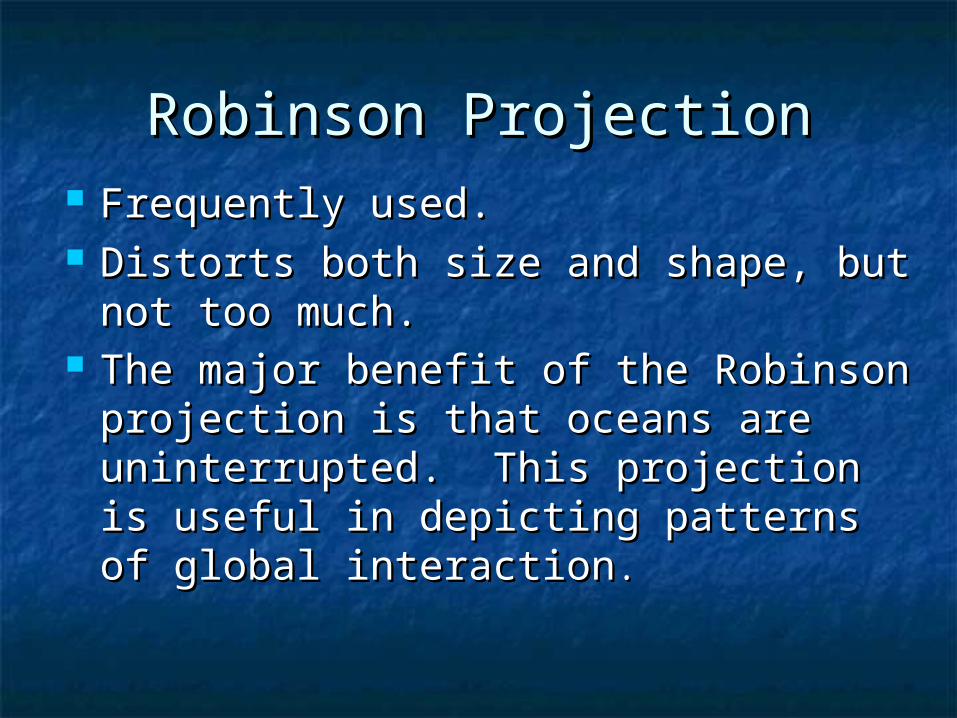
Robinson ProjectionRobinson Projection Frequently used.Frequently used. Distorts both size and shape, but not Distorts both size and shape, but not
too much.too much. The major benefit of the Robinson The major benefit of the Robinson
projection is that oceans are projection is that oceans are uninterrupted. This projection is uninterrupted. This projection is useful in depicting patterns of global useful in depicting patterns of global interactioninteraction..
Equal Area Projection
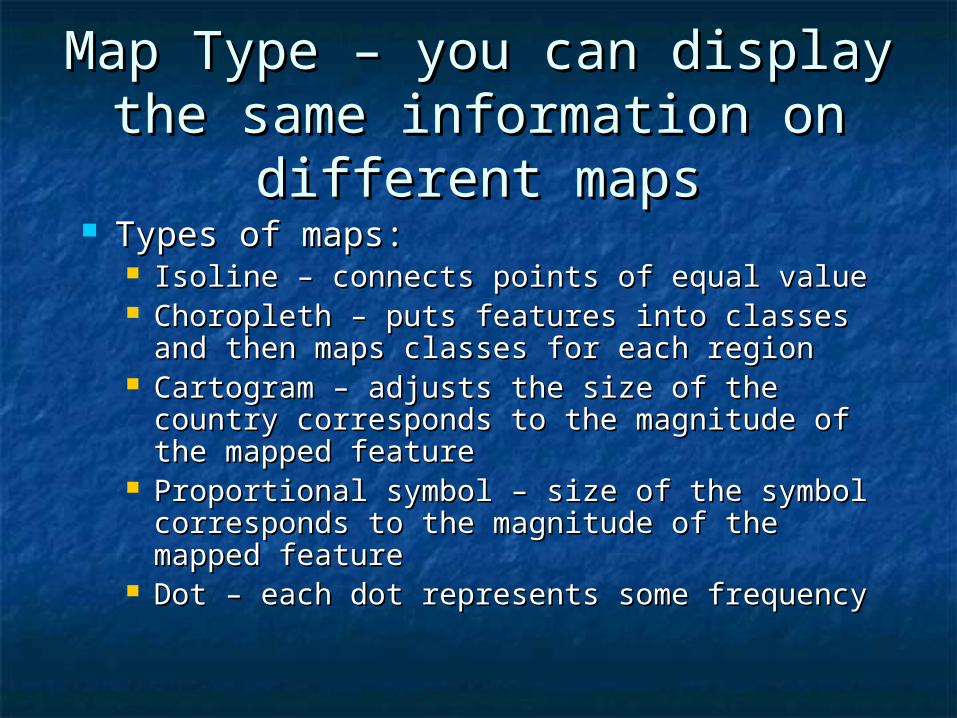
Map Type – you can display the Map Type – you can display the same information on different same information on different
mapsmaps Types of maps:Types of maps:
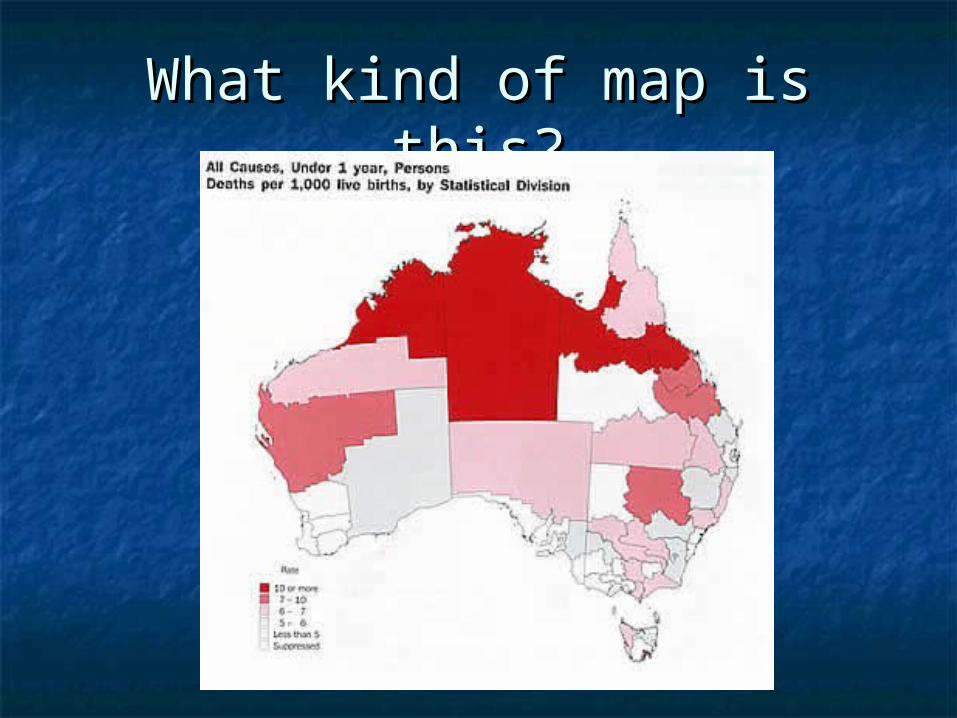
Isoline – connects points of equal valueIsoline – connects points of equal value Choropleth – puts features into classes and Choropleth – puts features into classes and
then maps classes for each regionthen maps classes for each region Cartogram – adjusts the size of the country Cartogram – adjusts the size of the country
corresponds to the magnitude of the mapped corresponds to the magnitude of the mapped featurefeature
Proportional symbol – size of the symbol Proportional symbol – size of the symbol corresponds to the magnitude of the mapped corresponds to the magnitude of the mapped featurefeature
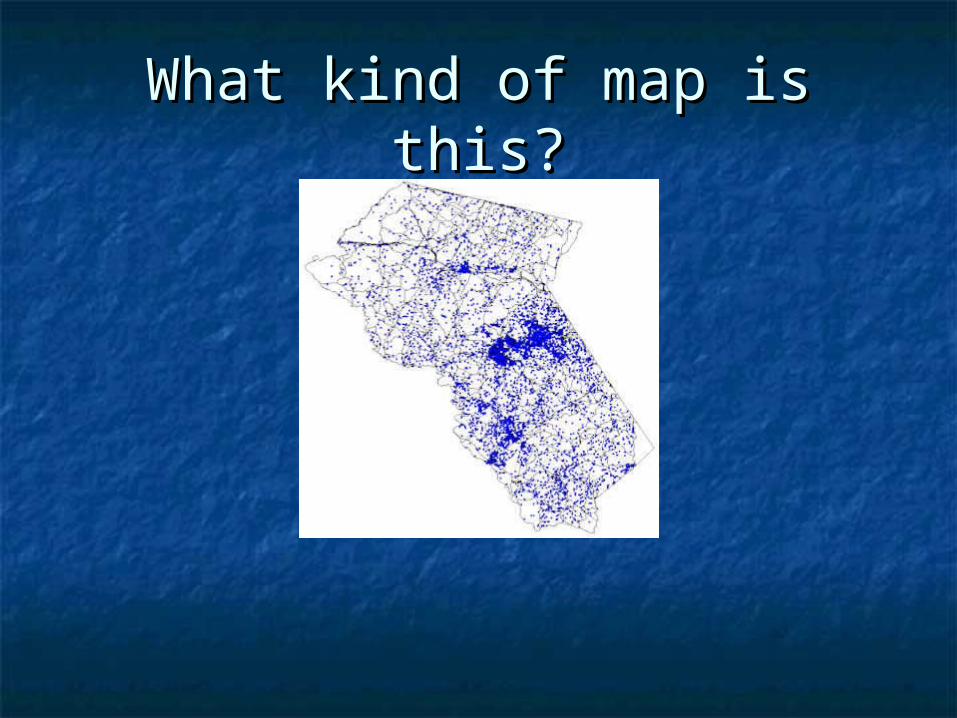
Dot – each dot represents some frequencyDot – each dot represents some frequency
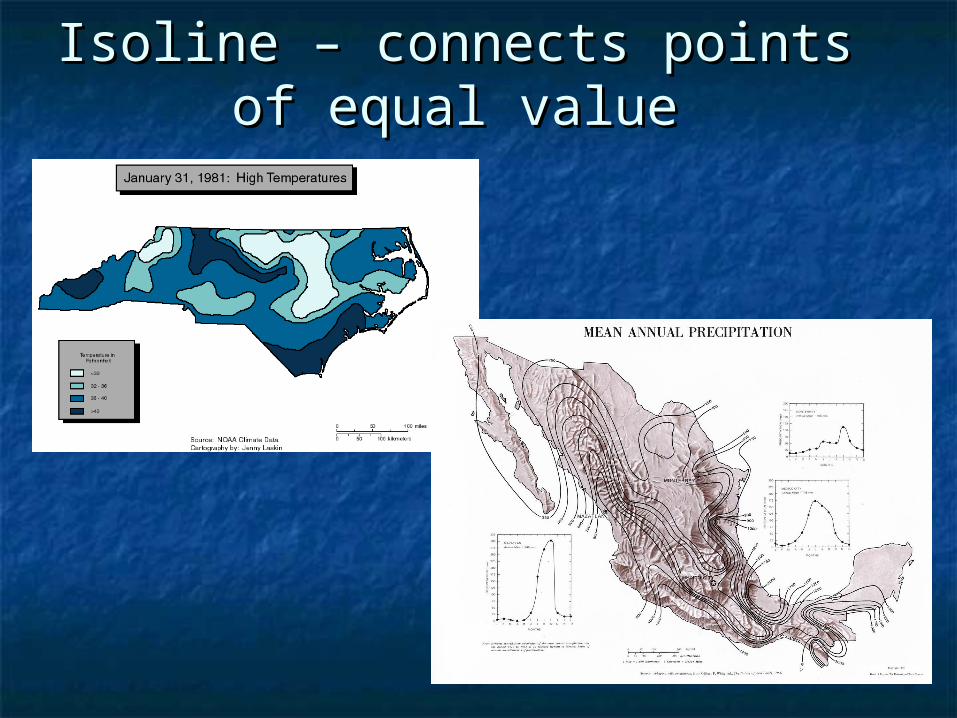
Isoline – connects points of Isoline – connects points of equal valueequal value
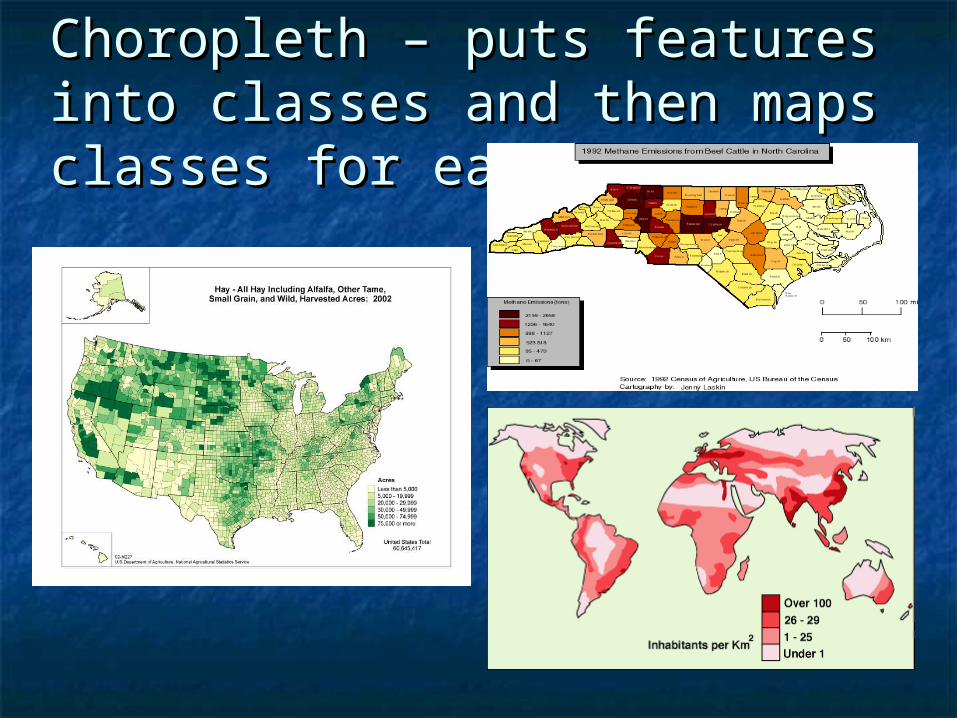
Choropleth – puts features into Choropleth – puts features into classes and then maps classes classes and then maps classes for each regionfor each region
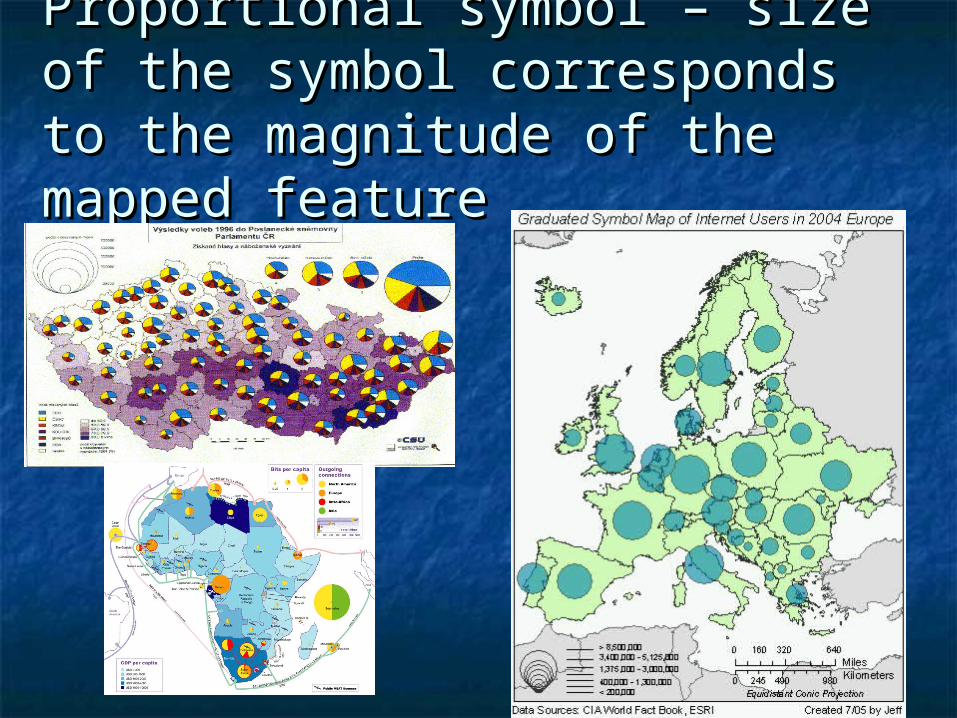
Proportional symbol – size of the Proportional symbol – size of the symbol corresponds to the symbol corresponds to the magnitude of the mapped magnitude of the mapped featurefeature

Cartogram – adjusts the size of Cartogram – adjusts the size of the country corresponds to the the country corresponds to the
magnitude of the mapped magnitude of the mapped featurefeature

Dot – each dot represents Dot – each dot represents some frequencysome frequency
ChartMap
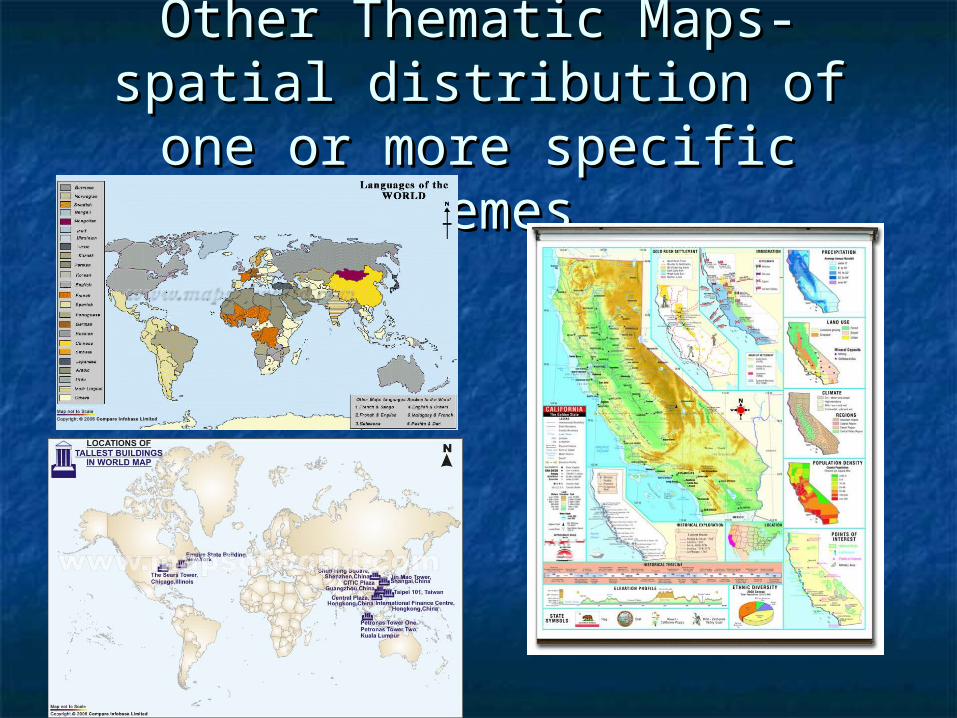
Other Thematic Maps- spatial Other Thematic Maps- spatial distribution of one or more distribution of one or more
specific themesspecific themes
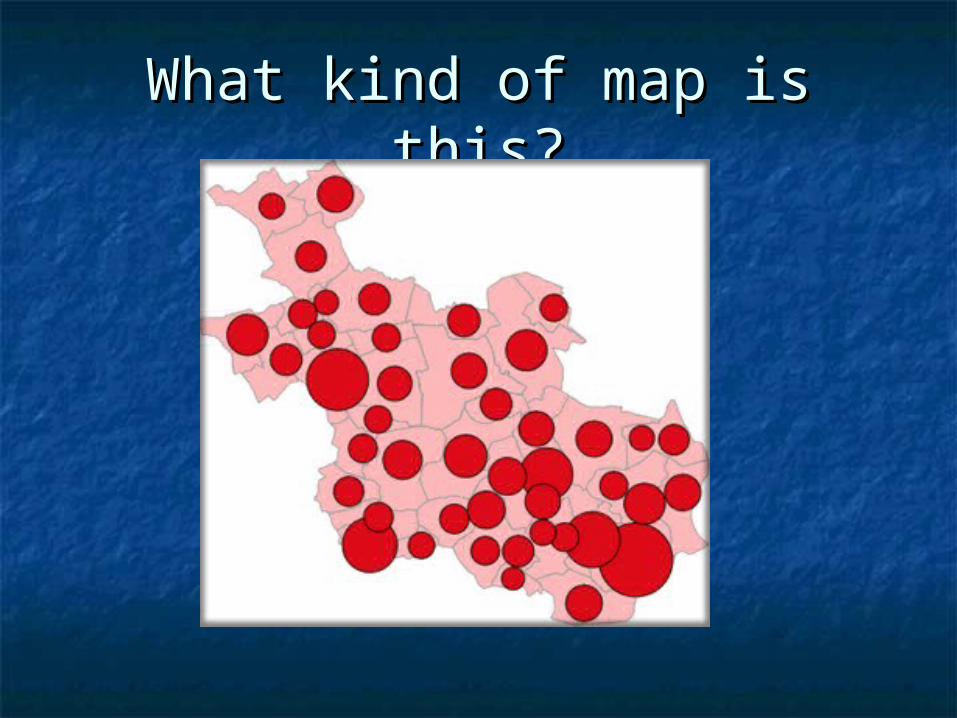
What kind of map is this?What kind of map is this?
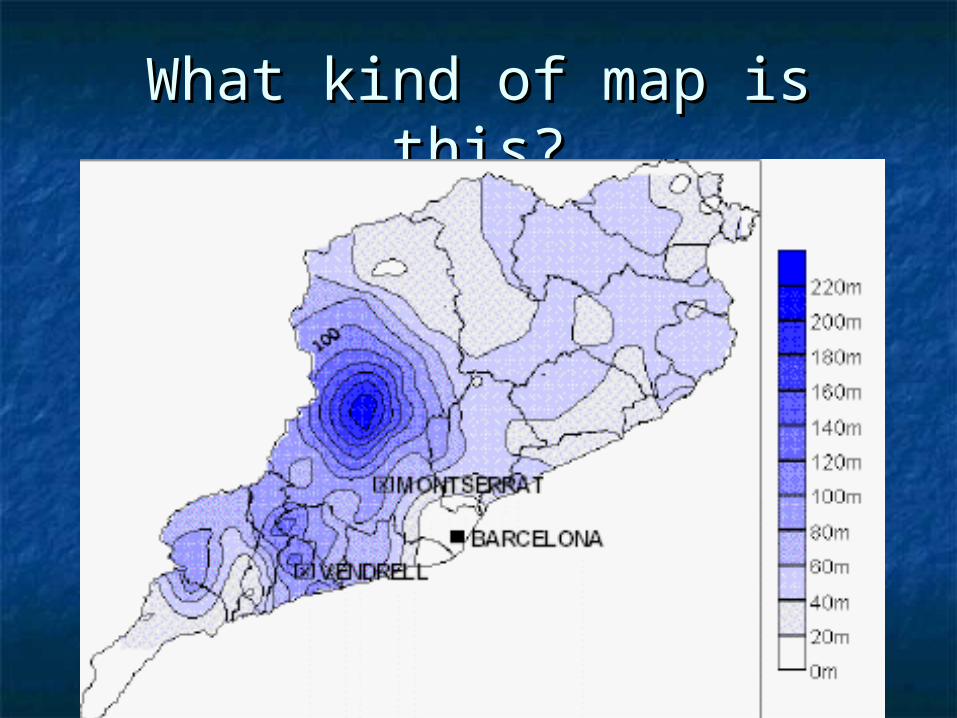
What kind of map is this?What kind of map is this?
What kind of map is this?What kind of map is this?
What kind of map is this?What kind of map is this?
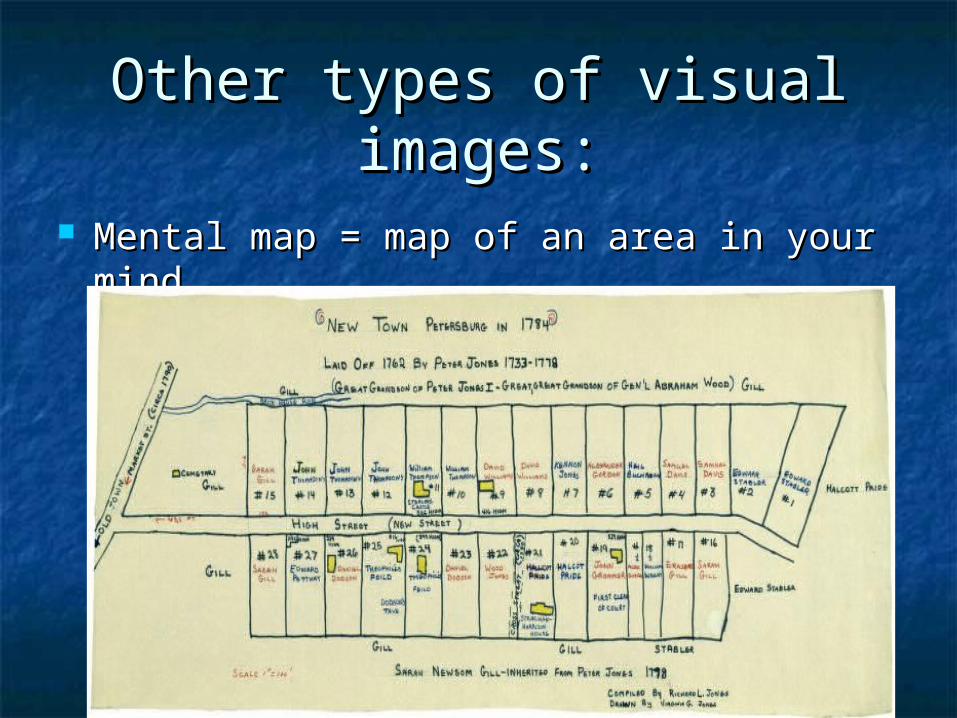
Other types of visual Other types of visual images:images:
Mental map = map of an area in your Mental map = map of an area in your mindmind
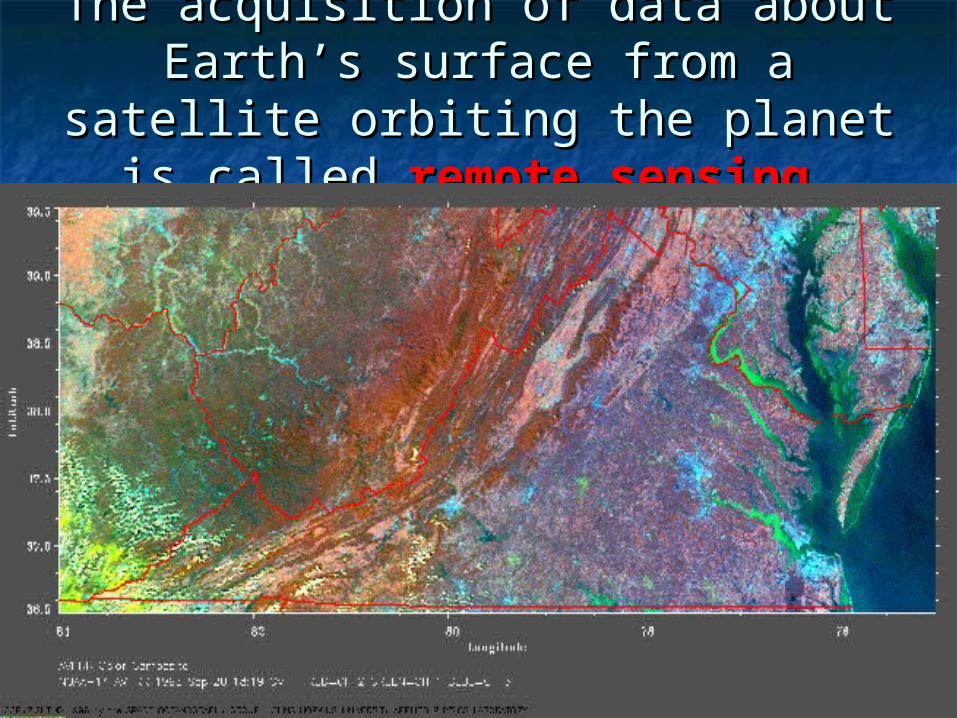
The acquisition of data about The acquisition of data about Earth’s surface from a satellite Earth’s surface from a satellite
orbiting the planet is called orbiting the planet is called remote sensingremote sensing..
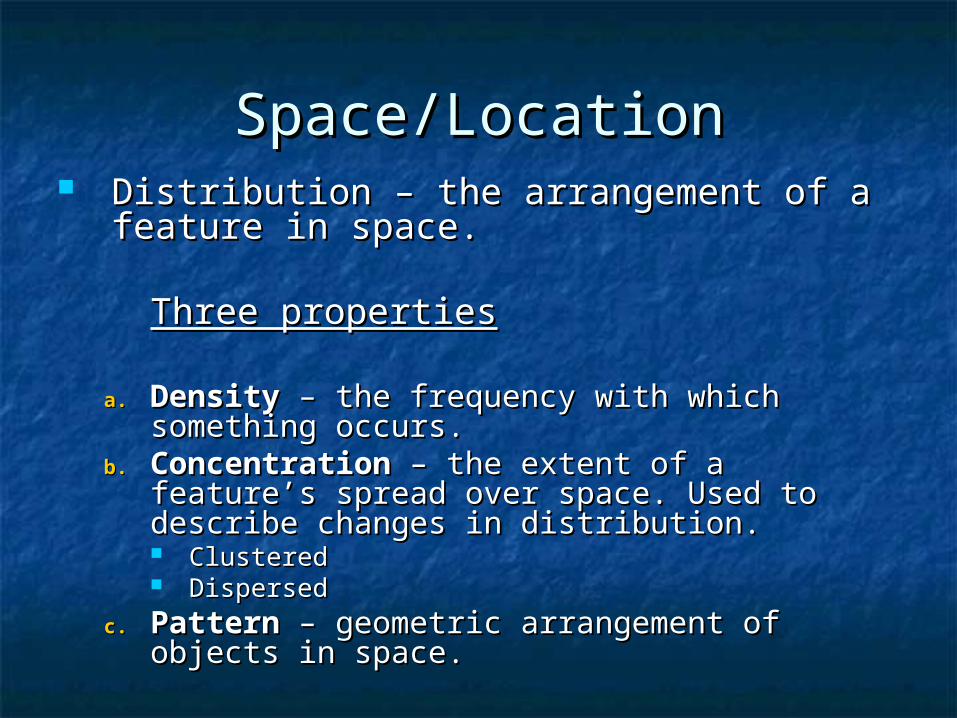
Space/LocationSpace/Location Distribution – the arrangement of a Distribution – the arrangement of a
feature in space.feature in space.
Three propertiesThree properties
a.a. DensityDensity – the frequency with which – the frequency with which something occurs.something occurs.
b.b. ConcentrationConcentration – the extent of a feature’s – the extent of a feature’s spread over space. Used to describe changes spread over space. Used to describe changes in distribution.in distribution. ClusteredClustered DispersedDispersed
c.c. PatternPattern – geometric arrangement of objects – geometric arrangement of objects in space.in space.
Bottom line: hundreds of Bottom line: hundreds of decisions are made in the decisions are made in the making of a map, including making of a map, including scale, projection, and type. scale, projection, and type. These decision ultimately These decision ultimately determine the map’s determine the map’s message.message.