intracellular life cycle kinetics of sars-cov-2 predicted
TRANSCRIPT

viruses
Article
Intracellular Life Cycle Kinetics of SARS-CoV-2 PredictedUsing Mathematical Modelling
Dmitry Grebennikov 1,2,3,* , Ekaterina Kholodareva 1,4, Igor Sazonov 5 , Antonina Karsonova 6 ,Andreas Meyerhans 7,8 and Gennady Bocharov 1,2,9,*
�����������������
Citation: Grebennikov, D.;
Kholodareva, E.; Sazonov, I.;
Karsonova, A.; Meyerhans, A.;
Bocharov, G. Intracellular Life Cycle
Kinetics of SARS-CoV-2 Predicted
Using Mathematical Modelling.
Viruses 2021, 13, 1735. https://
doi.org/10.3390/v13091735
Academic Editors: Amber M. Smith
and Ruian Ke
Received: 21 May 2021
Accepted: 27 August 2021
Published: 31 August 2021
Publisher’s Note: MDPI stays neutral
with regard to jurisdictional claims in
published maps and institutional affil-
iations.
Copyright: © 2021 by the authors.
Licensee MDPI, Basel, Switzerland.
This article is an open access article
distributed under the terms and
conditions of the Creative Commons
Attribution (CC BY) license (https://
creativecommons.org/licenses/by/
4.0/).
1 Marchuk Institute of Numerical Mathematics, Russian Academy of Sciences (INM RAS),119333 Moscow, Russia; [email protected]
2 Moscow Center for Fundamental and Applied Mathematics at INM RAS, 119333 Moscow, Russia3 World-Class Research Center “Digital Biodesign and Personalized Healthcare”,
Sechenov First Moscow State Medical University, 119991 Moscow, Russia4 Moscow Institute of Physics and Technology (National Research University), Dolgoprudny,
141701 Moscow Oblast, Russia5 College of Engineering, Swansea University, Bay Campus, Fabian Way, Swansea SA1 8EN, UK;
[email protected] Department of Clinical Immunology and Allergology, Sechenov First Moscow State Medical University,
119991 Moscow, Russia; [email protected] Infection Biology Laboratory, Universitat Pompeu Fabra, 08003 Barcelona, Spain;
[email protected] ICREA, Pg. Lluis Companys 23, 08010 Barcelona, Spain9 Institute of Computer Science and Mathematical Modelling, Sechenov First Moscow State Medical University,
119991 Moscow, Russia* Correspondence: [email protected] (D.G.); [email protected] (G.B.)
Abstract: SARS-CoV-2 infection represents a global threat to human health. Various approaches wereemployed to reveal the pathogenetic mechanisms of COVID-19. Mathematical and computationalmodelling is a powerful tool to describe and analyze the infection dynamics in relation to a plethoraof processes contributing to the observed disease phenotypes. In our study here, we formulate andcalibrate a deterministic model of the SARS-CoV-2 life cycle. It provides a kinetic description of themajor replication stages of SARS-CoV-2. Sensitivity analysis of the net viral progeny with respect tomodel parameters enables the identification of the life cycle stages that have the strongest impact onviral replication. These three most influential parameters are (i) degradation rate of positive sensevRNAs in cytoplasm (negative effect), (ii) threshold number of non-structural proteins enhancingvRNA transcription (negative effect), and (iii) translation rate of non-structural proteins (positiveeffect). The results of our analysis could be used for guiding the search for antiviral drug targets tocombat SARS-CoV-2 infection.
Keywords: SARS-CoV-2; intracellular replication; mathematical model; sensitivity analysis; targetsfor drugs
1. Introduction
Human infection with SARS-CoV-2 presents a tremendous health problem. Thewithin-host infection characteristics are characterized by extreme variability of the diseasecourse ranging from asymptomatic infections to severe forms of COVID-19 with lethaloutcomes [1]. This spectrum of pathogenicity is a result of the interaction of numerousprocesses and factors on multiple levels of realization: the single cell, tissues and organs,and the organism’s physiology [2]. The SARS-CoV-2 infection dynamics in a human organ-ism is determined by the kinetics of infection of cells which express viral receptors (e.g.,ACE2), by the activation of the intracellular defense, and by systemic immunophysiologicalreactions. The corresponding “virus–human organism” is a multiscale, multicomponentdynamical system. A comprehensive study of such a system requires the development of
Viruses 2021, 13, 1735. https://doi.org/10.3390/v13091735 https://www.mdpi.com/journal/viruses

Viruses 2021, 13, 1735 2 of 18
mathematical models that integrate the underlying biophysical, biochemical, and physio-logical processes [3]. Although a few mathematical models have been recently proposed todescribe the within-host kinetics of SARS-CoV-2 infection [4–9], the degree of a mechanisticprocess resolution remains to be greatly enhanced.
From a scientific point of view, the intracellular replication of the viruses is realizedas an intertwined set of biochemical reactions and biophysical transport processes. Beingsummarized in a schematic form, the theoretical abstraction of the system provides a con-ceptual platform for deriving a mathematical model. The mathematical descriptions canfurther be specified on the basis of the law of mass action, enzyme kinetics, diffusion laws,etc, following deterministic, stochastic, or hybrid approaches. The derived mathematicalmodels which bear a direct resemblance to and coordination with the underling chemicaland physical processes are considered as mechanistic models versus empirical (e.g., sta-tistical) or black-box (e.g., neural-networks) type mathematical models. The mechanisticmodels provide a descriptive and analytical tool for studying the virus life cycle regulationand predicting its response to structural or parametric perturbations. In virology, the mech-anistic models have been successfully developed and applied to study, in a quantitativeway, the intracellular replication of HIV-1 [10], hepatitis B virus [11], influenza A virus [12],hepatitis C virus [13], and poliovirus [14].
The dynamic view on the balance between virus expansion and development of antivi-ral immune responses suggests that the kinetics of virus growth is one of the major determi-nants of the infection trajectory [15]. Existing mathematical models of SARS-CoV-2 infectionconsider the virus growth at the cell population level, ignoring details of the virus life cycle.The infection of permissive cells by the virus results in a number of dramatic changes ofthe infected cell physiology, such as modification of host protein synthesis [16], inhibitionof the innate immune responses [17], and induction of programmed cell death [18]. In thisstudy, we formulate a mathematical model of SARS-CoV-2 replication in infected cells. Thedevelopment of the model follows a deterministic approach, similar to [10], in order tofocus on the calibration of model parameters to reproduce some reference kinetics of thevirus life cycle steps. By applying a sensitivity analysis of the model, we rank the modelparameters according to their impact on the net secretion of virions by the infected cell. Themost influential parameters can be considered as prospective targets for available antiviraldrugs or novel treatments.
2. Methods2.1. Model Development and Calibration
The kinetics of the corresponding biochemical reactions is described in the determin-istic mathematical model introduced in Section 3. The system of ordinary differentialequations (ODEs) is formulated using the law of mass action and Michaelis–Menten param-eterization. Note that the deterministic version provides an initial step toward a stochasticdescription of virus replication.
We use a Michaelis–Menten-type description for the nucleocapsid formation and viralassembly processes to represent the following aspects of virus replication: (i) purifiedcoronavirus virions containing mainly full-genome length viral RNAs, i.e., there is nosaturation in the kinetics with respect to viral RNA [18], (ii) structural proteins (N and M)required for virion morphogenesis and recruitment of the virion structural componentsto the assembly site [1] scale this rate so that enough proteins must be present above acertain level to reach half the maximal rate of the ribonucleoprotein formation and virionassembly, and (iii) the least abundant structural proteins represent the kinetic bottleneck inthe overall progeny production.
A major step in the mathematical model formulation is the estimation of parametersappearing on the right-hand sides of the model equations. The maximum likelihoodapproach represents a general framework to address the parameter estimation problem.However, the sparsity of the available kinetic data on the intracellular life cycle of SARS-CoV-2 motivates the implementation of the parameter estimation procedure, which we

Viruses 2021, 13, 1735 3 of 18
refer to as “model calibration”. It stands for an iterative process of parameter guessingand constraining the choice progressively by requiring consistency with all availabledata. In this study, these data mainly consist of previously estimated numerical valuesand/or numerical ranges of the molecular species variables at key time points, such asthe beginning and end of the infection cycle, or of intermediate steps, as summarized inTable 1.
Table 1. Time-dependent variables of the mathematical model characterizing the SARS-CoV-2life cycle.
Variable Meaning Quantitative Characteristics
[Vf ree] number of free virions outside the cell membrane 10
[Vbound]number of virions bound to ACE2
and activated by TMPRSS2 1–10
[Vendosome] number of virions in endosomes 1–10[gRNA(+)] single strand positive sense genomic RNA 1–5
[NSP] population of non-structural proteins −[gRNA(−)] negative sense genomic and subgenomic RNAs 10[gRNA] positive sense genomic and subgenomic RNAs 10,000
[SP] total number of structural proteinsS + M + E per virion 2000 ∈ (1125, 2230) [19–21]
[N] N proteins per virion [N] 456 [21]; 1465 ∈ (730, 2200) [19][N-gRNA] ribonucleocapsid molecules −[Vassembled] assembled virions in endosomes −[Vreleased] virus burst size 10–10,000 virions in 7 to 24 h [2,22,23]
2.2. Model Validation
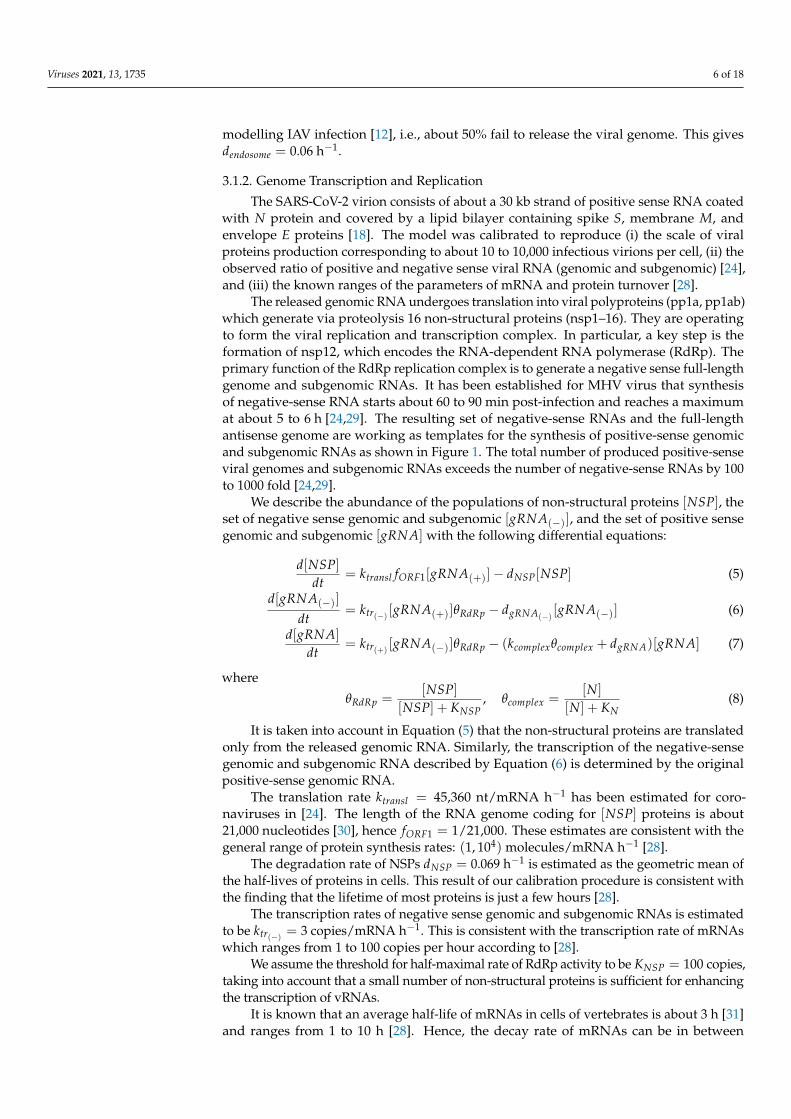
To validate the calibrated model, we compared some predicted quantities with avail-able experimental data, namely, (i) the kinetics of positive- to negative-sense vRNA ratio inMHV-infected cells [24], and (ii) the kinetics of SARS-CoV-2 replication in the cell culturesof Vero E6 cells [23,25]. As we cannot directly infer the absolute values of the number ofreleased virions by an infected cell just because there are no such single-cell experiments,we used the relative measure of fold changes of titer levels in cell culture from the start oftheir exponential growth. This data was compared with the fold changes of [Vreleased](t)starting from the moment ts at which [Vreleased](ts) = 1.
The experimental data presented in [24] characterize the kinetics of virus transcriptionand translation of cells infected with Murine coronavirus (MHV-A59). In particular, theribosome profiling technique was used to generate high precision data on the productionof the positive and negative-sense genomic and subgenomic viral RNAs. The overallkinetics of SARS-CoV-2 in Vero E6 cells is studied in [23]. To this end, one-step growth(MOI = 5) of three recombinant (i.e., icSARS-CoV-Urbani, icSARS-CoV-GFP, icSARS-CoV-nLuc) and one clinical strain WA1 was followed. The data on the kinetics of virus titersin the supernatants of cell cultures (PFU/mL) show that the growth phase until reachingthe plateau takes about 12 to 19 h and is similar to all the above CoV variants. A similarstudy of SARS-CoV-2 replication features such as growth kinetics, virus titers, analysisof transcription, and translation in Vero E6 cells is presented in [25]. The virus isolateSARS-CoV-2 Australia/VIC01/2020 was used for infection of cells at MOI = 3. Intracellularviral RNA, protein synthesis and release of infectious viral progeny (by plaque assay) werequantified. The initial guess for the mathematical model parameters was specified usingdata from a broad spectrum of publications covering the structural and genetic propertiesof the SARS-CoV-2, the coronavirus transcription and translation, and the turnover ofproteins and RNA in cells with the relevant references presented in Section 3.

Viruses 2021, 13, 1735 4 of 18
2.3. Parameter Uncertainty Analysis
Through the process of model calibration, the point estimates of parameter valueswere determined, which were used in main simulations and are discussed in Section 3.For most of the model parameters, we were able to estimate the ranges of biologicallyplausible values based on literature data. For other parameters, we derived their rangesapplying the parameter uncertainty analysis. To this end, we iteratively adjusted theirparameter ranges so that they would include their point estimates while the uncertaintyof the model output (progeny release kinetics) would be confined within the range from10 to 10,000 virions, as specified in Table 1. For some parameters with wide literature-based ranges, we further narrowed them down to restrict the output uncertainty. Thesethree categories of parameter ranges (based on literature analysis, based on uncertaintyanalysis, based on both types of analysis), as well as parameters which are fixed ad hoc,are reviewed in Section 3 accordingly. To quantify the output uncertainty, we employedthe Latin hypercube sampling method to randomly sample n = 10,000 combinations ofparameters from their respective ranges. Then, the median and 5–95% confidence regionsof the obtained ensemble of [Vreleased](t) trajectories were computed.
2.4. Sensitivity Analysis
Let u(t, p) be the model solution of the ODE initial value problem dudt = f(t, u, p),
u(0) = u0. In this study, we apply the methods of local sensitivity analysis to identify theparameters (and respective biochemical processes) that have the most strong impact on thecharacteristics of interest Φ(u(p)), e.g., the cumulative number of released virions
Φprogeny =∫ T
0krelease[Vassembled]dt,
the area under the curve for [Vreleased](t)
ΦAUCprogeny(p) =
∫ T
0[Vreleased]dt,
or the distance between the model output g(u(p)) and the experimental data gexp(ti)
Φ = ∑i||g(u(ti))− gexp(ti)||2.
The sensitivity index of model parameter p is defined as sp = dΦ(p)dp . It indicates the
influence of parameter variation on the output value Φ. To compare sensitivities and rankparameters by their impact, the sensitivity indices are usually normalized by parametervalues: sp = p dΦ(p)
dp . The sensitivity indices can be computed by solving the forwardsensitivity ODE system or by solving the adjoint problem [26]. We follow the adjoint-basedapproach as previously described [10,26].
2.5. Software
The following packages in Julia language (https://julialang.org, accessed on12 May 2021) were used to simulate and analyze the model: DifferentialEquations.jl (ac-cessed on 12 May 2021) for numerical solution of the model, QuasiMonteCarlo.jl (accessedon 12 May 2021) for parameter uncertainty analysis, DiffEqSensitivity.jl (accessed on12 May 2021) for local sensitivity analysis, PyPlot.jl (accessed on 12 May 2021) for vi-sualizations. The scripts used to simulate and analyze the model are provided in theSupplementary Materials.
3. Results
We follow the latest view of the SARS-CoV-2 life cycle summarized in [1,17,18,27]. Thekey steps include: (i) cell entry, (ii) genome transcription and replication, (iii) translation of

Viruses 2021, 13, 1735 5 of 18
structural and accessory proteins, and (iv) assembly and release of virions (Figure 1). Theset of time-dependent molecular species described in the model is listed in Table 1 withsome quantitative characteristics of their abundance.
SARS-CoV-2
ACE2
Endosome
5' 3'
Nonstructuralproteins Double-membrane vesicles
5' 3'
5' 3'
3' 5'
3'
5'
Nucleocapsidproteins
Structuralproteins
ER
Golgi
Vesicles
Entry
Uncoating
Translation
Translation
Translation
Assembly
Assembly
Release
5' 3'
Transcription
Ribonucleocapsid
Transcription
Figure 1. Biochemical scheme of the SARS-CoV-2 replication cycle.
3.1. Mathematical Model of Intracellular SARS-CoV-2 Replication3.1.1. Cell Entry
The entry stage of SARS-CoV-2 is split into three steps as represented in Figure 1:
1. binding of the receptor-binding domain (RBD) of the viral S protein to the ACE2 receptor,2. priming by host cell surface protease TMPRSS2,3. fusion at the cellular or endosomal membrane followed by release and uncoating of
the viral genomic RNA.
Binding of the virion to the cellular transmembrane protein ACE2, and entry andrelease of the viral RNA into the host cell are described by equations specifying the rates ofchanges of free-, receptor-bound, and fused virions, as well as the viral RNA genome inthe cytoplasm:
d[Vf ree]
dt= −kbind[Vf ree]− dV [Vf ree] + kdiss[Vbound] (1)
d[Vbound]
dt= kbind[Vf ree]− (k f use + kdiss + dV)[Vbound] (2)
d[Vendosome]
dt= k f use[Vbound]− (kuncoat + dendosome)[Vendosome] (3)
d[gRNA(+)]
dt= kuncoat[Vendosome]− dgRNA[gRNA(+)]. (4)
Here, [Vf ree] is the number of free virions outside the cell membrane, [Vbound] is thenumber of virions bound to ACE2 and activated by TMPRSS2, [Vendosome] is the number ofvirions in endosomes, and [gRNA(+)] is the number of ss-positive sense genomic RNA.The respective parameters of the above equations are described in Table 2. In estimatingthe degradation rate of virions in endosomes, we followed the assumptions presented for
Viruses 2021, 13, 1735 6 of 18
modelling IAV infection [12], i.e., about 50% fail to release the viral genome. This givesdendosome = 0.06 h−1.
3.1.2. Genome Transcription and Replication
The SARS-CoV-2 virion consists of about a 30 kb strand of positive sense RNA coatedwith N protein and covered by a lipid bilayer containing spike S, membrane M, andenvelope E proteins [18]. The model was calibrated to reproduce (i) the scale of viralproteins production corresponding to about 10 to 10,000 infectious virions per cell, (ii) theobserved ratio of positive and negative sense viral RNA (genomic and subgenomic) [24],and (iii) the known ranges of the parameters of mRNA and protein turnover [28].
The released genomic RNA undergoes translation into viral polyproteins (pp1a, pp1ab)which generate via proteolysis 16 non-structural proteins (nsp1–16). They are operatingto form the viral replication and transcription complex. In particular, a key step is theformation of nsp12, which encodes the RNA-dependent RNA polymerase (RdRp). Theprimary function of the RdRp replication complex is to generate a negative sense full-lengthgenome and subgenomic RNAs. It has been established for MHV virus that synthesisof negative-sense RNA starts about 60 to 90 min post-infection and reaches a maximumat about 5 to 6 h [24,29]. The resulting set of negative-sense RNAs and the full-lengthantisense genome are working as templates for the synthesis of positive-sense genomicand subgenomic RNAs as shown in Figure 1. The total number of produced positive-senseviral genomes and subgenomic RNAs exceeds the number of negative-sense RNAs by 100to 1000 fold [24,29].
We describe the abundance of the populations of non-structural proteins [NSP], theset of negative sense genomic and subgenomic [gRNA(−)], and the set of positive sensegenomic and subgenomic [gRNA] with the following differential equations:
d[NSP]dt
= ktransl fORF1[gRNA(+)]− dNSP[NSP] (5)
d[gRNA(−)]
dt= ktr(−) [gRNA(+)]θRdRp − dgRNA(−) [gRNA(−)] (6)
d[gRNA]
dt= ktr(+)
[gRNA(−)]θRdRp − (kcomplexθcomplex + dgRNA)[gRNA] (7)
where
θRdRp =[NSP]
[NSP] + KNSP, θcomplex =
[N]
[N] + KN(8)
It is taken into account in Equation (5) that the non-structural proteins are translatedonly from the released genomic RNA. Similarly, the transcription of the negative-sensegenomic and subgenomic RNA described by Equation (6) is determined by the originalpositive-sense genomic RNA.
The translation rate ktransl = 45,360 nt/mRNA h−1 has been estimated for coro-naviruses in [24]. The length of the RNA genome coding for [NSP] proteins is about21,000 nucleotides [30], hence fORF1 = 1/21,000. These estimates are consistent with thegeneral range of protein synthesis rates: (1, 104) molecules/mRNA h−1 [28].
The degradation rate of NSPs dNSP = 0.069 h−1 is estimated as the geometric mean ofthe half-lives of proteins in cells. This result of our calibration procedure is consistent withthe finding that the lifetime of most proteins is just a few hours [28].
The transcription rates of negative sense genomic and subgenomic RNAs is estimatedto be ktr(−) = 3 copies/mRNA h−1. This is consistent with the transcription rate of mRNAswhich ranges from 1 to 100 copies per hour according to [28].
We assume the threshold for half-maximal rate of RdRp activity to be KNSP = 100 copies,taking into account that a small number of non-structural proteins is sufficient for enhancingthe transcription of vRNAs.
It is known that an average half-life of mRNAs in cells of vertebrates is about 3 h [31]and ranges from 1 to 10 h [28]. Hence, the decay rate of mRNAs can be in between

Viruses 2021, 13, 1735 7 of 18
[0.069, 0.69] h−1. We use here the following value dgRNA = 0.2 h−1. In addition, we assumea smaller value for the degradation rate of negative sense vRNAs in double-membranevesicles, dgRNA(−) = dgRNA/2 = 0.1 h−1.
Quantitative analysis of RNA polymerase elongation provides the estimate of thetranscription rate to be 46,080± 17,640 nt/h [32]. Thus, the basal rate of transcription isaround 46,080/30,000 nt/RNA h−1. In infected cells, however, the overall rate of viral RNAtranscription is amplified (around a 1000-fold increase) while transcription of host RNAsis largely silenced [30]. Therefore, we estimate ktr(+)
= 1000 copies/mRNA/h, whichmatches the observed ratio of positive- to negative-sense viral RNAs [24,29] (see the modelvalidation results at the end of this Section).
The kinetics of the nucleocapsid formation (i.e., viral RNA genome coated with Nprotein) resulting from the binding of N proteins and gRNA is characterized by the rateconstant kcomplex. This can be estimated from the binding data presented in [33]. The dataindicate a fast kinetics with a characteristic time of ≈20 s. Hence kcomplex ≈ 0.4 h−1, takinginto account that 1 virion consists of 38 ribonucleoprotein complexes each having about12 N proteins [21], nN = 38× 12 = 456.
The kinetics of formation of the nucleocapsid condensates from N proteins and gRNAhas been studied in [34,35]. The minimum concentration of N proteins necessary toform condensates has been estimated to be about 3.3 µM, and the concentration at whichthe formation slows down to be about 11 µM. These concentrations correspond to ap-proximately 1.5 and 5 million molecules, if we take 768 fL as the mean cell volume oftype II pneumocyte [2]. The estimate KN = 5× 10⁶ molecules implies that the saturationtakes place at the number of N proteins necessary to assemble around 11,000 virions(KN ≈ nN · 11,000).
3.1.3. Translation of Structural and Accessory Proteins
The structural proteins S, envelope E, and membrane M are translated from thepositive sense subgenomic RNAs at the endoplasmic reticulum (ER). They are describedin the model by their total abundance [SP]. They are considered to interact together andassist in forming virus-like particles and budding of new virions from the ER and Golgicompartments (ERIGC) [17]. The structural nucleocapsid protein N is translated fromsubgenomic RNAs by cytosolic ribosomes and can enhance the formation of virus-likeparticles [27]. Its key function is to create nucleocapsid [N-gRNA] by coating genomicRNAs. The number of N proteins per virion [N] in coronaviruses is estimated to rangefrom 730 to 2200 [19]. For SARS-CoV-2, however, the estimated number of N proteins pervirion is nN = 38× 12 = 456 [21].
The translation rates of [N] and [SP] proteins are described by the following two equations:
d[N]
dt= ktransl fN [gRNA]− kcomplexnNθcomplex[gRNA]− dN [N] (9)
d[SP]dt
= ktransl fSP[gRNA]− kassembnSPθassemb[N-gRNA]− dSP[SP] (10)
where
θassemb =[SP]
[SP] + KVrel nSP(11)
The scaling parameter fN = 1/1200 accounts for the length of the N-coding RNAwhich is about 1200 nucleotides (400 aa) [36]. Likewise, fSP = 1/10,000, as the estimatedRNA length for the structural proteins S, E, and M is about 10,000 nucleotides.
The degradation rate of N protein dN = 0.023 h−1 is estimated using the database [37].The degradation rate of the mixture of other structural proteins is evaluated to be arounddSP = 0.044 h−1. The plausible range [0.023, 0.36] h−1 is guessed using the half-lives ofN, M, E, and S proteins being about 30 and 1.9 h, respectively, in reticulocytes, and theirrelative molar ratio in a virion E:S:M = 1:20:300.

Viruses 2021, 13, 1735 8 of 18
The composition of a single virion requires the binding of about 456 N proteinmolecules to each positive-sense genomic RNA, nN = 456. The total number of structuralproteins S, M, E can be estimated to be in between 1125 to 2230 [19–21] with the referencenumber we used about 2000, i.e., nSP = 2000.
The scale of SARS-CoV-2 replication depends on the target cell type (e.g., bronchial,lung cells, enterocytes). The available estimates suggest that the duration of the single repli-cation cycle ranges from 7 to 24 h with the burst size in between 10 and 10,000 virions [2,22].Hence, we set KVrel = 1000 ∈ (10, 10,000). Similar to modelling studies on replication ofHIV-1 [10] and IAV [12], we estimate the following range for the rate of virion assemblingkassemb = 0.01–10 h−1.
3.1.4. Assembly and Release of Virions
The assembly of virions requires that nucleocapsid and viral envelope glycoproteinscoalesce into the same domain of the intracellular space [18]. The nucleocapsid core ofthe virion traffics to ERGIC and buds into ERGIC membranes covered with the structuralproteins. Thus, a lipid envelope of the virion is created. The genome packaging is mediatedby a packaging signal unique to genome length RNA.
As discussed above, the N proteins are key for incorporating viral RNA into viralprogeny particles [38,39]. There, the N-terminal RNA-binding domain binds the RNAand the C-terminal domain via interaction with the M protein functions to anchor theribonucleoprotein to the viral membrane [40].
The virions are assembled at the ER-Golgi compartment via encapsulating N-RNAcomplexes. Assembled new virions can exit the infected cell by exocytosis via the lysosomaltrafficking pathway, budding, or cell death [17].
The rates of changes of the ribonucleocapsid and the assembled and released virionsare described by the following equations:
d[N-gRNA]
dt= kcomplexθcomplex[gRNA]− (kassembθassemb + dN-gRNA)[N-gRNA] (12)
d[Vassembled]
dt= kassembθassemb[N-gRNA]− (krelease + dassembled)[Vassembled] (13)
d[Vreleased]
dt= krelease[Vassembled]− dV [Vreleased] (14)
We use the estimate of dgRNA for dN-gRNA = 0.2 h−1, taking into account that themajor component of ribonucleoprotein is ssRNA.
The direct measurements of the budding rate are not available yet. However, it hasbeen shown for in vitro systems to be a very fast process with a characteristic time of about2 s [41]. Hence, the following range is biologically plausible: krelease ∈ [8, 7200] h−1 [10].
As for the assembled virion death rate, we use the value dassembled = 0.06 h−1 estimatedfrom [42], which is equal to dendosome.
The overall list of model parameters with their reference values and permissibleranges is presented in Table 2. The solution of the model described by Equations (1)–(14)for [Vf ree](0) = 10 and the parameter values displayed in Table 2, is shown in Figure 2. It isconsistent with data presented in [24,43].
In this study, we analyze the model behaviour at the initial condition [Vf ree](0) = 10.This corresponds to high MOI scenario of in vitro experiments in tissue cultures that areperformed to estimate the burst size, i.e., the average number of virions produced by asingle infected cell during the complete replication cycle. High MOI is typically used toensure that every single cell gets infected and therefore only a single replication cycleoccurs, resulting in a “one-step” growth dynamics of released progeny [2].

Viruses 2021, 13, 1735 9 of 18
Table 2. Estimates of the calibrated model parameters. The parameter range categories are labelledas follows: ranges based on the analysis of (†) literature, (‡) uncertainty quantification, (†‡) both.
Parameter Description, Units Value Range, Relev. Refs.
kbind rate of virion binding to ACE2 receptor, h−1 12 (3.6, 12) † [44,45]
dV clearance rate of extracellular virions, h−1 0.12 (0.06, 3.5) † [42,46,47],tuned to (0.06, 0.2) †‡
kdiss dissociation rate constant of bound virions, h−1 0.61 (0.32, 1.08) † [44,45]
k f use fusion rate constant, h−1 0.5 (0.33, 1) † [48]
kuncoat uncoating rate constant, h−1 0.5 (0.33, 1) † [48]
dendosome degradation rate of virions in endosomes, h−1 0.06 [12,42], (0.0001, 0.12) ‡
ktransl translation rate, nt/mRNA h−1 45,360[24,28],(40,000, 50,000) ‡
1/ fORF1 length of ORF1 of the RNA genome coding [NSP], nt 21,000 fixed [30]
dNSP degradation rate of proteins in the cell, h−1 0.069 (0.023, 0.69) † [28,37],tuned to (0.023, 0.1) †‡
ktr(−)transcription rate of negative sensegenomic and subgenomic RNAs, copies/mRNA h−1 3 (1, 100) † [28],
tuned to (1, 20) †‡
KNSPthreshold number of [NSP]enhancing vRNA transcription, molecules 100 (10, 150) ‡
dgRNA degradation rate of positive sense RNAs in cell, h−1 0.2 (0.069, 0.69) † [28,31],tuned to (0.069, 0.4) †‡
dgRNA(−)degradation rate of negative sense RNAsin double-membrane vesicles, h−1 0.1 (0.05, 0.2) ‡
ktr(+)replication rate of positive sense RNAs, copies/mRNA/h 1000 (620, 1380) † [32]
kcomplex rate of the nucleocapsid formation [N-gRNA], h−1 0.4 (0.02, 0.4) † [21,33,49–51]
KNthreshold number of N proteinsat which nucleocapsid formation slows down, molecules 5× 10⁶ (3.5, 6.5)× 106 † [2,34,35]
1/ fN length of RNA genome coding N protein, nt 1200 fixed [36]
1/ fSP length of genome coding structural proteins S, E, M, nt 10,000 fixed [36]
dN degradation rate of N protein, h−1 0.023 (0.023, 0.069) † [37]
dSP mean degradation rate of the pool of E, S, M proteins, h−1 0.044 (0.023, 0.36) † [37]
nSPtotal number of structural proteins S, M, E per virion,molecules 2000 (1125, 2230) † [19–21]
nN number of N protein per virion, molecules 456 fixed [21]
KVrel
threshold number of virionsat which the virion assembly process slows down, virions 1000 (10, 10,000) † [2,22]
kassemb rate of virion assembling, h−1 1 (0.01, 10) † [10,12]
dN-gRNA degradation rate of ribonucleoprotein, h−1 0.2 (0.069, 0.69) † [28,31]
krelease rate of virion release via exocytosis, h−1 8 (8, 7200) † [10,41]
dassembled assembled virion degradation rate, h−1 0.06 [42], (0.0001, 0.12) ‡
The simulations cover the range of 24 h, which is informative for a single replicationcycle setting experimental data on SARS-CoV-2 replication [2,22,23]. However, the intervalcan be stretched via amending the parameter values to adjust more specific data forparticular cell types and infection conditions (e.g., Figure 3, right).
The model is validated by comparing its predictions against available experimentaldata as described in Methods section and shown in Figure 3.

Viruses 2021, 13, 1735 10 of 18
0 1 2 3 4 5t, hours
0
2
4
6
8
10
parti
cles
Binding and fusion[Vfree][Vbound]
0 5 10 15 20t, hours
0
1
2
3
4
num
bers
Endocytosis and uncoating[Vendosome][gRNA(+)]
0 5 10 15 20t, hours
0
10
20
30
40
mol
ecul
es
ORF1 translation and gRNA( ) synthesis[NSP][gRNA( )]
0 5 10 15 20t, hours
0100
101
102
103
104
105
106
mol
ecul
es
Transcription and translation
[gRNA][N]
0 5 10 15 20t, hours
0100
101
102
103
104
mol
ecul
es
Translation and nucleocapsid formation
[SP][N-gRNA]
0 5 10 15 20t, hours
0
100
101
102
parti
cles
Assembly and release[Vassembled][Vreleased]
Figure 2. Reference model solution with parameters estimated in Table 2, [Vf ree](0) = 10. It predictsthe kinetics of the viral replication intermediates. The upper row describes the cell entry statevariables, i.e., (upper left) the free virions outside the cell membrane and the virions bound to ACE2,and (upper right) virions in endosomes together with single strand positive sense genomic RNA.The middle row specifies the kinetics of negative sense viral genome transcription and translationof non-structural proteins (middle left) followed by the positive sense genomic RNA transcriptionand the translation of N-protein (middle right). The bottom row displays the translation of thestructural proteins and the ribonucleocapsid molecules formation (bottom left) resulting in creationof assembled virions in endosomes and the final release of virions (bottom right).
Viruses 2021, 13, 1735 11 of 18
1 2 3 4 5 6 7 8t, hours
101
102
103
ratio
Ratio of positive- to negative-sense vRNA([gRNA(+)] + [gRNA])/[gRNA( )]exp. (MOI=10, rep. 1)exp. (MOI=10, rep. 2)
10 20 30 40 50t, hours
100
101
102
fold
cha
nge
Progeny release kinetics
model ([Vfree](0) = 10)model ([Vfree](0) = 15)exp. 1 (MOI=3)exp. 2 (MOI=5, isolate)exp. 2 (MOI=5, WT)exp. 2 (MOI=5, GFP)exp. 2 (MOI=5, nLuc-GFP)
Figure 3. Validation of the calibrated model against available experimental data. (Left) ratio ofpositive- to negative-sense vRNA predicted by the model and measured in MHV-infected cells atMOI = 10 in [24]. (Right) SARS-CoV-2 progeny release kinetics in Vero E6 cells from [23,25] expressedin fold changes of the titer levels in cell culture from the start of their exponential growth. For modelpredictions, the moment of release onset was defined as the moment ts at which [Vreleased](ts) = 1.The initial conditions were chosen to match the MOI used in experiments, i.e., so that the maximumnumber of uncoated [gRNA(+)] ≈MOI.
3.2. Sensitivity Analysis
To evaluate the model response to parameter variations, a systematic sensitivityanalysis of three model characteristics is performed. First, we assess the uncertainty ofpredicted progeny release kinetics caused by variations of the initial condition and modelparameters in plausible ranges. Next, we identify the model parameters which have themost control over (1) the ratio of positive- to negative-sense viral RNAs and (2) the totalnumber of virions released by 24 h post-infection.
3.2.1. Uncertainty Analysis of the Progeny Release Kinetics
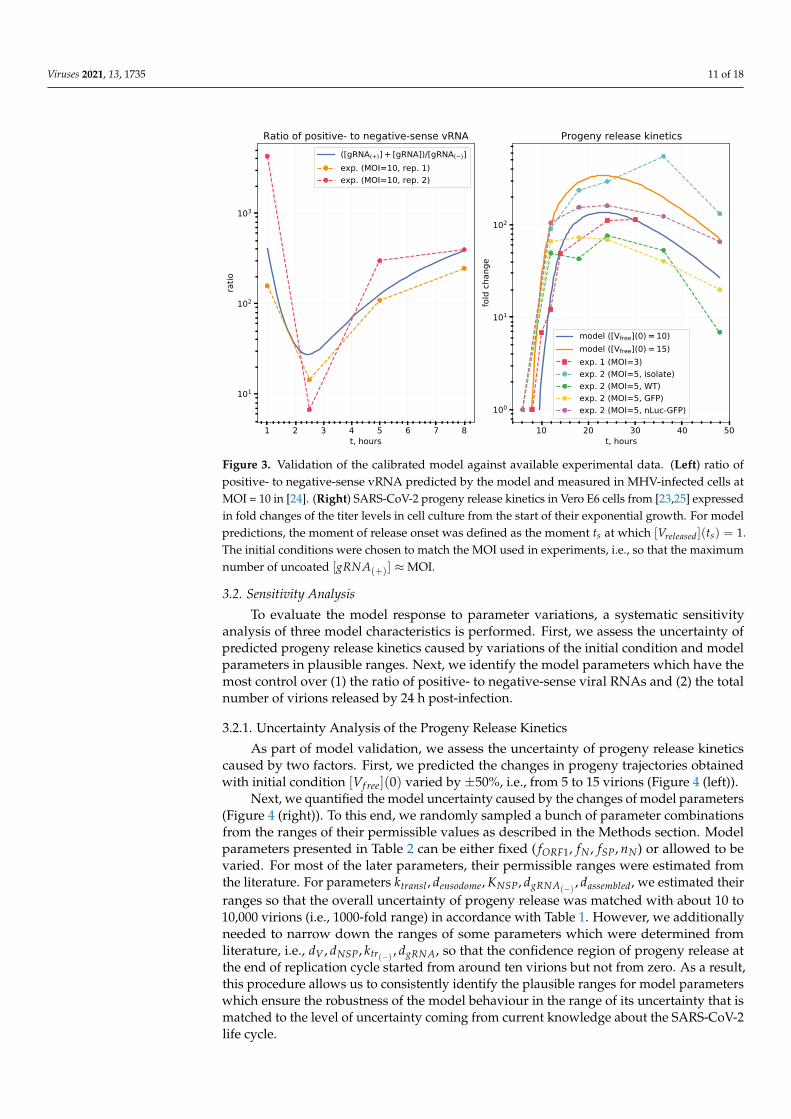
As part of model validation, we assess the uncertainty of progeny release kineticscaused by two factors. First, we predicted the changes in progeny trajectories obtainedwith initial condition [Vf ree](0) varied by ±50%, i.e., from 5 to 15 virions (Figure 4 (left)).
Next, we quantified the model uncertainty caused by the changes of model parameters(Figure 4 (right)). To this end, we randomly sampled a bunch of parameter combinationsfrom the ranges of their permissible values as described in the Methods section. Modelparameters presented in Table 2 can be either fixed ( fORF1, fN , fSP, nN) or allowed to bevaried. For most of the later parameters, their permissible ranges were estimated fromthe literature. For parameters ktransl , densodome, KNSP, dgRNA(−) , dassembled, we estimated theirranges so that the overall uncertainty of progeny release was matched with about 10 to10,000 virions (i.e., 1000-fold range) in accordance with Table 1. However, we additionallyneeded to narrow down the ranges of some parameters which were determined fromliterature, i.e., dV , dNSP, ktr(−) , dgRNA, so that the confidence region of progeny release atthe end of replication cycle started from around ten virions but not from zero. As a result,this procedure allows us to consistently identify the plausible ranges for model parameterswhich ensure the robustness of the model behaviour in the range of its uncertainty that ismatched to the level of uncertainty coming from current knowledge about the SARS-CoV-2life cycle.

Viruses 2021, 13, 1735 12 of 18
0 5 10 15 20t, hours
0100
101
102
virio
ns
Progeny release kinetics at various [Vfree](0)[Vfree](0) = 5[Vfree](0) = 6[Vfree](0) = 7[Vfree](0) = 8[Vfree](0) = 9[Vfree](0) = 10[Vfree](0) = 11[Vfree](0) = 12[Vfree](0) = 13[Vfree](0) = 14[Vfree](0) = 15
0 5 10 15 20t, hours
0100
101
102
103
104
virio
ns
Parameter uncertainty in progeny release kineticsmedian ([Vreleased](t))5%-95% confidence region
Figure 4. Uncertainty in the model output (progeny release kinetics). (Left) uncertainty associatedwith variation of the initial condition [Vf ree](0). (Right) uncertainty associated with variation ofmodel parameters in the ranges specified in Table 2.
3.2.2. Parameters Controlling the Ratio of Positive- to Negative-Sense vRNAs
Given the good agreement of the calibrated model with available data on the kineticsof positive- to negative-sense vRNA ratio (Figure 3), we asked which model parametersdetermine this ratio. To this end, we analyze parameter sensitivity towards the followingdistance Φratio(p) between the ratio predicted by the model rm(ti) and ratios rexp(1)(ti) andrexp(2)(ti) from the two-replicate experiment [24]:
Φratio(p) =∑i
(log10(rm(ti))− log10(rexp(1)(ti))
)2+
∑i
(log10(rm(ti))− log10(rexp(2)(ti))
)2, rm(t) =
[gRNA(+)](t) + [gRNA](t)[gRNA(−)](t)
.
The nonzero normalized sensitivity indices towards Φratio are shown in Figure 5. Thefollowing parameters have the largest effect on the discrepancy between the modelled andexperimentally obtained ratio of positive- to negative-sense vRNA:
• threshold number of [NSP] enhancing vRNA transcription,• translation rate of non-structural proteins,• rates of fusion and uncoating,• replication rate of positive sense RNAs.
0.0 0.1 0.2 0.3 0.4 0.5
Normalized sensitivities (negative effect on ratio(p))
ktranslfORF1
kfuse
kuncoat
ktr(+)
ktr( )
kbind
dgRNA( )
KN
kcomplexnN
dN
pddp
0.0 0.1 0.2 0.3 0.4 0.5
Normalized sensitivities (positive effect on ratio(p))
KNSP
dgRNA
kdiss
dV
dNSP
dendosome
kcomplex
ktranslfN
pddp
Figure 5. Local normalized sensitivity indices having negative (left) and positive (right) effects onthe objective function Φratio(p), i.e., on discrepancy between model and experiment.
Viruses 2021, 13, 1735 13 of 18
3.2.3. Predicting Novel Antiviral Targets That Control Progeny Production
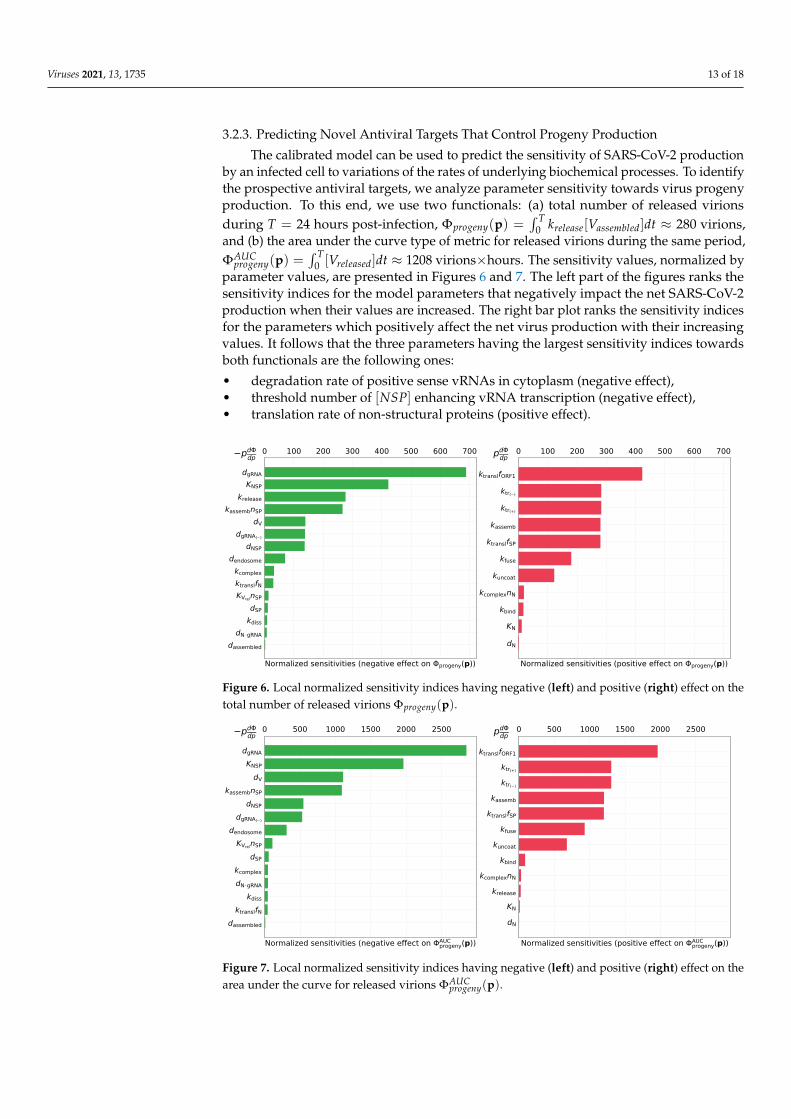
The calibrated model can be used to predict the sensitivity of SARS-CoV-2 productionby an infected cell to variations of the rates of underlying biochemical processes. To identifythe prospective antiviral targets, we analyze parameter sensitivity towards virus progenyproduction. To this end, we use two functionals: (a) total number of released virionsduring T = 24 hours post-infection, Φprogeny(p) =
∫ T0 krelease[Vassembled]dt ≈ 280 virions,
and (b) the area under the curve type of metric for released virions during the same period,ΦAUC
progeny(p) =∫ T
0 [Vreleased]dt ≈ 1208 virions×hours. The sensitivity values, normalized byparameter values, are presented in Figures 6 and 7. The left part of the figures ranks thesensitivity indices for the model parameters that negatively impact the net SARS-CoV-2production when their values are increased. The right bar plot ranks the sensitivity indicesfor the parameters which positively affect the net virus production with their increasingvalues. It follows that the three parameters having the largest sensitivity indices towardsboth functionals are the following ones:
• degradation rate of positive sense vRNAs in cytoplasm (negative effect),• threshold number of [NSP] enhancing vRNA transcription (negative effect),• translation rate of non-structural proteins (positive effect).
0 100 200 300 400 500 600 700
Normalized sensitivities (negative effect on progeny(p))
dgRNAKNSP
kreleasekassembnSP
dVdgRNA( )
dNSPdendosome
kcomplexktranslfNKVrelnSP
dSPkdiss
dN gRNAdassembled
pddp
0 100 200 300 400 500 600 700
Normalized sensitivities (positive effect on progeny(p))
ktranslfORF1
ktr( )
ktr(+)
kassemb
ktranslfSP
kfuse
kuncoat
kcomplexnN
kbind
KN
dN
pddp
Figure 6. Local normalized sensitivity indices having negative (left) and positive (right) effect on thetotal number of released virions Φprogeny(p).
0 500 1000 1500 2000 2500
Normalized sensitivities (negative effect on AUCprogeny(p))
dgRNA
KNSP
dV
kassembnSP
dNSP
dgRNA( )
dendosome
KVrelnSP
dSP
kcomplex
dN gRNA
kdiss
ktranslfNdassembled
pddp
0 500 1000 1500 2000 2500
Normalized sensitivities (positive effect on AUCprogeny(p))
ktranslfORF1
ktr(+)
ktr( )
kassemb
ktranslfSP
kfuse
kuncoat
kbind
kcomplexnN
krelease
KN
dN
pddp
Figure 7. Local normalized sensitivity indices having negative (left) and positive (right) effect on thearea under the curve for released virions ΦAUC
progeny(p).

Viruses 2021, 13, 1735 14 of 18
4. Discussion
In this work, we have developed and calibrated a deterministic model of the SARS-CoV-2 life cycle at the level of the infected cell. The mathematical model describes theintracellular biochemistry underlying the replication of the virus. The model can be usedas a part of multiscale models of the within-host SARS-CoV-2 infection, which are expectedto provide a quantitative analytical tool to reveal complex pathogenetic mechanisms ofCOVID-19 following a systems approach [3].
The developed model predicts the dynamics of intracellular replication cycle of SARS-CoV-2 in target cells. The high initial condition of free infectious virions used in the papercorresponds to in vitro experimental studies of viral replication cycle with high MOI. Thisfacilitates comparisons of model predictions of the dynamics of new viral progeny withthose that would be estimated in future experimental setups. In such high MOI conditions,the entry of virions is very rapid [2]. In vivo, however, cells can be infected with a wideranging number of free virions. Moreover, the expression of ACE2 on epithelial cells ofvarious types and in different organs varies substantially [23,52], which would result indifferent kinetics of the virus entry. Therefore, the density of ACE2 on a cell membraneshould be considered in the models of infection spreading within the human host organism.Furthermore, the lower the MOI, the more prevalent are stochastic effects at the earlyreplication stages that result in the heterogeneity of the overall dynamics [53]. Thus, topredict the virus transmission in vivo, the multiscale hybrid models need to be developedthat would incorporate the stochastic description of the intracellular SARS-CoV-2 life cycle.
Although many studies have been performed to characterize various aspects of theSARS-CoV-2 life cycle, detailed kinetics data similar to those available for HIV-1 [54] donot exist yet. Hence, the data “. . . to characterize the emergence of the viral replicationintermediates and their impact on the cellular transcriptional response with high temporalresolution” [54] are urgently needed. In COVID-19, the virus infects multiple target cellsexpressing ACE2 including type I and II pneumocytes, alveolar macrophages, monocytes,endothelial cells, and airway epithelial cells, particularly of the mucous glands. To progressfurther with the development of relevant multiscale mathematical models, all these celltypes need to be characterized with respect to the SARS-CoV-2 life cycle. For reviews onexperimental models which are developed to study SARS-CoV-2 replication in cultures ofvarious target cells, we refer to [55–58].
The deterministic quantitative description of the SARS-CoV-2 life cycle in the modelestablishes a mechanistic basis for the development of a stochastic description of the processkinetics using the Monte Carlo framework. This is required as many of the replicationstages are characterized by low numbers of reactants and hence, the impact of randomeffects on the reaction kinetics is strong. The insight provided by stochastic models ofinfluenza, hepatitis, and HIV infections [12,59] can be utilized in a similar way for SARS-CoV-2 modelling.
In our model, we do not consider spatial and transport aspects of the SARS-CoV-2replication in the infected cell. An example of a stochastic approach to modelling theintracellular spatio-temporal dynamics of HIV-1 replication describing the microtubuletransport of viral components is provided in [60]. In the case of SARS-CoV-2, adding thespatial dimension to the model would include the creation of replication compartments(e.g., double-membrane vesicles), intracellular trafficking (e.g., via the secretory pathway,and the molecular interactions with host proteins and innate immune responses [17]. Forexample, ORF3b, ORF6, and N proteins are known to interfere at multiple levels to inhibitthe IFN-signalling pathway. The accumulation of viral factors leading to infected celldeath via various mechanisms (apoptosis, necrosis, and pyroptosis) are not considered.These all require further analysis and strongly depend on the availability of appropriatequantitative data.
The developed mathematical model does not consider full details of subgenomicRNAs transcription and translation processes, and hence, the interaction of the encodedviral proteins with the intracellular defence mechanisms. The model needs to be linked to

Viruses 2021, 13, 1735 15 of 18
the cell physiology by considering the impact of virus infection on the codon usage, thecell metabolism, and the infected cell fate.
At present, there are no effective therapies against SARS-CoV-2 infection and computa-tional modelling is used to assist with drug repurposing attempts [27]. Here, we have usedour calibrated model to predict optimal targets for antiviral therapy. For this, all modelparameters were ranked according to their contribution to the production of new virionsby an infected cell using local sensitivity analysis. Parameters with the greatest negativeand positive effects on virus progeny generation were identified. The three most influentialparameters are (i) degradation rate of positive sense vRNAs in cytoplasm (negative effect),(ii) threshold number of non-structural proteins enhancing vRNA transcription (negativeeffect), and (iii) translation rate of non-structural proteins (positive effect). These parame-ters regulate the kinetics of various stages of the SARS-CoV-2 life cycle. Overall, systematicanalyses of virus replication cycles with mathematical models of increasing level of detailshould provide an efficient and rational way to define novel antiviral targets for therapies.
A quantitative mathematical description of the SARS-CoV-2 life cycle is a necessarystep in gaining a predictive understanding of the regulatory mechanisms underlyingthe molecular biology of the virus and defining potential targets for inhibitors of thevirus replication. Indeed, the sensitivity analysis of the model enables the prediction ofpotential targets for further experimental consideration, thus assisting the drug discoveryor repurposing efforts. In fact, the derived model identifies such targets. The in silicomodel provides an analytical tool to examine the effects of certain virus mutations (e.g., theincrease in affinity to ACE2 receptor) or combinations of multiple mutations on the viralprogeny and drug resistance in advance of experiments. Finally, the model of SARS-CoV-2replication being properly expanded in a question-driven manner could assist in gainingmechanistic insights into the robustness/fragility of intracellular defence mechanisms andthe net outcomes of multi-modal therapeutic impacts which affect the specific stages ofvirus life cycle and the infected cell physiology.
Supplementary Materials: The following are available at https://www.mdpi.com/article/10.3390/v13091735/s1.
Author Contributions: Conceptualization, G.B., A.M. and D.G.; methodology, D.G., I.S. and G.B.;software, D.G.; validation, D.G. and I.S.; data curation, D.G., E.K. and I.S.; writing—review andediting, D.G., I.S., A.K., A.M. and G.B.; funding acquisition, G.B. All authors have read and agreed tothe published version of the manuscript.
Funding: The reported study was funded by RFBR according to the research project numbers 20-04-60157 and 20-01-00352. AM is also supported by the Spanish Ministry of Science and Innovationgrant no. PID2019-106323RB-I00(AEI/MINEICO/FEDER, UE), and “Unidad de Excelencia María deMaeztu”, funded by the AEI (CEX2018-000792-M). G.B. and D.G. were partly supported by MoscowCenter for Fundamental and Applied Mathematics (agreement with the Ministry of Education andScience of the Russian Federation No. 075-15-2019-1624).
Data Availability Statement: Not applicable.
Acknowledgments: We thank the reviewers for their valuable suggestions on improving the clarityof the study.
Conflicts of Interest: The authors declare no conflict of interest. The funders had no role in the designof the study; in the collection, analyses, or interpretation of data; in the writing of the manuscript, orin the decision to publish the results.
AbbreviationsThe following abbreviations are used in this manuscript:
SARS-CoV-2 Severe acute respiratory syndrome coronavirus 2ODE Ordinary differential equationsMHV Murine hepatitis virusMOI Multiplicity of infection

Viruses 2021, 13, 1735 16 of 18
References1. Machhi, J.; Herskovitz, J.; Senan, A.M.; Dutta, D.; Nath, B.; Oleynikov, M.D.; Blomberg, W.R.; Meigs, D.D.; Hasan, M.;
Patel, M.; et al. The Natural History, Pathobiology, and Clinical Manifestations of SARS-CoV-2 Infections. J. NeuroimmunePharmacol. 2020, 15, 359–386. [CrossRef]
2. Bar-On, Y.M.; Flamholz, A.; Phillips, R.; Milo, R. SARS-CoV-2 (COVID-19) by the numbers. eLife 2020, 9, e57309. [CrossRef]3. Sego, T.J.; Aponte-Serrano, J.O.; Ferrari Gianlupi, J.; Heaps, S.R.; Breithaupt, K.; Brusch, L.; Crawshaw, J.; Osborne, J.M.;
Quardokus, E.M.; Plemper, R.K.; et al. A modular framework for multiscale, multicellular, spatiotemporal modeling of acuteprimary viral infection and immune response in epithelial tissues and its application to drug therapy timing and effectiveness.PLoS Comput. Biol. 2020, 16, e1008451. [CrossRef] [PubMed]
4. Li, C.; Xu, J.; Liu, J.; Zhou, Y.; Li, C.; Xu, J.; Liu, J.; Zhou, Y. The within-host viral kinetics of SARS-CoV-2. Math. Biosci. Eng. 2020,17, 2853–2861. [CrossRef] [PubMed]
5. Wang, S.; Pan, Y.; Wang, Q.; Miao, H.; Brown, A.N.; Rong, L. Modeling the viral dynamics of SARS-CoV-2 infection. Math. Biosci.2020, 328, 108438. [CrossRef]
6. Hernandez-Vargas, E.A.; Velasco-Hernandez, J.X. In-host Mathematical Modelling of COVID-19 in Humans. Annu. Rev. Control2020, 50, 448–456. [CrossRef]
7. Liang, K. Mathematical model of infection kinetics and its analysis for COVID-19, SARS and MERS. Infect. Genet. Evol. 2020,82, 104306. [CrossRef]
8. Kim, K.S.; Ejima, K.; Iwanami, S.; Fujita, Y.; Ohashi, H.; Koizumi, Y.; Asai, Y.; Nakaoka, S.; Watashi, K.; Aihara, K.; et al. Aquantitative model used to compare within-host SARS-CoV-2, MERS-CoV, and SARS-CoV dynamics provides insights into thepathogenesis and treatment of SARS-CoV-2. PLoS Biol. 2021, 19, e3001128. [CrossRef] [PubMed]
9. Perelson, A.S.; Ke, R. Mechanistic Modeling of SARS-CoV-2 and Other Infectious Diseases and the Effects of Therapeutics. Clin.Pharmacol. Ther. 2021, 109, 829–840. [CrossRef] [PubMed]
10. Shcherbatova, O.; Grebennikov, D.; Sazonov, I.; Meyerhans, A.; Bocharov, G. Modeling of the HIV-1 Life Cycle in ProductivelyInfected Cells to Predict Novel Therapeutic Targets. Pathogens 2020, 9, 255. [CrossRef]
11. Fatehi, F.; Bingham, R.J.; Dykeman, E.C.; Patel, N.; Stockley, P.G.; Twarock, R. An Intracellular Model of Hepatitis B Viral Infection:An In Silico Platform for Comparing Therapeutic Strategies. Viruses 2020, 13, 11. [CrossRef]
12. Heldt, F.S.; Kupke, S.Y.; Dorl, S.; Reichl, U.; Frensing, T. Single-cell analysis and stochastic modelling unveil large cell-to-cellvariability in influenza A virus infection. Nat. Commun. 2015, 6, 8938. [CrossRef]
13. Aunins, T.R.; Marsh, K.A.; Subramanya, G.; Uprichard, S.L.; Perelson, A.S.; Chatterjee, A. Intracellular Hepatitis C Virus ModelingPredicts Infection Dynamics and Viral Protein Mechanisms. J. Virol. 2018, 92, e02098-17. [CrossRef]
14. Teufel, A.I.; Liu, W.; Draghi, J.A.; Cameron, C.E.; Wilke, C.O. Modeling poliovirus replication dynamics from live time-lapsesingle-cell imaging data. Sci. Rep. 2021, 11, 9622. [CrossRef]
15. Bocharov, G.; Casella, V.; Argilaguet, J.; Grebennikov, D.; Güerri-Fernandez, R.; Ludewig, B.; Meyerhans, A. Numbers Game andImmune Geography as Determinants of Coronavirus Pathogenicity. Front. Cell. Infect. Microbiol. 2020, 10, 559209. [CrossRef]
16. Finkel, Y.; Gluck, A.; Nachshon, A.; Winkler, R.; Fisher, T.; Rozman, B.; Mizrahi, O.; Lubelsky, Y.; Zuckerman, B.; Slobodin, B.; et al.SARS-CoV-2 uses a multipronged strategy to impede host protein synthesis. Nature 2021, 594, 240–24 . [CrossRef]
17. V’kovski, P.; Kratzel, A.; Steiner, S.; Stalder, H.; Thiel, V. Coronavirus biology and replication: implications for SARS-CoV-2. Nat.Rev. Microbiol. 2021, 19, 155–170. [CrossRef]
18. Hartenian, E.; Nandakumar, D.; Lari, A.; Ly, M.; Tucker, J.M.; Glaunsinger, B.A. The molecular virology of coronaviruses. J. Biol.Chem. 2020, 295, 12910–12934. [CrossRef]
19. Neuman, B.W.; Kiss, G.; Kunding, A.H.; Bhella, D.; Baksh, M.F.; Connelly, S.; Droese, B.; Klaus, J.P.; Makino, S.; Sawicki, S.G.; et al.A structural analysis of M protein in coronavirus assembly and morphology. J. Struct. Biol. 2011, 174, 11–22. [CrossRef]
20. Yao, H.; Song, Y.; Chen, Y.; Wu, N.; Xu, J.; Sun, C.; Zhang, J.; Weng, T.; Zhang, Z.; Wu, Z.; et al. Molecular Architecture of theSARS-CoV-2 Virus. Cell 2020, 183, 730–738.e13. [CrossRef]
21. Klein, S.; Cortese, M.; Winter, S.L.; Wachsmuth-Melm, M.; Neufeldt, C.J.; Cerikan, B.; Stanifer, M.L.; Boulant, S.; Bartenschlager,R.; Chlanda, P. SARS-CoV-2 structure and replication characterized by in situ cryo-electron tomography. Nat. Commun. 2020,11, 5885. [CrossRef]
22. Gordon, D.E.; Hiatt, J.; Bouhaddou, M.; Rezelj, V.V.; Ulferts, S.; Braberg, H.; Jureka, A.S.; Obernier, K.; Guo, J.Z.; Batra, J.; et al.Comparative host-coronavirus protein interaction networks reveal pan-viral disease mechanisms. Science 2020, 370, eabe9403.[CrossRef] [PubMed]
23. Hou, Y.J.; Okuda, K.; Edwards, C.E.; Martinez, D.R.; Asakura, T.; Dinnon, K.H.; Kato, T.; Lee, R.E.; Yount, B.L.;Mascenik, T.M.; et al. SARS-CoV-2 Reverse Genetics Reveals a Variable Infection Gradient in the Respiratory Tract. Cell 2020,182, 429–446.e14. [CrossRef]
24. Irigoyen, N.; Firth, A.E.; Jones, J.D.; Chung, B.Y.W.; Siddell, S.G.; Brierley, I. High-Resolution Analysis of Coronavirus GeneExpression by RNA Sequencing and Ribosome Profiling. PLoS Pathog. 2016, 12, e1005473. [CrossRef] [PubMed]
25. Ogando, N.S.; Dalebout, T.J.; Zevenhoven-Dobbe, J.C.; Limpens, R.W.; van der Meer, Y.; Caly, L.; Druce, J.; de Vries, J.J.C.; Kikkert,M.; Bárcena, M.; et al. SARS-coronavirus-2 replication in Vero E6 cells: Replication kinetics, rapid adaptation and cytopathology.J. Gen. Virol. 2020, 101, 925–940. [CrossRef] [PubMed]

Viruses 2021, 13, 1735 17 of 18
26. Marchuk, G.; Shutyaev, V.; Bocharov, G. Adjoint equations and analysis of complex systems: Application to virus infectionmodelling. J. Comput. Appl. Math. 2005, 184, 177–204. [CrossRef]
27. Poduri, R.; Joshi, G.; Jagadeesh, G. Drugs targeting various stages of the SARS-CoV-2 life cycle: Exploring promising drugs forthe treatment of Covid-19. Cell. Signal. 2020, 74, 109721. [CrossRef] [PubMed]
28. Buccitelli, C.; Selbach, M. mRNAs, proteins and the emerging principles of gene expression control. Nat. Rev. Genet. 2020,21, 630–644. [CrossRef]
29. Sawicki, S.G.; Sawicki, D.L.; Siddell, S.G. A Contemporary View of Coronavirus Transcription. J. Virol. 2007, 81, 20–29. [CrossRef]30. Kim, D.; Lee, J.Y.; Yang, J.S.; Kim, J.W.; Kim, V.N.; Chang, H. The Architecture of SARS-CoV-2 Transcriptome. Cell 2020,
181, 914–921.e10. [CrossRef]31. Lehninger, A.L.; Nelson, D.L.; Cox, M.M. Lehninger Principles of Biochemistry, 5th ed.; W.H. Freeman: New York, NY, USA, 2008.32. Adelman, K.; La Porta, A.; Santangelo, T.J.; Lis, J.T.; Roberts, J.W.; Wang, M.D. Single molecule analysis of RNA polymerase
elongation reveals uniform kinetic behavior. Proc. Natl. Acad. Sci. USA 2002, 99, 13538–13543. [CrossRef]33. Zinzula, L.; Basquin, J.; Bohn, S.; Beck, F.; Klumpe, S.; Pfeifer, G.; Nagy, I.; Bracher, A.; Hartl, F.U.; Baumeister, W. High-resolution
structure and biophysical characterization of the nucleocapsid phosphoprotein dimerization domain from the Covid-19 severeacute respiratory syndrome coronavirus 2. Biochem. Biophys. Res. Commun. 2021, 538, 54–62. [CrossRef] [PubMed]
34. Jack, A.; Ferro, L.S.; Trnka, M.J.; Wehri, E.; Nadgir, A.; Nguyenla, X.; Costa, K.; Stanley, S.; Schaletzky, J.; Yildiz, A. SARS-CoV-2nucleocapsid protein forms condensates with viral genomic RNA. bioRxiv 2021. [CrossRef]
35. Cubuk, J.; Alston, J.J.; Incicco, J.J.; Singh, S.; Stuchell-Brereton, M.D.; Ward, M.D.; Zimmerman, M.I.; Vithani, N.; Griffith, D.;Wagoner, J.A.; et al. The SARS-CoV-2 nucleocapsid protein is dynamic, disordered, and phase separates with RNA. Nat. Commun.2021, 12, 1936. [CrossRef] [PubMed]
36. Viehweger, A.; Krautwurst, S.; Lamkiewicz, K.; Madhugiri, R.; Ziebuhr, J.; Hölzer, M.; Marz, M. Direct RNA nanopore sequencingof full-length coronavirus genomes provides novel insights into structural variants and enables modification analysis. GenomeRes. 2019, 29, 1545–1554. [CrossRef] [PubMed]
37. Gasteiger, E.; Gattiker, A.; Hoogland, C.; Ivanyi, I.; Appel, R.D.; Bairoch, A. ExPASy: The proteomics server for in-depth proteinknowledge and analysis. Nucleic Acids Res. 2003, 31, 3784–3788. [CrossRef]
38. Khan, M.T.; Irfan, M.; Ahsan, H.; Ahmed, A.; Kaushik, A.C.; Khan, A.S.; Chinnasamy, S.; Ali, A.; Wei, D.Q. Structures ofSARS-CoV-2 RNA-Binding Proteins and Therapeutic Targets. Intervirology 2021, 64, 55–68. [CrossRef]
39. Khan, M.T.; Zeb, M.T.; Ahsan, H.; Ahmed, A.; Ali, A.; Akhtar, K.; Malik, S.I.; Cui, Z.; Ali, S.; Khan, A.S.; et al. SARS-CoV-2nucleocapsid and Nsp3 binding: An in silico study. Arch. Microbiol. 2021, 203, 59–66. [CrossRef]
40. Surjit, M.; Lal, S.K. The Nucleocapsid Protein of the SARS Coronavirus: Structure, Function and Therapeutic Potential. InMolecular Biology of the SARS-Coronavirus; Lal, S.K., Ed.; Springer: Berlin/Heidelberg, Germany, 2010; pp. 129–151. [CrossRef]
41. Mooney, J.; Thakur, S.; Kahng, P.; Trapani, J.G.; Poccia, D. Quantification of exocytosis kinetics by DIC image analysis of corticallawns. J. Chem. Biol. 2014, 7, 43–55. [CrossRef]
42. Baggen, J.; Persoons, L.; Vanstreels, E.; Jansen, S.; Van Looveren, D.; Boeckx, B.; Geudens, V.; De Man, J.; Jochmans, D.; Wauters,J.; et al. Genome-wide CRISPR screening identifies TMEM106B as a proviral host factor for SARS-CoV-2. Nat. Genet. 2021,53, 435–444. [CrossRef]
43. Lokugamage, K.G.; Hage, A.; de Vries, M.; Valero-Jimenez, A.M.; Schindewolf, C.; Dittmann, M.; Rajsbaum, R.; Menachery, V.D.Type I Interferon Susceptibility Distinguishes SARS-CoV-2 from SARS-CoV. J. Virol. 2020, 94, e01410-20. [CrossRef]
44. Ozono, S.; Zhang, Y.; Ode, H.; Sano, K.; Tan, T.S.; Imai, K.; Miyoshi, K.; Kishigami, S.; Ueno, T.; Iwatani, Y.; et al. SARS-CoV-2D614G spike mutation increases entry efficiency with enhanced ACE2-binding affinity. Nat. Commun. 2021, 12, 848. [CrossRef][PubMed]
45. Walls, A.C.; Park, Y.J.; Tortorici, M.A.; Wall, A.; McGuire, A.T.; Veesler, D. Structure, Function, and Antigenicity of the SARS-CoV-2Spike Glycoprotein. Cell 2020, 181, 281–292.e6. [CrossRef] [PubMed]
46. Bocharov, G.; Romanyukha, A. Mathematical Model of Antiviral Immune Response III. Influenza A Virus Infection. J. Theor. Biol.1994, 167, 323–360. [CrossRef] [PubMed]
47. Baccam, P.; Beauchemin, C.; Macken, C.A.; Hayden, F.G.; Perelson, A.S. Kinetics of Influenza A Virus Infection in Humans. J.Virol. 2006, 80, 7590–7599. [CrossRef]
48. Zhu, Y.; Yu, D.; Yan, H.; Chong, H.; He, Y. Design of Potent Membrane Fusion Inhibitors against SARS-CoV-2, an EmergingCoronavirus with High Fusogenic Activity. J. Virol. 2020, 94, e00635-20. [CrossRef]
49. Chen, I.J.; Yuann, J.M.P.; Chang, Y.M.; Lin, S.Y.; Zhao, J.; Perlman, S.; Shen, Y.Y.; Huang, T.H.; Hou, M.H. Crystal structure-basedexploration of the important role of Arg106 in the RNA-binding domain of human coronavirus OC43 nucleocapsid protein.Biochim. Biophys. Acta (BBA)-Proteins Proteom. 2013, 1834, 1054–1062. [CrossRef]
50. Spencer, K.A.; Hiscox, J.A. Characterisation of the RNA binding properties of the coronavirus infectious bronchitis virusnucleocapsid protein amino-terminal region. FEBS Lett. 2006, 580, 5993–5998. [CrossRef]
51. Spencer, K.A.; Dee, M.; Britton, P.; Hiscox, J.A. Role of phosphorylation clusters in the biology of the coronavirus infectiousbronchitis virus nucleocapsid protein. Virology 2008, 370, 373–381. [CrossRef]
52. Ziegler, C.G.; Allon, S.J.; Nyquist, S.K.; Mbano, I.M.; Miao, V.N.; Tzouanas, C.N.; Cao, Y.; Yousif, A.S.; Bals, J.; Hauser, B.M.; et al.SARS-CoV-2 Receptor ACE2 Is an Interferon-Stimulated Gene in Human Airway Epithelial Cells and Is Detected in Specific CellSubsets across Tissues. Cell 2020, 181, 1016–1035.e19. [CrossRef]

Viruses 2021, 13, 1735 18 of 18
53. Sazonov, I.; Grebennikov, D.; Kelbert, M.; Meyerhans, A.; Bocharov, G. Viral Infection Dynamics Model Based on a MarkovProcess with Time Delay between Cell Infection and Progeny Production. Mathematics 2020, 8, 1207. [CrossRef]
54. Mohammadi, P.; Desfarges, S.; Bartha, I.; Joos, B.; Zangger, N.; Muñoz, M.; Günthard, H.F.; Beerenwinkel, N.; Telenti, A.; Ciuffi, A.24 Hours in the Life of HIV-1 in a T Cell Line. PLoS Pathog. 2013, 9, e1003161. [CrossRef] [PubMed]
55. de Dios-Figueroa, G.T.; Aguilera-Marquez, J.d.R.; Camacho-Villegas, T.A.; Lugo-Fabres, P.H. 3D Cell Culture Models in COVID-19Times: A Review of 3D Technologies to Understand and Accelerate Therapeutic Drug Discovery. Biomedicines 2021, 9, 602.[CrossRef]
56. Heinen, N.; Klöhn, M.; Steinmann, E.; Pfaender, S. In Vitro Lung Models and Their Application to Study SARS-CoV-2 Pathogenesisand Disease. Viruses 2021, 13, 792. [CrossRef]
57. Synowiec, A.; Szczepanski, A.; Barreto-Duran, E.; Lie, L.K.; Pyrc, K. Severe Acute Respiratory Syndrome Coronavirus 2(SARS-CoV-2): A Systemic Infection. Clin. Microbiol. Rev. 2021, 34, e00133-20. [CrossRef]
58. Simoneau, C.R.; Ott, M. Modeling Multi-organ Infection by SARS-CoV-2 Using Stem Cell Technology. Cell Stem Cell 2020,27, 859–868. [CrossRef] [PubMed]
59. Andreu-Moreno, I.; Bou, J.V.; Sanjuán, R. Cooperative nature of viral replication. Sci. Adv. 2020, 6, eabd4942. [CrossRef]60. Cheng, Z.; Hoffmann, A. A stochastic spatio-temporal (SST) model to study cell-to-cell variability in HIV-1 infection. J. Theor.
Biol. 2016, 395, 87–96. [CrossRef]