intra-regional trade in africa and the...
TRANSCRIPT

1
INTRA-REGIONAL TRADE IN AFRICA AND THE IMPACT OF CHINESE
INTERVENTION: A GRAVITY MODEL APPROACH
Date: 14th June, 2014
By
Pooja Khosla
Master of Science in Economics for Development
University of Oxford

2
ABSTRACT
China’s trade with Africa has increased significantly in the past two decades. The effects of these
growing trade volumes (and financial flows) are quite contested. The purpose of this paper is to
study the effects of growing Chinese influence in Africa on the intra-regional trade in the
continent. The paper estimates a traditional gravity model using Poisson pseudo-maximum-
likelihood estimation method for a panel of 135 countries over the period 1990-2012. The
results show that African countries are marginalized from world trade. They trade less
compared to a non-African country with similar characteristics. Even though intra-regional
trade in Africa is quite low, the paper finds no evidence that these trade volumes are lower than
what would be expected (given the characteristics of these countries). However, the results
indicate that trade relations with China have distorted patterns of trade in Africa. The analysis
shows that Chinese presence has led African countries to import less from (and export less to)
other African countries. The massive influx of cheap Chinese goods into African markets
combined with preferential tariff treatment offered by the Chinese government to African
exporters may explain these patterns. The study also looks at how the effects of Chinese
engagement in Africa have changed over time. The results suggest that over the past decade, the
effects of China on intra-regional trade have become less negative. Since the late 1990’s, Chinese
investment in infrastructure, capacity building combined with high volumes of aid have helped
African countries overcome some of the infrastructural bottlenecks and could explain the
relatively higher intra-regional trade in the post-2000 period.

3
Contents
1. INTRODUCTION ........................................................................................................................................................................... 4
2. INTRA-REGIONAL TRADE AND IMPACT OF CHINA: EXISTING LITERATURE .................................................. 7
3. THE GRAVITY MODEL ............................................................................................................................................................... 9
4. DATA AND METHODOLOGY................................................................................................................................................. 11
Data ................................................................................................................................................................................................ 11
Estimation Method ................................................................................................................................................................... 11
Methodology ............................................................................................................................................................................... 12
5. RESULTS ....................................................................................................................................................................................... 14
6. ROBUSTNESS CHECKS ............................................................................................................................................................ 19
7. LIMITATIONS AND SCOPE FOR FURTHER RESEARCH ............................................................................................ 22
8. CONCLUSIONS ............................................................................................................................................................................ 23
APPENDIX 1: List of countries ................................................................................................................................................. 26
APPENDIX 2: Calculations for the effect of Chinese presence (Pre-2000 and Post-2000) ............................. 26
REFERENCES ................................................................................................................................................................................... 28
4
1. INTRODUCTION
China has grown at phenomenal rates in the last few decades. However, in order to sustain these
high growth rates, China needs to ensure a steady supply of natural resources like oils, minerals
etc. The country’s energy demands have more than doubled in the past few decades leading to
increasing pressures for meeting demands for natural resources1. These factors led China to
look oversees for sources of mineral resources and could explain the increasing involvement of
China in Africa since the late 1990s2. The NYU Wagner School Study concluded that ‘China’s
foreign aid is driven primarily by the need for natural resources’3. Similarly, Foster et al. (2008)
conclude that ‘most Chinese government-funded projects in Sub-Saharan Africa are ultimately
aimed at securing a flow of Sub-Saharan Africa’s natural resources for export to China.’
China-Africa trade has increased sharply since 2000. China’s bilateral trade with Africa grew
from USD 11 billion in 2000 to about USD 170 billion in 2011 (Direction of Trade Statistics, IMF
(2012)). China has gradually progressed from one of the smallest among the top 10 trading
partners of Africa to become its leading bilateral trade partner4. To promote trade with the
continent, China removed tariffs on 196 types of imports from 28 least developed Africa
countries in 2005. By 2007, this had expanded to 454 items5. Most African exports now receive
duty-free access to China’s market. These preferential tariff treatments have helped expand
African exports to China.
But most of the products for which China grants tariff exemption are principally raw materials.
Thus, most of the increased trade flows represent a rising export of natural resources to China.
About two-thirds of all African exports to China are oil and related products6. Africa showed a
USD 20 billion trade surplus with China in 2011. But more than three-quarters of the continent’s
exports were oil, gas, metals and minerals from only five countries - Sudan, Angola, Egypt,
Nigeria and South Africa. Excluding oil exports, Africa had a trade deficit with China amounting
to USD 28 billion in 20117. Thus, the growth of African exports to China is driven by a very few
countries. Apart from these few very resource-rich countries, the majority of African countries
1 Vines et al.(2009); Taylor(2009)
2 Berthélemy(2011); The Economist(2008); Mohan(2008); Marysee and Geenen(2009); Kaplinsky, McCormick and Morris(2006);
Meier zu Selhausen, F.(2010) 3 Lum et al.(2009:5)
4 Report on International and Intra-African Trade(2013), United Nations Economic and Social Council
5 Besada, H., Wang, Y., & Whalley, J.(2008)
6 Shinn, David H. (2007), ‘Africa, China, United States, and Oil’
7 G. Ballim (August/September 2012), ‘Made with China: This is Africa’

5
have ‘mounting trade deficits’ with China8. This highlights the asymmetry of the relationship
between China and African countries.
Chinese investment in Africa has also increased dramatically. From USD 20 million per year in
the early 1990s, Chinese FDI in Africa jumped close to USD 100 million in 2000 and reached
more than USD 1 billion in 20069. Most of these investments are focused on long-term access to
raw materials. Five resource-rich African countries - South Africa, Nigeria, Zambia, Algeria, and
Sudan accounted for 87 percent of Chinese FDI outflows on average during the four year period
of 2005 to 200810. Eisenman (2012) argues that almost all of Chinese investment into rail
projects in Africa is aimed at connecting African raw material suppliers with Chinese buyers and
Chinese goods manufacturers with African customers.
Since the late 1990s China’s aid to Africa has also increased significantly. There’s no consensus
in the literature so far regarding the determinants of Chinese aid to Africa. While Naím (2007)
argues that political and commercial interests are the principle determinants of Chinese aid to
Africa, Dreher and Fuchs (2011) argue that China is no different from other donors and Chinese
aid allocations are not dominated by natural resource considerations. However, a large number
of studies do suggest that Chinese aid is increasingly directed towards resource-rich Sub-
Saharan African economies11. The asymmetric patterns of aid and investment allocations could
lead to asymmetries in the patterns of infrastructural, institutional development in the continent
and this could affect patterns of intra-regional trade.
It is believed that the rising trade has a significant positive impact on the African economies. On
the export side, they gain from China’s demand for commodities. As Broadman (2007) argues,
the rising demand for raw materials by China has led to increased global commodity prices
thereby improving the terms of trade for African raw materials exporters. On the import side,
African countries benefit from the cheap consumption and capital goods12. However, cheap
products from China are also leading to the displacement of existing and potential local
producers thereby destroying local manufacturing capabilities and competitiveness.
Domestically produced clothing and furniture manufactures in both Ghana and South Africa are
8 Corkin, L., & Burke, C. (2006).
9 Zafar, A. (2007)
10 Meier zu Selhausen, F. (2010)
11 Kaplinsky, R., & Morris, M. (2009); Brookes, P., & Shin, J. H. (2006)
12 OECD (2006); Alden, (2007)

6
being displaced by imports from China13. In Ethiopia, a study of 96 micro, small and medium
domestic producers reported that as a consequence of Chinese competition, 28 percent were
forced into bankruptcy, and 32 percent downsized activity14.
On the other hand, Jenkins and Edwards (2006) argue that ‘most of these imports into Sub-
Saharan Africa have substituted for imports from outside of Sub-Saharan Africa, with the
possible exception of Ethiopia and Nigeria, suggesting little displacement of domestic
production and few negative impacts on employment and local production’. Rapid trade
expansion with China has benefitted African countries by opening up opportunities for export.
However, not all African countries have benefitted equally since African countries are differ
greatly in terms of their natural resource endowments (World Bank (2004b)).
Most of Chinese development and financial assistance is tied to the purchase of Chinese goods.
These, combined with the preferential tariff treatment, may have a trade creation effect
(increased exports to and imports from China). However, at the same time, they may also lead to
trade diversion (affecting not just Africa’s trade with other partners but also hampering
potential trade between African countries). China’s investment in Africa has been concentrated
in the development of natural-resource sector and infrastructure, both of which help advance
China-Africa trade volumes (but have played a limited role in helping the integration of African
countries with the rest of the world). Barma, Ratner and Weber also believe that trade volumes
between China and Africa are ‘in excess of what standard economic models of trade would
predict’15. Thus, China might be responsible for distorting patterns of intra-African trade. These
distortions could have serious implications for the welfare of the African population. If intra-
Africa trade levels are below their potential, it means that there may be gains to be realized from
increasing the amount of trade. African governments could enter into trade agreements that
increase the intra-regional trade thereby allowing African countries to reach higher levels of
welfare.
In this paper, I use a modified version of the strategy proposed by Foroutan and Pritchett (1993)
in their influential study ‘Intra-Sub-Saharan African Trade: is it too little?’16, to study the effect of
growing Chinese presence in the continent since the late 1990’s on intra-African trade volumes.
13
Kaplinsky, R., & Morris, M. (2008) 14
Kaplinsky, R., McCormick, D., & Morris, M.(2010) 15
Eisenman, J. (2012) 16
The authors estimate a traditional gravity model (using a Tobit estimation) to study if intra-Sub-Saharan African trade is higher or lower than what would one would expect based on the gravity model

7
I use the traditional gravity model to predict bilateral trade between the African countries and
see if intra-regional trade in Africa is above or below its predicted levels. I introduce additional
variables in the gravity model equation to account for Africa-specific factors. The coefficients for
these variables help to identify if trade patterns of the African countries differ from those of
similar17 non-African countries included in the sample - these differences indicating some sort of
distortions in African trade patterns. Finally, I also introduce China-specific factors to see if
these distortions in the patterns of bilateral trade can be explained by the rising Chinese
presence since 2000.
The remainder of this paper is organized as follows. Section 2 reviews the divergent views in the
existing literature regarding intra-regional trade in Africa and the effect of China. Section 3 lays
out the traditional gravity model of bilateral trade. Section 4 describes the data and the
methodology used in the paper. Section 5 looks at the results from the estimated model.
Robustness checks are included in Section 6. Section 7 discusses some limitations of the paper
and section 8 concludes.
2. INTRA-REGIONAL TRADE AND IMPACT OF CHINA: EXISTING LITERATURE
According to UNCTAD 2008 report on ‘Economic Development in Africa’, intra-regional trade
has never been an important source of trade for Africa, accounting for only 8 percent of total
exports in 2006. Some of the reasons for this, according to UNCTAD are - similarity of the
exports structures (most of them being commodity exporters), high transaction costs (poor
geography and infrastructure) and the presence of many barriers to trade.
The fact that these trade volumes are low does not necessarily imply that there are distortions in
trade patterns. As Foroutan and Pritchett (1993) note, the intra-regional trade in Sub-Saharan
Africa may be quite low, but taking into account the fact that most of these countries are very
poor with low populations, there seems to be no evidence that these trade volumes are lower
than what one would expect given the characteristics of these economies.
17
Defined as ‘similarity in economic, geographic, political, cultural factors’ that are included as determinants of trade in the gravity model

8
On the other hand, there are others who believe that intra-regional trade in Africa is below its
potential18 and in order to facilitate faster economic development in Africa, greater regional
integration is required. A large number of regional trade agreements have been signed in the
past decade19 to expand intra-regional trade and take advantages of economies of scale.
However, despite the existence of these agreements in the continent, intra-Africa trade remains
extremely low.
However, there are divergent views in this second group when it comes to assessing the impact
of China on intra-Africa trade. The growing engagement of China in the continent has led some
to believe that China could help Africa overcome its regional integration weaknesses. China’s
financing and construction of transport corridors, among other infrastructure development
projects, could help in promoting and furthering the process of regional integration20. However,
according to others, this may not be the case. Giovannetti and Sanfilippo (2009), using a
generalized methods of moments estimation21, show that rising exports from China to Africa
have come at the expense of intra-regional trade - with specific regard to intra-Sub-Saharan
African trade. According to the Africa Research Institute22, ‘efforts to promote intra-African trade
and integration are frustrated by the continued preference of China - and other trade partners - for
bilateral relations’. Similarly, Chinese clothing imports have not only reduced domestic
production in Kenya, but have also displaced imports from neighbouring countries, many of
which were previously produced by small-scale tailors, dressmakers, and knitters23.
Improving growth and development prospects of Africa is one of the prime concerns of the
world economy today. Given the uncertainty regarding the impact of Chinese presence on Africa,
it seems important to test these diverging views. If the effect of China on the intra-regional trade
is positive (maybe due to better infrastructure facilities), then the problem may not be as severe
as in the case when China has the effect of lowering this trade. The latter could imply that China
is distorting patterns of trade by diverting exports and imports away from neighbouring African
countries thereby preventing these countries from realizing gains from economies of scale etc. If
this is the case, then the African countries need to rethink their ‘China policies’ and probably
take steps to promote greater regional integration with the other African countries.
18
Potential trade refers to expected trade, given the economic, geographical, cultural characteristics of the countries concerned 19
There were over 30 RTAs in Africa at end of 2005 (http://www.indoAfrican.org/Regional%20Trade%20Agreement.pdf) 20
‘China as a driver of regional integration in Africa: Prospects for the future’ (http://www.ccs.org.za/wp-content/uploads/2009/06/ china-as-a-driver-of-regional-integration-in-Africa_dbsa-conference-report.pdf) 21
The authors estimate an augmented gravity model with product level disaggregated data 22
‘Between extremes China and Africa’ (Briefing Note 1202 October 2012) 23
McCormick et al. (2007) for the case of Kenya

9
3. THE GRAVITY MODEL
The theoretical justifications of the gravity model have been disputed quite often but
empirically, the model has been quite successful in explaining the patterns of bilateral trade
observed today24. According to the traditional gravity model, the bilateral trade between two
countries is an increasing function of the incomes of both the countries and a decreasing
function of the distance between the two countries. The gross domestic product (GDP) of the
exporting country indicates the supply capacity whereas the importing country’s GDP indicates
the total demand. Transport costs are a major determinant of the bilateral trade between two
countries and distance can be considered as a proxy for these transport costs25. It is common to
include a dummy for whether countries share a common border. The effect of this variable on
trade is expected to be positive as sharing a border implies lower transportation costs. Cultural
and historical factors are often included in the gravity model. If the two countries share a
common language, it is likely to increase trade by facilitating communications and making
transactions easier. Similarly, if two countries share colonial links, one would expect these
colonial links to have a positive impact on bilateral trade volumes. However, certain forms of
colonialism promoted bilateral trade with the European metropole at the expense of trade with
other countries. The effect of colonial link is therefore ambiguous. Being landlocked can have a
detrimental effect on the trade volumes by increasing transport costs. Certain policy choices,
such as the existence of preferential trade arrangements between two countries, are likely to
improve bilateral trade between the countries. Larger distances to all other countries might also
increase bilateral trade between two countries (because they do not have alternative trading
partners). Thus, a remoteness index is often included in the gravity model equation. This
remoteness variable can be considered as a proxy for ‘multilateral resistance’. The importance of
multilateral resistance as a determinant of bilateral trade was emphasized by Anderson and van
Wincoop (2003). An alternative strategy for doing this is to introduce country fixed effects.
However, this gets rid of time-invariant factors like distance, border etc. from the estimation and
hence renders this technique unsuitable for analyzing the effects of Chinese intervention.
The traditional gravity model (in logarithmic terms) can be represented by the following
equation:
24
Bergstrand (1989), Anderson and van Wincoop (2003), Helpman et al. (2008) 25
Geographical distance may be a poor approximation of all the economic barriers for international trade. The gravity model is therefore augmented with other variables to account for policy and political barriers that hamper trade
10
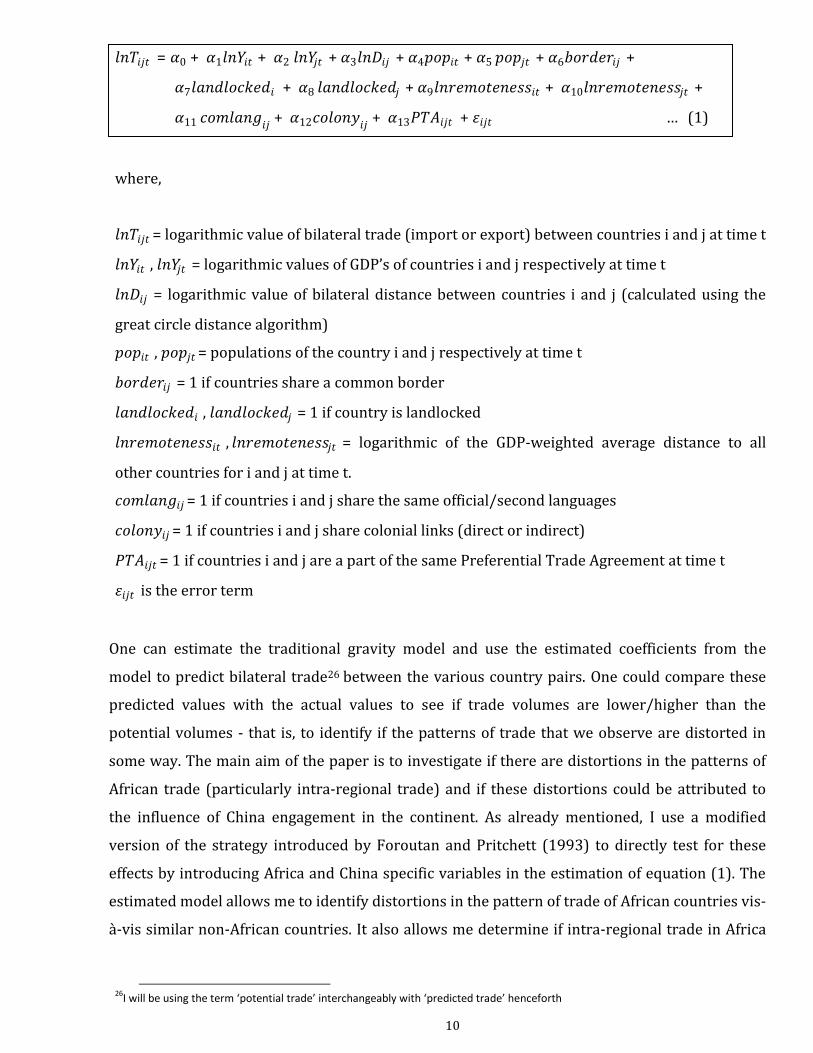
𝑙𝑛𝑇𝑖𝑗𝑡 = 𝛼0 + 𝛼1𝑙𝑛𝑌𝑖𝑡 + 𝛼2 𝑙𝑛𝑌𝑗𝑡 + 𝛼3𝑙𝑛𝐷𝑖𝑗 + 𝛼4𝑝𝑜𝑝𝑖𝑡 + 𝛼5 𝑝𝑜𝑝𝑗𝑡 + 𝛼6𝑏𝑜𝑟𝑑𝑒𝑟𝑖𝑗 +
𝛼7𝑙𝑎𝑛𝑑𝑙𝑜𝑐𝑘𝑒𝑑𝑖 + 𝛼8 𝑙𝑎𝑛𝑑𝑙𝑜𝑐𝑘𝑒𝑑𝑗 + 𝛼9𝑙𝑛𝑟𝑒𝑚𝑜𝑡𝑒𝑛𝑒𝑠𝑠𝑖𝑡 + 𝛼10𝑙𝑛𝑟𝑒𝑚𝑜𝑡𝑒𝑛𝑒𝑠𝑠𝑗𝑡 +
𝛼11 𝑐𝑜𝑚𝑙𝑎𝑛𝑔𝑖𝑗 + 𝛼12𝑐𝑜𝑙𝑜𝑛𝑦𝑖𝑗 + 𝛼13𝑃𝑇𝐴𝑖𝑗𝑡 + 𝜀𝑖𝑗𝑡 … (1)
where,
𝑙𝑛𝑇𝑖𝑗𝑡 = logarithmic value of bilateral trade (import or export) between countries i and j at time t
𝑙𝑛𝑌𝑖𝑡 , 𝑙𝑛𝑌𝑗𝑡 = logarithmic values of GDP’s of countries i and j respectively at time t
𝑙𝑛𝐷𝑖𝑗 = logarithmic value of bilateral distance between countries i and j (calculated using the
great circle distance algorithm)
𝑝𝑜𝑝𝑖𝑡 , 𝑝𝑜𝑝𝑗𝑡 = populations of the country i and j respectively at time t
𝑏𝑜𝑟𝑑𝑒𝑟𝑖𝑗 = 1 if countries share a common border
𝑙𝑎𝑛𝑑𝑙𝑜𝑐𝑘𝑒𝑑𝑖 , 𝑙𝑎𝑛𝑑𝑙𝑜𝑐𝑘𝑒𝑑𝑗 = 1 if country is landlocked
𝑙𝑛𝑟𝑒𝑚𝑜𝑡𝑒𝑛𝑒𝑠𝑠𝑖𝑡 , 𝑙𝑛𝑟𝑒𝑚𝑜𝑡𝑒𝑛𝑒𝑠𝑠𝑗𝑡 = logarithmic of the GDP-weighted average distance to all
other countries for i and j at time t.
𝑐𝑜𝑚𝑙𝑎𝑛𝑔𝑖𝑗 = 1 if countries i and j share the same official/second languages
𝑐𝑜𝑙𝑜𝑛𝑦𝑖𝑗 = 1 if countries i and j share colonial links (direct or indirect)
𝑃𝑇𝐴𝑖𝑗𝑡 = 1 if countries i and j are a part of the same Preferential Trade Agreement at time t
𝜀𝑖𝑗𝑡 is the error term
One can estimate the traditional gravity model and use the estimated coefficients from the
model to predict bilateral trade26 between the various country pairs. One could compare these
predicted values with the actual values to see if trade volumes are lower/higher than the
potential volumes - that is, to identify if the patterns of trade that we observe are distorted in
some way. The main aim of the paper is to investigate if there are distortions in the patterns of
African trade (particularly intra-regional trade) and if these distortions could be attributed to
the influence of China engagement in the continent. As already mentioned, I use a modified
version of the strategy introduced by Foroutan and Pritchett (1993) to directly test for these
effects by introducing Africa and China specific variables in the estimation of equation (1). The
estimated model allows me to identify distortions in the pattern of trade of African countries vis-
à-vis similar non-African countries. It also allows me determine if intra-regional trade in Africa
26
I will be using the term ‘potential trade’ interchangeably with ‘predicted trade’ henceforth

11
is below/above its potential level and if the presence of China can help in explaining these
distortions. The details of the approach adopted in the paper are explained in the next section.
4. DATA AND METHODOLOGY
Data
The analysis covers a panel of 135 countries for the period 1990-201227. The list of included
countries is reported in Appendix 1. Data from several different sources were compiled together
to create the dataset used in the paper. The data for bilateral trade flows comes from WITS UN
Comtrade28. The data for GDP and GDP per capita (at constant 2005 prices) comes from the
World Bank’s World Development Indicators report. The data for other gravity model variables
i.e. distance, contiguity, common language (official and second language), colonial ties (direct
and indirect links), landlocked comes from Santos Silva and Tenreyro (2006). The data for
preferential trade agreements (PTA) comes from Kohl, T. (2014), forthcoming.
Estimation Method
The paper estimates the traditional gravity model for a panel of 135 countries over the period
1990-2012 using GDP, population, distance, common borders/languages/culture, whether
landlocked or not, whether part of a preferential trade agreement or not, as explanatory
variables.
The gravity model has traditionally been estimated using ordinary least squares (OLS)
regression. However, Santos Silva and Tenreyro (2006), using Monte Carlo simulations, show
that in the presence of hetersoskedasticity29, estimating a log-linearized model using OLS leads
to severely biased estimates. Consequently, there has been a shift in the literature towards other
estimation techniques for the estimation of gravity models. Zero trade flows between countries
is another problem that is commonly faced in gravity model estimations. The estimation
technique should be able to adequately deal with this problem as well30. One approach in the
literature has been to use a Tobit specification with left-censoring at zero. This technique is able
27
Certain countries like Yugoslavia split into different independent nations during the period under study. Due to difficulties in merging the data, these countries have been dropped from the dataset. In case of Ethiopia, data for 1990 includes data for both Eritrea and Ethiopia. After 1991, however, data is reported for only Ethiopia 28
HS 1988/92 nomenclature/product classification 29
Usually a severe problem in the gravity equation estimations 30
If zero trade values reported in the data actually represent zero trade, then truncating the sample by dropping these observations will lead to a loss of information and results will be inconsistent. This approach is not recommended

12
to deal with the problem of zero trade flows. However, Tobit estimation assumes that factors
that determine whether two countries trade or not, are the same as the factors that determine
the volume of bilateral trade between those two countries. This may or may not be true. There is
no clear theoretical foundation why a Tobit technique should be preferred31. Another alternative
is to use a sample selection model, such as the Heckman model (Tran, N., Wilson, N., & Hite, D.
(2013)). However, the Heckman gravity model is based on the log-linear specification and hence,
it suffers from problems of heteroskedasticity (Liu (2009)). The third approach is to use
negative binomial models. However, as Tran et al. (2013) argue, negative binomial is not scale
invariant. This makes it unsuitable to use in the context of gravity model because a model with
the trade values measured in dollars will yield estimates different from those estimated using
trade values measured in thousands of dollars.
The approach that is used quite often in the literature now, is the Poisson pseudo-maximum-
likelihood (PPML) estimation technique as suggested by Santos Silva and Tenreyro (2006). This
technique is able to deal with both the problems of heteroskedasticity and zero values of the
dependent variable. The authors use Monte Carlo simulations to show that the PPML estimator
provides consistent estimates for gravity model coefficients (even if the data itself is not
distributed as a Poisson). The ppml command32 in stata can be used to estimate the gravity
model with ‘level’ of trade as the dependent variable to yield consistent estimates. In this paper,
I use the PPML estimation technique to estimate the gravity model. However, since there is no
consensus in the literature regarding the best method for estimating the gravity model, I also
estimate the model using Tobit (the second most commonly used specification) to see if the
results are robust to the choice of estimation technique. The Tobit estimates are discussed in
Section 6.
Methodology
As already mentioned in Section 3, in order to estimate the effects of Chinese presence in the
continent, I estimate a modified version of equation (1). Just as Foroutan and Pritchett (1993), I
include the following additional dummies in the estimation of equation (1):
African_rep = 1 if the reporter country is in Africa;
31
Herrera (2010), ‘Comparing alternative methods to estimate gravity models of bilateral trade’ 32
This command automatically incorporates the robust option

13
Oilexporter_rep = 1 if the reporter country is an African oil exporter33;
African_both = 1 if both the reporter and the partner countries are in Africa;
The coefficient for the first dummy indicates how trade patterns of non-oil exporting African
countries compare with those of similar non-African countries. The coefficient for the second
dummy gives the differential effect if the reporter country is an oil-exporting African country.
Looking at the coefficients of these dummies can give us an idea about the distortions in the trade
patterns of African countries. The third dummy, for both countries being African, tells us whether
intra-regional trade in Africa is higher or lower than what the gravity model would predict given
the GDPs, populations, distances and other characteristics of the two countries.
In this paper, I introduce additional China-specific variables to account for the effect of Chinese
presence. For each country pair and year combination, these additional dummies are as follows:
a) African_both*China_presence = 1 if both the reporter and partner countries are African
and if either of the countries had trade relations with china in that particular year34.
b) (African_both*China_presence)*(after 2000) = 1 if African_both*China_presence = 1 and
if the year of observation is 2000 or beyond.
c) (African_both*China_presence)*(oilexporter_rep) = 1 if African_both*China_presence = 1
and if the reporter country is an oil exporter.
d) (African_both*China_presence)*(oilexporter_rep)*(after2000) = 1 if (African_both*
China_ presence)*(oilexporter_rep) = 1 and the year of observation is 2000 or beyond.
Using the coefficients of these interaction dummies, I estimate the effect of trade relations with
China on intra-regional trade in Africa. I divide the data into two periods: Pre-2000 (1990-1999)
and Post-2000 (2000-2012). The latter is the period when Chinese engagement in the African
continent started growing at very rapid rates. I estimate the effects of China on intra-African
trade for the two periods separately to see if the effects of Chinese engagement have changed
over time. Given the heterogeneity in the relation of China with African countries, it is
interesting to see how the impact of Chinese presence on intra-regional trade varies for that of
33
Oil exporters are defined as countries where fuels accounted for more than 50 percent of merchandise exports in 2011 and include Algeria, Angola, Chad, Congo, Equatorial Guinea, Gabon, Libya, Nigeria and the Sudan, (Intra-African trade: unlocking private sector dynamism, UNCTAD) 34
In order to create the interaction dummy, first, a China_direct dummy was created which takes the value 1 if either of the countries in the country pair was China. This was then used to create a China_presence dummy, which takes the value 1 if either of the countries in the sample had trade relations with China in that particular year. These were then interacted with African_both dummy

14
an oil abundant reporter countries vis-à-vis a non-oil abundant reporter countries35. Hence, I
estimate the effects on intra-African trade for both groups of countries and see how these have
changed over time. The derivation of the formulae used in estimating these effects is explained
in Appendix 2.
5. RESULTS
Table 1 below presents the estimation results for the traditional gravity model using PPML.
Bilateral import patterns may be determined differently from bilateral export patterns and
hence the model is estimated for imports and exports separately (Foroutan and Pritchett
(1993)).
Columns 1 and 3 report the gravity model estimates for exports, without and with time fixed
effects respectively. Similarly, columns 2 and 4 report the estimates for imports, without and
with time fixed effects respectively. In each case, the dependent variable is the level of bilateral
trade measured in 1,000 USD. Although the dependent variable for the PPML regression is
specified as exports and imports in levels rather than in logarithmic terms, the coefficients of
independent variables entered in logarithmic terms can be interpreted as simple elasticities and
the coefficients of independent variables entered in levels can be interpreted as semi-elasticities
(as under OLS)36. The test for joint significance of year fixed effects has a p-value of zero. In
other words, the time fixed effects are jointly significant. Hence, I will be using the coefficients
from columns 3 and 4 for interpretations of the results.
The model was also estimated using ordinary least squares (OLS) with ‘trade’ and ‘one plus
trade’ as dependent variables. The Breusch-Pagan test rejected the null of homoskedasticity in
both cases with a p-value of zero. The 𝑅2 value in both cases was lower than those obtained for
PPML (in the ranges of 0.71-0.72). Both these results suggest that PPML estimation would be
more suitable than OLS. The paper only reports the PPML estimates37.
35
This captures the idea that China’s engagement with natural resource rich countries may be different from the rest of Africa and hence there may be an asymmetry in the effect of Chinese presence on intra-African trade depending on whether the country is resource rich or not 36
Shepherd, B. (2012), Chapter 4 (Alternative Gravity Model Estimators) 37
The results for OLS have not been included due to the word limit but are available on request

15
Table 1: Traditional Gravity Model estimates using PPML
Sample Period 1990-2012
Dependent variable Export
(in 1,000 USD) Import
(in 1,000 USD) Export
(in 1,000 USD) Import
(in 1,000 USD)
(1) (2) (3) (4)
Log partner GDP (in millions) 0.8167*** 0.7826*** 0.8085*** 0.7731***
(0.006) (0.0038) (0.0059) (0.004)
Log reporter GDP (in millions) 0.7942*** 0.8338*** 0.7836*** 0.8238***
(0.0047) (0.0070) (0.0048) (0.0068)
Partner population (in thousands) 0.092** 0.636*** 0.036 0.580***
(0.00) (0.00) (0.00) (0.00)
Reporter population (in thousands) 0.522*** 0.216*** 0.426*** 0.161***
(0.00) (0.00) (0.00) (0.00)
Log distance -0.8564*** -0.8172*** -0.8709*** -0.8330***
(0.0143) (0.014) (0.0146) (0.0145)
Border 0.0506* 0.0401 0.0989*** 0.0906***
(0.0279) (0.0283) (0.0272) (0.0279)
Landlocked reporter -0.3860*** -0.2788*** -0.3995*** -0.2915***
(0.0381) (0.0372) (0.0364) (0.035)
Landlocked partner -0.3018*** -0.3113*** -0.3188*** -0.3316***
(0.04) (0.035) (0.0378) (0.0335)
Log remoteness reporter 0.7130*** 0.8610*** 0.7087*** 0.8619***
(0.0326) (0.0274) (0.0317) (0.0281)
Log remoteness partner 0.9199*** 0.7679*** 0.9030*** 0.7511***
(0.031) (0.0301) (0.0313) (0.0296)
Common language 0.7084*** 0.6653*** 0.6859*** 0.6430***
(0.0454) (0.0406) (0.0435) (0.0394)
Colonial link -0.3481*** -0.3421*** -0.3248*** -0.3192***
(0.049) (0.0444) (0.0474) (0.0433)
Preferential trade agreement 0.4921*** 0.3829*** 0.4031*** 0.2907***
(0.0229) (0.0235) (0.0232) (0.024)
Reporter African -0.4459*** -0.04 -0.5019*** -0.0938***
(0.0293) (0.0248) (0.0286) (0.024)
Reporter oil exporter 1.0378*** -0.1497*** 1.0279*** -0.1601***
(0.0562) (0.0412) (0.0530) (0.0394)
Both African 0.8339*** 1.8379*** 0.9521*** 2.0461***
(0.1915) (0.4057) (0.2057) (0.4203)
Both African and China presence -0.1681 -1.8504*** -0.1397 -1.9207***
(0.2026) (0.4089) (0.2167) (0.4237)
Both African and China presence 0.3178*** 0.5243*** 0.0806 0.2889*** after 2000 (0.0885) (0.0779) (0.0891) (0.0787)
Both African and China presence -1.7977*** -1.1524*** -1.7759*** -1.1309*** and reporter oil exporter (0.1967) (0.1332) (0.1952) (0.1326)
Both African and China presence 0.7204*** 0.3195** 0.6754*** 0.2863* and reporter oil exporter after 2000 (0.2217) (0.1567) (0.2201) (0.1559)
Constant -14.4113*** -14.6745*** -13.5535*** -13.8519***
(0.3859) (0.3468) (0.3903) (0.3535)
No. of Observations 219174 232798 219174 232798 𝑅2 0.777 0.7744 0.7838 0.7777
Pseudo log-likelihood -4.876e+10 -5.119e+10 -4.640e+10 -4.860e+10 Year fixed effects No No Yes Yes
Test for year fixed effects:
𝝌𝟐
𝝌𝟐(22) = 589.39 𝝌𝟐(22) = 658.25 Probability>𝝌𝟐
0.0000 0.0000
Note: Robust standard errors are in parentheses. * significant at 10%; ** significant at 5%; *** significant at 1%

16
As can be seen from the table, the signs of most of the variables are as expected. A higher GDP of
both the reporter and partner has a positive impact on the bilateral trade. A one percent rise in
the GDP of either the reporter or the partner causes bilateral trade (exports and imports) to
increase by approximately 0.8 percent. Increasing the population of the partner country by
1,000 will cause exports to rise by approximately 53 percent and imports to rise by
approximately 17 percent38. Positive effects of population growth on bilateral trade are a result
of both demand side (larger markets) and supply side (greater workforce) factors. The model
predicts that a one percent increase in the distance between two countries would decrease the
volume of bilateral trade by 0.87 percent for exports and 0.83 percent for imports. Countries
that share borders have about 9.5 percent higher trade volumes as compared to countries that
do not share a border. If the reporter country and/or the partner country are landlocked, it
becomes difficult to trade. The model predicts that a landlocked reporter exports approximately
33 percent less (and imports 25 percent less) than a similar country that is not landlocked. As
theory suggests, remoteness has a positive impact on the bilateral trade between two countries.
A one percent increase in the remoteness index for the reporter country leads to 0.71 percent
higher export volumes and 0.86 percent higher import volumes. Countries with colonial links
have bilateral trade volumes 27 percent lower than countries that do not. Sharing a common
language has a positive impact on bilateral trade. Being a part of the same preferential trade
agreement (PTA) leads to significantly higher trade between countries that are members of the
PTA compared to those that are not. This is true for both export (50 percent increase) and
import volumes (33 percent increase).
Now, let us look at the estimates of the Africa and China specific variables that I included in the
estimation of the traditional gravity model. If the reporting country is African and not oil
abundant, then its exports are lower by 40 percent (and imports by about 10 percent) as
compared to a similar non-African country. This result seems to be in line with existing
literature that suggests that most African countries remain more or less marginalized from
global trade39. If the country is African but oil abundant, its exports are almost 70 percent larger
than that of a non-oil exporting country with similar characteristics. On the import side
however, the patterns are just as before - the country imports 22 percent lesser than a similar
non-African country. These results also show the heterogeneity in trade patterns for resource-
rich and resource-poor African countries. On the import side, both seem to be marginalized from
38
These effects have been estimated using the formula: %∆𝑦 = 100 exp(𝛽)− 1 39
Sachs and Warner (1997); Subramanian and Tamirisa (2001)
17
global trade. But on the export side, resource-rich countries are actually exporting much higher
volumes than would be expected. This could possibly be a reflection of the growing demands for
fuel by China and other Western countries and the consequent commodity price boom. If both
countries are African, the trade between the pair is larger than what one would expect for a pair
with similar characteristics. For example, on the export side African countries are exporting
more than double of what one could expect based on the gravity model estimates. This is in line
with findings of Foroutan and Pritchett (1993) that intra-regional trade in Africa is actually
more than what one would predict given the determinants of bilateral trade.
Now, let us look at the coefficients of the China-specific dummies to estimate the impact of
Chinese presence on intra-regional trade in Africa (for oil exporting countries vis-à-vis non-oil
exporting countries for the period pre-2000 and post-2000).
For non-oil exporting countries, China’s presence in the continent during the period 1990-1999
has had the effect of deterring intra-regional trade in Africa. This means that an African country
imported less from (and exported less to) another African country in a given year if either of
them had trade relations with China in that particular year. This effect is quite significant in
magnitude for the case of imports. Trade relations with china cause imports from (exports to)
other African countries to be lower by approximately 85 percent (13 percent). These results
support the studies mentioned in Section 3 that suggest that cheap imports from China have
hurt imports from neighbouring African countries thereby lowering intra-Africa trade.
For oil-exporting countries as well, China’s presence in the pre-2000 period adversely affected
intra-Africa trade. However, it is interesting to note the much larger magnitudes of these
impacts. In the case of exports, China’s presence causes exports to other African countries to
decline by 85 percent - this impact is much stronger than the impact on a non-oil exporting
country. The trends for imports are similar (a decline of 95 percent). Thus, we see that the
patterns of distortion in trade due to China’s presence are significantly larger for an oil-
exporting country vis-à-vis a non-oil exporter. This could be a reflection of the asymmetry of
Chinese trade relation with resource-rich countries and with the rest of Africa40.
40
As mentioned in the ‘Introduction’ section, China’s growing demand for natural resources and energy supplies has led to a much greater involvement of the country in resource-rich countries of Africa as opposed to the rest of the continent. Thus, it seems plausible that the distortions in trade patterns are larger for oil-exporting countries

18
Looking at these results, one can conjecture, that in the period before 2000, trade relations with
China led African countries to import much less from other African countries - possibly due to
influx of cheap goods from China. Similarly, there was a diversion of exports away from other
African countries. The latter effect was much stronger for an oil-exporting country - possibly
reflecting the growing exports of oil and other natural resources to China (and a few other
countries).
After 2000, however, the extent of Chinese presence in the continent started increasing at a
much faster pace. And as described in the introduction to this paper, these trends in growing
trade were accompanied by growing foreign direct investment (FDI) and aid flows to the
continent41. Thus, it is important to look at how the effects of Chinese presence on intra-regional
trade have changed over time.
The impact of trade relations with China on intra-regional trade in Africa continues to be
negative even in the period from 2000-2012. This holds true for both oil-exporting and non-oil
exporting countries. For a non-oil exporter, exports to other African countries were lower by 6
percent and imports from other African countries were lower by about 80 percent (still
significant) as a result of Chinese presence. For an oil exporter, the corresponding figures were
68 and 90 percent respectively. The patterns of distortion in trade follow the same trends as in
the pre-2000 period: (1) distortions are much more for imports; (2) distortions are greater for
an oil-exporting country; (3) distortions in exports are relatively much larger for an oil-exporter
than for a non-oil exporter.
However, it is interesting to note that the negative effects of Chinese presence on intra-regional
trade have become smaller over time. The distortions for imports remain quite high even post-
2000 but there has been a significant improvement on the export side - 7 percentage points for
non-oil exporting countries and 17 percentage points for oil-exporting countries. These positive
trends in the 2000-2012 period suggest that the growing volumes of aid and FDI from China
(used primarily for financing infrastructure projects - road building, railway rehabilitation,
developing industrial capacity etc.) over the past decade may have helped African countries
overcome some of the infrastructural bottlenecks and allowed them to trade more with each
other. The fact that these positive trends are more pronounced for oil-exporting countries may
41
Most of the aid was ‘aid for trade’. The idea of ‘aid for trade’ gained prominence with the Doha Round where the proposal for an ‘aid for trade’ package was made

19
render credibility to this causation story because even though investments were made in both
resource-rich and resource-poor countries (to enable cheap goods from China to penetrate the
African markets), the major chunk of investments were concentrated in countries with abundant
natural resources. Significant investments were made to develop export-specific infrastructure
in these countries to enable easier export of oil and other resources. Thus, it is not surprising
that improvements in export volumes are larger when the reporting country is an oil exporting
country.
Thus, the regression results show that Chinese presence in the continent has distorted patterns
of intra-regional trade. Even though intra-African trade is higher than what one might expect
based on the gravity model, the results suggest that trade relations with China lead to a
diversion of trade away from African countries (to China possibly). In the post-2000 period,
however, the situation has improved slightly. Growing Chinese investment and aid, leading to
improved infrastructure and production capacities could explain these improvements in intra-
regional trade in the continent in 2000-2012 period relative to 1990-1999.
6. ROBUSTNESS CHECKS
No consensus has been established in the literature regarding the estimation technique that is
most suitable for estimation of the gravity model. Since the seminal work of Santos Silvas and
Tenreyro (2006), a lot of papers have made use of the PPML technique for gravity model
estimations. However, some papers still make use of the Tobit specification. As already
described in Section 4, the Tobit model has its disadvantages but it is worthwhile to check the
robustness of our results to the choice of this estimation technique. The results for the Tobit
specification are reported in Table 242. The dependent variable in this case is logarithmic as
compared to PPML estimation where it is in levels.
42
The results are also robust to estimation using PPML on the truncated sample. But as argued before, dropping observations is not a recommended approach. These results have not been included due to constraints on word limit and due to some obvious limitations of this technique.
20
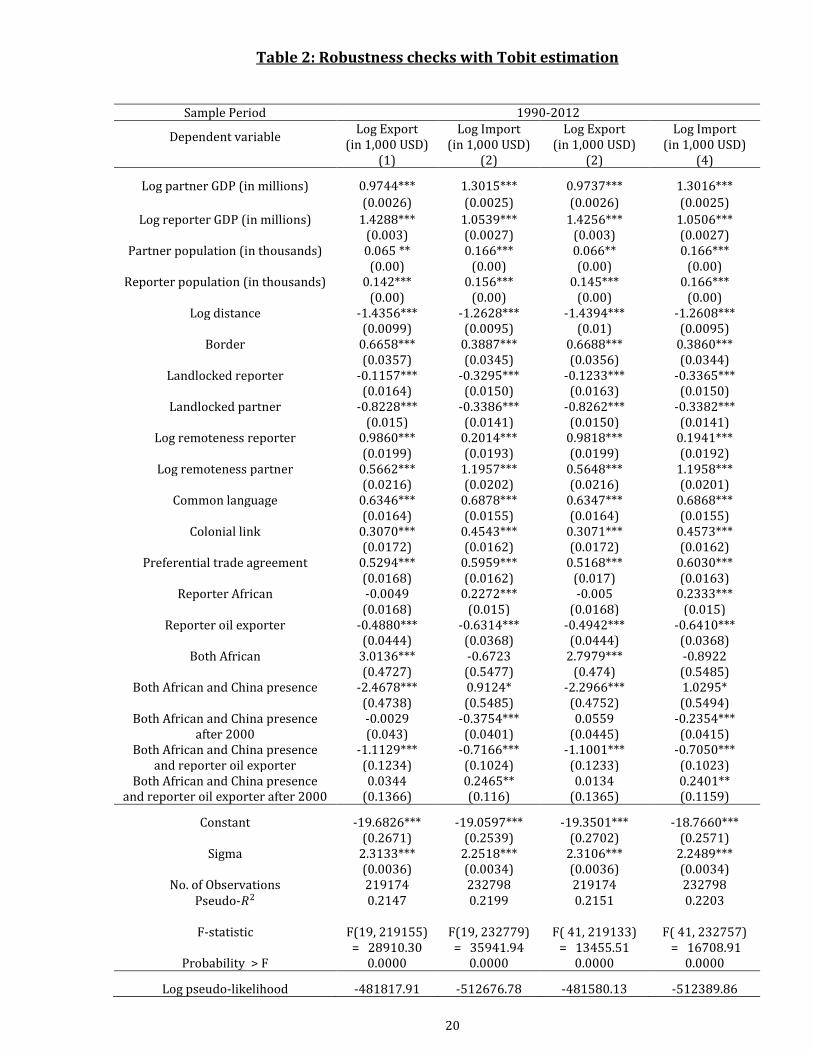
Table 2: Robustness checks with Tobit estimation
Sample Period 1990-2012
Dependent variable Log Export
(in 1,000 USD) Log Import
(in 1,000 USD) Log Export
(in 1,000 USD) Log Import
(in 1,000 USD)
(1) (2) (2) (4)
Log partner GDP (in millions) 0.9744*** 1.3015*** 0.9737*** 1.3016***
(0.0026) (0.0025) (0.0026) (0.0025)
Log reporter GDP (in millions) 1.4288*** 1.0539*** 1.4256*** 1.0506***
(0.003) (0.0027) (0.003) (0.0027)
Partner population (in thousands) 0.065 ** 0.166*** 0.066** 0.166***
(0.00) (0.00) (0.00) (0.00)
Reporter population (in thousands) 0.142*** 0.156*** 0.145*** 0.166***
(0.00) (0.00) (0.00) (0.00)
Log distance -1.4356*** -1.2628*** -1.4394*** -1.2608***
(0.0099) (0.0095) (0.01) (0.0095)
Border 0.6658*** 0.3887*** 0.6688*** 0.3860***
(0.0357) (0.0345) (0.0356) (0.0344)
Landlocked reporter -0.1157*** -0.3295*** -0.1233*** -0.3365***
(0.0164) (0.0150) (0.0163) (0.0150)
Landlocked partner -0.8228*** -0.3386*** -0.8262*** -0.3382***
(0.015) (0.0141) (0.0150) (0.0141)
Log remoteness reporter 0.9860*** 0.2014*** 0.9818*** 0.1941***
(0.0199) (0.0193) (0.0199) (0.0192)
Log remoteness partner 0.5662*** 1.1957*** 0.5648*** 1.1958***
(0.0216) (0.0202) (0.0216) (0.0201)
Common language 0.6346*** 0.6878*** 0.6347*** 0.6868***
(0.0164) (0.0155) (0.0164) (0.0155)
Colonial link 0.3070*** 0.4543*** 0.3071*** 0.4573***
(0.0172) (0.0162) (0.0172) (0.0162)
Preferential trade agreement 0.5294*** 0.5959*** 0.5168*** 0.6030***
(0.0168) (0.0162) (0.017) (0.0163)
Reporter African -0.0049 0.2272*** -0.005 0.2333***
(0.0168) (0.015) (0.0168) (0.015)
Reporter oil exporter -0.4880*** -0.6314*** -0.4942*** -0.6410***
(0.0444) (0.0368) (0.0444) (0.0368)
Both African 3.0136*** -0.6723 2.7979*** -0.8922
(0.4727) (0.5477) (0.474) (0.5485)
Both African and China presence -2.4678*** 0.9124* -2.2966*** 1.0295*
(0.4738) (0.5485) (0.4752) (0.5494)
Both African and China presence -0.0029 -0.3754*** 0.0559 -0.2354*** after 2000 (0.043) (0.0401) (0.0445) (0.0415)
Both African and China presence -1.1129*** -0.7166*** -1.1001*** -0.7050*** and reporter oil exporter (0.1234) (0.1024) (0.1233) (0.1023)
Both African and China presence 0.0344 0.2465** 0.0134 0.2401** and reporter oil exporter after 2000 (0.1366) (0.116) (0.1365) (0.1159)
Constant -19.6826*** -19.0597*** -19.3501*** -18.7660***
(0.2671) (0.2539) (0.2702) (0.2571)
Sigma 2.3133*** 2.2518*** 2.3106*** 2.2489***
(0.0036) (0.0034) (0.0036) (0.0034)
No. of Observations 219174 232798 219174 232798 Pseudo-𝑅2 0.2147 0.2199 0.2151 0.2203
F-statistic
F(19, 219155) = 28910.30
F(19, 232779) = 35941.94
F( 41, 219133)
= 13455.51
F( 41, 232757) = 16708.91
Probability > F 0.0000 0.0000 0.0000 0.0000
Log pseudo-likelihood -481817.91 -512676.78 -481580.13 -512389.86

21
The signs for GDPs, populations, distance, remoteness, border, common language, and
preferential trade agreement are same as the PPML estimates and are consistent with theory.
Tobit estimation gives a positive sign for the coefficient of colonial links which is in contrast with
the results obtained in the PPML43.
Let us now look at the coefficients of the variables that we are interested in - the China and
Africa specific variables. The results seem to suggest that non-oil exporting African countries
actually trade more44 as compared to other countries with similar characteristics. These results
are in contrast to the PPML estimates obtained above but are consistent with the findings of
Rodrik (1998) and Coe and Hoffmaister (1998). The authors claim that given the geographic and
economic characteristics of the African countries, there is no evidence that Africa is
marginalized from world trade. An oil exporting country, on the other hand seems to be
marginalized from world trade for both exports and imports (39 and 33 percent lower volumes,
respectively). These results seem counter-intuitive to the evidence that most of Africa’s trade
(especially exports) are accounted for by the resource-rich countries. This seems suggestive of
the fact that a Tobit estimator may not be suitable in this context. If we look at the intra-regional
trade in Africa, the Tobit specification is consistent with the PPML results that African countries
trade more with each other than would be predicted by the gravity model45.
For the period 1990-1999, trade relations with China caused both oil exporting and non-oil
exporting countries to export less to other African countries - decline of 96 and 89 percent
respectively. These estimates suggest massive volumes of diversion of exports away from the
continent to other countries. In contrast to the Poisson pseudo-maximum-likelihood estimates,
the impact on imports is positive for both resource-rich and resource-poor countries. For
example, the presence of China has led non-oil exporting countries to import more than double
of what would be expected from other African countries. This again seems counter-intuitive
given the growing anti-China sentiment among African manufacturers and increasing demands
43
These variables are not of primary concern for this paper. Hence, I have not included a comparison of the coefficients of these variables for the Tobit and PPML specification 44
Imports are higher by approximately 26 percent. The coefficient for exports is not significantly different from zero 45
The results are significant only for exports
Year Fixed effects No No Yes Yes
Test for year fixed effects:
F-statistic
F(22,219133) = 22.23
F(22,232757) = 26.86
Probability > F
0.0000 0.0000 Note: Robust standard errors are in parentheses. * significant at 10%; ** significant at 5%; *** significant at 1%

22
for protection from cheap Chinese goods. The impacts for the post-2000 period are similar to
the pre-2000 period suggesting no significant effects of Chinese aid and investment programs.
These robustness checks show that our estimates are not entirely robust to the choice of
estimation technique. However, one must keep in mind that the Tobit estimator has an obvious
drawback - it assumes that the factors that determine whether two countries trade or not are
the same as the factors that determine what the volume of bilateral trade will be. This may not
be the case given that China’s engagement with Africa (in terms of trade, investment or aid) is
largely driven by natural resource considerations. Political regimes and other factors may also
affect whether a country trades with an African country or not, but these may not affect the
volume of trade. Linders and de Groot (2006: p. 5) note that ‘it is unclear which optimizing
framework would justify negative desired trade, even if caused by randomly distributed factors not
explicitly identified in the model. As a consequence, the Tobit model is not the appropriate model to
explain why some trade flows are missing’. Thus, even though the results are quite sensitive to the
choice of estimation technique, it seems reasonable to prefer the PPML estimation over the
Tobit due to some obvious disadvantages of the latter.
7. LIMITATIONS AND SCOPE FOR FURTHER RESEARCH
As noted by Bergstand (1989) and Anderson (1979), the gravity model estimation of bilateral
trade lacks strong theoretical foundations as it is not based on optimization behavior of
economic agents. Efforts have been made to improve the theoretical foundations but it is still far
from adequate. This leads us to the first limitation of this study. However, one must also keep in
mind that the gravity model has performed quite well empirically in explaining bilateral trade
volumes and given the aim of this study - to understand whether Chinese intervention has
distorted patterns of intra-regional trade in Africa - a gravity model framework seems to be the
most suitable.
Secondly, the results are sensitive to the choice of estimation technique. But as argued in Section
5, PPML estimation has several advantages over other techniques (particularly with regard to
problems of zero trade flows and heteroskedasticity) and seems like the most reasonable
approach for estimating the traditional gravity model.
23
The paper explores the impact of ‘Chinese presence’ on patterns of trade - that is if either of the
country had trade relations with China in a given year. It does not look at the intensity of the
Chinese engagement. This leads us to the main limitation of this study - it only looks at the
extensive margin of Chinese engagement. However, since most of China’s trade and investment
is concentrated in resource-rich countries, the inclusion of a dummy for oil exporter and its
interaction with a Chinese presence dummy could successfully provide an indication of how the
(distortions in) trade patterns vary with intensity of Chinese involvement. Similarly, since the
rapid growth of Chinese engagement is only a recent phenomenon, the inclusion of a dummy for
post-2000 period (with suitable interactive terms) could provide an indication of how the
intensity of Chinese involvement affects trade patterns. It must be noted, however, that these
will only be imperfect indicators. It would be interesting to study the effects of Chinese presence
on patterns of trade of resource rich countries vis-à-vis the rest of Africa taking into account the
intensity of Chinese engagement (volume of trade, aid and investment as a percentage of GDP
etc.). It would also be interesting to study the relative importance of these different channels.
The paper suggests that the key mechanism through which increased Chinese presence may
have led to improvements in intra-African trade in the post-2000 period is improvements in
infrastructural and administrative capacity. However, this hypothesis could not be tested in the
present study due to time constraints. Given more time and resources, I would like to include
some measures of infrastructure quality in the country, quality of institutions (as a proxy for
administrative capacity) and the amount of Chinese aid and investment allocated to different
projects46 to test these claims.
8. CONCLUSIONS
China’s quest for natural resources has led to increased involvement of the country in the
resource abundant African continent. There has been a surge in Chinese trade, investment and
aid flows to the continent since late 1990’s. The development community has divergent views
regarding the motives of China in Africa, the impact of China on African trade, welfare of the
population and so on. In this paper I focus on one particular aspect of these debates – the impact
of China on the intra-regional trade in Africa.
46
AidData website has data for Chinese aid to Africa at country-year-sector level.

24
China grants preferential tariff treatment to Africa. Most of its development and financial
assistance is also tied to the purchase of Chinese goods. Both these have the effect of distorting
the patterns African trade, in particular trade between African countries. Given the importance
of African trade as a means of alleviating poverty47 it is very important to study what these
distortions look like. The paper estimates a modified version of the traditional gravity model to
study these distortions and how they vary over time for both resource-rich and resource-poor
countries.
The results suggest that African countries that are not oil-abundant are marginalized from
global trade with their export and import values being lower than that of a similar non-African
country. These imply the importance of factors like poor infrastructure, administrative
constraints, institutional weaknesses that constrain African trade. Similar patterns are obtained
for resource-rich countries on the import side. However, the growing demands for natural
resources all over the world and the rising commodity prices have led to much higher export
volumes for these groups of countries than would be predicted by the gravity model. Consistent
with several studies, this paper finds no evidence that intra-regional trade in Africa is lower than
potential levels.
The negative effects of Chinese presence on intra-African trade show that patterns of African
trade are indeed distorted by Chinese involvement in the continent. These distortions are larger
for an oil exporting country and are much more evident for imports. These results support the
view that cheap imports from China have diverted imports away from other African countries
and the preferential tariff treatment awarded to African countries has diverted exports away
from African countries to China (and other countries). But there has been an improvement in
trends over the past decade. These distortionary effects have become less negative over time,
especially for the case of exports. This suggests that improvements in infrastructure and other
administrative constraints achieved with the help of increasing Chinese investment and ‘aid for
trade’ packages have offset these distortions partly and enabled African countries to trade more
with each other. These offsetting effects are quite small at present but one must keep in mind
that infrastructure investments are long-term investments and it takes a decade (or possibly
more) for them to show their full effects. Thus, one could expect further improvements in intra-
regional trade in Africa as higher volumes of Chinese aid and FDI continues to flow into Africa.
47
Emphasized in the Doha round

25
The results of this study highlight the crucial role of African policymakers. Currently, African
consumers are benefitting from cheap manufactured goods from China (the same goods could
be produced at only much higher costs at home) and manufacturers in the natural resource
sectors are benefitting from the growing demands for imports from China. Even though some
import-competing sectors have been hurt by China’s presence, it seems reasonable to assume
that cheaper consumption goods along with investments in infrastructure, capacity building
projects and the like have benefitted the African countries. However, one must look at not just
the static effects but also the dynamic effects of Chinese engagement.
The analysis shows that the benefits from the involvement of China are being achieved at the
expense of lower intra-African trade. As emphasized by the Doha round, growth of intra-African
trade is crucial for the development of the continent as whole. Taking this into account, the long
term effects of Chinese influence do not seem to be as positive. The African countries need to
take advantage of the improvements in infrastructure and institutional capacity to promote
intra-Africa trade. Though there have been some positive trends in this direction in the last
decade (allowing these countries to benefit from scale economies in production as well), it is
very important to ensure that the benefits of Chinese presence are harnessed properly.
Policymakers must take steps to ensure that appropriate skills and productive capacity are
developed over time that will allow African countries to diversify their export base and to
prevent this from becoming yet another story of Dutch Disease.

26
APPENDIX 1: List of countries
Albania Algeria Angola Argentina Australia Austria Bahamas, The Bahrain Bangladesh Barbados Belize Benin Bhutan Bolivia Brazil Brunei Bulgaria Burkina Faso Burundi Cambodia Cameroon Canada Central African Rep. Chad Chile China Colombia
Comoros Congo, Dem. Rep. Congo, Rep. Costa Rica Cote d'Ivoire Cyprus Denmark Djibouti Dominican Rep. Ecuador Egypt, Arab Rep. El Salvador Equatorial Guinea Ethiopia Fiji Finland France Gabon Gambia, The Germany Ghana Greece Guatemala Guinea Guinea-Bissau Guyana Haiti
Honduras Hong Kong, China Hungary Iceland India Indonesia Iran, Islamic Rep. Ireland Israel Italy Jamaica Japan Jordan Kenya Kiribati Korea, Rep. Lao PDR Lebanon Madagascar Malawi Malaysia Maldives Mali Malta Mauritania Mauritius Mexico
Mongolia Morocco Mozambique Nepal Netherlands New Caledonia New Zealand Nicaragua Niger Nigeria Norway Oman Pakistan Panama Papua New Guinea Paraguay Peru Philippines Poland Portugal Romania Senegal Seychelles Sierra Leone Singapore Solomon Islands South Africa
Tanzania Thailand Togo Trinidad and Tobago Tunisia Turkey Uganda United Arab Emirates United Kingdom United States Uruguay Venezuela Vietnam Yemen Zambia Zimbabwe Russian Federation Rwanda Saudi Arabia Spain Sri Lanka St. Kitts and Nevis Sudan Suriname Sweden Switzerland Syrian Arab Rep.
APPENDIX 2: Calculations for the effect of Chinese presence (Pre-2000 and Post-2000)
The gravity equation estimated in the paper can be written as follows:
𝑇𝑖𝑗𝑡 = 𝜹𝑿𝒊𝒋𝒕 + 𝛽1𝐷1 + 𝛽2𝐷1𝐷2 + 𝛽3𝐷3 + 𝛽4𝐷3𝐷4 + 𝛽5 𝐷3𝐷4𝐷5 + 𝛽6𝐷3𝐷4𝐷2 + 𝛽7𝐷3𝐷4𝐷5𝐷2
where,
𝑋𝑖𝑗𝑡 includes the variables described in equation (1)
𝐷1 = 1 if reporter is African
𝐷2 = 1 if reporter is oil exporter
𝐷3 = 1 if both countries are African
𝐷4 = 1 if either country traded with China
𝐷5 = if year > 2000
27
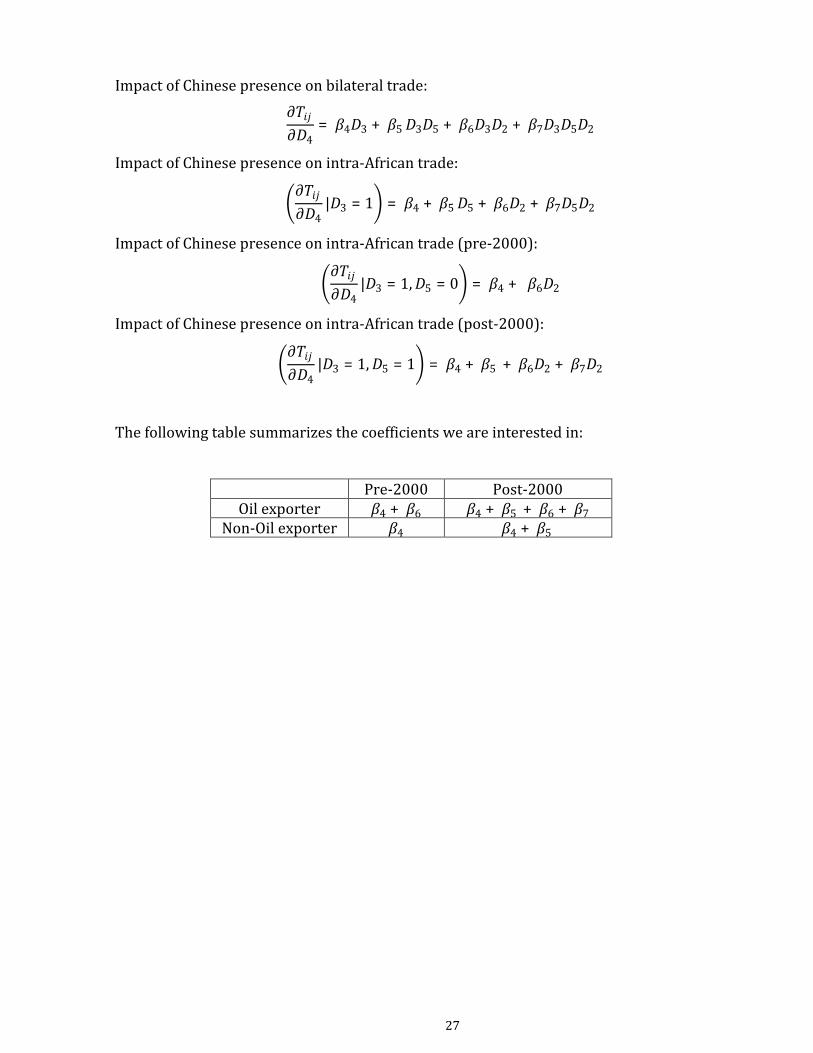
Impact of Chinese presence on bilateral trade:
𝜕𝑇𝑖𝑗
𝜕𝐷4= 𝛽4𝐷3 + 𝛽5 𝐷3𝐷5 + 𝛽6𝐷3𝐷2 + 𝛽7𝐷3𝐷5𝐷2
Impact of Chinese presence on intra-African trade:
𝜕𝑇𝑖𝑗
𝜕𝐷4|𝐷3 = 1 = 𝛽4 + 𝛽5 𝐷5 + 𝛽6𝐷2 + 𝛽7𝐷5𝐷2
Impact of Chinese presence on intra-African trade (pre-2000):
𝜕𝑇𝑖𝑗
𝜕𝐷4|𝐷3 = 1,𝐷5 = 0 = 𝛽4 + 𝛽6𝐷2
Impact of Chinese presence on intra-African trade (post-2000):
𝜕𝑇𝑖𝑗
𝜕𝐷4|𝐷3 = 1,𝐷5 = 1 = 𝛽4 + 𝛽5 + 𝛽6𝐷2 + 𝛽7𝐷2
The following table summarizes the coefficients we are interested in:
Pre-2000 Post-2000 Oil exporter 𝛽4 + 𝛽6 𝛽4 + 𝛽5 + 𝛽6 + 𝛽7
Non-Oil exporter 𝛽4 𝛽4 + 𝛽5

28
REFERENCES
Besada, H., Wang, Y., & Whalley, J. (2008). China's growing economic activity in Africa (No. w14024). National Bureau of Economic Research. Berthelemy, J. C. (2011). China’s engagement and aid effectiveness in Africa.Working Pa-per, (129), 28. Brautigam, D. (2009). The dragon's gift: the real story of China in Africa. Oxford University Press. Carrere, C. (2006). Revisiting the effects of regional trade agreements on trade flows with proper specification of the gravity model. European Economic Review,50(2), 223-247.
Carrère, C., de Melo, J., & Wilson, J. (2013). THE DISTANCE PUZZLE AND LOW‐INCOME COUNTRIES: AN UPDATE. Journal of Economic Surveys,27(4), 717-742. Carrère, C., De Melo, J., & Wilson, J. (2010). Distance and regionalization of trade for low-income countries. World Bank Policy Research Working Paper Series, Vol. Chen, L. F. Y. (2007). Africa’s Trade with China: Good for Growth?. Coe, D. T., & Hoffmaister, A. W. (1999). North-South trade: is Africa unusual?.Journal of African Economies, 8(2), 228-256. Corkin, L., & Burke, C. (2006). China’s interest and activity in Africa’s construction and infrastructure
sectors. Report prepared for DFID China. Stellenbosch, South Africa: Centre for Chinese Studies
Eisenman, J. (2012). China–Africa trade patterns: causes and consequences. Journal of Contemporary China, 21(77), 793-810.
Eita, J. H. (2008, July). Determinants of Namibian Exports: A Gravity Model Approach. In 13th African Econometric Conference, University of Pretoria, South Africa. Exercises, D. Analyzing bilateral trade using the gravity equation. A Practical Guide to Trade Policy Analysis, 101 Foroutan, F., & Pritchett, L. (1993). Intra-sub-Saharan African trade: is it too little?. Journal of African Economies, 2(1), 74-105. Gómez, E., & Milgram, J. (2010). Are estimation techniques neutral to estimate gravity equations? An application to the impact of EMU on third countries’ exports. mimeo. Gómez-Herrera, E. (2013). Comparing alternative methods to estimate gravity models of bilateral trade. Empirical Economics, 44(3), 1087-1111. Giovannetti, G., & Sanfilippo, M. (2009). Do Chinese Exports Crowd-out African Goods? An Econometric Analysis by Country and Sector. European Journal of Development Research, 21(4), 506-530. Hiscox, M. J., & Kastner, S. L. (2008). A General Measure of Trade Policy Orientations: Gravity-Model-Based Estimates for 76 Nations, 1960 to 2000. Working Paper. Idun-Arkhurst, I., & Laing, J. (2007). The impact of the Chinese presence in Africa. Africa Practice, London.

29
Kaplinsky, R., McCormick, D., & Morris, M. (2010). China and Sub Saharan Africa: impacts and challenges of a growing relationship. Kohl, T., 2014, "Do we really know that trade agreements increase trade?" Review of World Economics, forthcoming. Martínez-Zarzoso, I. (2013). The log of gravity revisited. Applied Economics,45(3), 311-327. Martin, W., & Herath, G. (2008). Estimating the Gravity Model When Zero Trade Flows Are Frequant. School of Accounting, Economics and Finance, Deakin University. Meier zu Selhausen, F. (2010). The Great Convergence “made in China” and its growing influence on the demand of African natural resources. Working Paper Universidad de Cantabria. Negasi, M. Y. (2009). Trade Effects of Regional Economic Integration in Africa: The Case of SADC. Silva, J. S., & Tenreyro, S. (2006). The log of gravity. The Review of Economics and statistics, 88(4), 641-658. Strange, A., Parks, B., Tierney, M. J., Fuchs, A., Dreher, A., & Ramachandran, V. (2013). China’s Development Finance to Africa: A Media-Based Approach to Data Collection. Center for Global Development Working Paper, (321). Seid, E. H. (2013). Regional Integration and Trade in Africa: Augmented Gravity Model Approach. Shepherd, B. (2012). The Gravity Model of International Trade: A User Guide.United Nations Economic and Social Commission for India and the Pacific (UNESCAP), Bangkok. Tansey, M. M., & Touray, A. (2010). The Gravity Model Of Trade Applied To Africa. International Business & Economics Research Journal (IBER), 9(3). Tran, N., Wilson, N., & Hite, D. (2013), Choosing the Best Model in the Presence of Zero Trade: A Fish
Product Analysis. Frontiers of Economics and Globalization, 12, 127-148
Turkson, F. E. (2012). Trade agreements and bilateral trade in sub-Saharan Africa: Estimating the trade effects of the EU-ACP PTA and RTAs (No. 12/07). CREDIT Research Paper. Zafar, A. (2007). The growing relationship between China and Sub-Saharan Africa: Macroeconomic, trade,
investment, and aid links. The World Bank Research Observer, 22(1), 103-130
Others (no citations available): Africa Research Institute, (October 2012), Between extremes: China and Africa African Trade Policy Centre, Policy Brief: Africa’s trade flows and patterns Development Bank of Southern Africa and The Centre for Chinese Studies, (2008), China as a driver of regional integration in Africa: Prospects for the future Intra-African Trade: Unlocking Private Sector Dynamism, UNCTAD