interwell tracer tests: understanding inter-well ... · fill water sample 3. or gas sample 4. label...
TRANSCRIPT

Enhanced Oil Recovery Institute 1
Interwell Tracer Tests: Understanding Inter-Well Connectivity
Within Your Reservoir
March 22, 2018
Stephen Whitaker
2 EORI
Agenda
1. Know Your Reservoir
2. General Properties of Interwell Tracers
3. Tracer Project Design
4. Injection and Sampling
5. Data Analysis and Interpretation
6. Examples of Interwell Tracer Surveys
7. Remaining Oil Saturation Calculations
8. Summary

3 EORI
Two Rules for Being a Successful Oil & Gas Professional
• 1 - You must excel at working with incomplete data sets
• 2 -

Know Your Reservoir
• A key to maximizing recovery efficiency from any reservoir is proper reservoir characterization (know your reservoir)
• Data from logs and cores within a field do not provide the necessary information to map the internal plumbing of the reservoir
• Interwell tracer tests can greatly increase the understanding of the reservoir architecture, which is needed to maximize production
• reservoir flow paths
• heterogeneities
• unswept areas of the reservoir
4 EORI
Know Your Reservoir
5 EORI
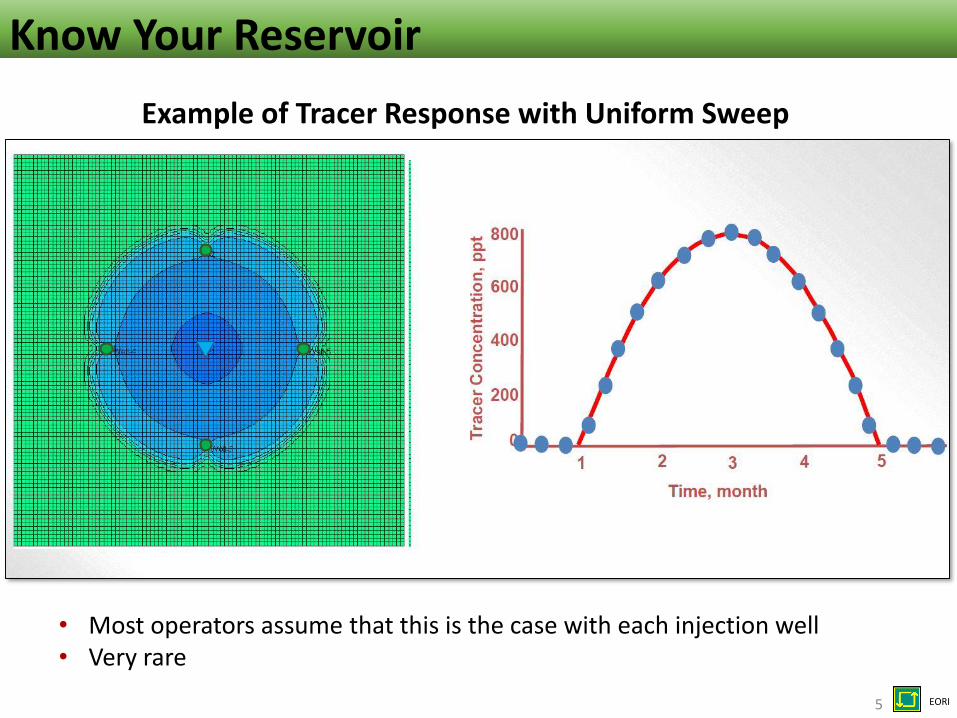
Example of Tracer Response with Uniform Sweep
• Most operators assume that this is the case with each injection well• Very rare
Know Your Reservoir
6 EORI
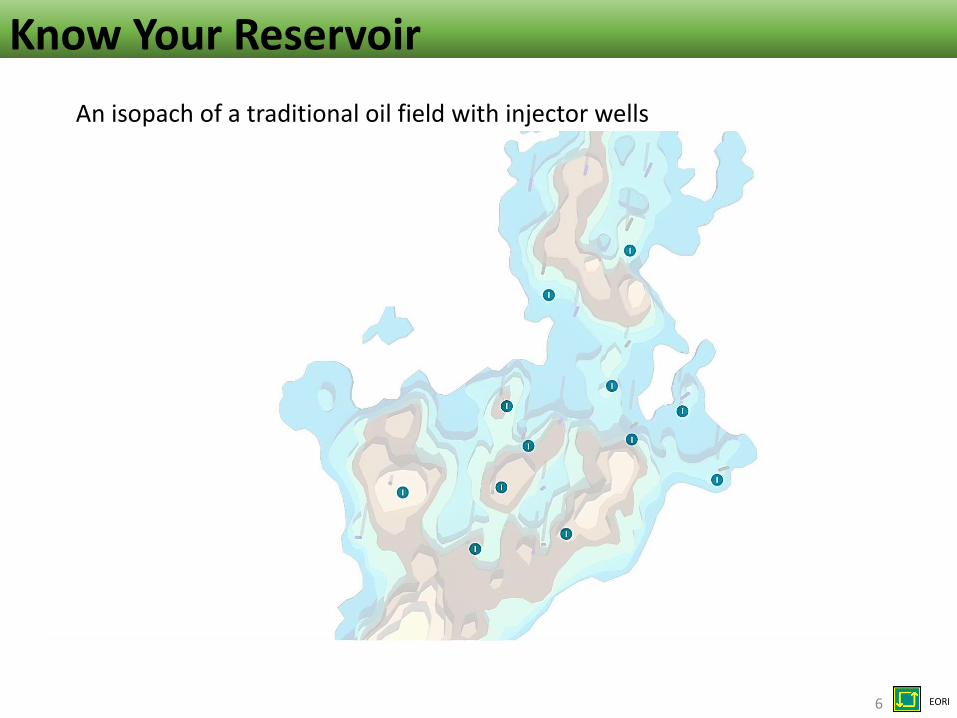
An isopach of a traditional oil field with injector wells

Know Your Reservoir
7 EORI
An isopach of a traditional oil field with injector wells and producing wells
Know Your Reservoir
8 EORI
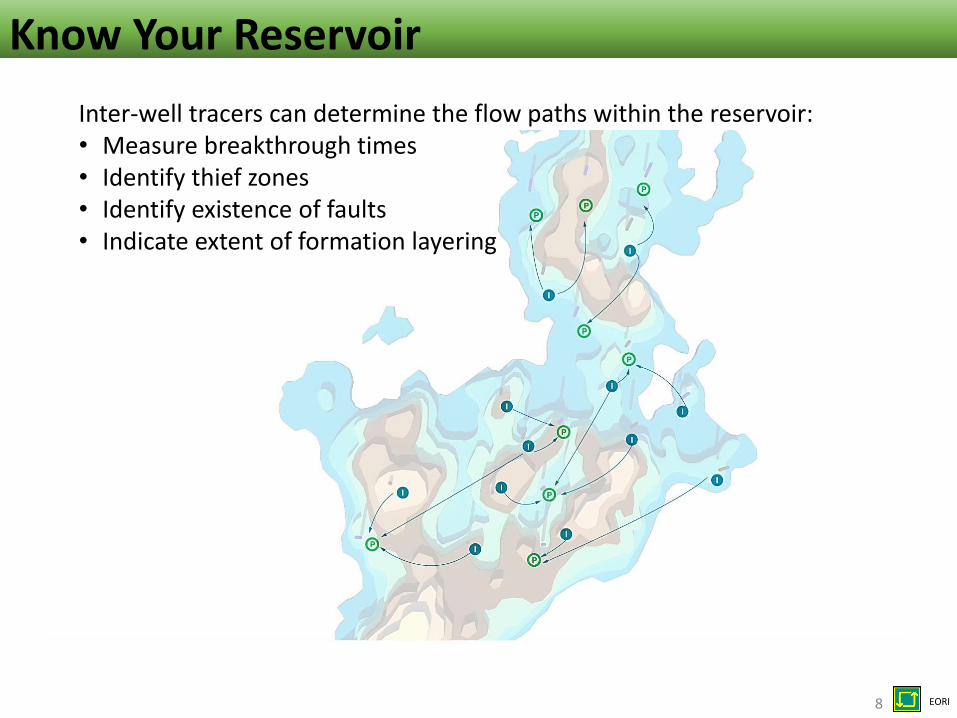
Inter-well tracers can determine the flow paths within the reservoir:• Measure breakthrough times• Identify thief zones• Identify existence of faults• Indicate extent of formation layering

Know Your Reservoir
9 EORI
and help indicate the locations of barriers to fluid flow

Know Your Reservoir
11 EORI
By measuring the amount of tracer recovered it is possible to quantify:
• Swept Pore Volume• Sweep Efficiency• Approximate Remaining Oil• Conformance Gel treatment
volume estimations

Such as identifying flow behavior prior to full-field planning and project scale-up
• At the pilot stage of new flood projects
• To evaluate specific injector-to-producer flow connectionsBreakthrough times allow the sources of high water-cuts or spurious gas:oil ratios to be determined
• EOR studiesWhen evaluating various recovery mechanisms & different conformance treatments (e.g. polymer or chemical floods)
12 EORI
When to use Interwell Tracers

• Inert chemicals that will follow and behave as the water flowing through the reservoir:
• Non-reactive and stable
• No absorption or retardation with the formation
• Do not interact with hydrocarbons
• Have very low detection limits (parts per trillion)
• Show minimal environmental consequences
• Cost-effective
• Nearly 50 unique water tracers available depending on reservoir conditions
13 EORI
Properties of Waterflood Tracers

• Inert chemicals that will follow and behave as the injected gas mixture flowing through the reservoir:
• Non reactive chemical gas tracers used
• Stable at reservoir conditions
• No absorption onto reservoir rock
• Should have vapor / liquid hydrocarbon solubility properties as close to the injected gas as possible
• Have very low detection limits (parts per trillion)
• Show minimal environmental consequences
• Cost-effective
• About 20 unique gas tracers available depending upon reservoir conditions
14 EORI
Properties of Gasflood Tracers

Tracer Project Design
15 EORI

16 EORI
1. Project objectives
2. Tracer selection & compatibility testing
3. Tracer quantity calculation
4. Initial sampling regimen
5. Tracer injection and sampling
6. Analytical results
7. Data interpretation
8. Revise sampling regimen (if needed)
9. Evaluation of tracer data
10. Historic match to fit tracer data
11. Repeat tracer application if desired
Pre-Deployment
Tracer Deployment
Post-Deployment
Tracer Project Design

Injection & Sampling
19 EORI
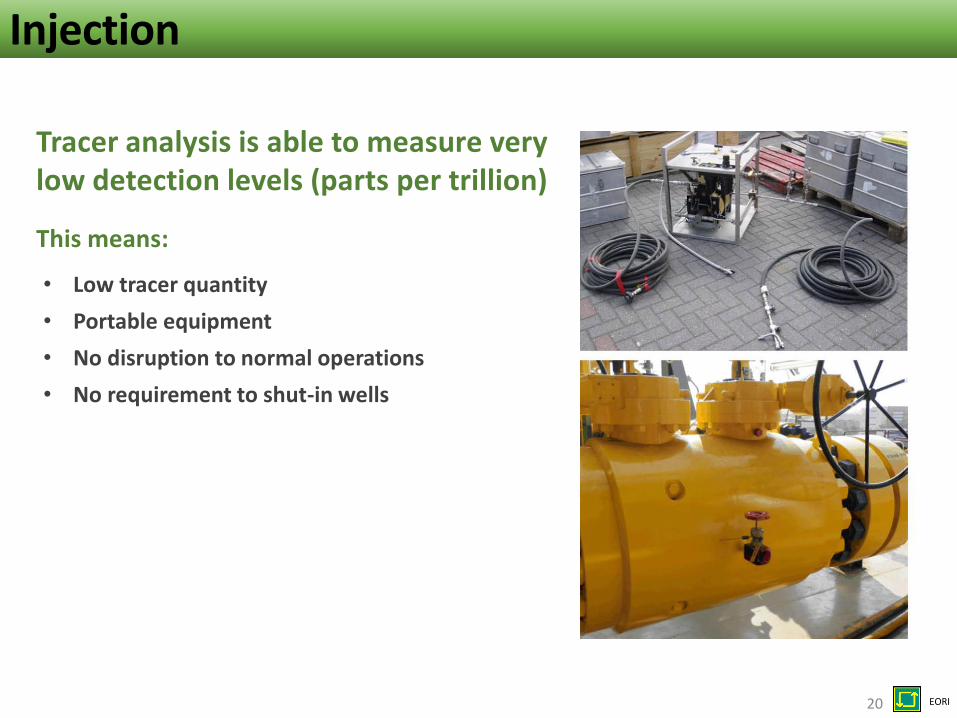
Tracer analysis is able to measure very low detection levels (parts per trillion)
This means:
20 EORI
Injection
• Low tracer quantity
• Portable equipment
• No disruption to normal operations
• No requirement to shut-in wells

21 EORI
1. Complete paperwork
2. Fill water sample
3. Or gas
sample
4. Label sample 5. Place sampleInto box
6. Seal box 7. Send box to
Tracerco
3. Or gas sample
7. Send box to tracer company
Sample Collection
Collecting samples and sending to the tracer company for analysis is simple, fast, and convenient

• Samples taken from producing wells at regular intervals to measure tracer content
• Samples taken more frequently immediately after injection to catch matrix bypass events
• Frequency dependent upon injection rates & formation volume / quality, as well as the distance between injectors and producers
• Special care is required to prevent sample contamination during collection
• For gas, CATS tubes (Capillary Adsorption Tube Samplers) or onsite lab set-up an option if required to ship using constraints
• Not necessary to analyze every sample collected
22 EORI
Sample Collection

23 EORI
Sample Collection

Data Analysis & Interpretation
24 EORI

25 EORI
Data Analysis & Interpretation
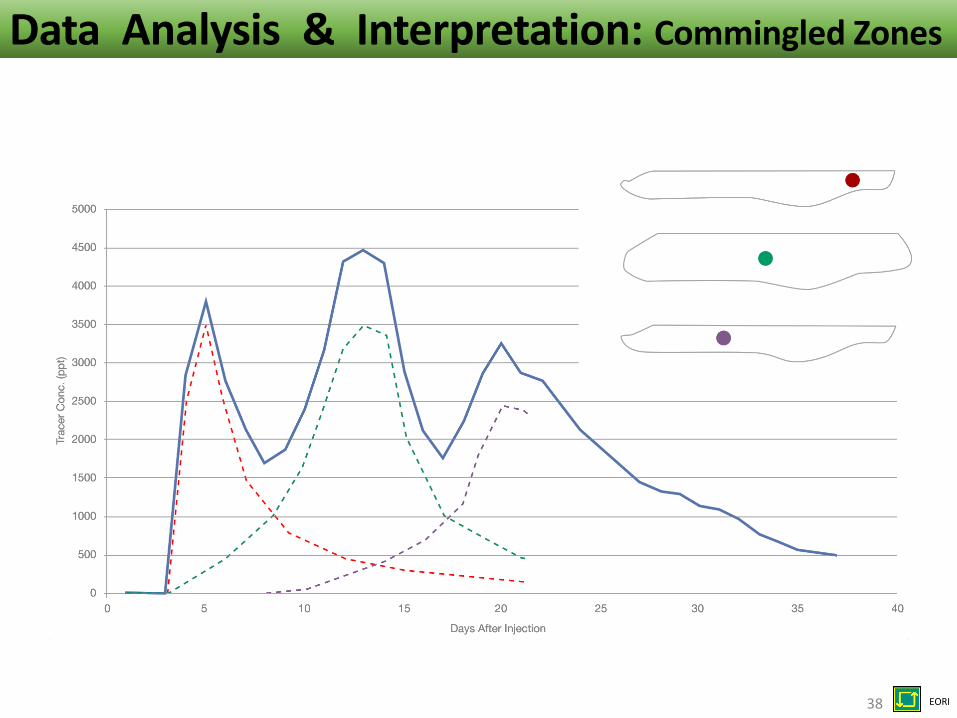
Common response at producer to tracer injection
Trac
er C
on
cen
trat
ion
pp
t
Days Post Injection

26 EORI
Data Analysis & InterpretationTr
acer
Co
nce
ntr
atio
n p
pt
Days Post Injection

27 EORI
Data Analysis & InterpretationTr
acer
Co
nce
ntr
atio
n p
pt
Days Post Injection

28 EORI
Data Analysis & InterpretationTr
acer
Co
nce
ntr
atio
n p
pt
Days Post Injection

29 EORI
Data Analysis & Interpretation
MRT is used to evaluate sweep efficiencies, heterogeneity, permeability, etc.
Trac
er C
on
cen
trat
ion
pp
t
Days Post Injection

30 EORI
Data Analysis & Interpretation

31 EORI
Data Analysis & Interpretation

32 EORI
Data Analysis & Interpretation

33 EORI
Data Analysis & Interpretation: Commingled Zones

34 EORI
Data Analysis & Interpretation: Commingled Zones

35 EORI
Data Analysis & Interpretation: Commingled Zones

36 EORI
Data Analysis & Interpretation: Commingled Zones

37 EORI
Data Analysis & Interpretation: Commingled Zones
38 EORI
Data Analysis & Interpretation: Commingled Zones

39 EORI
Data Analysis & Interpretation: Commingled Zones

Application Examples
40 EORI

41 EORI
Case Studies: Waterflood Application
The Project:An oil field operator wished to better understand communication pathways within an inverted nine-spot waterflood operation. This study was to establish:
• Sweep efficiency of the field
• Determine if there was preferential flow direction
• Resolve the problem of excessive water production in several wells

42 EORI
Case Studies: Waterflood Application
The Project:An oil field operator wished to better understand communication pathways within an inverted nine-spot waterflood operation. This study was to establish:
• Sweep efficiency of the field
• Determine if there was preferential flow direction
• Resolve the problem of excessive water production in several wells
Tracers proved that there was preferential flow to the west-southwest

43 EORI
Case Studies: Waterflood Application
Interpretation of Results• There is preferential flow to the west
and southwest
• Several areas of the field have not been swept
• Flood can be improved by changing pattern through recompletions or in-fill drilling

44 EORI
Wyoming Case Study: Gas Flood

45 EORI
Wyoming Case Study: Gas Flood
• ~19 Injection wells• Unique gas tracer in each well
• ~18 Producing wells• Breakthrough expected in hours or
days
• Problems• Breakthrough of gas in several wells• Suspected poor sweep (fractures,
faults, varying reservoir quality)• Thinking of trying polymer
• Objectives• Track preferential flow
• Identify fractures/faults and other factors that affect sweep
• Identify wells for polymer applications

46 EORI
Depth: 7500’Porosity: 15%Permeability: 50md
• Sample collection started within hours of injection due to expected breakthrough (BT) timing
• Initial sample frequency on an hourly basis and reduced over time
• One or more tracers produced in most wells
• High connectivity identified in 3 areas (circled)
Wyoming Case Study: Gas Flood
47 EORI
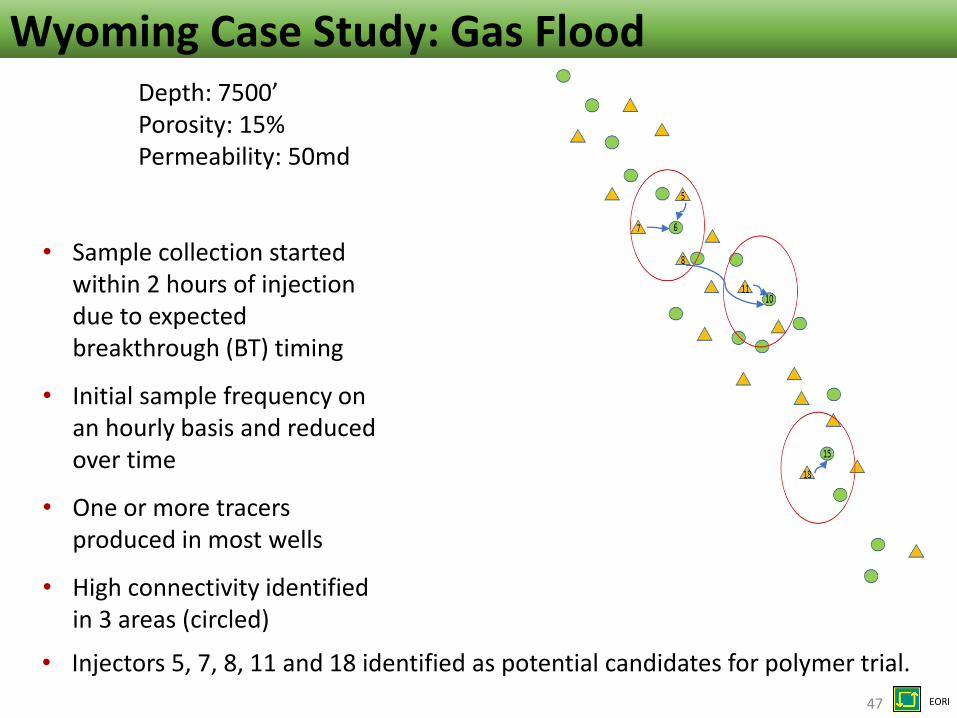
Depth: 7500’Porosity: 15%Permeability: 50md
• Sample collection started within 2 hours of injection due to expected breakthrough (BT) timing
• Initial sample frequency on an hourly basis and reduced over time
• One or more tracers produced in most wells
• High connectivity identified in 3 areas (circled)
• Injectors 5, 7, 8, 11 and 18 identified as potential candidates for polymer trial.
Wyoming Case Study: Gas Flood

48 EORI
Injectors 5 and 7.
• Both show high connectivity with p6. Poor sweep with BT in day 1.
• 37% of inj 7 tracer produced in p6
• 25% of inj 5 tracer produced in p6
Inj 5 -Inj 7
6
5
7
4
Tracer Pulse Well #6
Wyoming Case Study: Gas Flood

49 EORI
Injector 8
• Connectivity to p10; 9% of tracer produced Day 1.
• High tracer concentration early and brief pulse indicating channeling through fracture or fault. Tracer not present in other nearby producers.
Injector 11
• 37% tracer produced in p10. BT Day 1.
• Channeling and relatively poor sweep.
Injector 13
• Communication with p10 detected. Effective sweep.
Wyoming Case Study: Gas Flood
Inj 8 Inj 11 Inj 13 Tracer Pulse Well #10

50 EORI
Injector 18
• Channeling and ineffective sweep to p15
• 35% tracer recovery in 6 days with BT day 1.
15
18
Inj 18 Tracer Pulse Well #15
Wyoming Case Study: Gas Flood
51
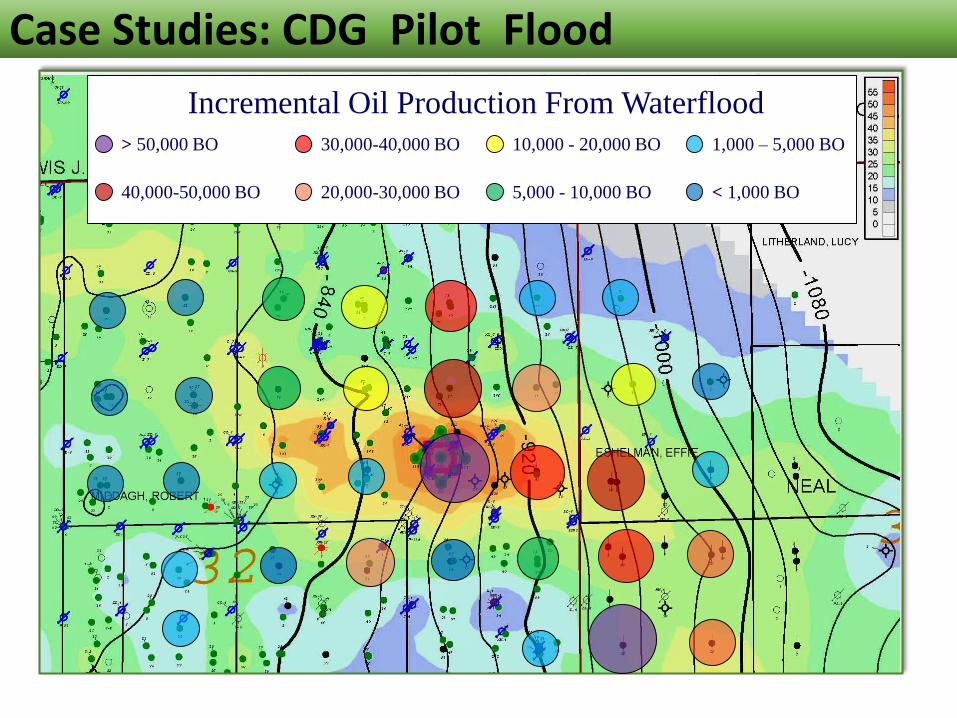
Case Studies: CDG Pilot Flood
< 1,000 BO
1,000 – 5,000 BO
5,000 - 10,000 BO
10,000 - 20,000 BO
20,000-30,000 BO
30,000-40,000 BO
40,000-50,000 BO
> 50,000 BO
Incremental Oil Production From Waterflood

52
Case Studies: CDG Pilot Flood
Failed ASP Pilot
Reservoir had been under continuous waterflood for 65 years52 EORI

53
Four Injectors, 7 producers
Case Studies: CDG Pilot Flood
53 EORI
ASP Pilot Wells

54
Top of “D”
zone
Rate 700 BPD
WHP 220 PSI
Rate 225 BPD
WHP 120 PSI
Rate 228 – 741 BPD
WHP 200 – 230 PSI
Griggs #131
0 100 200 300 400
Case Studies: CDG Pilot Flood
54 EORI
RA Tracer survey shows injection fluids all going into one zone within perf’d interval
55
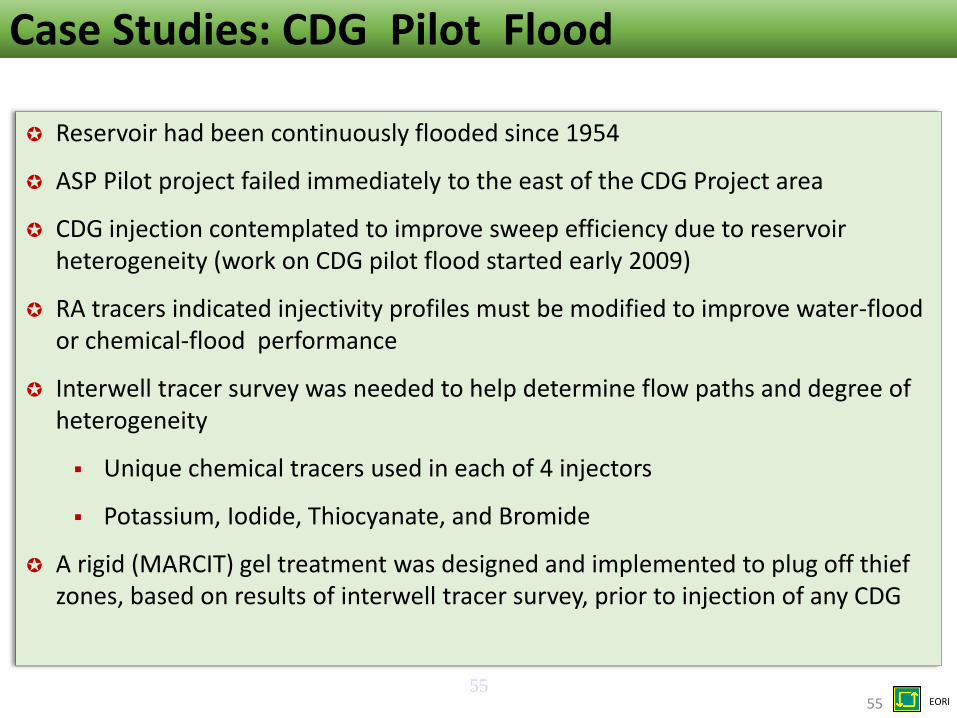
Reservoir had been continuously flooded since 1954
ASP Pilot project failed immediately to the east of the CDG Project area
CDG injection contemplated to improve sweep efficiency due to reservoir heterogeneity (work on CDG pilot flood started early 2009)
RA tracers indicated injectivity profiles must be modified to improve water-flood or chemical-flood performance
Interwell tracer survey was needed to help determine flow paths and degree of heterogeneity
▪ Unique chemical tracers used in each of 4 injectors
▪ Potassium, Iodide, Thiocyanate, and Bromide
A rigid (MARCIT) gel treatment was designed and implemented to plug off thief zones, based on results of interwell tracer survey, prior to injection of any CDG
55 EORI
Case Studies: CDG Pilot Flood
10 days
20 days
8 days
56
0 250
ft
56 EORI
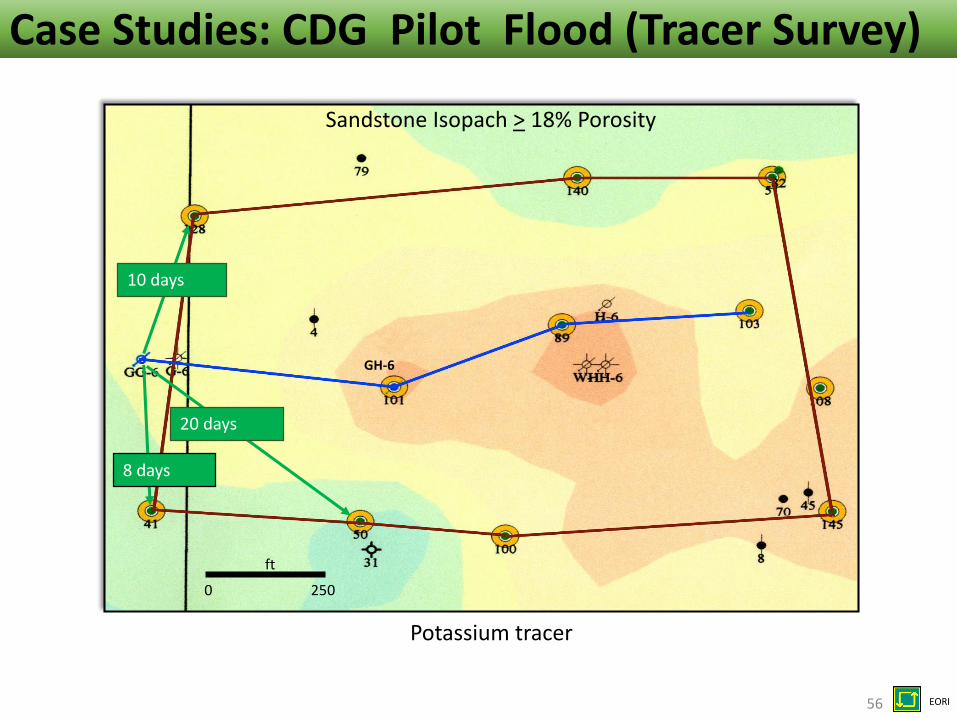
Case Studies: CDG Pilot Flood (Tracer Survey)
Sandstone Isopach > 18% Porosity
GH-6
Potassium tracer

8 days
20 days
GH-6
0 250
ft
57 EORI
Case Studies: CDG Pilot Flood (Tracer Survey)
Sandstone Isopach > 18% Porosity
3 days
Iodide tracer

1 day
13 days
58
HH-6A
0 250
ft
58 EORI
Case Studies: CDG Pilot Flood (Tracer Survey)
Sandstone Isopach > 18% Porosity
15 days
GH-6
Thiocyanate tracer
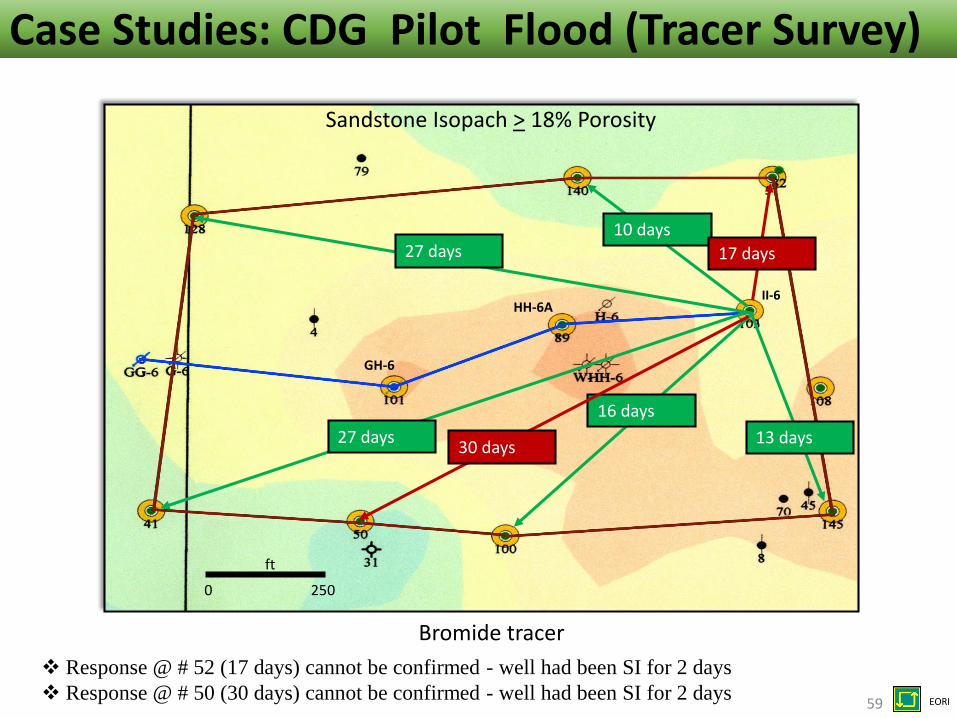
10 days27 days
16 days
30 days
17 days
27 days
❖ Response @ # 52 (17 days) cannot be confirmed as the well had 2 SI days
❖ Response @ # 50 (30 days) cannot be confirmed—well had been SI for 2 days
59
II-6
13 days
0 250
ft
❖ Response @ # 52 (17 days) cannot be confirmed - well had been SI for 2 days
❖ Response @ # 50 (30 days) cannot be confirmed - well had been SI for 2 days59 EORI
Case Studies: CDG Pilot Flood (Tracer Survey)
Sandstone Isopach > 18% Porosity
GH-6
HH-6A
Bromide tracer

61
“Thief” zone is no longer taking much fluid
61 EORI
Case Studies: CDG Pilot Flood (Gel Treatment)
Sandstone Isopach > 18% Porosity
62 EORI
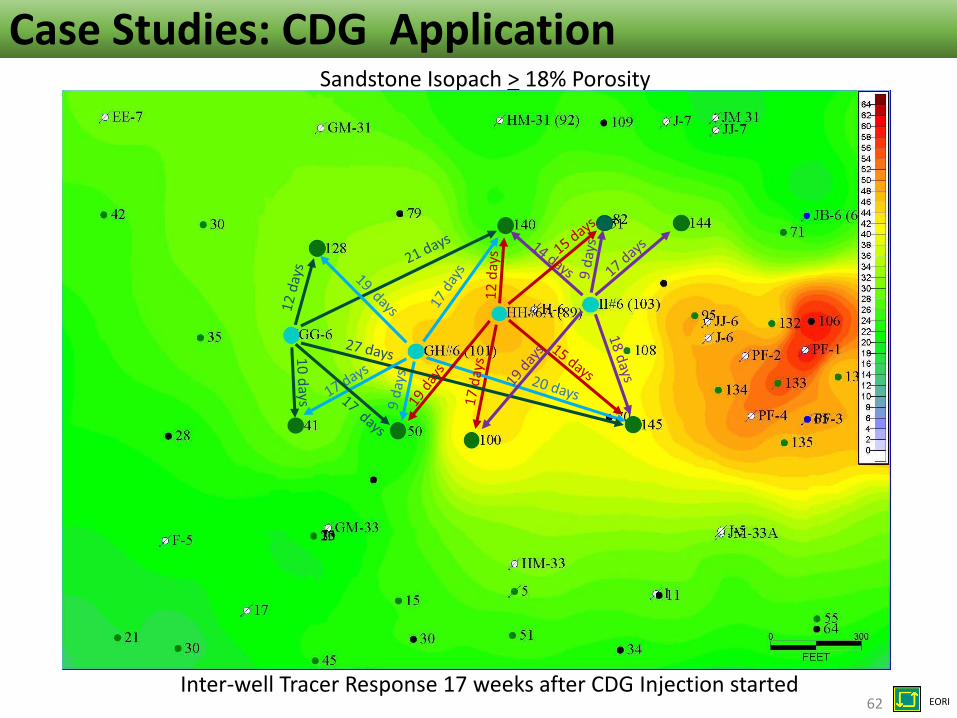
Case Studies: CDG Application
Inter-well Tracer Response 17 weeks after CDG Injection started

63 EORI
Case Studies: CDG Application
0
10
20
30
40
50
60
70
0
200
400
600
800
1000
1200
9/3
/09
9/1
0/09
9/1
7/09
9/2
4/09
10
/1/0
91
0/8
/09
10
/15
/09
10
/22
/09
10
/29
/09
11
/5/0
91
1/1
2/0
91
1/1
9/0
91
1/2
6/0
91
2/3
/09
12
/10
/09
12
/17
/09
12
/24
/09
12
/31
/09
1/7
/10
1/1
4/10
1/2
1/10
1/2
8/10
2/4
/10
2/1
1/10
2/1
8/10
2/2
5/10
3/4
/10
3/1
1/10
3/1
8/10
3/2
5/10
4/1
/10
4/8
/10
4/1
5/10
4/2
2/10
4/2
9/10
5/6
/10
5/1
3/10
5/2
0/10
5/2
7/10
6/3
/10
6/1
0/10
6/1
7/10
6/2
4/10
Bar
rels
Oil
Pro
du
ced
& O
il C
ut
Tota
l Flu
id B
bls
W Griggs Lease CDG Flood Weekly Averages
Fluid Injected Total Fluid Produced Oil Oil Cut %
Pre-CDG Flood Weekly Average from 8 producers was 18.2 BO / 1008 BW (1.8% oil-cut)

Remaining Oil Saturation Calculations
64 EORI

65 EORI
• Use partitioning and non-partitioning tracers
• Both tracers added to injection at same time
• During transit between wells,
• Partitioning (passive) tracer moves only with the water
• Non-partitioning tracer interacts with residual oil, thus altering its progress
Remaining Oil Saturation Calculations

Benefits:
• Non-intrusive
• Provides measurement of oil saturation in the region between injectors and producers instead of only near the well bore
• Tests can be run during normal operation
• No loss in production
• Assumes that tracers contact immobile oil along flow-paths of watered-out zones between wells
66 EORI
Partitioning Tracers

Ideal candidates have the following properties:
• Relatively mature flooded reservoir
• Injector to producer spacing is relatively close to enable results in a reasonable time period
• Need to know that well pairs are communicating
• Sweep efficiency should be reasonable
• Only Sorw (residual oil saturation to water) will be measured and NOT unswept zones
• Production well must be able to lift fluids to surface
• Formation should be reasonably homogeneous –allows for relatively easy interpretation of key positions along the tracer graphs
67 EORI
Partitioning Tracers

Prior to using passive and partitioning tracers the following measurements should be carried out:
• Laboratory based crushed core retention and retardation tests using clean and residual-oil-saturated core
• Partition coefficient testing at reservoir conditions
• Analytical compatibility
• Required data
- Core sample or access to similar rock
- Produced oil from field
- Gas sample from the field or gas composition
- Formation / produced water close to study area
- Injection water from injector close to study area (if water is re-injected)
68 EORI
Partitioning Tracers

71 EORI
0 30 60 90 120 150 180
250
200
150
100
50
0.0
Trac
er
Re
spo
nse
Days after injection
So =Tp – Tw
Tp + (K-1)Tw
= 34% =34 - 22
34 + (1.06-1)22
Partitioning Tracers: Sampling & Analysis

Discussion & Conclusion
73 EORI
74 EORI
• Interwell tracer surveys are a powerful tool in determining ways of maximizing recovery efficiencies in IOR and EOR projects
• One of best direct tools to understand fluid movement within a reservoir
• Provide information on:
• Breakthrough times
• Communication pathways
• Thief zones, natural fractures, faults
• Formation layers
• Identify sources of excess water
• Problem injectors
• Quantification of
- Injected fluid distribution
- Swept pore volume
- Sweep efficiency
- Reservoir geometry (including flow capacity and storage capacity)
Summary

75
Companies: Interwell Tracer Surveys• Chemical Flooding Technologies, LLC: www.chemicalfloodingtechnologies.com
24431 E. 61st Street, Suite 850, Tulsa, OK 74136(918) 743-7575
• Chemical Tracers, Inc: http://www.chemtracers.comHeadquarters: 1814 Steele, Laramie, WY 82070(307) 742-0418
• Core Lab (Spectraflood): www.corelab.comHeadquarters: 6510 W. Sam Houston Pkwy. N., Houston, TX 77041Contact: David Chastain, Manager Interwell Tracer Services [email protected](713) 328-2393 office; (281) 352-4697 mobile
• Tracerco: www.tracerco.com Headquarters: 4106 New West Dr., Pasadena, TX 77507Utah: 2698 S. Redwood Rd, Ste. T., West Valley City, UT 84119KC Oren; [email protected](303) 249-9965
• Tracer Technologies International (subsidiary of Chemical Flooding Technologies):[email protected] Fargo Ave # B, Cleveland, OH 44146(216) 464-9300

76
Thank You
Questions and Comments:
Stephen Whitaker, Senior Geologist [email protected]
Office 307-315-6446
Lon Whitman, Petroleum Engineer & Outreach [email protected]
Office 307-315-6450
www.eoriwyoming.org
Enhanced Oil Recovery Institute