intervention for dyslexia - lucid research for dyslexia a review of published evidence on the impact...
TRANSCRIPT
Intervention for Dyslexia A review of published evidence on the impact of specialist dyslexia teaching
Chris Singleton
University of Hull
May 2009

© Copyright Chris Singleton and ‘No To Failure’ 2009
2 Intervention for Dyslexia

Contents
EXECUTIVE SUMMARY .........................................................................................6
ACKNOWLEDGEMENTS ........................................................................................................ 13
1 INTRODUCTION ............................................................................................................... 14 1.1 AIMS AND SCOPE............................................................................................................ 14
1.1.1 Remit ...................................................................................................................... 14 1.1.2 Limitations ............................................................................................................. 14 1.1.3 The author.............................................................................................................. 15
1.2 DEFINITIONS OF DYSLEXIA ............................................................................................ 16 1.2.1 United Kingdom..................................................................................................... 16 1.2.2 United States of America ....................................................................................... 17
1.3 WHAT IS ‘SPECIALIST DYSLEXIA TEACHING’? ............................................................... 18 1.3.1 The nature of the problem...................................................................................... 18 1.3.2 Historical overview................................................................................................ 18 1.3.3 Current perspectives on specialist dyslexia teaching ............................................ 18 1.3.4 Conclusions ........................................................................................................... 21 1.3.5 Wider roles of the specialist dyslexia teacher ....................................................... 22
1.4 VISUAL STRESS AND DYSLEXIA ..................................................................................... 23 1.4.1 Visual dyslexia? ..................................................................................................... 23 1.4.2 The implications of visual stress for reading development.................................... 24 1.4.3 Relationship between visual stress and dyslexia ................................................... 24
1.5 METHODS AND MEASURES............................................................................................. 26 1.5.1 Methodology .......................................................................................................... 26 1.5.2 Standard scores ..................................................................................................... 26 1.5.3 Effect size ............................................................................................................... 27 1.5.4 Ratio gain .............................................................................................................. 27
1.6 STRUCTURE OF THE REVIEW .......................................................................................... 28 2 INTERVENTION STUDIES IN THE US AND THE REST OF THE WORLD .......... 29
2.1 STAGES OF INTERVENTION IN THE USA ........................................................................ 29 2.2 SECONDARY INTERVENTION STUDIES............................................................................ 29
2.2.1 Swanson’s (1999) meta-analysis ........................................................................... 30 2.2.2 Vellutino, Scanlon, Sipay et al. (1996) .................................................................. 30 2.2.3 Torgesen et al. (1999)............................................................................................ 31 2.2.4 Scammacca et al. (2007) review ............................................................................ 32 2.2.5 Foorman et al. (1997)............................................................................................ 33 2.2.6 Schneider, Roth and Ennemoser (2000) ................................................................ 33 2.2.7 Vadasy et al. (2002)............................................................................................... 34 2.2.8 Mathes et al. (2005)............................................................................................... 34 2.2.9 Ryder, Tunmer and Greaney (2008) ...................................................................... 35 2.2.10 Frost & Sørensen (2007) ....................................................................................... 36 2.2.11 Vaughn and Roberts (2007) review ....................................................................... 36
2.3 CRITICAL ISSUES IN SECONDARY INTERVENTION .......................................................... 37 2.3.1 Long-term effects ................................................................................................... 37 2.3.2 Who should deliver intervention: teachers or teaching assistants? ...................... 38
2.4 CONCLUSIONS ON SECONDARY INTERVENTION............................................................. 39 2.5 TERTIARY INTERVENTION STUDIES ............................................................................... 40
2.5.1 Torgesen, Alexander et al. (2001) ......................................................................... 40
Intervention for Dyslexia 3
2.5.2 Rashotte, McPhee and Torgesen (2001) ................................................................42 2.5.3 Reviews and analyses by Torgesen (2005a & 2005b)............................................43 2.5.4 Alexander et al. (1991) ...........................................................................................44 2.5.5 Lovett et al. (1994) .................................................................................................45 2.5.6 Wise, Ring and Olson (1999)..................................................................................45 2.5.7 Lovett et al. (2000) .................................................................................................45 2.5.8 O’Connor and Wilson (1995).................................................................................45 2.5.9 Torgesen et al. (2003) ............................................................................................45 2.5.10 Torgesen et al. (2004) ............................................................................................47
2.6 FLUENCY ........................................................................................................................47 2.7 SPELLING ........................................................................................................................48 2.8 WRITING .........................................................................................................................49 2.9 CRITICAL ISSUES IN TERTIARY INTERVENTION...............................................................50
2.9.1 Number of hours of intervention.............................................................................50 2.9.2 Degree of impairment.............................................................................................51 2.9.3 Group size...............................................................................................................51 2.9.4 Age..........................................................................................................................52
2.10 CONCLUSIONS ON TERTIARY INTERVENTION .................................................................53 3 UK INTERVENTION STUDIES........................................................................................55
3.1 STAGES OF INTERVENTION IN ENGLAND ........................................................................55 3.2 RATIONALE FOR THE SELECTION OF STUDIES.................................................................55 3.3 REVIEW OF STUDIES........................................................................................................56
3.3.1 AcceleRead AcceleWrite.........................................................................................56 3.3.2 Interactive Assessment and Teaching (IA&T) ........................................................57 3.3.3 Lexia .......................................................................................................................58 3.3.4 London Borough of Sutton study ............................................................................59 3.3.5 Phono-Graphix.......................................................................................................59 3.3.6 Phonology with Reading.........................................................................................60 3.3.7 Read Write Inc........................................................................................................61 3.3.8 Reading Intervention ..............................................................................................61 3.3.9 SIDNEY ..................................................................................................................63 3.3.10 THRASS..................................................................................................................63 3.3.11 Toe by Toe ..............................................................................................................63 3.3.12 Summary.................................................................................................................64
3.4 STUDIES IN UK SPECIALIST DYSLEXIA SCHOOLS AND TEACHING CENTRES...................71 3.4.1 Hornsby and Miles (1980)......................................................................................71 3.4.2 East Court School...................................................................................................71 3.4.3 Dyslexia Action.......................................................................................................72
3.5 CONCLUSIONS.................................................................................................................73 4 SCREENING AND ASSESSMENT ...................................................................................76
4.1 IDENTIFYING CHILDREN WITH DYSLEXIA .......................................................................76 4.1.1 Intelligence and discrepancy..................................................................................76 4.1.2 Predictors of reading difficulty and dyslexia .........................................................76 4.1.3 Response to intervention ........................................................................................78
4.2 ISSUES IN SCREENING .....................................................................................................80 4.2.1 The purpose of screening........................................................................................80 4.2.2 Screening in education ...........................................................................................80 4.2.3 The accuracy of screening instruments ..................................................................81 4.2.4 Teacher training issues ..........................................................................................83
4.3 SCREENING TESTS...........................................................................................................84 4.3.1 Scope ......................................................................................................................84 4.3.2 Types of screening test ...........................................................................................84 4.3.3 Conventional dyslexia screening tests....................................................................85
4 Intervention for Dyslexia
4.3.4 Computer-based screening tests for dyslexia ........................................................ 88 4.3.5 Dyslexia Profiling Tests......................................................................................... 90 4.3.6 Identifying visual stress ......................................................................................... 92
4.4 CONCLUSIONS................................................................................................................ 93 5 READING RECOVERY..................................................................................................... 95
5.1 INTRODUCTION .............................................................................................................. 95 5.1.1 Scope...................................................................................................................... 95 5.1.2 What is Reading Recovery? ................................................................................... 95 5.1.3 Rationale and pegagogy ........................................................................................ 96 5.1.4 Reading Recovery and the teaching of early reading............................................ 97 5.1.5 Pressures to increase phonics in Reading Recovery ............................................. 97 5.1.6 The place of phonics currently in Reading Recovery in the UK............................ 98
5.2 EVALUATIONS OF READING RECOVERY IN THE REST OF THE WORLD......................... 100 5.2.1 Large-scale international evaluations and reviews............................................. 100 5.2.2 RCT and quasi-experimental studies of Reading Recovery ................................. 101
5.3 READING RECOVERY IN THE UK ................................................................................. 104 5.3.1 Reading Recovery in the UK before Every Child a Reader (ECaR).................... 104 5.3.2 Every Child a Reader (ECaR) ............................................................................. 105
5.4 QUASI-EXPERIMENTAL RESEARCH STUDIES ON READING RECOVERY IN THE UK...... 106 5.4.1 The London and Surrey study, 1992–96 .............................................................. 106 5.4.2 Every Child a Reader in London, 2005–06 ......................................................... 107 5.4.3 Comparing the effects of Reading Recovery and phonologically based schemes 108
5.5 LONG-TERM EFFECTS................................................................................................... 109 5.5.1 Long-term follow-ups of Reading Recovery in England...................................... 110 5.5.2 Key Stage 1 results of Reading Recovery children in England, 2003– 07........... 111 5.5.3 Reading Recovery children’s standardised reading test results.......................... 117
5.6 CONCLUSIONS.............................................................................................................. 118 5.6.1 The efficacy of Reading Recovery........................................................................ 118 5.6.2 Reading Recovery as an intervention for children with dyslexia ........................ 118
6 COMPUTER TECHNOLOGY AND SUPPORT OF OLDER DYSLEXIC PUPILS 121 6.1 DYSLEXIC DIFFICULTIES IN SECONDARY SCHOOL ....................................................... 121 6.2 USE OF COMPUTERS IN INSTRUCTION .......................................................................... 122
6.2.1 The advantages of computer assisted learning (CAL) for dyslexics.................... 123 6.2.2 Speech feedback................................................................................................... 124 6.2.3 Integrated Learning Systems ............................................................................... 125
6.3 RESEARCH ON COMPUTER-BASED INTERVENTIONS WITH DYSLEXIC CHILDREN ......... 125 6.4 STUDIES OF ASSISTIVE TECHNOLOGY WITH OLDER DYSLEXIC STUDENTS................... 128 6.5 CONCLUSIONS.............................................................................................................. 128
REFERENCES .......................................................................................................................... 130
Intervention for Dyslexia 5
Intervention for Dyslexia A review of published evidence on the impact of specialist dyslexia teaching
Chris Singleton May 2009
Executive Summary
Aims and scope (Chapter 1)
1) This review has been commissioned by the Steering Committee for the ‘No To Failure’ project and funded by the Department for Children, Schools and Families. The aim was to summarise published research evidence of the impact of specialist teaching on progress and outcomes for children aged from 5 to 18 with dyslexia/specific learning difficulties.
2) The following definition of dyslexia was been adopted for the purposes of this review:
Dyslexia primarily affects the skills involved in accurate and fluent word reading and spelling.
Characteristic features of dyslexia are difficulties in phonological awareness, verbal memory and verbal processing speed.
Dyslexia occurs across the range of intellectual abilities.
It is best thought of as a continuum, not a distinct category, and there are no clear cut-off points.
Co-occurring difficulties may be seen in aspects of language, motor co-ordination, mental calculation, concentration and personal organisation, but these are not, by themselves, markers of dyslexia.
A good indication of the severity and persistence of dyslexic difficulties can be gained by examining how the individual responds or has responded to well founded intervention.
3) In the UK, ‘specialist dyslexia teaching’ may be regarded as an umbrella term for the approaches that are used by teachers who have undergone specialist training and attained qualifications in the teaching of children and adults with dyslexia. These approaches may be summarised as being systematic, multisensory and phonologically based. Criteria of (a) tuition being additional to that normally provided, and (b) focused directly on developing literacy skills, were also imposed on the review. Accordingly, indirect methods and ‘alternative therapies’ for dyslexia are not considered here.
4) Dyslexia is sometimes confused with visual stress, especially where the erroneous term ‘visual dyslexia’ is used. Visual stress is the subjective experience of unpleasant visual symptoms when reading and can be a cause of special educational needs. The theory of visual stress that has the most empirical support is that the condition results from a general over-excitation of the visual cortex due to hypersensitivity to contrast or pattern glare. This theory does not
6 Intervention for Dyslexia

presuppose any neurological link between dyslexia and visual stress. However, recent studies indicate that visual stress is more prevalent in people with dyslexia than in the rest of the population, which is probably because visual sensitivity is heightened as a result of the dyslexic’s poor reading strategies, thus exacerbating visual stress reactions.
5) Visual stress interferes with the ability to read for any reasonable duration. Children who suffer from this problem tend to avoid reading, to the detriment of their progress in reading fluency and reading comprehension. The most widely used, and generally effective, treatment for visual stress is that of coloured tints, in the form of either acetate overlays or tinted lenses. This is not an appropriate treatment for dyslexia, but the increased prevalence of visual stress amongst people with dyslexia indicates that teachers should be especially vigilant for the signs of visual stress in dyslexic pupils (see also paragraph 30).
6) Few of the studies in this field conform to methods that may be described as ‘gold standard’ (i.e. randomised control trials), but most may be considered as conforming to a ‘silver standard’ (i.e. well-constructed quasi-experimental studies). Wherever possible, effect sizes of findings are quoted. Effect size is a well-established method of reporting the magnitude of a result. Cohen’s d is used as the standard effect size measure throughout this review. However, it is important to note that effect size will depend on the type of control group used. If the control group has also received treatment, effect sizes will be smaller than if it was untreated. Where it has not been possible to report effect sizes, ratio gains (i.e. rates of monthly gain) have been reported instead (and sometimes additionally to effect sizes).
7) Research studies on interventions for dyslexia carried out the UK, and in the USA and other countries, are considered in separate chapters because of differences in school systems and approaches to special educational needs.
Studies of secondary intervention (Chapter 2)
8) ‘Secondary intervention’ is a generic term for the provision of more intensive instruction given individually or in groups to failing readers in the first 3-4 years of schooling. The term does not refer to intervention given in secondary school.
9) There have been several important reviews and meta-analyses of the impact of secondary intervention in the USA and other countries. Over 100 studies are covered by these reviews, the results of which are summarised in this report. In addition, eight high-quality studies of secondary intervention programmes using phonological approaches with children with dyslexia or learning disabilities are considered in more detail.
10) The results of the reviewed studies indicate that such interventions are beneficial for children with dyslexia, even when instruction is provided by non-teachers, provided they have received adequate training, and even when instruction is given to small groups of children (up to 4–5 children per group).
11) The average effect size of gains of intervention groups over controls or comparison groups for phonic skills was 1.02, for word reading accuracy 0.80 and for reading comprehension 1.86.
Intervention for Dyslexia 7
12) The most effective studies were found to share the following essential elements: (i) explicit training in phonological awareness, (ii) strong focus on phonological decoding and word-level work, (iii) supported and independent reading of progressively more difficult texts, (iv) practice of comprehension strategies while reading texts, and (v) instruction that is systematic and intensive.
13) Long-term studies show that systematic phonological secondary interventions continue to have benefit for the literacy development of most children whose reading is impaired. However, a proportion (probably between 1.5% and 3%) of children remain below target levels and will thus require further help.
Studies of tertiary intervention (Chapter 2)
14) ‘Tertiary intervention’ is a generic term referring to the most intensive special education given from age 8–9 onwards and typically delivered 1:1. The term does not refer to intervention given at the tertiary stage of education, i.e. further and higher education. Twelve high-quality studies carried out in the USA that applied such methods are reviewed here.
15) The results of tertiary interventions indicated that children with dyslexia or learning disabilities are generally able to benefit significantly and substantially from intensive phonologically-based instruction. Growth rates were most marked in phonic decoding skills. Text reading accuracy and reading comprehension of these children can be accelerated but reading fluency of these students tends to remain weak or poor.
16) On average, children in tertiary intervention start with reading skills at the 3rd centile and at the end of the interventions have reading accuracy at the 17th centile, phonic decoding skills at the 38th centile and reading comprehension at the 24th centile.
17) Provided instruction is high-quality and sufficiently intensive, there is evidence that similar results can be achieved with small-group instruction as in 1:1 instruction.
18) The studies of both secondary and tertiary interventions from around the world show that phonologically-based elements (including phonics) are key to their success.
UK studies of intervention (Chapter 3)
19) Thirty-one published UK studies of interventions for dyslexic children or very poor readers using eleven different phonologically-based programmes are reviewed, together with four published studies of the effectiveness of teaching provided by schools or organisations that specialise in phonologically-based intervention for dyslexic pupils.
20) The results of UK studies demonstrate that, in general, systematic phonologically-based interventions work for these disabled readers. The average ratio gains obtained in these studies were 4.44 for reading accuracy, 4.13 for reading comprehension, and 2.75 for spelling, with medium to large effect sizes
8 Intervention for Dyslexia

(0.56 for reading accuracy, 0.91 for reading comprehension, and 0.59 for spelling). It should be noted, however, that very few of these schemes have been evaluated specifically with children who have dyslexia.
21) Studies of large samples of older dyslexic pupils in UK specialist schools and teaching centres have found the literacy progress of these dyslexic pupils is significantly accelerated, and in many cases they achieve well within the normal range. However, the rates of gain tend to be more modest (ratio gains in the range 0.86–2.0) and, in some cases, further efforts will be necessary for them to catch up with their peers. It should be noted that these organisations tend to take children with the most severe difficulties and co-morbid conditions, and hence slower rates of progress are to be expected. Dyslexic pupils who do not receive intervention generally decline steadily in literacy relative to their peers and hence, arguably, the achievement of ratio gains of 1.0 or greater represents substantial progress for these ‘hard to teach’ pupils.
Screening and assessment (Chapter 4)
22) The chief purpose of screening and/or assessment is to identify children who require intervention. Identification of children with dyslexia was traditionally carried out by educational psychologists using approaches that relied on the identification of a discrepancy between IQ and attainments in literacy.
23) In response to research evidence, reliance on discrepancy has declined in favour of using measures of cognitive factors associated with dyslexia, such as phonological processing, verbal memory, and information processing speed. Teachers are now using tests that measure these factors and, increasingly, undertake the identification of dyslexic children.
24) There are many published studies on the early predictors of reading difficulties. The strongest early predictors include verbal memory, phonological awareness, letter identification, object naming and general language skills. Use of screening tests assessing these skills is probably the best way to identify children at risk of reading failure at the earliest stages of schooling. As children get older, phonic decoding, text reading fluency and spelling are also valuable indicators.
25) Issues concerning the validity and accuracy of screening tests are discussed. Misclassification errors in screening, i.e. false positives (‘false alarms’) and false negatives (‘misses’), need to be minimised as these have implications for children’s education and for the proper allocation of educational resources. Training of specialist dyslexia teachers should include instruction regarding the limitation of screening and how to judge the usefulness of educational tests.
26) Seven tests that are widely used in UK schools for screening for dyslexia are reviewed; two are conventional tests and the rest are computer-based. There is a considerable weight of evidence that screening and early assessment can identify children at risk of dyslexia. Although there are likely to be some false positives whose difficulties are not caused by dyslexia, these children will also benefit from systematic, phonologically-based interventions. Monitoring or assessment at each stage of the educational process can help to ensure that dyslexic children have not slipped through the net.
Intervention for Dyslexia 9

27) An approach to the identification of dyslexia that involves screening, or early assessment, using a range of cognitive and early literacy measures that are known to be good predictors, is consistent with the SEN Code of Practice.
28) The child’s response to an intervention (RTI) can also play a part in the identification process as well as helping determine the severity of a child’s difficulties. However, although this approach can be useful in identifying children with severe dyslexia because they are harder to remediate, it is probably less helpful in the identification of dyslexic pupils whose inherent phonological difficulties are mild, and hence such cases could slip through the net.
29) Although the correlation between early reading ability and later reading ability is relatively high (usually in the region 0.6–0.7), poor early reading ability per se is not by necessarily a very good predictor of later literacy difficulties in individual cases. Hence screening for poor reading skills without taking into account cognitive predictors risks letting dyslexic children slip through the net.
30) When carrying out assessment it is important to distinguish between dyslexia and visual stress. Visual stress has generally been identified either by the child reporting symptoms or making a judgment that text is easier to read with a certain colour rather than another. These approaches can be unreliable (especially with younger children), but an objective computerised method of screening for visual stress based on visual search tasks has recently been developed.
Reading Recovery (Chapter 5)
31) A specific remit of the review was to address the question: ‘What evidence is there that Reading Recovery is, or is likely to be, an appropriate method of intervention for children with dyslexia?’
32) Reading Recovery is a 1:1 intervention programme for young struggling readers, delivered by specially trained teachers. Originally based on the whole-language approach, Reading Recovery traditionally de-emphasised decoding in favour of teaching strategies for recognising words in the context of meaningful text reading and writing.
33) There are tensions between the theory behind Reading Recovery – in which reading is regarded as the integration of information from semantic, syntactic, graphophonic and visual sources – and the ‘simple’ view of reading, in which a distinction is drawn between word recognition and reading comprehension. Since the ‘simple’ view of reading is the theoretical framework that currently underpins Wave 1 phonics teaching, it is difficult to understand current government endorsement of Reading Recovery as a Wave 3 intervention because this endorsement is in conflict with what the National Strategies team is now promoting as quality first teaching.
34) It has often been suggested that Reading Recovery would be improved and would be more appropriate for dyslexic pupils if the methods included systematic teaching of phonics, and in recent years there have been moves in this direction by Reading Recovery. Currently, although Reading Recovery includes some
10 Intervention for Dyslexia
instruction in phonics, it cannot be claimed that such phonics teaching is systematic or comprehensive.
35) International reviews of Reading Recovery have mostly been positive, concluding that, although costly, Reading Recovery generally resulted in significant gains in reading. It has also been noted that it was less effective in maintaining those gains and it would be an unwise strategy to shift all resources for remediation into Reading Recovery because some students would be likely to require additional or continuing support.
36) Independent research studies show benefits for many children on Reading Recovery programmes. However, comparisons of the ratio gains made by children in Reading Recovery and in systematic phonologically based interventions appear on balance to favour the latter.
37) Since 2005, the Every Child a Reader initiative (ECaR) has been providing Reading Recovery within a broader programme to increasing numbers of Year 1 pupils in England. The ECaR annual reports show that about 85% of enrolled children successfully complete the programme and are raised to at least the average reading level of their class. Over a third of these pupils, who, when they started the programme, were among the lowest achievers in their classes, progress to achieving Level 2b (the national target level) or better in Key Stage 1 National Curriculum assessments in reading. A quasi-experimental study in London has provided further support for the approach.
38) Analysis of National Curriculum assessment results of children on Reading Recovery programmes over the period 2003–2007 does not support the view that Reading Recovery in England and Wales achieves its stated goal for “children to develop effective reading and writing strategies in order to work within an average range of classroom performance”. Only 12%–15% of Reading Recovery children completing their programmes between 2003 and 2007 achieved a Level 2a or above in Key Stage 1 Reading National Curriculum assessments, the level at which children can tackle unfamiliar words and have therefore developed a self-sustaining word recognition system.
39) Literature searches failed to uncover any published evaluations of Reading Recovery being used with dyslexic pupils. To decide the question whether Reading Recovery actually works for children with dyslexia therefore requires further research. However, dyslexic children, by definition, have specific problems in acquiring effective knowledge of letter-sound relationships and of the rules that govern these, and in order to become independent readers who can tackle unfamiliar words, they are likely to need more rather than less intensive instruction in phonics. In consequence, it is unlikely that Reading Recovery – in which the teaching of phonics is less than systematic and which enables only a rather small proportion of children taught by this method to tackle unfamiliar words – would be an effective intervention for dyslexia.
Dyslexia in older pupils and use of computer technology (Chapter 6)
40) Older students with dyslexia continue to face difficulties in learning even if they have received appropriate intervention and have been able to improve their literacy skills significantly as a result.
Intervention for Dyslexia 11
41) Dyslexic students can be effectively supported in secondary schools using a variety of techniques, including (i) differentiation in writing activities with emphasis on systematic drafting and redrafting, (ii) peer tutoring, (iii) specialised spelling support, (iv) raising awareness of subject teaching staff, and (v) use of computer technology.
42) Computers can be used as part of the instructional process in order to help children learn basic skills and curriculum-related material (commonly known as ‘computer assisted learning’ or CAL, for short), and also to facilitate reading, writing and the organisation of information by means of technologies such as text-to-speech, voice input and planning tools. The principal advantages of CAL for dyslexic learners are that it enhances motivation, provides individualised instruction, provides immediate informative feedback, creates an active learning environment, and can monitor the pupil’s performance.
43) The impact of computer assisted learning on the development of literacy in children with dyslexia or learning disabilities has been found to vary from study to study. There is little evidence that large-scale Integrated Learning Systems are helpful for pupils with dyslexia, but smaller-scale, more carefully targeted CAL programs can have significant impact on reading and spelling, particularly when programs incorporate speech feedback. In addition, CAL can have motivational benefits for children with dyslexia.
44) The difficulties that dyslexic students encounter in secondary school may be addressed using a variety of support techniques. Conventional instruction and training can still contribute, but, increasingly, assistive technology is used to support the learning of older dyslexics. Research studies on this are rare, but those that have been published indicate that word processing activities significantly improve writing and spelling skills, especially when these include functions that afford enhanced support (e.g. speech feedback).
12 Intervention for Dyslexia

Acknowledgements
I would like to express my gratitude to the following people, who greatly assisted me with the preparation of this review.
The members of the Steering Committee of the ‘No To Failure’ Project (Lynn Greenwold, Judi Stewart, Shirley Cramer, Kate Griggs and Graeme Snow), who commissioned me to undertake the review in the first place and who gave me their encouragement throughout.
Greg Brooks, whose detailed compilation of UK intervention studies in the 3rd edition of the report ‘What works for pupils with literacy difficulties?’ (Brooks, 2007) was invaluable in the preparation of Chapter 3. Greg also helped me by proving detailed annotations and extremely useful critical observations on the first and second drafts of this review, and by assisting me in revising Chapter 5.
Maggie Snowling, whose incisive comments on the first draft sharpened my thinking on many of the important issues and enabled me to clarify many points.
Jim Rose and my fellow members of the DCSF Dyslexia Expert Advisory Group set up to assist Jim in the preparation of a review of provision for dyslexic pupils in schools in England (Maggie Snowling, Greg Brooks, Morag Stuart, Rea Reason, John Rack, Bob Burden, Geraldine Price, Mark Sherin and Yvonne Griffiths), who devoted time to reading the first draft and to discussing it with me.
Jean Gross, Director of Every Child a Reader, who provided detailed critical comments on the first draft, especially on Chapter 5, and also her colleague Julia Douëtil, who provided a critical analysis of the arguments in Chapter 5 and drew my attention to some studies of Reading Recovery and Every Child a Reader of which I had previously been unaware.
Staff in the Special Educational Needs and Disability Division of the Department for Children, Schools and Families, who facilitated the work in numerous ways, and who gave helpful feedback on the first draft of the review.
Mike Vickars, who painstakingly proofread the first draft.
Last, but by no means least, my wife Brenda, who, recognising the potential importance of this work for the education of dyslexic children, gave me unselfish and dedicated moral support during the intensive period of research and writing.
Chris Singleton Hull, May 2009

1 Introduction
1.1 Aims and scope This review has been commissioned by the Steering Committee for the ‘No To Failure’ project and funded by the Department for Children, Schools and Families. The aim is to summarise published research evidence on the impact of specialist teaching on progression and outcomes for children from aged 5 to 18 with dyslexia/specific learning difficulties (SpLD). This review will, in turn, form part of the evidence to be considered by Jim Rose in the review of, and recommendations on, dyslexia provision in schools that he has undertaken on instructions from the Secretary of State for Children, Schools and Families (DCSF), and which is scheduled to be submitted in April 2009.
1.1.1 Remit
The scope of this review, as set by the commissioning remit, is as follows:
a summary of published evidence on the impact of specialist teaching on progression and outcomes for children with dyslexia
a summary of published evaluations of Reading Recovery both within ECaR and more generally
a summary of whatever published evidence there may be on the impact of Reading Recovery specifically on the progression of children with dyslexia
a review of the evidence as to the extent to which the methodologies used were as robust as recommended in the review ‘What works for pupils with literacy difficulties?’ (Brooks, 2007)
questions about the range of screening tools available, and the varied definitions of dyslexia that are associated with them
any research evidence suggesting that reading is the main difficulty that arises for children with dyslexia at KS1, whereas other difficulties additionally emerge at KS2.
1.1.2 Limitations
This review aims to be thorough and authoritative but cannot be considered exhaustive or comprehensive. Because of the restricted time-span of this commission and the limited resources available to the author, it has not been possible to search the international literature as intensively as would normally be expected, nor to follow up all publications uncovered by searches, nor to undertake a systematic review in the full technical sense. It has not even been possible to report on every publication in the field that was located and examined. Nevertheless, and with those reservations, every attempt has been made to address the issues in a detailed and careful way in order that the review will be helpful to Jim Rose and those assisting him.
14 Intervention for Dyslexia

The remit calls for conclusions to be drawn regarding the key questions, and hence conclusions have been drawn wherever possible, using all the evidence presented. Undoubtedly there will be other evidence on these issues that might have been included, but, because of the limitations outlined above, the focus has been on the major strands of research in the field and with emphasis on studies employing robust methods that have yielded the most trustworthy scientific evidence.
A key part of the remit was to restrict the review to published evidence. Although the schools and organisations that provide specialist dyslexia teaching will almost certainly have data on the progress of their pupils, regrettably very little of this has been published.
1.1.3 The author
Since this is an evaluative review some comment on the qualifications of the author are appropriate. The author is Senior Lecturer in Educational Psychology at the University of Hull, PhD in psychology, Associate Fellow of the British Psychological Society, and a Chartered Psychologist. In addition, he was director of the Psychological Assessment Unit at the University of Hull for over 10 years. He is also Research Director of Lucid Research Limited, which develops and publishes educational software.
The author has been working in the fields of dyslexia and literacy difficulties as an academic, published researcher and independent practitioner for more than 25 years and is very familiar with the published literature. As an editor/associate editor of the Journal of Research in Reading for 16 years, he is also accustomed to evaluating research in these fields. In particular, he has been editor of several special issues of the Journal of Research in Reading, including ‘Dyslexia in Literate Adults’ (1997), ‘Computers and Literacy’ (2000), ‘Assessment of Literacy’ (2004), ‘Visual Factors in Reading’ (2005, subsequently published in book form), and ‘New Developments in Literacy and Technology’ (2009). Other major publications in this context include ‘Computers and Dyslexia’ (Singleton, 1994) and ‘The Psychological Assessment of Reading’ (Beech and Singleton, 1997). He has also co-authored over a dozen computerised psychological tests that have been published by Lucid Research Limited and which are used in UK schools and elsewhere in the world.
During the late 1990s the author was chair of the National Working Party on Dyslexia in Higher Education, which was commissioned by Department for Education and Skills (DfES) and the Higher Education Funding Councils for England, Scotland and Wales to investigate and report on policy and provision for dyslexic students in universities, and to make recommendations on good practice. The report of that working party (Singleton, 1999) was influential in establishing consistency of good practice in identifying and supporting dyslexic students across all UK universities.
The author was also a member of the DfES working group that developed new national guidelines on assessment and identification of dyslexic students in higher education, which came into force in 2007. He is currently the independent evaluator for the ‘No To Failure’ project that has been carrying out a major intervention programme with children in 20 schools who were identified as at risk of dyslexia, and which is due to report in the spring of 2009. The author is also currently a member of the Expert Advisory Group on Dyslexia set up by the DCSF to assist Jim Rose in his work connected with the review of dyslexia provision in schools.
Intervention for Dyslexia 15

1.2 Definitions of dyslexia Space (and time) precludes a discussion regarding the nature of dyslexia in these pages. Interested readers seeking authoritative overviews are referred to Snowling (2000), Vellutino et al. (2004), and Vellutino and Fletcher (2005). However, how dyslexia is (or should be) defined is highly pertinent in determining which studies to include and which to exclude. This review encompasses research carried out elsewhere in the world, and may be contrasted, for example, with that of Brooks (2007), which was confined to UK studies. The vast majority of non-UK studies covered in these pages were carried out in the USA and hence it is also necessary to address the issue of how dyslexia is defined in each of these two countries. In the UK, where dyslexia has never been legally defined (although it is a legally recognised disability) the approach has been somewhat different to that adopted in the USA, where dyslexia has been the subject of (controversial) legal definition and debate at Congressional level. In both countries, however, there have been many different published definitions as well as vigorous debate about how the condition should be defined (e.g. Lyon, 1995; Miles, 1995; Singleton, 2008a; Tønnessen, 1997).
In this review, studies of samples that meet either the chosen UK definition of dyslexia (see Section 1.2.1) or the definition of ‘Learning Disability’ in the USA (see Section 1.2.2) have been included. However, as will be seen in Chapter 3, the majority of UK studies have not clearly identified the children in the samples as having ‘dyslexia’. To have excluded studies that did not explicitly use the label ‘dyslexia’ (or specific learning difficulties) would have seriously limited the scope of the review. Thus in order to examine as fully as possible the range of intervention programmes that meet the definition of ‘specialist dyslexia teaching’ given in Section 1.3, this review also includes studies in which the children have significant difficulties in some or all aspects of literacy (below standard score 85, or at least one standard deviation below the mean).
1.2.1 United Kingdom
Although dyslexia has been a legally-recognised disability in the UK for almost forty years (Chronically Sick and Disabled Persons Act 1970, Section 27), and is referred to in the Special Educational Needs Code of Practice (DfES, 2001, paragraphs 7:55 and 7:58), there is no legal definition of dyslexia in this country. A variety of definitions of dyslexia have been produced by different academic, professional and lay organizations (for discussion see Singleton, 2008a, pp.5-9) but consideration of these is outside the scope of this review. Instead, the following definition of dyslexia, to which the author subscribes, has been adopted for the purposes of this review. This definition has been agreed by the DCSF Expert Advisory Group on Dyslexia.
Dyslexia primarily affects the skills involved in accurate and fluent word reading and spelling.
Characteristic features of dyslexia are difficulties in phonological awareness, verbal memory and verbal processing speed.
Dyslexia occurs across the range of intellectual abilities.
It is best thought of as a continuum, not a distinct category, and there are no clear cut-off points.
16 Intervention for Dyslexia

Co-occurring difficulties may be seen in aspects of language, motor co-ordination, mental calculation, concentration and personal organisation, but these are not, by themselves, markers of dyslexia.
A good indication of the severity and persistence of dyslexic difficulties can be gained by examining how the individual responds or has responded to well founded intervention.
1.2.2 United States of America
In the USA, the International Dyslexia Association proposed the following definition of dyslexia, which has been widely accepted:
“Dyslexia is one of several distinct learning disabilities. It is a specific language-based disorder of constitutional origin characterized by difficulties in single word decoding” (Lyon, 1995, p. 7)
However, in the USA the term ‘dyslexia’ does not have a legal meaning; instead the term ‘Learning Disabilities’ is used (typically abbreviated to ‘LD’), which was defined in US federal law as:
“A severe discrepancy between achievement and intellectual ability in one or more of the areas: (1) oral expression; (2) listening comprehension; (3) written expression; (4) basic reading skills; (5) reading comprehension; (6) mathematics calculation; or (7) mathematics reasoning. The child may not be identified as having a specific learning disability if the discrepancy between ability and achievements is primarily the result of: (1) a visual, hearing or motor handicap; (2) mental retardation; (3) emotional disturbance; or (4) environmental, cultural, or economic disadvantage.”
(US Office of Education, 1977, p. G1082)
The use of an IQ–achievement discrepancy criterion began to be popular during the 1970s (Rutter & Yule, 1975, Singleton, 1977) and subsequently found its way into definitions of specific reading disorder in the two international professional manuals on diagnosis: DSM-IV and ICD-10. For many years IQ–achievement discrepancy was commonly used by educational psychologists for identifying dyslexia or specific learning disabilities (see Singleton, 1987, 1988). However, subsequent research findings have undermined its validity (for review, see Stuebing et al., 2002). In particular, there is little evidence that the long-term development of poor readers who are IQ–achievement discrepant is substantially different to that of poor readers who are not IQ–achievement discrepant (Shaywitz et al., 1999), nor does IQ–achievement discrepancy reliably distinguish between those who are difficult to remediate and those who are more easily remediated (Vellutino et al., 2000; Meyer, 2000). Consequently, IQ–achievement discrepancy is no longer the bedrock for identification of LD in the US (or of dyslexia in the UK, for that matter), although on both sides of the Atlantic strong cases have been made in favour of retaining the use of IQ assessment as part of the identification process (see Kavale, 2005; Thomson, 2003).
The US federal definition of LD has been widely criticized (see Kavale & Forness, 2000; Lyon et al., 2001) and in 2004 the US Congress passed statutes that allowed for LD to be identified without recourse to IQ–achievement discrepancy, including use of the response to intervention approach (RTI), which is considered in more detail in Section 4.1.3.
Intervention for Dyslexia 17
1.3 What is ‘specialist dyslexia teaching’?
1.3.1 The nature of the problem
Current research evidence shows that children with dyslexia experience substantial problems in mapping letters on to sounds and, consequently, these children have difficulties in learning how to decode written or printed words by application of phonic rules that depend on this mapping ability (Snowling, 2000; Vellutino & Fletcher, 2005; Vellutino et al., 2004). The vast majority of specialist teaching approaches for dyslexia are designed directly to address the dyslexic child’s difficulties in learning to decode using phonics (see Torgesen, 2005b).
1.3.2 Historical overview
Most approaches currently in use can be traced back to pioneering work in the 1940s by Gillingham and Stillman, who were guided by the principles developed by their mentor, the neurologist Samuel Orton, during the 1930s. Although Orton’s theories about dyslexia have long been superseded, the principles behind the teaching methods of Gillingham and Stillman have stood the test of time and now form the basis for many teaching programmes.
Gillingham and Stillman’s teaching textbook was first published in 1946, and by 1969 was in its fifth edition. The following quotation sums up their method succinctly:
“The technique…is based upon the constant use of association of all of the following – how a letter or word looks, how it sounds and how the speech organs or the hand in writing feels when producing it.” (Gillingham & Stillman, 1969, p. 17)
This technique has sometimes been referred to as the ‘Orton-Gillingham approach’ but is now generally referred to simply as ‘multisensory teaching’, as explained by the International Dyslexia Association:
“Multisensory teaching is simultaneously visual, auditory, and kinesthetic-tactile to enhance memory and learning. Links are consistently made between the visual (what we see), auditory (what we hear), and kinesthetic-tactile (what we feel) pathways in learning to read and spell. Teachers who use this approach teach children to link the sounds of the letters with the written symbol. Children also link the sound and symbol with how it feels to form the letter or letters.” (IDA, 2000)
The methods used by Gillingham and Stillman were extremely systematic and involved a great deal of repetition. Summing up this approach, Rawson (1968), an early advocate of specialist dyslexia teaching, emphasized that multisensory teaching programmes for dyslexics needed to be structured, sequential, cumulative and thorough, principles that have since become firmly enshrined in mainstream specialist teaching for dyslexics.
1.3.3 Current perspectives on specialist dyslexia teaching
In the UK, ‘specialist dyslexia teaching’ may be regarded as an umbrella term for the approaches that are used by teachers who have undergone specialist training and attained qualifications in the teaching of children and adults with dyslexia. Training courses are accredited by the British Dyslexia Association, and qualifications are at two levels: Associate Membership of the British Dyslexia Association (AMBDA) and Approved
18 Intervention for Dyslexia

Teacher Status (ATS). In general, courses leading to AMBDA are postgraduate diploma (Level 7), and those leading to ATS are postgraduate certificate (Level 5). These training courses cover topics such as:
The concept of dyslexia
Definition and identification of dyslexia
Theory and research on dyslexia
Legal and statutory frameworks
Co-morbid difficulties
Assessment tools and techniques
Screening
Teaching resources, including use of ICT
Structured phonics programmes
Design of individual multisensory teaching programmes
Emotional and behavioural issues and self-esteem
Strategies for effective writing
Developing memory strategies
Study skills
Revision strategies and preparation of exams
Special arrangements for GCSE and ‘A’ level examinations
Working with parents and other professionals.
Structured multisensory phonics tuition is a core feature of specialist dyslexia teaching, except where the teacher is supporting older pupils or students at college or university, where the principal focus is more likely to be on writing, study skills, and preparation for examinations. Thomson (1990) reviewed a range of established UK multisensory teaching programmes for teaching dyslexics, including ‘Alpha to Omega’ (Hornsby and Shear, 1974) and the Hickey language training course (Hickey, 1977; Augur & Briggs, 1992) – which were the first UK systems based on Gillingham-Stillman – but also subsequent publications such as the Bangor Teaching Programme (Miles, 1989) and the Aston Portfolio (Aubrey et al., 1981). Thomson identified the following features common to all these programmes:
Phonetic
Multisensory
Cumulative
Sequential
Intervention for Dyslexia 19
Progressive
Small Steps
Logical
Overlearning.
The last of these points (overlearning) refers to the systematic use of repetition, both within and between lessons, in the attempt to ensure that newly acquired skills and material are automatised, consolidated in memory, so that they can be readily applied or recalled when needed, and will not be disrupted or confounded by subsequent lesson material.
For many years the Hickey programme was the principal basis for phonologically-based teaching provided by the Dyslexia Institute until Walker and Brooks (1996) developed the variant called the Dyslexia Institute Literacy Programme (DILP), which remains the basis for teaching provided by Dyslexia Action.1 Like Thomson, Walker and Brooks (1996) also emphasise the importance of overlearning. Walker (2000) has specified five key principles of specialist teaching for children with dyslexia and has outlined the reasons behind these (see Table 1).
In a similar review, Townend (2000) stresses the importance of teaching phonological awareness, specifying that a specialist teaching programme for children with dyslexia should incorporate the following:
Structure – i.e. logical progression of elements with small steps teaching and explicit links being made between steps.
Multisensory – i.e. active and interactive integration of visual, auditory, kinaesthetic and tactile elements.
Reinforcement – i.e. reinforcement of all skills through regular practice to provide automatic access to all components of learning.
Skill teaching – i.e. teaching should concentrate on the development of useful and transferable skills rather than on learning facts and information, which would create unnecessary burdens on memory.
Metacognition – i.e. encouraging the student to think about what strategies and approaches would be best for them to use in different circumstances.
Thus according to all three authors who have reviewed this field – Thomson, Walker and Townend, all of whom have been professionally engaged in specialist dyslexia teaching themselves for many years – as well as being multisensory and phonologically based, the key features of specialist dyslexia teaching are that it is ‘structured’, ‘cumulative’ and ‘sequential’. For convenience these last three features may be summed up in one term: systematic.
1 Dyslexia Action is an educational charity that was established in 2006 following the merger of the Dyslexia Institute and the Hornsby International Dyslexia Centre.
20 Intervention for Dyslexia
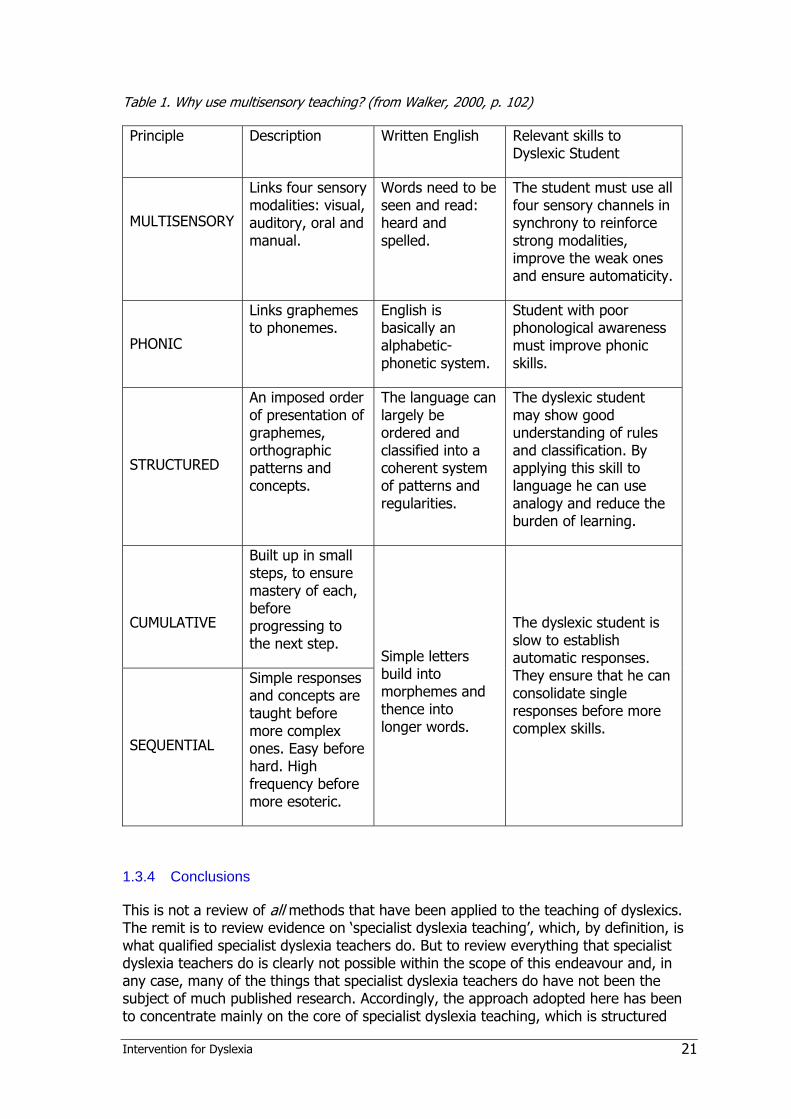
Table 1. Why use multisensory teaching? (from Walker, 2000, p. 102)
Principle Description Written English Relevant skills to Dyslexic Student
MULTISENSORY
Links four sensory modalities: visual, auditory, oral and manual.
Words need to be seen and read: heard and spelled.
The student must use all four sensory channels in synchrony to reinforce strong modalities, improve the weak ones and ensure automaticity.
PHONIC
Links graphemes to phonemes.
English is basically an alphabetic-phonetic system.
Student with poor phonological awareness must improve phonic skills.
STRUCTURED
An imposed order of presentation of graphemes, orthographic patterns and concepts.
The language can largely be ordered and classified into a coherent system of patterns and regularities.
The dyslexic student may show good understanding of rules and classification. By applying this skill to language he can use analogy and reduce the burden of learning.
CUMULATIVE
Built up in small steps, to ensure mastery of each, before progressing to the next step.
SEQUENTIAL
Simple responses and concepts are taught before more complex ones. Easy before hard. High frequency before more esoteric.
Simple letters build into morphemes and thence into longer words.
The dyslexic student is slow to establish automatic responses. They ensure that he can consolidate single responses before more complex skills.
1.3.4 Conclusions
This is not a review of all methods that have been applied to the teaching of dyslexics. The remit is to review evidence on ‘specialist dyslexia teaching’, which, by definition, is what qualified specialist dyslexia teachers do. But to review everything that specialist dyslexia teachers do is clearly not possible within the scope of this endeavour and, in any case, many of the things that specialist dyslexia teachers do have not been the subject of much published research. Accordingly, the approach adopted here has been to concentrate mainly on the core of specialist dyslexia teaching, which is structured
Intervention for Dyslexia 21

multisensory phonics tuition, and furthermore to restrict the selection of studies and programmes to those to where teaching is:
i) additional to that normally provided (otherwise it cannot be considered specialist, nor an intervention, and neither would it qualify as ‘special educational provision’ under the terms of the Education Act 1996); and
ii) focused directly on developing literacy skills, and
iii) systematic, i.e. there must be a predetermined pattern of teaching and learning activities, based on the child’s needs and difficulties, that conforms to a set structure and in which elements are introduced in a logical sequence of cumulative steps.
Consequently, this review does not encompass indirect methods designed to remediate children with dyslexia, such as teaching study strategies, nor what are often referred to as ‘alternative therapies’. Alternative therapies include taking vitamins or dietary supplements, training primitive reflexes, eye occlusion (patching) and developing balance and motor skills. For reviews and critiques of these indirect or alternative approaches see Bishop (2007; 2008), Fawcett (2002b), and Rack et al. (2007). These reviews show that such methods generally have a weak (or non-existent) evidence base and poor efficacy, and often rely on the superficial attractiveness of a promised instant (and comparatively effortless) ‘cure’ compared with the considerably lengthier and more difficult intervention necessitated by sustained specialist teaching. Unlike almost all other scientific commentators in the field, Fawcett is hesitant to reject what she refers to as ‘complementary therapies’ for dyslexia and sees a potential role for them alongside traditional phonologically-based treatments. Note that Fawcett (2002b) classes coloured overlays/lenses as ‘complementary therapies’ for dyslexia when, in fact, they are treatments for visual stress, a neurological phenomenon that is quite distinct from dyslexia although it is rather more common in dyslexic people than in the rest of the population (see Section 1.4).
With the exception of Reading Recovery, which is an explicit part of the remit, this review has therefore not considered direct methods for teaching of literacy that are not principally phonically based, as this cannot be considered to come under the heading ‘specialist dyslexia teaching’. Several such methods have been reviewed by Brooks (2007) and many produce good results with poor readers, although it would appear that none has been specifically applied to dyslexics. Brooks (2007) also reviews a variety of phonically based approaches for which there do not seem to be any published studies that have included known dyslexic participants. However, since these other phonically based approaches, by their very nature, have the potential to be usefully applied to dyslexics, they have been considered in this review.
1.3.5 Wider roles of the specialist dyslexia teacher
The criteria established in Section 1.3.4 do not mean that the specialist dyslexia teacher has no roles other than the delivery (or supervision) of programmes of systematic intervention, nor that when such programmes have come to an end (and, hopefully, the child’s reading skills have been ‘normalised’ – i.e. brought to within the normal range appropriate for their age) the specialist dyslexia teacher plays no further part in the education of that child. Students with dyslexia face ongoing educational challenges in addition that of mastering basic literacy skills (see Reid, 2003). The specialist dyslexia teacher fulfils many other important educational functions that are essential if dyslexic
22 Intervention for Dyslexia

pupils are going to be identified and enabled to achieve their best, most notably screening and assessment, which is dealt with in Chapter 4. However, a distinction may perhaps be drawn between specialist dyslexia teaching, which is concerned specifically with improving the literacy skills of dyslexic pupils and which has been defined above, and supporting dyslexic pupils, which takes us into the wider realms of enabling dyslexic pupils to become independent learners who can access the whole curriculum. The latter activity includes a range of educational activities, including helping pupils to develop study and organisational skills (e.g. mind-mapping, revision strategies) and to use assistive technology (e.g. text-to-speech aids, spelling checkers), arranging special provision for examinations (e.g. additional time, use of a word processor), providing guidance for class and subject-specialist teachers in ways that work can be differentiated for dyslexic pupils in the mainstream classroom, and liaising with parents regarding how they can help the child to overcome their difficulties. These are roles that trained specialist dyslexia teachers should be particularly well qualified to fulfil, but it cannot be claimed that these additional educational functions are the exclusive remit of the specialist dyslexia teacher. Special educational needs coordinators (SENCos), if appropriately trained, can also undertake these roles, and indeed often do so in relation to children who have special educational needs but who do not have dyslexia. Furthermore, there is a strong case for some of these educational activities (e.g. focus on study and organisational skills) being made available to all pupils, not just those with special educational needs.
To fully review evidence on such a broad-ranging list of ways in which dyslexic pupils may be supported is clearly outside the scope of this review, but useful overviews can be found in Reid (2003) and Townend and Turner (2000). However, some pertinent aspects of wider support for older dyslexic learners are discussed in Chapter 5.
1.4 Visual stress and dyslexia
1.4.1 Visual dyslexia?
The term ‘visual dyslexia’ is occasionally encountered in the published literature as well as in the websites of a few optometric practices and companies selling products which purport to treat reading problems that may have a visual cause. It will be noted that there is no mention of vision or visual processes in the definition of dyslexia given in Section 1.2.1. The reason for this is that, although visual factors clearly impact on reading (see Cornelissen and Singleton, 2007), evidence for a role of vision or visual processing in dyslexia is weak. Hence the term ‘visual dyslexia’ is contradictory and misleading, but, because of the potential for misunderstanding, it is necessary to address the matter in this review.
In fact, when the term ‘visual dyslexia’ is encountered, it is usually the case that it is being applied not to dyslexia, but to visual stress, which is a quite different condition. Visual stress is the subjective experience of unpleasant visual reactions when reading (especially for prolonged durations) and in response to some other visual stimuli. Visual stress is not currently regarded as a medical disorder but it is well documented in international peer-reviewed scientific and medical practitioner journals. Visual stress is a surprisingly common condition: although reported rates of prevalence vary according to the criteria and type of sample used, incidence of visual stress in unselected samples is generally accepted to be about 20% (Jeanes et al., 1997; Kriss & Evans, 2005; Wilkins, Jeanes, Pumfrey & Laskier, 1996).
Intervention for Dyslexia 23

The characteristics of visual stress fall into two categories: firstly, discomfort (e.g. sore, tired eyes; headaches; photophobia); secondly, visual-perceptual distortions and illusions (e.g. illusions of shape, motion, and colour in the text; transient instability of focus; double vision). These reactions were first noted independently by Meares (1980) and Irlen (1983), who also both observed that the unpleasant effects can usually be alleviated by using colour, in the form of either acetate sheets placed over the text (‘coloured overlays’) or tinted spectacles. Since its discovery, the condition has been given various labels (some more appropriate than others), including ‘Irlen syndrome’, ‘Meares-Irlen syndrome’ (sometimes abbreviated to MIS), ‘visual discomfort’, ‘scotopic sensitivity syndrome’ and, as we have already seen, ‘visual dyslexia’. However, ‘visual stress’ is now generally recognised as the most appropriate term for the phenomenon (see Evans, 2001; Singleton and Henderson, 2007a; Wilkins, 2003).
1.4.2 The implications of visual stress for reading development
Visual stress interferes with the ability to read for any reasonable duration, and thus children who suffer from this problem tend to avoid reading. As a result, they lack the amount of practice that is essential for the development of fluent decoding of text and good reading comprehension (Tyrrell et al.., 1995). Practice enables decoding to become automatic, reading eye movements to become smooth and disciplined, and the brain to cope with processing and understanding large amounts of text. Consequently, although visual stress can occur in normal readers it is more often observed in poor readers (Jeanes et al., 1997). If visual stress is not identified and dealt with early on, children are at risk of remaining unskilled readers, particularly when trying to understand longer and more complex texts (Singleton, 2009).
Because visual stress can be a cause of special educational needs, teachers should be vigilant for the signs of this problem. There is also a strong case for screening children for visual stress, as in most cases it can be easily identified and readily treated. The most widely used treatment for visual stress is that of coloured tints either in the form of acetate overlays (the cheapest and easiest solution to implement in the classroom) or tinted lenses. The latter treatment is more expensive and requires assessment and prescription by an orthoptist, but provides a solution that is generally more convenient. However, it is important that the correct tint is selected in order to obtain optimum benefit (Wilkins, 2003). In most cases use of coloured tints reduces the unpleasant symptoms and makes reading more comfortable, thus increasing reading rate and amount of reading that children are willing to engage in (Bouldoukian et al.., 2002; Jeanes et al., 1997; Tyrrell et al., 1995; Whiteley & Smith, 2001; Wilkins & Lewis, 1999; Wilkins et al., 2001). There is also evidence that coloured tints gradually bring about improvements in reading accuracy and comprehension (Robinson & Foreman, 1999). It is important to note that screening for visual stress is different to screening for dyslexia; this issue is discussed in Section 4.3.6.
1.4.3 Relationship between visual stress and dyslexia
Coloured tints cannot be recommended as a generic treatment for dyslexia because in most cases they will not help the child. However, recent studies have revealed that the prevalence of visual stress is considerably higher in children and adults with dyslexia than in the rest of the population (Singleton & Henderson, 2006; Singleton & Trotter, 2005). Whiteley and Smith (2001) estimated the prevalence of visual stress in dyslexics to be in the region of 50%, a figure that has turned out to be not very far from those reported in several recent studies. Using percentage increase in rate of reading with a
24 Intervention for Dyslexia

coloured overlay as the criterion for assessing susceptibility to visual stress, Kriss and Evans (2005) found that 45% of dyslexic children read 5% faster with an overlay, compared with 25% of non-dyslexic control children; when a more conservative criterion of 8% increase in reading speed with an overlay was applied, these figures dropped to 34% and 22% respectively. Singleton and Henderson (2007b) found that 41% of dyslexic children in their sample showed high susceptibility to visual stress; the corresponding figure for the non-dyslexic control group was 23%. White et al. (2006) found that 35% of their sample of dyslexic children aged 8–12 years met criteria for visual stress, while only 18% of the non-dyslexic control group matched for non-verbal IQ met criteria for visual stress.
One theory of visual stress links the condition directly with dyslexia, the hypothesis being that both dyslexia and visual stress are mediated by deficits in the magnocellular visual system (Stein, 2001). However, the evidence on this is rather weak (see Everatt et al., 1999; Raymond and Sorensen, 1998; Singleton, 2008b; Singleton & Henderson, 2007b; Skottun, 2000, 2005; White et al., 2006). The theory of visual stress that has the most empirical support is that the condition is the result of a general over-excitation of the visual cortex due to hypersensitivity to contrast or pattern glare (see Evans, 2001; Wilkins, 2003). According to this theory, visual stress is not biologically connected with dyslexia, but is a normal consequence of variation in human sensitivity to certain types of visual stimulus. Wilkins’s theory is that the visual cortex functions normally until strong physiological stimulation, such as geometric repetitive patterns or stripes, results in stimulation of neurons that are close together. Repetitive patterns and stripes create square-wave on-off neural signals similar to those caused by flashing lights. Because these neurons share connections with neural systems that inhibit activation, normal inhibitory processes will be compromised if they all fire together because the availability of inhibitory neurotransmitter is reduced. The outcome is the triggering of other neurons that signal movement or colours, which are consequently experienced as illusions or hallucinations. In other words, the visual cortex works normally until stimulation is too strong, whereupon a catastrophic non-linear failure of inhibition occurs, which spreads to other neurons (Wilkins, 1995; Wilkins, Huang & Cao, 2004). The neurological effect is similar to that seen in migraine and photosensitive epilepsy.
Singleton (2008b) has suggested that the link between dyslexia and visual stress may not necessarily be causal. Visual stress discourages inclination to practise reading, which will create a ‘Matthew effect’ (Stanovich, 1986), i.e. the gap between good and poor readers will progressively widen as a function of differences in reading experience. It is likely that the dyslexic person’s lack of automaticity in word recognition (e.g. due to underlying deficits in phonology or memory) forces them to adopt techniques for processing text (e.g. detailed scrutiny of individual ‘problem’ words) that increase their sensitivity to the physical characteristics of the print. In turn, this will naturally tend to make the effects of visual stress worse. Indeed, Singleton (2009) has suggested that any factors that make reading more difficult, such as poor decoding skills or dyslexia, poor lighting condition, glare (e.g. from sunlight or excessively bright lighting), tiredness, or uncorrected visual impairments, will tend to increase the sensitivity of the neurological system and increasing the likelihood of triggering visual stress reactions.
Intervention for Dyslexia 25
1.5 Methods and measures
1.5.1 Methodology
The ideal, or ‘gold standard’, method for evaluating the effectiveness of interventions is the randomised control trial (RCT), in which children are randomly assigned to either an intervention group or a control group (or possibly to an alternative treatment group). Measures of performance or ability should be made at the outset of the study (pre-test), at the end of the study (post-test) and possibly at some later time (delayed post-test or follow-up). The persons delivering the intervention and those administering post-tests should, as far as possible, be ‘blind’ regarding which group they are working with. Most of the US studies reported in this review have used RCT (although rarely have they met al.l the ‘gold standard’ criteria); unfortunately, few of the UK studies have even used control groups, so are far from the ‘gold standard’. There has been criticism of many of the US studies of phonological interventions for failing to comply fully with criteria for RCT (Troia, 1999). On the other hand, in practice, strict adherence to ‘gold standard’ criteria is difficult, if not impossible, in this area of research. In particular, the teachers delivering the intervention may often realise what group they are working with.
Haslum (2007) has discussed some of the problems of ‘gold standard’ research and considers some alternative approaches. Similarly, whilst admitting that RCT is the ideal, Carter and Wheldall (2008) argue that we should not ignore educational research based on other research designs. These authors point out that:
“…in an ideal world, we would limit ourselves to perhaps a few dozen gold standard randomised control trials when evaluating educational interventions. Unfortunately few (if any) educational interventions would even approach this standard of evidence. Rather than simply discarding the vast majority of evidence and drawing conclusions based on a minimal number of studies, one approach would be to examine all the best evidence that is available and weight it in terms of its quality. That is, we give better-quality evidence a higher weighting in making decisions.” (Carter and Wheldall, 2008, p. 13).
In addition to preferring (rather than insisting on) evidence from ‘gold standard’ studies, Carter and Wheldall (2008) suggest that it is sensible to consider a somewhat lesser standard of evidence, which they call the ‘silver standard’. This standard applies where there is an absence (or dearth) of gold standard evidence, but where nevertheless the intervention is (a) consistent with existing scientific evidence, theory and practice, and (b) supported by evidence from well-constructed quasi-experimental studies (e.g. where assignment to groups is not random, or where there is no true ‘control group’). In the present review, studies that meet Carter and Wheldall’s ‘silver standard’ have been included as well as those that meet the traditional ‘gold standard’.
1.5.2 Standard scores
Standard (or standardised) scores, which usually have a mean (average) of 100 and a standard deviation2 of 15, are the ideal form of measurement as they are age-independent and test-independent and enable a proper comparison between different groups and different studies to be made. Most of the US studies included in this review
2 The standard deviation is a conventional measure of statistical variability in the data.
26 Intervention for Dyslexia

have reported standard scores; unfortunately, few of the UK studies have done so, sometimes because the tests used do not provide tables of norms in standard score form. Because they are normally distributed (i.e. in a bell-shaped curve), standard scores are also the most appropriate basis for analysing data using parametric statistics, which, for their integrity, rely on the fact that data are drawn from a population in which scores are distributed normally. Unlike nonparametric statistics, parametric statistics not only permit calculation of the level of statistical significance3 of a finding, but also the calculation of statistical interactions between variables (e.g. group and time), which enables a statistical significance to be placed on the relative impact of an intervention (e.g. on the group receiving the intervention compared with the control group).
1.5.3 Effect size
Statistical significance indicates the confidence that we can have that the finding is genuine. However, the fact that a given finding is statistically significant does not necessarily mean that it is important. A finding of a small difference between two conditions may well be statistically significant but is probably trivial. Therefore a measure of the size of the difference is crucial. Effect size is the name given to a number of statistical measures of the magnitude of a difference, whether over time within the same group or between groups. The most commonly employed measure of effect size used in education and psychology is Cohen’s d (Cohen, 1988), and this is the one used throughout this review. Cohen’s d is a measure of the difference between two scores divided by the standard deviation (either a pooled standard deviation based on data from both the groups, or the standard deviation of the control group). In an intervention study involving a treated group and an untreated (control or comparison) group, for example, the effect size can be calculated by dividing the difference in standard score gains between the groups by the standard deviation of the untreated group at post-test. In the absence of a control group, Brooks (2007) suggests that using the standard deviation of the standardisation sample for the test is a sensible alternative. Effect sizes of around 0.2 are usually regarded as ‘small’, of 0.5 as ‘medium’ and 0.8 or greater as ‘large’. An effect size of 1.0 means than the treated group has gained an amount equivalent to one standard deviation compared with the untreated group, which is an impressive level of improvement.
However, effect size will depend on the type of control group used. If the control group has also received treatment, effect sizes will be smaller than if it was untreated.
1.5.4 Ratio gain
Many UK studies report results not in standard scores but in reading and spelling ages, from which ratio gains can be calculated in order to evaluate the effectiveness of the intervention. Ratio gain is the gain in reading (or spelling) age made by a group during a chronological time span, expressed as a ratio of that time span (Topping & Lindsay, 1992). A ratio gain of 1.0 means that the child’s skills are developing at a normal pace, but they will not be catching up with their peers. Brooks (2007) suggests that ratio gains
3 Statistical significance is a measure of the probability (p) that a given finding could have occurred by chance. The lowest level of statistical significance usually accepted is p<0.05, which means that if the study were to be repeated 100 times the observed finding would have occurred by chance on less than five of those occasions; higher levels of significance often encountered are p<0.01 (1 in 100) and p<.001 (1 in 1,000).
Intervention for Dyslexia 27

of less than 1.4 are of ‘doubtful educational significance’, between 1.4 and 2.0 of ‘modest impact’, between 2.0 and 3.0 of ‘useful impact’, between 3.0 and 4.0 of ‘substantial impact’ and above 4.0 of ‘remarkable impact’ (Brooks. 2007, p.289).
However, Brooks (2007) points out that ordinary teaching (i.e. no intervention) does not enable children with literacy difficulties to catch up, and hence it is fair to presume that, in the absence of control or comparison groups, and where effect sizes cannot be calculated, findings of ratio gains in excess of 2.0 may be taken as good evidence in support of the method employed. Indeed, several studies have shown that, without help, dyslexic pupils progress at around only 5 months per calendar year in reading (ratio gain 0.42) and 3 months in spelling (ratio gain 0.25) (Thomson, 1990, 2001; see also Rack and Walker, 1994). Arguably, in cases of dyslexia the achievement of ratio gains of 1.0 or greater represents substantial progress for these individuals, even though they may still have literacy skills below levels required to access the curriculum.
1.6 Structure of the review Because the school system and the approach to special educational needs are rather different in the UK compared with the USA and other countries, research studies on interventions for dyslexia in these two categories have been considered in separate chapters. Chapter 2 is devoted to intervention studies carried out in the USA and the rest of the world, and Chapter 3 to intervention studies carried out in the UK. Because many studies carried out in the USA were found to meet the ideal methodological standards (see Section 1.5) it was feasible to disregard others that do not meet those standards. In the UK, however, surprisingly few studies meet the ideal methodological standards (which probably has important implications for research funding) and hence the evaluation of these has necessarily had to be somewhat different.
Questions concerning screening and assessment are dealt with in Chapter 4. The review of Reading Recovery may be found in Chapter 5. Finally, Chapter 6 discusses issues concerning the support that needs to be provided for older dyslexic pupils, together with evidence of the efficacy of computer technology as a means of enhancing literacy learning of dyslexic pupils generally, and, in particular, as a means of educational support at secondary school level.
28 Intervention for Dyslexia
2 Intervention studies in the US and the rest of the world
2.1 Stages of intervention in the USA In the United States, three-tiered public health models have been applied to education. Tier 1 refers to the provision of high-quality initial literacy instruction with regular benchmark assessments to identify children who are not responding appropriately to that instruction (Vaughn & Roberts, 2007). Some researchers have also included universal screening within Tier 1 in order to identify individuals for preventive treatment (e.g. Berninger, Winn et al., 2008; Fuchs & Fuchs, 2007). Tier 2, often referred to generically as ‘secondary intervention’, corresponds to the provision of more intensive instruction given individually or in groups to failing readers in the early years (i.e. grades K–3).4 ‘Tier 3’ or ‘tertiary intervention’ refers to the most intensive special education given from grade 4 onwards and typically delivered 1:1 (Fuchs et al., 2008). The terms ‘secondary intervention’ and ‘tertiary intervention’ have been adopted in this review because they are considered to be the most appropriate and are also the terms most generally encountered in the international research literature. However, it is important not to confuse the term ‘secondary intervention’ with ‘intervention in secondary school’ nor to confuse the term ‘tertiary intervention’ with intervention given at the tertiary stage of education, i.e. further and higher education.
Syntheses of the research literature on the effects of different instructional methods on children with dyslexia, learning disabilities (LD), severe reading difficulties and children at risk of reading failure conclude that persistent deficits in word recognition and comprehension are amenable to remedial training (e.g. Foorman et al., 1998; Lyon Fletcher, Fuchs & Chabra, 2006; Swanson 1999; Torgesen, 2005a, 2005b; Vellutino and Scanlon, 1991). For the sake of clarity, research studies on secondary intervention and tertiary intervention will be considered under separate subheadings in this review.
2.2 Secondary intervention studies There have been several important reviews and meta-analyses of the impact of secondary intervention, of which the following have been identified as being particularly noteworthy and therefore are summarised in this section: Swanson (1999), Scammacca et al. (2007), and Vaughn and Roberts (2007). In addition, research studies that are most pertinent to the present inquiry have been individually summarised in appropriate places in the text.
4 Grades in the US school system start with Kindergarten (K) at age 5–6; Elementary school grades range from grade 1 (age 6–7) to grade 5 (age 10–11); Middle school grades range from grade 6 (age 11–12) to grade 8 (age 13–14); High school grades range from grade 9 (age 14–15) to grade 12 (age 17–18). When making chronological age comparisons adding one to the US grade will give the corresponding UK school year.
Intervention for Dyslexia 29
2.2.1 Swanson’s (1999) meta-analysis
Swanson (1999; see also Swanson & Hoskyn, 1998) carried out a meta-analysis of secondary intervention studies for children with LD published in English between 1963 and 1997. A total of 92 studies that fulfilled criteria for analysis were located; the criteria applied were that the studies:
included a measure of word recognition and/or reading comprehension
had at least one control condition
yielded sufficient quantitative data to permit calculation of effect sizes
used participants who were of average intelligence
had an intervention that was above-and-beyond normal classroom teaching.
Each study was classified into one of four different intervention models:
direct instruction alone
strategy instruction alone
combined direct instruction and strategy instruction
neither direct instruction nor strategy instruction.
Examples of direct instruction techniques included focus on decoding, individualised instruction, small steps, repeated practice and frequent feedback. Examples of strategy instruction techniques included focus on understanding, general study strategies (e.g. underlining, note taking, summarising, generating questions), metacognition, and relating new concepts to concepts already known by the student. The results of the meta-analysis showed that an approach which combined elements of both direct and strategy instruction (e.g. Harris & Pressley, 1991; Johnson, Graham & Harris, 1997) positively influences reading comprehension performance, with a mean effect size of 1.15. A direct instructional approach (e.g. Foorman et al., 1998) was found to improve word recognition with a mean effect size of 1.06. Regression analysis showed that the most important instructional components for developing word recognition were:
delivery of tasks in a systematic sequence of small steps
segmentation of the task into smaller units or parts (e.g. segmentation of words into letter sounds or onset-rime)
making children explicitly aware of the focus and objectives of the instruction.
2.2.2 Vellutino, Scanlon, Sipay et al. (1996)
Vellutino, Scanlon, Sipay et al. (1996) provided one-to-one tutoring for at-risk readers over 15 weeks of daily 30-minute sessions. The sample was selected on the basis of teacher ratings of children’s progress in reading early in 1st grade. Children with sensory, medical or emotional problems or who had IQ below 90 were excluded from the study. 118 children (9% of the total sample) were classed as at-risk readers by these means; 70 were boys and 48 were girls. 65 children whose reading development was rated as
30 Intervention for Dyslexia

progressing normally (36 boys and 29 girls) formed the control group. Prior to starting school all the children in the study (N=1,284) had been administered a battery of cognitive tests of language, memory, intelligence and attention, as well as pre-reading measures such as letter and word identification, and print awareness. Further tests of cognition and literacy were given when the children were in 1st grade. The instructional approach emphasised phonological awareness, the alphabetic principle, building sight-word vocabulary, and developing comprehension strategies.
At both kindergarten and 1st grade, the at-risk readers were significantly poorer than the normal readers on measures of phonological awareness, rapid automatised naming, verbal fluency, verbal memory and verbal learning, but not on measures of intelligence, semantic skills or visual processing. The results showed that 67% of the at-risk readers scored within the average or above-average range on standardised tests of reading achievement after only one semester of daily one-to-one tutoring, which supports the view that in most cases these children’s difficulties had been due to experiential and instructional deficits, consistent with observations by Clay (1987). However, 33% of the tutored children scored below the normal range (30th centile) and 15% well below the normal range (15th centile), suggesting that these children’s difficulties had a different or additional cause. Expressed as percentages of the total population from which they were drawn, 3% were still below the normal range and 1.5% well below the normal range.
Children who showed the most accelerated growth in reading in response to intervention approached the level of normal readers and maintained their progress subsequent to the intervention, whereas children who showed the least acceleration in reading development continued to perform worse than the other groups subsequent to the intervention. The tests that significantly distinguished the high reading growth children from the low reading growth children were those assessing letter and number identification in kindergarten, and rapid automatised naming, phonological memory and grammatical judgment in 1st grade. Cognitive profiles of children who responded most readily to the intervention were closer to those of normally achieving readers than were the cognitive profiles of those who were found difficult to remediate.
Overall, the study by Vellutino et al. (1996) not only supports the view that deficits in phonological skills and verbal memory are associated with risk of reading failure, but also that children who have poorer response to a one-to-one intervention are more severely affected in these cognitive domains than are children who make a swift response to one-to-one intervention. On the basis of our current understanding of dyslexia (see Section 1.3.1 and Vellutino et al., 2004) it is likely that a considerable proportion of the poorer responding children were dyslexic.
2.2.3 Torgesen et al. (1999)
Torgesen, Wagner, Rashotte, Rose, Lindamood & Conway (1999) screened children in 13 schools at the beginning of kindergarten on letter name knowledge and phonological awareness. Children who scored poorly on these tests were deemed to be at risk of reading difficulties and were selected for intervention, with those scoring below standard score 75 on vocabulary (Stanford-Binet) being excluded. 180 at-risk children were randomly assigned to one of four treatment conditions:
1. regular classroom support
Intervention for Dyslexia 31

2. phonological awareness and synthetic phonics (a systematic direct instruction approach based on the Lindamood Auditory Discrimination in Depth programme)
3. embedded phonics (phonic training was given in the context of reading stories and writing text)
4. typical classroom instruction (control).
All interventions comprised four 20-minute one-to-one sessions each week for 2½ years, with a total of 88 hours of instruction being provided. Each week, trained teachers delivered two sessions, the other two sessions being given by trained teaching assistants, who concentrated on reinforcing previous learning.
At the end of 2nd grade, the group on the phonological awareness and synthetic phonics programme (PASP) scored significantly higher than all other groups on word attack (Woodcock Reading Mastery Test–Revised (WRMT-R)) and nonword reading, and significantly outperformed the regular classroom support and control groups on word identification (WRMT-R) and real word reading. At the end of the intervention, the children in the PASP group had standard scores on word reading and reading comprehension (WRMT-R) that fell in the average or low-average range. Effect sizes (PASP compared with controls) were: word attack 1.04, sight word efficiency (TOWRE) 1.21, real word list 0.71, nonword list 0.93. Effects of the embedded phonics programme were not so marked, with effect sizes compared with controls of 0.33 (word attack), 0.26 (real word list), and 0.14 (nonword list), although the effect size for sight word efficiency was higher (0.91). The PASP group significantly outperformed the embedded phonics group on phonological awareness (ES 0.75), word attack (0.84) phonemic decoding efficiency (0.74), and word identification (0.37). For reading comprehension the results were mixed, with one test (Gray Oral Reading Test; GORT) showing a very large effect size in favour of the PASP group (3.45), while with the other (WRMT-R) the effect size was much lower and not significant (0.28). However, since the GORT is very heavily dependent on decoding one would expect gains on this test as a result of phonological intervention, and therefore this finding does not constitute very good evidence that phonological intervention can improve reading comprehension.
The overall results of the Torgesen et al. (1999) study indicate that the most effective one-to-one intervention includes direct and focused instruction in phonemic awareness and decoding (phonics).
2.2.4 Scammacca et al. (2007) review
Scammacca, Vaughn, Roberts, Wanzek & Torgesen (2007) reviewed intensive intervention studies with children with LD or at risk for reading difficulties in kindergarten to grade 3, published between 1995 and 2005 in peer-reviewed English language journals. ‘Intensive’ was defined as 100 sessions or more and, as in the review by Swanson (1999), studies were required to employ a control or comparison group and contain data that allowed calculation of effect sizes. Twelve studies met the criteria, of which eight involved one-to-one tuition and the remainder small group tuition. Sessions were usually about 30 minutes over about one school year (approximately 35 weeks) although the total amount of intervention varied considerably (from 25 to 173 hours). It was found that the most effective intervention studies incorporated the following features:
early identification of children in need of intervention (kindergarten or grade 1)
32 Intervention for Dyslexia

training in phonological awareness, decoding and word study
guided and independent reading of progressively more difficult texts
writing exercises
engaging students in practising comprehension strategies while reading texts
daily or near-daily frequency of intervention sessions
1:1 or small group tuition.
In about half of the studies reviewed by Scammacca et al. (2007), teachers provided the tuition, and in the remainder tuition was given by trained personnel who were not teachers (e.g. parents, students, teaching assistants). The issue of whether delivery of instruction by the latter can be as effective as that delivered by the former is taken up later in this review.
Of the 12 studies considered by Scammacca et al. (2007) the following have been selected as being particularly relevant for this review: Foorman et al. (1997), Schneider, Roth and Ennemoser (2000), Vadasy et al. (2002), and Mathes et al. (2005), and these are considered in more detail below.
2.2.5 Foorman et al. (1997)
An RCT study by Foorman, Francis, Winikates, Mehta, Schatschneider & Fletcher (1997) compared three types of reading interventions for children with reading disabilities in 2nd and 3rd grades in 13 different schools. A synthetic phonics programme based on the Orton-Gillingham approach was compared with an analytic phonics programme and a sight-word programme in which children learned about 150 words plus endings. Specially trained teachers gave tuition for one hour each day to groups of about eight pupils. When data from 114 pupils who had completed at least six months of tuition were analysed, it was found that the two phonics groups out-performed the sight-word group on phonological analysis (effect sizes 0.23–0.59) but not on word reading, and the synthetic phonics group out-performed the analytic phonics group on both phonological analysis (ES 0.39) and word reading (ES 0.38).
2.2.6 Schneider, Roth and Ennemoser (2000)
Schneider et al. (2000) screened 700 children in 25 kindergarten classes in Germany for deficits in phonological processing. The 208 children falling into the bottom quartile were assigned either to phonological awareness training (PA), letter-sound-training (LS) or both (PA+LS). After participant attrition and eliminating children who moved into special education, the remaining 138 children were compared with a comparison group of 115 kindergarten children with normal phonological processing, who received the standard kindergarten curriculum. Intervention was provided daily in 10- to 15-minute sessions by trained kindergarten teachers. The PA group received 20 weeks of tuition in phoneme discrimination and production, rhyming, syllable segmentation, and word reading. The LS group received 10 weeks of training in letter-sound relationships. The PA+LS group received 10 weeks of PA training, followed by 10 weeks of LS training.
At the end of kindergarten, the PA group significantly outperformed all the other groups in phonological awareness, and the PA+LS group scored significantly higher than either
Intervention for Dyslexia 33
the LS or the comparison group. The mean IQ of the comparison group was found to be significantly higher than that of the training groups so IQ was included as a covariate in the analysis. At the end of the 1st grade the comparison group scored slightly but significantly higher than the PA or LS groups on decoding and reading comprehension, but not significantly higher than the PA+LS group. This effect was repeated at the end of the 2nd grade, with mean effect sizes (compared with the comparison group) of 0.13 for the LS group, 0.14 for the PA group and 0.12 for the PA+LS group. (It should be noted that the comparison group comprised children who were not at risk and therefore somewhat lower effect sizes would be expected than when comparing treated with untreated at-risk groups.) Throughout the study the PA and PA+LS groups continued to significantly out-perform the other groups on phoneme analysis. The authors concluded that all three training programmes were effective for at-risk students and, although not all the at-risk children managed to catch up with the not at-risk children, many came close to doing so, and in spelling PA+LS group was found to equal the performance of the comparison group by the end of 2nd grade. The children in this study were learning to read in German, which has a much more regular orthography than English; these results might not be replicated with English-speaking samples.
2.2.7 Vadasy et al. (2002)
Vadasy, Sanders, Peyton and Jenkins (2002) studied 1st grade children who were rated by their teachers as being at risk for reading problems, and those with standard scores of 90 or less on the WRAT-R reading subtest were selected for intervention. Children were assigned to groups that received either:
1. a phonologically-based reading programme in 1st grade that emphasised decoding, segmenting and fluency
2. a strategy-based reading programme in 2nd grade that emphasised comprehension and focused on reading real books
3. both (a) and (b)
4. normal classroom instruction (comparison group).
Intervention was provided by parents and other adults from within the community who had been trained to deliver the programmes. Instruction was delivered in 30-minute sessions for four days each week over about 35 weeks. At the end of the 1st grade the groups receiving the phonologically-based reading programme showed mean gains of 17 standard score points in word identification, word attack and reading fluency, which brought the pupils in these groups up to near grade-level performance. The mean effect size (compared with the control group) was 1.18. At the end of the 2nd grade, the groups that had received the phonologically-based reading programme scored significantly higher than the control group on all measures (mean ES = 0.40). No significant differences were found between the control group and the group receiving the strategy-based reading programme (ES = 0.21).
2.2.8 Mathes et al. (2005)
Mathes, Denton, Fletcher, Anthony, Francis & Schatschneider (2005) identified children in 1st grade who were at risk of reading failure by their performance in the Texas Primary Reading Inventory and the Woodcock Johnson (W-J III) word identification
34 Intervention for Dyslexia
subtest. All these children were in schools that had a strong record in reading instruction. Children were assigned to one of two specific intervention approaches, both of which explicitly taught phonemic awareness and alphabetic skills, or to a comparison group that received enhanced classroom instruction (teachers were provided with progress-monitoring data collected by researchers every three weeks and trained how to use these data in differentiated instruction). A group of typically achieving children that received only regular classroom instruction was also studied. One of the interventions was proactive (daily lesson plans and predetermined sequence of activities) and the other was responsive (teachers responded to pupils’ needs as they arose). Both interventions were provided by trained teachers for a total of 117 hours. Reading development was found to progress more rapidly in both the intervention groups than in the comparison group or the typically achieving group. The proactive group also grew more rapidly than the responsive group in phonological awareness (CTOPP), and more rapidly than the comparison group and the typically achieving group in word reading fluency (TOWRE) and nonword reading fluency (TOWRE).
At the end of the study, the two intervention groups had significantly higher scores on phonological awareness, word reading (W-J III) and reading fluency (W-J III) than the comparison group, but remained below the typically achieving group. No differences were found between the intervention groups. Mean effect sizes for the proactive group (compared with the comparison group) were 0.34, and for the responsive group were 0.30. (It should be noted that the comparison group had received enhanced classroom instruction and therefore somewhat lower effect sizes would be expected than when comparing treated with untreated at-risk groups.) These results show that both interventions were effective, over and above the effect of enhancing what was already a strong reading curriculum. Although neither intervention completely closed the gap between at-risk pupils and typically achieving pupils, most pupils in both intervention groups were performing within the average range on standardised measures by the end of the intervention. Neither intervention proved superior, suggesting that what was most important was the intensive and explicit teaching of phonemic awareness and alphabetic skills rather than the structure of the mode of tuition.
2.2.9 Ryder, Tunmer and Greaney (2008)
Ryder et al. (2008) reported on an intervention study with 6- to 7-year-olds who had been identified by their teachers as struggling readers. They were the lowest performing readers in four different Year 3 and Year 4 primary classrooms in New Zealand. The children were randomly assigned to an intervention group or control group (N=12 in each), a close match being found between the groups on reading accuracy and reading comprehension at the start of the study. Hence, although this was a relatively small-scale study, it was exceptionally well controlled. The children in the intervention group were given explicit instruction in phonemic awareness and phonic decoding skills in subgroups of three children. The intervention was carried out over 24 weeks and comprised a sequence of 56 structured lessons of about 25 minutes’ duration, delivered by a teaching assistant who had been specially trained for this task. The control group received whole-language instruction by their classroom teacher. Post-test results showed that the intervention group significantly (p<0.001) outperformed the control group on standardised measures of phonemic awareness (effect size 1.71), pseudoword decoding (ES 1.69) and word recognition (ES 0.70 and 0.88). Although the intervention group outperformed the control group on reading comprehension (ES 0.98), this was not statistically significant (p=0.073).
Intervention for Dyslexia 35

Two years later, follow-up data were obtained from 10 of the 12 matched pairs. The intervention group was found still to significantly outperform the control group on standardised measures of word recognition (ES 0.72 and 0.81). When the follow-up testing was carried out, the children’s average chronological age was 9 years 5 months, but the average reading age of those in the intervention group was 8 years 9 months (Burt Word Reading Test) and 9 years 3 month (Neale reading accuracy). The equivalent reading ages for the control group were 8 years 0 months (Burt) and 8 years 1 month (Neale). Hence the programme can be said to have normalised reading for the children in the intervention group, who ended up some 14 months ahead of the control group children on the Neale reading accuracy test.
2.2.10 Frost & Sørensen (2007)
Frost & Sørensen (2007) provided intervention for a group of 37 8-year-old Norwegian children who had scored below the 20th centile in reading. Intensive reading instruction was given for two hours per day for four days a week over five weeks to groups of four children. The programme was similar to that employed in other phonologically-based interventions, such as Lovett, Lacerenza and Borden (2000), Lovett, Lacerenza, Borden, Frijters, Steinbach and DePalma (2000) [see Sections 2.5.5 and 2.5.7] and Hatcher, Hulme and Ellis (1994) [see Section 3.3.8]. However, this programme also contained elements designed to develop meta-linguistic skills described by Gombert (1992), including a three-step training framework. In step 1 the child engages in supported reading of connected text that they can read with 80%–90% accuracy. Step 2 involves intensive word and/or sentence study. Step 3 involves independent reading of the same text as in step 1, but with 90% mastery required. This approach has the advantages of working within the child’s Zone of Proximal Development5 and incorporates repeated reading, which has generally been found to be beneficial for developing reading fluency (see Torgesen & Hudson, 2006; Vadasy & Sanders, 2008; also Section 2.6).
Results showed that the intervention group made ratio gains of 4.56 in word reading and 8.82 on pseudoword reading. Compared with a control group of 35 children selected using the same criteria as the intervention group, the effect sizes were 1.20 for word reading, 0.87 for pseudoword reading and 1.09 for spelling. Over five weeks of intervention (total instruction 40 hours) the children receiving intervention gained more than 22 weeks in reading age, which is a large ratio gain of 4.4.
2.2.11 Vaughn and Roberts (2007) review
Vaughn and Roberts (2007) have summarised the elements of successful secondary reading interventions, drawing upon the conclusions of the US National Reading Panel (National Institute of Child Health and Human Development, 2000) and several reviews of the field, including Foorman (2003), Snow, Burns and Griffin (1998), Swanson and Hoskyn (1998) and Vaughn, Gersten and Chard (2000). The key elements of secondary
5 The Zone of Proximal Development (ZPD) is a educational concept proposed by Vygotsky (1962) and may be defined as the distance between the actual or current developmental level as determined by the child’s independent problem solving, and the potential developmental level as determined through problem solving under adult guidance, or in collaboration with more able peers. In practice, ZPD usually implies instruction taking place within a region that is close to the child’s current level of mastery, with the child’s skills being progressively extended by the teacher providing aid only as necessary (a technique generally known as ‘scaffolding’).
36 Intervention for Dyslexia

intervention identified by Vaughn and Roberts (2007) are shown in Table 2. These authors also stress the importance of providing explicit, systematic, targeted instruction 3-5 times a week, including ample practice opportunities with immediate feedback.
Table 2. Key elements of secondary intervention (after Vaughn & Roberts, 2007)
Phonemic awareness instruction
Teaching students to understand the sounds of language and to manipulate them in ways that are associated with improved reading.
Phonics instruction Teaching students how to link the sounds of language to print, to recognise words based on recognized patterns, to decode multisyllabic words, and to generalise the learned rules of language to new words.
Spelling and writing instruction
This is used to support the acquisition of phonics rules and word reading. Many students benefit when they have ample practice hearing sounds and then writing them. Mapping sounds to print and teaching students to recognise word patterns (e.g. am, it, ate, eed) helps students read words rapidly. Thus, encouraging students to write letters, sound patterns, words, and sentences during secondary intervention yields improved outcomes for reading.
Fluency instruction Teaching students to read words accurately and with sufficient speed that comprehension is not impaired because of undue focus on word reading.
Vocabulary instruction
Teaching students to recognize the meaning of words they are reading and to build an appreciation of new words and their meaning so that learning the meaning of new words is an ongoing process supported by the teacher and through independent activities.
Comprehension instruction
Teaching students to monitor their understanding while reading, linking what they read to previous learning, asking questions about what they read, and responding to what they read in increasingly sophisticated ways.
2.3 Critical issues in secondary intervention
2.3.1 Long-term effects
Several studies have carried out longer-term follow-up of children who have received secondary intervention. Findings have generally shown that children who respond well and make good growth during the intervention tend to maintain their gains subsequently. For example, Vellutino, Scanlon and Sipay (1997) reported on a follow-up of the children in the study described by Vellutino, Scanlon, Sipay et al. (1996) (see Section 2.2.2). One year after the treatment those children who were classed as ‘treatment responders’, and who made marked gains during the intervention, were
Intervention for Dyslexia 37

found to have maintained these gains, and their reading accuracy and word attack skills were similar to those of average readers.
Fuchs et al. (2001) provided a teacher-delivered phonological intervention for at-risk kindergarten children. At the end of the intervention, after 15 hours of instruction, effect sizes for gains in phonological awareness were moderate to large (0.45–1.27) but smaller for alphabetical knowledge (0.14–0.33). A follow-up was carried out after five months, and effect sizes remained good for phonological awareness (0.46–0.73) and increased somewhat for alphabetical knowledge (0.23–0.81). Ehri, Nunes, Stahl and Willows (2001) summarised effect sizes for a number of phonics interventions from kindergarten to grade 6 that include follow-up tests carried out between four and 12 months after treatment. The mean effect size for reading was 0.44.
Vadasy, Sanders and Abbott (2008) reported on a two-year follow-up of children who had received early intervention in grade 1 (Jenkins, Peyton, Sanders & Vadasy, 2004). A group of 79 1st grade poor readers were given intensive phonological and alphabetical instruction. Results showed that these children continued to benefit from the intervention and at the end of 3rd grade average performance was close to the 50th centile in decoding and reading fluency, close to the 40th centile in word reading, and close to the 30th centile in spelling. The best predictors of 3rd grade outcomes were receptive language skills and rapid automatised naming.
Finally, in a follow-up of unusually long duration, Elbro and Petersen (2004) studied children at genetic risk of dyslexia who had received an average of 42 hours of teacher-delivered whole-class phonemic awareness and letter-sound instruction in kindergarten. Some seven years later the treatment children were found to outperform controls in word and pseudoword reading (ES 0.48 and 0.53, respectively).
2.3.2 Who should deliver intervention: teachers or teaching assistants?
Notable secondary intervention studies that have successfully employed teaching assistants, graduate students or other adults, who have been specially trained for the task, include those by Ryder, Tunmer and Greaney (2008), Torgesen et al. (1999), and Vadasy et al. (2002). The review by Scammacca et al. (2007) found that the effect sizes of interventions provided by trained personnel who were not teachers were similar to the effect sizes of interventions delivered by teachers. On the other hand, Wasik and Slavin (1993) reviewed five one-to-one literacy tutoring programmes and found that those using certified teachers produced larger gains in children’s reading than those using classroom assistants. The effect sizes for the programmes taught by classroom assistants or volunteers generally fell in the range of 0.20 to 0.75, while the programmes taught by teachers produced average effect sizes in the range 0.55 to 2.37.
It is a characteristic of these comparative studies that teacher-delivered and classroom assistant-delivered interventions tend to differ substantially. Those delivered by classroom assistants tend to be more highly structured, using well-scripted instructional materials and pre-determined lesson plans. In contrast, the teacher-administered interventions tend to rely more on teachers’ judgement, flexibility and knowledge of how children learn. This led Vaughn and Roberts (2007) to conclude that research indicates that interventions delivered by well-trained teaching assistants or paraprofessionals are associated with improved outcomes for students as long as they are provided with extensive and ongoing professional development, support and coaching, and clear guidance on instructional practices (see Elbaum, Vaughn, Hughes & Moody, 2000;
38 Intervention for Dyslexia

Vaughn & Linan-Thompson, 2003). Overall, these findings suggest that provision of secondary intervention by non-teachers should be more closely examined, as it can be less costly than intervention given by teachers. One might expect teachers to be more flexible and responsive to individual differences in learning needs, and thus perhaps more appropriate for the most severely impaired readers or those unresponsive to other methods, i.e. in tertiary intervention.
Table 3. Summary of results of some of the principal secondary interventions (effect sizes of gains in reading when compared with untreated controls)
Author(s) and date
Notes Phonic Decoding
Reading Accuracy
Compre-hension
Swanson (1999) Meta-analysis of 92 studies
1.06 1.15
Torgesen et al. (1999)
PASP group compared with controls
1.04 0.71 3.45
Ehri et al. (2001) Follow-up 4–12 months (mean)
0.44
Vadasy et al. (2002)
Phonological group compared with controls
1.18
Vadasy et al. (2002)
Follow-up after 2 years 0.40
Elbro and Petersen (2004)
Follow-up after 7 years 0.48 0.53
Frost & Sørensen (2007)
Norway 0.87 1.20
Ryder et al. (2008)
New Zealand 1.69 0.88 0.98
Ryder et al. (2008)
Follow-up after 2 years 0.81
Average* 1.02 0.80 1.86
* Not weighted for sample size
2.4 Conclusions on secondary intervention A wide range of studies using phonological approaches to secondary intervention has been presented, and all point to the benefits of such intervention for children with dyslexia or LD, even when instruction is provided by non-teachers, provided they have received adequate training, and even when instruction is given to small groups of children (up to 4–5 children per group). The results of some of the principal studies in which comparison with controls was made and in which reading was assessed are summarised in Table 3. The average effect size for phonic skills was 1.02, for word
Intervention for Dyslexia 39
reading accuracy 0.80 and for reading comprehension 1.86. However, these figures should be interpreted with caution since sample size, severity of difficulties and length of intervention have not been factored in. Nevertheless, they give some indication of the degree of impact one might expect from phonological approaches that fall within the category of secondary intervention. The most effective of these studies were found to share the following essential elements:
Explicit training in phonological awareness
Strong focus on phonological decoding and word-level work
Supported and independent reading of progressively more difficult texts
Practice of comprehension strategies while reading texts
Instruction which is systematic and intensive, i.e. given either daily or in several sessions per week over several weeks, with a target of between 20 and 40 total hours of instruction.
Long-term studies show that systematic phonological secondary interventions continue to have benefit for the literacy development of most children, especially for those who show good growth during the intervention. However, a proportion – probably between 1.5% and 3% – of all children will nevertheless remain below target levels and will thus require further or continuing intervention.
2.5 Tertiary intervention studies Torgesen (2000) has estimated that between 2% and –6% of children would remain poor readers even if secondary interventions were available to all who needed them. However, Mathes et al. (2005) have estimated this group at less than 1% of all children. Whatever the size of this group, it is these children who will require tertiary intervention. The following subsections review the principal studies of intensive phonological intervention with pupils from 4th grade and above. The results of these studies are summarised in Table 4. However, the averages shown in the table should be interpreted with caution since sample size, severity of difficulties, and length of intervention have not been factored in. Nevertheless, they give some indication of the degree of impact one might expect from phonological approaches that fall within the category of tertiary intervention. These studies raise several critical issues, which are discussed in Section 2.9.
2.5.1 Torgesen, Alexander et al. (2001)
Torgesen, Alexander, Wagner, Rashotte, Voeller, Conway and Rose (2001) studied 60 children in 4th grade who had severe reading disabilities. Their mean age was 9.8 years and 73% were boys. All the children had been identified by their teachers as having serious difficulty acquiring word-level reading skills, and their measured word attack and word identification skills were found to be at least 1.5 standard deviations below age-appropriate levels. All had verbal IQ above 75 (mean VIQ 93; mean FSIQ 96) and had poor phonological awareness. Hence, although these pupils were not explicitly described as having dyslexia, it is highly likely that most, if not all, would be classed as dyslexic. The children were randomly assigned to one of two direct instructional conditions:
40 Intervention for Dyslexia

1. Lindamood Auditory Discrimination in Depth programme [ADD]. In this condition the participants spent 85% of their time learning and practising articulatory/ phonemic awareness and synthetic phonics skills in activities that did not involve reading meaningful text, 10% of their time learning to fluently recognize high-frequency words, and only 5% of their time reading meaningful text.
2. Embedded phonics [EP], in which phonic training was given in the context of reading stories and writing text. In this condition children spent 20% of their time on phonemic awareness and phonemic decoding activities involving single words, 30% of their time learning high frequency sight words, and 50% of their time reading meaningful text. Hence students in this condition did receive direct instruction in phonemic decoding skills, but in the context of error correction and discussion of word reading strategies while reading meaningful text
Instruction was given by trained teachers who had at least one year’s experience of teaching children with reading difficulties. In phase one (the ‘intensive phase’), two 50-minute sessions were given on a 1:1 withdrawal basis each weekday over a period of 8-9 weeks, providing a total of 67.5 hours of instruction. In phase two (the ‘generalisation phase’) the specialist teacher worked with the child in the classroom for one 50-minute session each week over eight weeks, helping the child to apply the skills learned in the intensive training phase.
After participant attrition due to children moving away, data on 50 children were available for analysis. On all standardised measures of reading (word attack, word identification, passage comprehension, phoneme decoding efficiency and sight word efficiency) the children in both treatment conditions showed substantial and statistically significant (p<0.01) improvements over the course of the intervention, and these improvements were maintained over a 2-year follow-up period. For example, the mean score of the ADD group for word attack increased from 68.5 to 91.8, and of the EP group from 70.1 to 89.9. For ethical reasons this study did not employ a control group; however, comparisons were made between rates of progress before the start of the study with rates of progress during and after the study. Figure 1 shows scores on the Broad Reading Cluster of the Woodcock-Johnson Psycho-Educational Battery – Revised, which comprises measures of word identification and passage comprehension. The average period between pre-test 1 and pre-test 2 (the start of the study) was 16.6 months, during which time these pupils had been receiving ‘regular’ special education targeting their basic reading skills in school resource rooms. Effect sizes for the two interventions were calculated by dividing the difference between the slope during treatment and the slope prior to treatment by the pooled variability of the pre-intervention slope, i.e. using the ‘regular’ special education as the quasi-control group. The effect sizes were 4.4 for the ADD group and 3.9 for the EP group.
Intervention for Dyslexia 41

74
76
78
80
82
84
86
88
90
92
94
Pretest 1 Pretest 2 Post-test 1 year follow-up 2 year follow-up
Stan
dard
sco
re
ADDEP
Figure 1. Progress in reading before and after intervention (adapted from Torgesen et al., 2001, p. 43). The Lindamood Auditory Discrimination in Depth programme [ADD] group is shown as a solid line, and the Embedded phonics [EP] group as a dotted line
Both methods of intensive instruction proved to be very effective, and there were no substantive or persistent differences in outcome between the groups. The only statistically reliable difference in outcome between them was that the students receiving the Lindamood approach showed stronger growth in phonemic decoding skills during the instructional period. Approximately 40% of the sample (46% of the ADD group and 33% of the EP group) were judged to be no longer in need of special education within the first year following the end of the intervention and were returned to full-time mainstream classroom education. However, for between a third and half of the children (according to which measure is used) neither of the interventions was sufficient to ‘normalise’ their reading accuracy (i.e. increase and maintain them at or above standard score 90). In those children whose reading is not normalised, although reading accuracy and comprehension tend to improve significantly during intervention, they fall back after intervention has finished. Reading rate was found particularly hard to normalize, with the mean level at follow-up being not significantly different to what it was at the start of the study. The degree of impairment at pre-test, and the amount of improvement during intervention, were both significant predictors of outcome, with the children who were least impaired at pre-test and those who made the most gains during intervention having the best outcomes. During the follow-up period, the most consistent predictors of successful outcome were levels of attention and behaviour ratings by teachers.
2.5.2 Rashotte, McPhee and Torgesen (2001)
A study of intervention for students with severe reading difficulties across 1st to 6th grades (Rashotte, McPhee and Torgesen, 2001) included 33 students in grades 5 and 6 for whom this could be regarded as a tertiary intervention since most of these students had been classified as learning disabled (LD) and had been on regular special education programmes. An intervention group was compared with an untreated control group that subsequently also received intervention (i.e. became the delayed intervention group). The instructional method was the Spell Read PAT (Phonological Auditory Training) programme, which incorporates systematic tuition in phonemic awareness, phonic skills
42 Intervention for Dyslexia

and writing. Students were taught in groups of 3-5 for 50 minutes daily, with a total of 35 hours of instruction being given over a period of about eight weeks. The intervention was delivered by four specially trained instructors, of whom only one was a qualified teacher.
At the first post-test the intervention group showed statistically significant gains on all measures of reading accuracy, phonological decoding, comprehension and spelling, but non-significant gains on word fluency. Notable improvements (in standard score points) included 18.5 for word attack, 8.8 for passage comprehension, 13.9 for reading rate, 20.0 for segmenting words and 8.6 for pseudoword spelling. Effect sizes (compared with the control group) were 2.2 for word attack, 0.64 for passage comprehension, 0.92 for reading rate, 2.38 for segmenting words and 2.65 for pseudoword spelling. At the second post-test, administered after the delayed intervention group had completed instruction, the first intervention group were found to have maintained the gains shown at first post-test, and the delayed intervention group displayed similar outcomes (16.0 gain for word attack, 9.0 for passage comprehension, 8.8 for reading rate, and 25.6 for segmenting words; pseudoword spelling not administered).
Figure 2 illustrates some of the main findings from the study by Rashotte et al. (2001). The slopes for the first intervention group are steep from pre-test to post-test 1 (the period during which this group received special intervention) and then level off between post-test 1 and post-test 2 (the period during which they received only regular instruction), except for comprehension (pink solid line), which continues to improve after the intervention ceased. The slopes for the delayed intervention group are level or only slightly elevated from pre-test to post-test 1 (the period during which this group did not receive intervention) but steep from post-test 1 and post-test 2, when this group was receiving special intervention.
2.5.3 Reviews and analyses by Torgesen (2005a & 2005b)
Torgesen (2005a & 2005b) has reviewed several studies of intensive tertiary intervention for older severely disabled readers, which may be compared with the studies by Torgesen et al. (2001) and Rashotte et al. (2001) described above. The participants in these studies had intelligence in the normal range, had severe phonological difficulties and were severely impaired in text reading accuracy and fluency, and hence arguably can be described as dyslexic. In all but two of the studies the students started the study with reading accuracy below standard score 80 (9th centile). The metric applied to calculate the effectiveness of intervention was the amount of gain (in standard score units) per hour of instruction. These studies are outlined below and the principal results shown in Table 4 (page 46).
Intervention for Dyslexia 43

75
80
85
90
95
100
105
110
Pretest Post-test 1 Post-test 2
Stan
dard
sco
res
Figure 2. Gains made as a result of intervention in the study by Rashotte, McPhee and Torgesen (2001) in word attack (blue lines with diamond points), reading comprehension (pink lines with square points) and segmentation (green lines with circular points), with the first intervention group charted in solid lines and the delayed intervention group charted in dotted lines in each case
Inspection of Table 4 reveals that, in general, there is good consistency in results obtained from these different studies. On average, these techniques generated gains of 0.30 standard score points in phonemic decoding per hour of instruction, with an average 38th centile rank (compared with population norms) for these students at the end of the study, which is well within the normal (average) range of SS 90–110 (centiles 25–75).
For reading comprehension, gains were not quite so marked, averaging at 0.17 SS points per hour of instruction, and at the termination of intervention an average centile rank of 24th. Although this is just outside the average range, the study by Rashotte et al. (2001) suggests that reading comprehension might be expected to continue to improve after intervention has ceased (see Figure 2). In reading accuracy, gains averaged 0.19 SS points per hour of instruction, with an average centile rank of 17th (SS 85) at the termination of intervention. Given that the average reading accuracy scores of all samples was SS 72 (centile 3), this represents an average gain of 13 SS points (almost one standard deviation) and, on average, lifts students from a very low level to one which is only a little below the average range.
2.5.4 Alexander et al. (1991)
Alexander, Anderson, Heilman, Voeller and Torgesen (1991) provided 65 hours of 1:1 instruction to children with an average age of 10 years 8 months at the beginning of the study. Explicit and systematic instruction in phonemic awareness and phonics was given using the Lindamood Auditory Discrimination in Depth Program, which was subsequently
44 Intervention for Dyslexia

revised as the Lindamood Phoneme Sequencing Program for Reading, Spelling and Speech (Lindamood & Lindamood, 1998).
2.5.5 Lovett et al. (1994)
Lovett, Borden, Lacerenza, Benson and Brackstone (1994) provided 35 hours of instruction to children who were very severely disabled in reading (mean word identification score on the Woodcock Reading Mastery Test of 64). The average age at the start of the study was 9 years 7 months, and they were taught in pairs using a modification of the Reading Mastery programme, which provides direct instruction in phonemic decoding, with an emphasis on achieving mastery and fluency.
2.5.6 Wise, Ring and Olson (1999)
The study by Wise, Ring and Olson (1999) gave 40 hours of both 1:1 and 1:4 instruction to children who had an average age of 8 years 9 months. A combination of teacher-delivered instruction using the Lindamood method, and computer-administered instruction that provided extensive practice in reading text, was provided.
2.5.7 Lovett et al. (2000)
Lovett, Lacerenza, Borden, Frijters, Steinbach and DePalma (2000) also reported outcomes from two equally successful instructional techniques with children who had severe reading disabilities (mean age 9 years 8 months). The instruction in both approaches was given in groups of 3 pupils, who were taught in 60-minute sessions for a total of 70 hours of instruction. The two techniques differed primarily in the order in which the components of the teaching programme were delivered. Students in Group A received 35 hours of explicit phonics instruction first, followed by 35 hours of instruction in four different word reading strategies (i.e. looking for familiar embedded words, using analogies to known words, identifying affixes, and vowel flexibility). Students in Group B received just the opposite sequence of instruction.
2.5.8 O’Connor and Wilson (1995)
O’Connor and Wilson (1995) reported the effects of about 60 hours of instruction provided 1:1 to pupils in 3rd to 8th grades. The instruction was provided 1:1 by teachers trained in the use of the Wilson Reading System (Wilson, 1988), which is a multisensory structured and sequential language programme that directly teaches phoneme segmentation, decoding, sight words, fluency, vocabulary, spelling and comprehension.
2.5.9 Torgesen et al. (2003)
Torgesen, Rashotte, Alexander, Alexander & MacPhee (2003) used the Lindamood programme and the Spell Read Phonological Auditory Training programme with students aged 12 years. The students were taught in groups of four, and a total of either 50 hours or 100 hours of instruction was given.
Intervention for Dyslexia 45

Table 4. Growth rate per hour of instruction and ending points for intervention studies with samples of reading disabled pupils (after Torgesen, 2005a, with additions)
Study details
Growth rate in standard score gain per hour of instruction (and ending points in centiles)
Authors and date
Mean age (yrs:mos)
Group size
Reading accuracy at outset [SS] (and centile)
Phonemic Decoding
Reading Accuracy
Compre-hension
Alexander et al. (1991)
10:8 1:1 75 (5th) 0.32 (45th) 0.19 (21st)
Lovett et al. (1994)
9:7 1:2 64 (<1st) 0.13 (2nd) 0.14 (5th)
Wise et al. (1999)
8:9 1:4; 1:1
74 (4th) 0.30 (35th) 0.24 (13th)
0.14 (36th)
Torgesen et al. (2001) LIPS
9:10 1:1 69 (2nd) 0.41 (39th) 0.20 (12th)
0.12 (27th)
Torgesen et al. (2001) [EP]
9:10 1:1 66 (1st) 0.30 (25th) 0.21 (10th)
0.15 (29th)
Lovett et al. (2000) [Gp A]
9:8 1:3 62 (<1st) 0.24 (14th) 0.18 (5th) 0.16 (6th)
Lovett et al. (2000) [Gp B]
9:8 1:3 56 (<1st) 0.30 (14th) 0.20 (5th) 0.18 (4th)
Rashotte et al. (2001)
≈ 11 1:4 87 (19th) 0.47 (48th) 0.31 (48th)
0.32 (48th)
O’Connor & Wilson (1995)
≈ 11 1:1 <75 (<5th) 0.23 (35th) 0.18 (9th) 0.17 (14th)
Torgesen et al. (2004)
9:10 1:1; 1:2
76 (6th) 0.18 (39th) 0.07 (16th)
0.07 (19th)
Torgesen et al. (2003 [50 hrs]
12 1:4 82 (12th) 0.29 (76th) 0.16 (25th)
0.24 (35th)
Torgesen et al. (2003 [100 hrs]
12 1:4 77 (6th) 0.23 (54th) 0.19 (39th)
0.19 (39th)
Average* 10:4 1:2.3 72 (3rd) 0.30 (38th)
0.19 (17th)
0.17 (24th)
* Not weighted for sample size
46 Intervention for Dyslexia
2.5.10 Torgesen et al. (2004)
Torgesen, Alexander, Alexander, Voeller, Conway, Wagner & Rashotte (2004) also used the Lindamood programme with students whose average age was 9 years 10 months. 133 hours of 1:1 and 1:2 instruction were provided but, in addition, 25 hours of instruction in reading comprehension delivered in groups of 2 students using a programme called Visualizing and Verbalizing for Language Comprehension and Thinking (Bell, 1991).
2.6 Fluency Reading fluency may be defined as the ability to read connected text rapidly, smoothly, effortlessly and automatically, and with little conscious attention to the mechanics of reading, such as decoding (Meyer & Felton, 1999; Torgesen & Hudson, 2006). Fluency is, first and foremost, a function of the extent to which children have been able to practise the application of decoding skills in reading extended texts, in order that these skills can become automatised and so that the number of words that can be read instantly on sight increases substantially. Disabled readers read substantially less than normal readers (Torgesen, Rashotte & Alexander, 2001) and so have less practice and consequently their reading fluency remains poor. This creates ‘Matthew effects’, i.e. children who are good readers read more than poorer readers and hence further strengthen their reading skills, thus progressively widening the gap between the most skilled and the poorest readers (Stanovich, 1986). In turn, fluency is essential for good comprehension (see Chard, Vaughn & Tyler, 2002; Kuhn & Stahl, 2003). Children who read very slowly and struggle with decoding many words in text will experience a greater working memory load, which affects comprehension (Gathercole, Alloway, Willis & Adams, 2006; Pickering & Gathercole, 2004).
In several of the intervention studies described above (e.g. Rashotte, McPhee and Torgesen, 2001; Torgesen, Alexander, Wagner, Rashotte, Voeller, Conway and Rose, 2001) it was noted that, while students typically made substantial and significant gains in word attack, reading accuracy and comprehension, gains in reading rate or fluency tended to be much weaker and non-significant. Denton, Fletcher, Anthony & Francis (2006) reported on a tertiary reading intervention study that incorporated activities designed to promote fluency. The et al.study targeted 27 students (average age 8.6 years) who had severe reading difficulties. Fourteen of the students had already demonstrated an inadequate response to secondary reading intervention. The participants received two hours per day of direct instruction targeting decoding over eight weeks using the Phono-Graphix programme (McGuinness & McGuinness, 1998). Over the following eight weeks, the students were given, by experienced teachers, one hour of daily instruction which was designed to promote reading fluency and was based on the Read Naturally programme (Ihnot, Matsoff, Gavin & Hendrickson, 2001). The latter involves features such as reading along with an audiotape, repeated reading, goal setting and progress monitoring and has been shown to promote reading fluency (Hasbrouck, Ihnot & Rogers, 1999). The study employed a multiple baseline design, with commencement of instruction for one group of students (Group 2; n=11) being delayed until the rest (Group 1; n=16) had completed the first phase of the intervention.
The students showed significant growth in decoding, fluency and reading comprehension during the eight weeks of intervention with Phono-Graphix, with effects sizes of 1.77 for word attack, 0.93 for word identification, 0.88 for phonemic decoding fluency (TOWRE), and 0.67 for passage comprehension (all p<0.001 or better). During
Intervention for Dyslexia 47
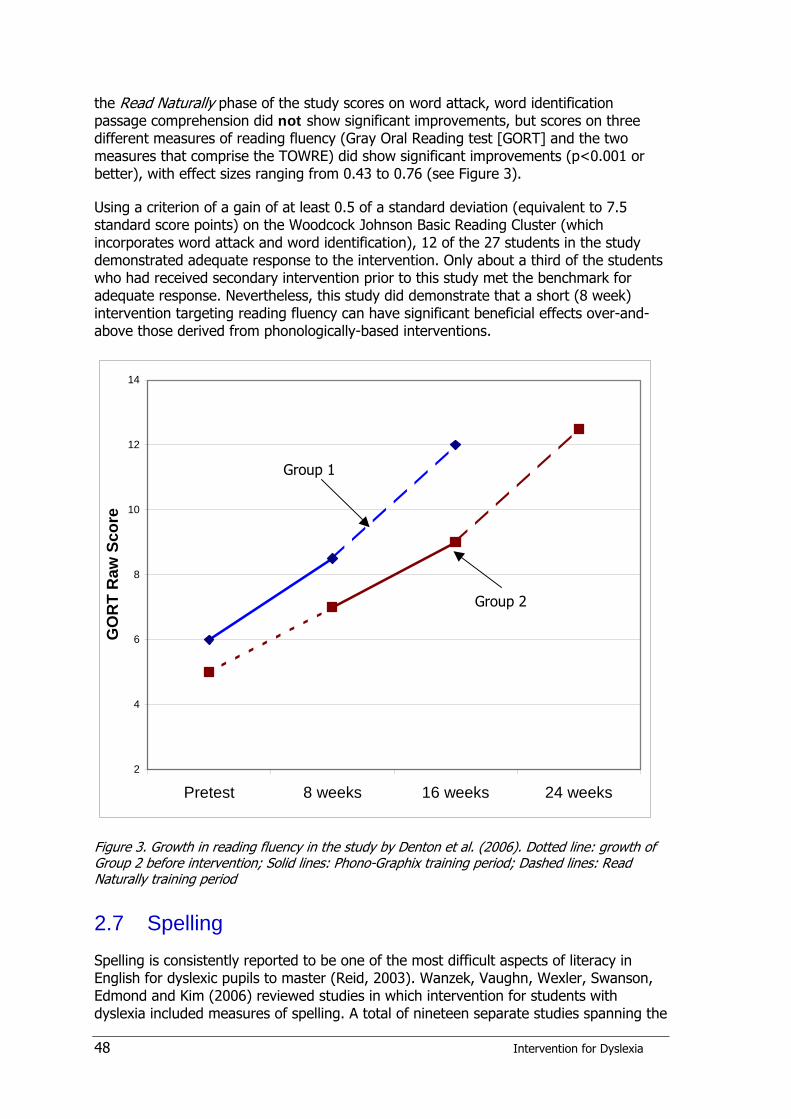
the Read Naturally phase of the study scores on word attack, word identification passage comprehension did not show significant improvements, but scores on three different measures of reading fluency (Gray Oral Reading test [GORT] and the two measures that comprise the TOWRE) did show significant improvements (p<0.001 or better), with effect sizes ranging from 0.43 to 0.76 (see Figure 3).
Using a criterion of a gain of at least 0.5 of a standard deviation (equivalent to 7.5 standard score points) on the Woodcock Johnson Basic Reading Cluster (which incorporates word attack and word identification), 12 of the 27 students in the study demonstrated adequate response to the intervention. Only about a third of the students who had received secondary intervention prior to this study met the benchmark for adequate response. Nevertheless, this study did demonstrate that a short (8 week) intervention targeting reading fluency can have significant beneficial effects over-and-above those derived from phonologically-based interventions.
2
4
6
8
10
12
14
Pretest 8 weeks 16 weeks 24 weeks
GO
RT
Raw
Sco
re
Group 1
Group 2
Figure 3. Growth in reading fluency in the study by Denton et al. (2006). Dotted line: growth of Group 2 before intervention; Solid lines: Phono-Graphix training period; Dashed lines: Read Naturally training period
2.7 Spelling Spelling is consistently reported to be one of the most difficult aspects of literacy in English for dyslexic pupils to master (Reid, 2003). Wanzek, Vaughn, Wexler, Swanson, Edmond and Kim (2006) reviewed studies in which intervention for students with dyslexia included measures of spelling. A total of nineteen separate studies spanning the
48 Intervention for Dyslexia
period 1995–2003 were identified, and three critical methodological criteria were applied: (a) using random assignment to groups, (b) fidelity of treatment check (i.e. ensuring that the reported results were actually due to the intervention rather than other factors), and (c) using standardized measures. Five of the 19 studies met criterion (a), six met criterion (b) and three met criterion (c). Overall, only three studies met all three criteria; of these Torgesen et al. (2001) has already been reported (see Section 2.5.1), and the other two (Lewis et al., 1998; Raskind & Higgins, 1999) employed computer technology and are so are considered under that subheading (see Section 6.3).
Despite these methodological limitations, Wanzek et al. (2006) found good evidence that interventions which provided students with spelling strategies or which employed systematic study and word practice methods with immediate feedback produced the highest rates of spelling improvement. This finding is broadly in agreement with those of previous reviews, including Fulk and Stormont-Spurgin (1995), Gordon et al. (1993) and McNaughton et al. (1994). Exemplar studies include that of Darch, Kim and Johnson (2000), who compared a rule-based strategy approach with a traditional approach that relied on learning spelling through writing. The participants were 30 elementary school pupils with LD, and they received four sessions of instruction from a researcher each week for four weeks. The effect size in favour of the group taught by the rule-based approach was 1.76 (p<0.01). Similarly, Fulk (1996) compared a traditional verbal and written rehearsal technique with a simultaneous oral spelling technique [SOS] (similar to the traditional ‘look- cover-write-check’ method but with the addition of an oral component in saying the word and the letters of the word are they are written). The participants were 34 LD students aged 7–8 years, and only three intervention sessions were given. The students taught the SOS method made significantly greater gains in spelling compared with the traditionally taught group (ES 1.25).
2.8 Writing Writing has often been identified as a much more intractable problem than reading for most dyslexics. Such children typically are less engaged in writing tasks and less attentive to written words (Thompson et al., 2005), but also are at risk of becoming writing avoidant (Berninger et al., 1995; Berninger & Hidi, 2006). Despite this, the vast majority of intervention studies with dyslexic children have focused on reading and comparatively few have focused on writing. Berninger, Winn et al. (2008) evaluated the effectiveness of writing instruction with dyslexic students from 4th to 9th grade. All participants were identified as having dyslexia by applying the criterion of reading accuracy and/or spelling that is below population mean and discrepant from verbal IQ by at least one standard deviation, which is consistent with the definition of dyslexia adopted by the International Dyslexia Association (Lyon, Shaywitz & Shaywitz, 2003). They had also failed to respond adequately to a variety of previous interventions. Instruction was delivered by specially trained graduate students and other professionals, working with groups of students ranging from 6–12 children.
In a study reported by Berninger, Winn et al. (2008), 22 students in grades 4 to 6 (average age 11 years 6 months) and 17 students in grades 7 to 9 (average age 14 years) received a two-hour instructional session for 14 consecutive weekdays. Students were randomly assigned to groups that received either orthographic or morphological instructional approaches. The orthographic approach focused on visualization of the correct spelling of the word, and learning letter sequences. The morphological approach focused on learning morphological spelling rules for roots, prefixes and suffixes, word
Intervention for Dyslexia 49

building and word dissecting. Both treatments resulted in modest but statistically significant (p<0.007 or better) improvements on three standardised measures of spelling: spelling pseudowords (effect size 0.40) and spelling real words (ES 0.20–0.22), and one standardised measure of written composition (ES 0.21). Morphological treatment resulted in better improvement in spelling pseudowords, and children in grades 7–9 improved significantly more in written composition than did the younger students in the study. This study also included some measures of reading skills: the orthographic treatment resulted in better improvement in rate of reading pseudowords, and the older students improved significantly more in silent reading comprehension fluency than the younger students. Overall, the older students appeared more responsive to instruction using the morphological approach. This study demonstrates that even after they have learned to read, dyslexic students are likely to need explicit instruction in spelling and related writing skills, and that orthographic and morphological approaches can be beneficial. However, Berninger, Winn et al. (2008) stress that this instruction needs to be carried out in the context of “…highly intellectually engaging learning environments (that are necessary for them) to succeed with the increasingly complex writing assignments they will face throughout schooling” (p.123).
2.9 Critical issues in tertiary intervention
2.9.1 Number of hours of intervention
In the studies summarized in Table 4, the amount of intervention varied from 35 hours to 133 hours, with a mean and median of 65 hours. It is pertinent to consider, therefore, whether longer interventions necessarily produce better outcomes. Data from a study by Truch (2003) suggest that the rate of gain may decelerate quite rapidly for intensive interventions after the first 12 hours of the intervention. Using the Phono-Graphix method (McGuinness & McGuinness, 1998), Truch (2003) provided 80 hours of intensive instruction to 202 students ranging in age from 6 years old to over 17 years old. For students aged 10–16 years, the overall average growth was 0.19 standard score points per hour of instruction, with an average 32nd centile rank (compared with population norms) for these students at the end of the study. However, when growth rates across different phases of the study are compared the results are illuminating. For the first 12 hours of instruction the average gain per hour of instruction for single word reading accuracy was 0.74 standard score points. For the next twelve hours the rate was 0.11, and for the final 56 hours it was 0.10. In phonemic decoding, the growth rates are comparable: for the first 12 hours of instruction it was 0.25 grade level units per hour of instruction, for the next 12 hours it was 0.07, and for the final 56 hours it was 0.04. This deceleration in growth rate across time within intensive interventions could be part of the explanation for the particularly low growth rates observed in the 133-hour intervention study reported by Torgesen et al. (2004).
In the two studies reported by Torgesen et al. (2003) and described above, students were assigned to either 50 or 100 hours of intervention. In spite of the fact that pupils in the second study received twice as much instruction as those in the first study, they actually improved less in text reading accuracy and comprehension than the first group. The most likely reason for this is that the latter group had more severe reading disabilities than the first one, for which there is some evidence. In this context, Torgesen (2005a) points out that:
50 Intervention for Dyslexia

“The actual reading impairment a child shows at any point is always the result of an interaction between the child’s degree of disability and the strength of instruction that has already been provided. Children with a mild reading disability who are provided only weak instruction (in the regular classroom or in a special education setting) will show larger reading impairments when tested than will children with the same degree of reading disability who have had stronger instruction… By the same token, children who remain severely reading impaired within a strong instructional environment are likely to have a more serious reading disability than those who have remained impaired after receiving only weak instruction. Thus, if researchers select their intervention samples from among children who have already received a good dose of appropriate and reasonably intensive instruction, the children in those samples will be more difficult to teach than children who are selected by the same reading criteria from a weaker instructional environment.” (Torgesen, 2005a, p.113)
2.9.2 Degree of impairment
Some of the lowest gains in the studies summarized in Table 4 are seen in the research by Lovett et al. (1994) and Lovett et al. (2000), but it should be noted that the participants in these studies were exceptionally disabled in reading, with average word identification scores of only 56–64 (<1st centile) at the outset. It is pertinent to consider, therefore, whether interventions necessarily produce better outcomes with less severely disabled pupils. Torgesen (2005a) has compared intervention studies in which participants start the intervention at a very low level of reading accuracy (below 5th centile) with studies in which the students’ reading accuracy is somewhat less impaired at the outset (centile range 5–16; standard score 75–85). The results (shown in Table 5) indicate that, for phonemic decoding and reading accuracy, about the same amount of progress is made per hour of instruction. However, because those students who are below the 5th centile at the outset of intervention start from a much lower baseline, their end point is correspondingly much lower than that of those who start above the 5th centile. For phonemic decoding and reading accuracy, therefore, we can say that more severely disabled pupils are likely to make similar progress to pupils who are less severely disabled, but they will be less likely to end up in the normal range for these measures. On the other hand, for reading comprehension, both growth rate and end point are lower for the more severely disabled students than they are for the less severely disabled students.
Table 5. Growth rates (in standard score gain per hour of instruction) and final status (in centile rank) for pupils who begin reading interventions at different levels of word reading ability (adapted from Torgesen, 2005a)
Beginning Level Phonemic Decoding
Reading Accuracy
Comprehension
Below the 5th centile 0.28 (29th) 0.18 (9th) 0.14 (14th)
Between the 5th and 16th centiles
0.26 (66th) 0.19 (29th) 0.21 (36th)
2.9.3 Group size
The studies summarized in Table 4 also vary in the size of the tuition group, from one to four students per teacher (average 2.3 students). Because of confounding variables such
Intervention for Dyslexia 51

as degree of impairment, overall amount of instruction and qualifications and experience of instructors, analysis of the effects of group size is problematic. Nevertheless, inspection of the results of the various studies in Table 4 does not suggest that, on the whole, literacy gains were any better in studies where tuition was individual than in those in which groups of pupils were taught together. Indeed, the studies by Torgesen et al. (2003), Wise et al. (1999) and Rashotte et al. (2001), which all employed groups of four pupils, all obtained good results.
The study by Rashotte et al. (2001) is particularly noteworthy in that not only was instruction delivered in small groups of four pupils rather than 1:1, it was also over a relatively short period of 8 weeks, and by instructors who were trained (6-day training programme) but who were not specialists in remedial education (only one of the four instructors was a qualified teacher). Comparable results in favour of using instructors who are not necessarily teachers were obtained in the successful secondary intervention study by Vadasy et al. (2002) reported above. In this case, intervention was provided by parents and other adults from within the community who had been trained to deliver the programmes.
Unsurprisingly, intervention programmes delivered to small groups of children by instructors who are not necessarily teachers is a great deal more cost-effective than programmes requiring 1:1 tuition delivered over much longer periods by specialist teachers whose training is lengthy and expensive. For example, supposing an instructor taught four groups of three children each day, and was paid £15 per hour plus an allowance of two additional paid hours per day for planning and preparation, the overall cost per child for the 35 hours of instruction would be £275. However, it should be noted that the students in the study by Rashotte et al. (2001) were not, in general, severely disabled in reading: at the outset of the study the average reading accuracy was standard score 89.
2.9.4 Age
There is an old adage within the special educational needs sector that ‘earlier is better’. For example, the SEN Code of Practice states that identification of special educational needs should be made as early as possible because earlier intervention is likely to be more effective than later intervention (DfES, 2001, Paragraph 5:11). The British Dyslexia Association also calls for identification of dyslexia to be made as early as possible (BDA, 2007). It is pertinent, therefore, to consider the published evidence on whether age makes a significant difference to the impact of intervention.
Lovett & Steinbach (1997) studied 122 disabled readers from grades 2 to 6 (ages 7–12 years) who were of average intelligence but below the 20th centile on several measures of reading proficiency, including word identification and word attack. The children were given instruction using one of two approaches: (a) the Phonological Analysis and Blending Direction Instruction programme (PHAB/DI), which focused on letter-sound and letter cluster-sound correspondences, or (b) the Word Identification Strategy Training programme (WIST), which focused on teaching word identification strategies in the context of key words that represent 120 high-frequency English spelling patterns. The former corresponds most closely to the core features of conventional specialist dyslexia teaching, but the latter also figures in many specialist dyslexia teaching approaches (see Section 1.3.3). The four strategies in the WIST programme were: (i) word identification by analogy, (ii) seeking the part of the word that you know, (iii) attempting variable vowel pronunciations, and (iv) segmenting prefixes and suffixes
52 Intervention for Dyslexia
from multisyllabic words. Instruction was given by specialist teachers, each working with groups of two or three children, with a total of 35 hours of instruction being given in two teaching sessions of 60 minutes four times each week. The two intervention groups were compared with a control group of children who received general classroom support (including training in organization strategies and study skills) but no specific literacy training over and above that normally provided in the mainstream classroom.
Both the PHAB/DI and WIST programmes were associated with significant improvements in word identification and word attack skills, compared with the control group. Children on the PHAB/DI programme also tended to make somewhat greater progress on measures of sound segmentation and sound blending. However, the results were characterized by a notable absence of significant age effects; the older students were found to be equally able to benefit from these intervention programmes as the younger students. On a wide range of measures, older students were found, on average, to make gains that were equal to, or greater than, those of younger students. For example, in word attack (Woodcock Reading Mastery Test – revised) the children in grades 5–6 on the PHAB/DI programme made an average gain of one standard deviation (from standard score 61.6 to 76.4) while those in grades 2–3 made an average gain of two-thirds of a standard deviation (from 68.7 to 78.1). Although in this study the interventions did not succeed in ‘normalising’ reading (i.e. did not raise the students’ reading skills to standard score 90 or above), the authors conclude that their findings not only demonstrate that the phonological deficits associated with dyslexia are “amenable to focused and intensive remedial effort” but also that “there is no evidence that older disabled readers cannot benefit from intensive deficit-directed remediation of the core deficits associated with developmental reading disability” (Lovett & Steinbach, 1997, p. 208).
2.10 Conclusions on tertiary intervention It should be abundantly clear from the studies reviewed in this section that children with dyslexia or LD can benefit significantly and substantially from intensive tertiary intervention. Torgesen (2005b), one of the most eminent researchers in the field, sums it up thus:
“…we now have considerable evidence available concerning the effectiveness of intensive and explicit reading interventions for children who have struggled in learning to read. We know, for example, that it is possible to teach almost all children to accurately apply the alphabetic principle in decoding novel words, even if they have struggled to acquire this skill during the first 3–4 years of schooling. We also know that the text reading accuracy and reading comprehension of children with relatively severe reading disabilities can be accelerated dramatically by carefully administered interventions that are more intensive than instruction typically provided in special education settings. We have yet to discover interventions that can ‘normalize’ the reading fluency of students who have missed out on 2–4 years of reading practice because of very poor reading skills during the early elementary school years. However, this problem may ultimately arise from the nature of reading fluency itself and the fact that fluency continues to accelerate rapidly in ‘average’ readers during the late elementary, middle, and high school years, rather than being an inherent problem with the instructional methods currently available.” (Torgesen, 2005b, p. 537)
Intervention for Dyslexia 53

Studies of both secondary and tertiary interventions from around the word show that phonologically-based elements (including phonics) are key to their success. Chapter 3 addresses the issue of whether UK studies show similar results.
54 Intervention for Dyslexia

3 UK intervention studies
3.1 Stages of intervention in England The tiers of intervention used in the USA roughly correspond to what are called ‘waves’ in England. ‘Wave 1’ refers to the initial teaching of literacy in schools in which there should be effective inclusion of all children in a daily and high quality literacy hour with appropriate differentiation where required (DfES, 2003). However, if children do not respond appropriately to initial classroom literacy instruction, then intervention becomes necessary. Wave 2 describes specific, additional and time-limited interventions provided for some children who need help to accelerate their progress to enable them to work at or above age-related expectations. Primary National Strategy programmes such as Early Literacy Support or Springboard would be regarded as Wave 2 interventions. Wave 3 describes targeted provision for a minority of children where it is necessary to provide highly tailored intervention to accelerate progress or enable children to achieve their potential. This may include 1:1 or specialist interventions, and, where older children are concerned, usually refers to specifically targeted approaches for children identified as requiring SEN support (on School Action, School Action Plus or with a Statement of Special Educational Needs) (DfES, 2003). Probably the best-known example of a Wave 3 intervention is Reading Recovery (see Chapter 5), but there are other popular programmes, such as Catch Up Literacy, 6 and Sound Linkage (Hatcher, 2000a).7 All three of these programmes are normally delivered 1:1, but none is designed specifically for dyslexic pupils. Reading Recovery is generally given to children between the ages of 5 years 9 months and 6 years 3 months, and although Catch Up and Sound Linkage are both intended primarily for use in Years 1–3, they could be used at any time between the ages of 6 and 14 and hence might be regarded as secondary or even tertiary interventions according to the children involved.
3.2 Rationale for the selection of studies As with the review of intervention studies carried out in the USA and elsewhere in the world (see Chapter 2) only UK programmes and studies that have a strong emphasis on phonological skills are considered here, for reasons explained in the Introduction (see Section 1.1). Brooks (2007) has reviewed UK intervention studies for children with literacy difficulties in considerable detail. Fawcett (2002a) has also reviewed traditional phonologically based interventions. Fourteen teaching programmes that had been the subject of UK intervention studies were found by Brooks (2007) to have a major focus on phonological skills for reading, and therefore may be considered of potential benefit to children with dyslexia. Almost all of these were found by Brooks to be effective and, although few of the studies specifically targeted children with identified dyslexia (see Table 6), most were carried out with pupils who were on the SEN register and/or whose literacy development was substantially behind expected levels. It is therefore extremely
6 http://www.catchup.org.uk/pages/home.shtm
7 Sound Linkage also forms the basis of the Cumbria Reading Intervention programme [http://www.cumbria.gov.uk/childrensservices/reading/default.asp].
Intervention for Dyslexia 55

likely that significant proportions of the children involved in these studies had dyslexia. (For the similar argument deployed by Reading Recovery, see section 5.6.2.)
In preparing this chapter, the emphasis has been on identifying teaching programmes that are most likely to be of benefit for dyslexic pupils. Of the 14 phonological programmes considered by Brooks, the following six have not been considered here because current evidence is not substantial enough to form a view on whether or not they are likely to be useful for dyslexics: ARROW, Direct Phonics, Phonological Awareness Training (PAT), Sound Discovery, Sounds~Write, Sound Training for Reading. However, if further research became available that view might have to be reconsidered.
The following eight phonological programmes have been selected as being of particular relevance to this review either because they have been the subject of several published larger-scale intervention studies (often with children who are more severely impaired in reading) and/or the impact was particularly marked (and therefore they are more likely to prove beneficial to dyslexics): AcceleRead AcceleWrite, Lexia, Phono-Graphix, Phonology with Reading, Read Write Inc., SIDNEY, THRASS, Toe by Toe. To these eight we may add two further approaches that are also highly structured programmes focusing primarily on phonological skills, and which have been the subject of several research studies: Interactive Assessment and Teaching (IA&T) and Reading Intervention (formerly Cumbria Reading with Phonology project). Finally, I have added a third approach using combined phonological methods, carried out in the London Borough of Sutton and reported by Savage and Carless (2005), which was notable for its use of learning support assistants.
All eleven of these approaches are reviewed below in alphabetical order, and summarised in Table 6 (page 65). Wherever possible, effect sizes have been quoted, but elsewhere ratio gains have been reported instead (see Section 1.5 for explanation of effect sizes and ratio gains). In studies where control or comparison groups have been employed, this is stated below, but, unfortunately, most of these studies did not involve control or comparison groups.
3.3 Review of studies
3.3.1 AcceleRead AcceleWrite
AcceleRead AcceleWrite (Miles, 1994) is a computer-based phonological intervention approach in which the child reads and memorises sentences displayed on a card, and after saying them aloud types them into a computer which says each word as it is typed and reads the whole sentence after the full stop has been entered. The sentences have been constructed in accordance with particular phonic patterns (Clifford & Miles, 2004). By hearing the words and sentences spoken back by the computer the child receives immediate feedback on the accuracy of what they have typed. This approach, which is highly structured and incorporates regular revision of material, can be used with any suitable text-to-speech software, of which a wide range is commercially available. The programme should ideally be used in short (preferably daily) sessions.
Brooks (2007) reports a number of unpublished intervention studies that have used AcceleRead AcceleWrite, all of which have produced very, or fairly, substantial gains, including one carried out in Jersey in 1993 in which 61 children with reading difficulties used the programme for four weeks. Ratio gains of 8.3 for reading and 4.0 for spelling
56 Intervention for Dyslexia

and effect sizes of 0.55 for reading and 0.27 for spelling were calculated by Brooks. This is one of the few studies to have followed the children up after the intervention: both 10 weeks and six months later they had continued to improve. Another study carried out over four weeks in Wiltshire, with 149 poor readers in years 3–6, produced ratio gains of 7.7 for reading comprehension and 6.2 for spelling.
In an evaluation of Wave 3 interventions carried out by Bristol Learning Support Service (2005), a total of 60 pupils in 13 primary schools used AcceleRead AcceleWrite. 88% of these children were on the SEN register, including 5% with statements of special educational need and 43% at School Action Plus, suggesting that most of these children were considerably disabled in reading. Standardised assessments were carried out using the NFER Individual Reading Analysis, Neale Analysis of Reading Ability (NARA), and Vernon Spelling. The results (after an estimated eight weeks of intervention) revealed ratio gains of 2.3 for reading accuracy, 2.9 for reading comprehension and 2.0 for spelling.
3.3.2 Interactive Assessment and Teaching (IA&T)8
Nicolson, Fawcett, Moss, Nicolson & Reason (1999) screened classes in four UK infant schools to identify children most at risk of reading failure on the basis of their WORD reading and spelling scores (N=62, mean age 6 years 0 months). These children were also assessed on the Dyslexia Early Screening Test (DEST) and the British Picture Vocabulary Scale (BPVS), a test of verbal intelligence. The intervention group was given an adaptive, curriculum-based support programme with the emphasis on word building and phonics skills, based on the Interactive Assessment and Teaching (IA&T) reading programme (Reason & Boote, 1994). The intervention was delivered by trained researchers to children in groups of four for two 30-minute sessions per week for 10 weeks (10 hours total intervention).
The intervention group improved significantly in reading and spelling standard scores (effect size 0.94 for reading and 0.95 for spelling) compared with a group of control children (N=38) that had been matched for age and reading performance, the latter making no overall improvement. A follow-up six months later showed that the gains made by the intervention group were maintained in spelling but largely lost in reading (although the children in the control group had slipped back even more). Despite the clear progress of the intervention group overall, 25% remained ‘problem readers’ (i.e. with reading still at least 6 months behind expected levels).
The authors propose the following three-stage intervention strategy: (i) children at risk of reading difficulties are identified before 6 years; (ii) at-risk children are given a small-group intervention programme for 3–4 months; (iii) children still failing to make progress should then be given continuing targeted additional support. They also note that the per-child costs of this study are about 3.5 hours of teacher time, compared with the
8 Note that in all the papers reported in this subsection, the authors have calculated effect sizes separately for each group, and not on the basis of difference in gains between the intervention group and the control group as advocated by Brooks (2007). The latter method will generally result in somewhat lower effect sizes. For example, in the paper by Nicolson, Fawcett, Moss, Nicolson & Reason (1999) the authors quote effect sizes of 0.94 for reading and 0.95 for spelling, whereas Brooks (2007) reports somewhat lower effect sizes for this study (0.72 for reading and 0.56 for spelling).
Intervention for Dyslexia 57

typical 35+ hours of teacher time for Reading Recovery, i.e. approximately 10% of those required for Reading Recovery, and delivered by instructors who had received far less training, further enhancing the cost-effectiveness of this approach to intervention.
A further study by these authors (Fawcett, Nicolson, Moss, Nicolson & Reason, 2001) examined the same approach but with older children. The participants in the experimental group (N=36; mean age 7 years 7 months) were given the intervention programme in pairs for two 30-minute sessions per week for 10 weeks (10 hours total intervention). Although the intervention proved to be effective, with significant gains being made in literacy compared with a control group (N=51) matched for age and reading performance (effect size at the end of the intervention: 0.67), these were not as strong as had been found in the infant school study (ES 0.95). The authors calculated that this intervention produced comparable gains to Reading Recovery but at approximately 20% of the cost.
A follow-up six months later showed that the effect size of the gains made by the intervention group dropped from 0.67 to 0.55, gains in reading being largely maintained while gains in spelling were partly lost. Just over a third of the intervention group (36%) maintained their progress over the subsequent six months after the intervention ceased; arguably, these children can be regarded as having reached the stage at which they can keep up with their peers in literacy development. Although the remainder of the children made significant progress as a result of the intervention when compared with the control group, they must be regarded as still being in need of support.
Nicolson, Fawcett & Nicolson (2000) evaluated a computer-based version of IA&T called RITA (Reader’s Intelligent Teaching Assistant) with 58 Year 2 and 16 Year 3 pupils in four schools. The computer program RITA does not replace the teacher; rather the teacher uses RITA to specify activities for the child to work through, and RITA stores and analyses the results of the student’s work. Over a 10-week intervention period, and in comparison with control groups matched on age and reading ability, the RITA studies produced effect sizes for reading of 0.30 (Year 2) and 1.34 (Year 3) and for spelling of 0.98 (Year 2) and 0.77 (Year 3). Compared with the data obtained by Nicolson, Fawcett, Moss, Nicolson & Reason (1999) using the IA&T approach without computer support (reported above), these results are about the same for spelling, somewhat poorer for Year 2 reading but considerably better for Year 3 reading. Of the 75 children in both studies with RITA intervention, 49% made good progress (literacy improvement 5 standard score points or greater), 22% made modest progress (improvement between 2 and 4 standard score points), and 24% may be said to have maintained their position (improvement between 0.7 and 1.5 standard score points). During the intervention only four children (5%) declined in performance. Given that the total teacher time (including preparation) was only 6 hours per Year 2 child and 8 hours per Year 3 child, this intervention can be considered highly cost-effective. However, overall the results suggest little extra benefit of the computerised version of the IA&T intervention over the conventional one, although the authors report enhanced motivation of children using the RITA program.
3.3.3 Lexia
Wilson and Clarke (2005) reported on a study carried out in York using the computer-based phonics teaching system Lexia, originally developed in the USA for children with dyslexia. A total of 42 children in seven schools participated in the project; most of these children were on the SEN register at School Action or School Action Plus. The pupils
58 Intervention for Dyslexia
used Lexia for 10 weeks, after which time their reading (Salford Sentence Reading Test) was found to have improved substantially (ratio gain 3.0) and their spelling (SPAR Spelling Test) markedly (ratio gain 2.0). However, a similar study with Lexia, carried out over 10 weeks in Norfolk (Worsley, 2003), involving 37 poor readers in 13 schools, produced smaller ratio gains: 2.6 for reading and 1.0 for spelling.
3.3.4 London Borough of Sutton study
Savage and Carless (2005) carried out a study in the London Borough of Sutton in which 106 6-year-old poor readers were assigned to one of three intervention conditions that involved oral and written phoneme training (Kibel, 2000) and rhyme training (Wilson and Frederickson, 1995), or to a control condition where the children received standard national curriculum reading instruction. The children were the poorest readers in the nine participating schools and had been identified by learning support assistants using a screening battery comprising assessments of rhyming, blending, segmentation and decoding skills, which had been administered to all 498 Year 1 children in these schools. Instruction was delivered over nine weeks by trained learning support assistants, in 20-minute sessions given four times each week (total of 12 hours intervention). Overall, the intervention produced gains in decoding skills, letter-sound knowledge and phonological awareness that were significantly greater in the intervention groups than in the control group. Effect sizes were 0.56 (decoding skills), 0.49 (letter-sound knowledge) and 0.80 (phonological awareness). These results are particularly impressive when one considers that this relatively short intervention was delivered by teaching assistants and that the standard national curriculum reading instruction received by the control group already places considerable emphasis on decoding skills, letter-sound knowledge and phonological awareness. It is unsurprising, therefore, that in this study the children in the control group made substantial gains, but, nonetheless, they were significantly out-performed by the intervention groups.
In a follow-up of this study, Savage and Carless (2008) explored whether the effects of interventions delivered by classroom assistants were still evident at the end of the first phase of schooling, 16 months after the early intervention finished. Children were divided into 'treatment responder' and 'treatment non-responder' groups based upon post-test decoding skills. The treatment responder group was significantly more likely to achieve average results in national tests at the end of Key Stage 1, and higher teacher ratings of attainment, than the treatment non-responders. The authors concluded that gains in reading delivered following early phonic reading interventions delivered by classroom assistants are maintained for many children, but non-responders and treatment responders with only modest decoding skill may require additional support to achieve national targets in literacy.
3.3.5 Phono-Graphix
Phono-Graphix™ (McGuinness & McGuinness, 1998), which is widely used in the USA and the UK, featured as the teaching programme adopted in some published intervention studies carried out in the USA (e.g. Truch, 2003). Derrington (2001a, 2001b) reported on three studies using Phono-Graphix in Bristol primary schools. A total of 230 poor readers in 13 schools were involved. Of these, 141 were Year 1 children, who after 6 months showed a ratio gain in reading of 2.2 (WRAPS Test). Another study of children in Years 4–6 (N=15) over 4 months reported a ratio gain of 5.8 for reading accuracy (NFER Individual Reading Analysis) and 4.3 for reading comprehension (NARA). A final study involving 74 pupils in Years 2–6 produced ratio gains of 8.3 for
Intervention for Dyslexia 59

reading accuracy, 8.3 for reading comprehension, and 3.3 for spelling (Vernon). The reading ability of participants from Year 2–6 in these studies was very poor before intervention and most clearly made substantial progress as a result of intervention.
Lore (2001) reported on the use of Phono-Graphix at Moon Hall School in Surrey, an independent specialist school for children with dyslexia. The participants were pupils in Years 5 and 6, all of whom were severely dyslexic and were at least three years behind chronological age levels in reading ability. After 6 months using Phono-Graphix, the average reading improvement for one cohort of 11 pupils was 24.5 months (range 13 – 37 months), with a ratio gain of 4.1. After intervention most of these dyslexic pupils were performing within, or approaching, the normal range in reading ability, and with further input would be expected to improve further. Lore reports similar progress with subsequent cohorts taught using Phono-Graphix in that school, and Brooks (2007) also reports on a study using Phono-Graphix with 12 dyslexic children in Year 4 in the same school. After 6 months’ intervention, the children were found to have made remarkable progress, with a ratio gain of 4.5 (Macmillan Graded Word Reading test).
3.3.6 Phonology with Reading
Bowyer-Crane et al. (2008) compared a ‘phonology with reading’ intervention approach (P + R) with an oral language approach (OL) for a sample of children (mean age 4 years 9 months) who were at risk of literacy difficulties because of their poor oral language at school entry, i.e. before formal reading instruction had commenced. Initial screening of 960 children in 23 schools was carried out using tests of expressive language and nonword repetition, with the lowest scoring children being classified as at risk (N=152) and randomly assigned to either the P + R or the OL (comparison) condition. Both groups received 20 weeks of daily intervention from trained teaching assistants, who alternated daily between 30 minutes of individual tuition and 20 minutes of small group work (approximately 42 hours of total intervention). The P + R group focused on letter-sound knowledge, phonological awareness and text reading skills. The OL group focused on vocabulary, comprehension, inference generation and narrative skills. Although this study did not attempt to classify any of these at-risk children as being dyslexic, it is highly likely that a significant proportion of them were, given the evidence on the relationship between early language skills and later dyslexia (Snowling, 2008; Snowling & Hayiou-Thomas, 2006).
At the end of the intervention, the P + R group displayed significant advantages over the OL group in measures of literacy (effect sizes 0.32–0.45) and strong advantages in phonological skills (0.7 SD at post-test). Since the experimental design involved a treated control group, lower effect sizes were to be expected than if the control had remained untreated. The OL group showed advantages over the P + R group on measures of vocabulary (1 SD at post-test) and grammatical skills. A follow-up five months later indicated that these gains had mostly been maintained. A standard score of below 85 for reading was used to identify children who still remained at risk after the intervention; on this criterion 50% of the P + R group and 68% of the OL group were still at risk. Moreover, 7% of the children in the P + R group had above average reading scores (above SS 115) while none of the OL children fell in this range. This study does not provide a cognitive analysis of the children who were ‘normalised’ compared with those still at risk at the end of the study, and hence it remains a possibility that the dyslexic children within this sample all remained below 85 SS in reading. Nevertheless, this study does demonstrate that trained teaching assistants are able to deliver
60 Intervention for Dyslexia

structured phonologically-based secondary intervention that has significant benefits for at-risk children.
3.3.7 Read Write Inc.
Read Write Inc. is a phonics initial instruction programme devised by Ruth Miskin, designed primarily for children in Years 1–4 (Wave 1); however, it has occasionally been used as a Wave 2 or Wave 3 intervention both at primary and secondary level.
Brooks (2007) reports on a study of Read Write Inc. carried out in 12 primary schools in Bristol with 117 SEN children in Years 2–6. After about 8-9 weeks of intervention (each pupil received about 4-5 hours of teaching) the ratio gains found were 2.3 for reading accuracy (NFER Individual Reading Analysis), 2.6 for reading comprehension (NARA) and 1.7 for spelling (Vernon). Brooks (2007) also reports on two studies using Read Write Inc. in the London Borough of Haringey. In the first, 30 very poor readers in Years 5–6 in approximately seven primary schools were given intervention over 5 months, with a ratio gain of 3.8 (NARA). In the second study, 21 very poor readers in Years 3–6 in one primary school were given intervention over 3 months, with a ratio gain of 5.0 (New Salford Reading Test).
Brooks, Harman and Harman (2003) carried out an evaluation of Read Write Inc. for the DfES with secondary school pupils in Years 7–9. All the participants had reading ages more than three years below chronological ages and may be considered to have severe reading difficulties. A total of 156 pupils in six schools participated, although spelling data were available for only 96 children in five schools. The length of the intervention was 5.5 months. For reading (Suffolk Reading Scale), a ratio gain of 1.6 was found (effect size 0.34). For spelling (Young’s Parallel Spelling Test) the ratio gain was only 0.9 (ES: zero).
Lanes et al. (2005) evaluated the use of Read Write Inc. as an intervention for pupils with poor literacy skills in one secondary school in Leicester. Two successive cohorts of Year 7 pupils were involved (total N=63) and all participants had reading ages below 9.0 years on entry to the school (i.e. at least two years behind chronological age levels). Over a 9-month intervention period a ratio gain of 2.3 was found for reading (New Macmillan Individual Reading Analysis) but only 0.8 for spelling (Vernon).
Brooks (2007) reports on an unpublished study of Read Write Inc. carried out in Cornwall. A total of 29 Year 7 pupils in one secondary school were involved; all had low literacy attainment on entry to the school. The intervention was relatively short (6 weeks) but nevertheless in reading a substantial ratio gain of 8.0 was found (NFER 9–14 Group Reading Test), with an effect size of 0.25.
3.3.8 Reading Intervention
Reading Intervention is a system that integrates training in phonological awareness and letter knowledge within the context of a programme of structured reading instruction based on methods used in Reading Recovery (see Chapter 5 for review of Reading Recovery). This approach arose out of a landmark RCT study by Hatcher, Hulme and Ellis (1994) in which it was shown that phonological awareness training is most effective when combined with the teaching of reading (the ‘phonological linkage hypothesis’). In this study, 32 poor readers in Year 2 received a structured reading programme combined with phonological awareness training over a 20-week period, with two 30-
Intervention for Dyslexia 61

minute sessions being given each week. Improvements in reading accuracy, reading comprehension and spelling were significantly greater for pupils taught with the combined programme, compared with comparison groups given either phonological awareness training or structured reading instruction alone, with effect sizes [and ratio gains] of 0.36 [1.5] (reading accuracy), 0.86 [1.9] (reading comprehension) and 0.36 [1.7] (spelling). This comparatively short intervention was not sufficient to normalise these children’s reading, but Hatcher (2003) estimates that at this rate of progress (0.31 SS points per hour of intervention) the children would need a further 26 hours of intervention to come within the normal range (i.e. achieve a standard score of 90+). However, in the nine months following the intervention the children made slightly less than standard progress. This amount of intervention compares favourably with those reported in other effective studies of intensive remediation (see Section 2.9.1).
Hatcher (2000a) developed this approach into a published reading intervention programme called ‘Sound Linkage’ and subsequently reported a study with 29 children with dyslexia (Hatcher, 2000b), in which considerable improvements were found over a 12-week intervention period, with ratio gains of 2.9 for reading and 2.1 for spelling. Hatcher (2000b) also reports a large-scale study of 427 poor readers in Years 2–10, of whom 73 had statements of special educational need. Again, over a 12-week intervention period, marked progress was seen, with ratio gains of 2.0 for reading and 2.6 for spelling.
Hatcher, Hulme et al. (2006) carried out an intervention study with Year 1 children who were delayed in literacy development (approximately bottom 8% for reading development, although children with severe behaviour difficulties, poor attendance or low general ability were excluded). These children had been identified using a staged selection approach, which began by screening 635 children in 16 schools using a group spelling test, and progressed to individual assessment of 118 poor spellers using tests of word reading, phonological awareness, letter knowledge and vocabulary. The 77 children who were finally selected by this method were randomly assigned to an intervention programme of either 20 weeks or 10 weeks, the latter constituting a ‘waiting’ control group whose intervention began after the other group had received 10 weeks of instruction. Teaching was delivered daily in 20-minute sessions by trained teaching assistants working on alternate days with children individually and in groups of three, so that the 20-week group received a total of 33 hours of instruction, while the 10-week group received a total of 16.5 hours of instruction. Teaching was highly structured and was based on the ‘Sound Linkage’ method, which combines phoneme awareness training, word and text reading, and phonological linkage exercises. At the end of the first 10-week period, the intervention group was found to have made significantly more progress than the waiting control (which up to that point had not received any intervention), with the following effect sizes: 0.69 (BAS word reading), 0.94 (letter knowledge), and 0.46 (phoneme manipulation). However, when the children in the waiting control group received their intervention, they made rapid progress and in 10 weeks largely caught up the children who had received the longer 20-week intervention. However, average reading levels after the intervention were still somewhat below the normal range. On the whole, gains were maintained 11 months after the end of the intervention. Overall, around a quarter of the children did not respond to the intervention and hence would need further specialist support.
62 Intervention for Dyslexia
3.3.9 SIDNEY
Norgate and Bentote (2005) reported on a study carried out in Hampshire schools in which children were screened for dyslexia at the end of Year 1 using either DEST (Dyslexia Early Screening Test; Nicolson & Fawcett, 1996) or Lucid CoPS (Cognitive Profiling System; Singleton, Thomas and Leedale, 1996). Children who screened positive (N=66) then worked individually through a daily intervention programme delivered by trained teaching assistants for 15 minutes per day over 12 weeks. The intervention programme (called ‘Screening and Intervention for Dyslexia, Notably in the Early Years’, with the acronym SIDNEY) was multisensory and phonological in overall approach, focusing on letter-sound linkages, blending, and phonological awareness training. Pre- and post-testing using the Word Recognition and Phonic Skills test (WRAPS) revealed statistically significant gains (p<0.001) in reading ability (effect size 0.43, calculated by Brooks, 2007). These gains are impressive, given the modest amount of overall intervention provided in this study (totalling 15 hours), and, like the study by Bowyer-Crane et al. (2008), demonstrate that educationally-effective and cost-effective phonological programmes can be delivered by trained teaching assistants.
3.3.10 THRASS
THRASS (‘Teaching Handwriting, Reading and Spelling Skills’) is a structured multi-sensory literacy programme that teaches grapheme-phoneme correspondences, word recognition and writing skills with the help of pictures, sounds and keywords. First published in 1992, the basic programme has been steadily augmented with a variety of resources, including audio CDs and computer software. THRASS is widely used in the UK and elsewhere in the world (www.thrass.co.uk).
Most of the evaluation studies on THRASS have been as an initial literacy instruction programme rather than as an intervention for struggling readers. However, Brooks (2007) reports on three intervention studies using THRASS. Matthews (1998) carried out an intervention study of 160 poor readers in Years 3–6 in eight schools in Bridgend, South Wales. Students used THRASS over 13 weeks. Pre-tests and post-tests were administered using NARA and the Schonell spelling test. All groups made marked gains in reading (ratio gains of 2.2–3.4 for reading accuracy, 2.3–4.2 for reading comprehension), but only the youngest group (Year 3) improved in spelling (ratio gain 2.5). The same project was carried out in four Bridgend secondary schools, and involved 76 poor readers in Years 7–8. Gains in reading were more marked than in the primary samples, with ratio gains for reading accuracy of 4.0 (Year 7) and 5.3 (Year 8), and for reading comprehension of 5.7 (Year 7) and 5.4 (Year 8). As with the younger pupils, however, ratio gains in spelling were less marked: 1.8 (Year 7) and 2.0 (Year 8). In another (unpublished) study by Norgate carried out in Hampshire during 2005, 84 poor readers in five schools used THRASS for six months, producing a ratio gain of 2.3 for reading (Salford reading test). Overall, the results of these studies using THRASS as an intervention for pupils with reading difficulties must be considered important, although the effects for spelling were only modest.
3.3.11 Toe by Toe
Toe by Toe (Cowling & Cowling, 1993) is a highly systematic structured programme of phonics instruction, designed to be easy-to-use by non-professionals as well as teachers. As well as being used in many schools, it is often used in prisons and Young Offender Institutions, and also by dyslexia tutors working with adult dyslexics in the community.
Intervention for Dyslexia 63

MacKay (2006) studied the use of Toe by Toe in 32 Scottish primary schools with 91 Year 7 pupils who were poor readers. Over a 6-month intervention period the ratio gain for reading was 2.3 (NARA). Brooks (2007) also reports on an unpublished study using Toe by Toe with 21 primary age children with literacy difficulties (age not stated). Over an 18-month intervention period a ratio gain of 2.7 was obtained for reading.
3.3.12 Summary
This section has shown that the featured phonologically based interventions on average produced good results: on the whole, the children involved made useful gains in reading (both accuracy and comprehension) and in spelling. Two further points are worth noting: (1) All the programmes except Toe by Toe embed the phonics teaching within a broad and rich literacy curriculum (for details, see Brooks, 2007); (2) Of the three studies with dyslexic children, the two using Phono-Graphix produced large ratio gains.
These findings are consistent with those from more rigorous studies conducted elsewhere in the world and analysed in Chapter 2.
For comparisons between phonologically based programmes and Reading Recovery (including Every Child a Reader) see Section 5.4.3.
64 Intervention for Dyslexia

Table 6. Summary of results of UK intervention studies using structured systematic phonological teaching programmes
Reading Accuracy Reading Comprehension
Spelling
Programme
Reference
Year Group(s)
Ns
Taught by
Effect size Ratio gain Effect size Ratio gain Effect size Ratio gain
AcceleRead AcceleWrite
Bristol Learning Support Service (2005)
Y2-6 60 Teachers/ Teaching assistants 2.3 2.9 2.0
AcceleRead AcceleWrite
Brooks (2007) p.135
Y3-9 61 Teachers/ Teaching assistants 0.55 8.3 0.27 4.0
AcceleRead AcceleWrite
Brooks (2007) p.137
Y5–6 30 Teachers/ Teaching assistants 16.9 9.8
AcceleRead AcceleWrite
Brooks (2007) p.139
Y3–6 149 Teachers/ Teaching assistants 7.7 6.2
IA&T Nicolson, Fawcett, Moss, Nicolson & Reason (1999)
Y1 62 Teacher/ Researchers 0.94 0.95
IA&T Fawcett, Nicolson, Moss, Nicolson & Reason (2001)
Y3 36 Teachers/ Researchers 0.61 0.72
IA&T (RITA) Nicolson, Fawcett & Nicolson (1999)
Y3 16 Teachers/ Researchers and Computer
1.34 0.77
Intervention for Dyslexia 65

Table 6 (continued). Summary of results of UK intervention studies using structured systematic phonological teaching programmes.
Reading Accuracy Reading Comprehension
Spelling
Programme
Reference
Year Group(s)
Ns
Taught by
Effect size Ratio gain Effect size Ratio gain Effect size Ratio gain
Lexia Wilson and Clarke (2005)
Y2-6 42 Computer 3.0 2.0
Lexia Worsley (2003) Y2–3 37 Computer 2.6 1.0
Phono-Graphix
Derrington (2001a, 2001b)
Y1 141 Teachers 2.2
Phono-Graphix
Derrington (2001a, 2001b)
Y4–6 15 Teachers 5.8 4.3
Phono-Graphix
Derrington (2001a, 2001b)
Y2-6 74 Teachers 8.3 8.3 3.3
Phono-Graphix
Lore (2001) (see Note 4)
Y5-6 11 Teachers 4.1
Phono-Graphix
Brooks (2007) p.192 (see Note 4)
Y4 12 Teachers 4.5
Phonology with Reading
Bowyer-Crane et al. (2008)
Reception 152 Teaching assistants/Group 0.32 0.45
66 Intervention for Dyslexia

Table 6 (continued). Summary of results of UK intervention studies using structured systematic phonological teaching programmes
Reading Accuracy Reading Comprehension
Spelling
Programme
Reference
Year Group(s)
Ns
Taught by
Effect size Ratio gain Effect size Ratio gain Effect size Ratio gain
Read Write Inc
Brooks (2007) p.197
Y2–6 117 Teachers/Teaching assistants/Group 2.3 2.6 1.7
Read Write Inc
Brooks (2007) p.198
Y5–6 30 Teachers/Teaching assistants/Group 3.8
Read Write Inc
Brooks (2007) p.199
Y3–6 21 Teachers/Teaching assistants/Group 5.0
Read Write Inc
Brooks, Harman and Harman (2003)
Y7–9 156 Teachers/Teaching assistants/Group 0.34 1.6 0.9
Read Write Inc
Lanes et al. (2005) Y7 63 Teachers/Teaching assistants/Group 2.3 0.8
Read Write Inc
Brooks (2007) p.253
Y7 29 Teachers/Teaching assistants/Group 0.25 8.0
Intervention for Dyslexia 67

Table 6 (continued). Summary of results of UK intervention studies using structured systematic phonological teaching programmes
Reading Accuracy Reading Comprehension
Spelling
Programme
Reference
Year Group(s)
Ns
Taught by
Effect size Ratio gain Effect size Ratio gain Effect size Ratio gain
Reading Intervention
Hatcher, Hulme and Ellis (1994)
Y2 32 Teachers 0.36 1.5 0.86 1.9 .36 1.7
Reading Intervention
Hatcher (2000b) (see Note 4)
Y2–10 29 Teachers 2.9 2.1
Reading Intervention
Hatcher (2000b) Y2–10 427 Teachers 2.0 2.6
Reading Intervention
Hatcher, Hulme et al. (2006)
Y1 77 Teaching assistants 0.69
SIDNEY Norgate and Bentote (2005)
Y2 66 Teaching assistants 0.43
THRASS Matthews (1998) (see Note 2)
Y3-6 160 Teachers/Teaching assistants 2.6 3.3 1.2
THRASS Matthews (1998) (see Note 2)
Y7–8 76 Teachers/Teaching assistants 4.3 5.6 1.9
68 Intervention for Dyslexia
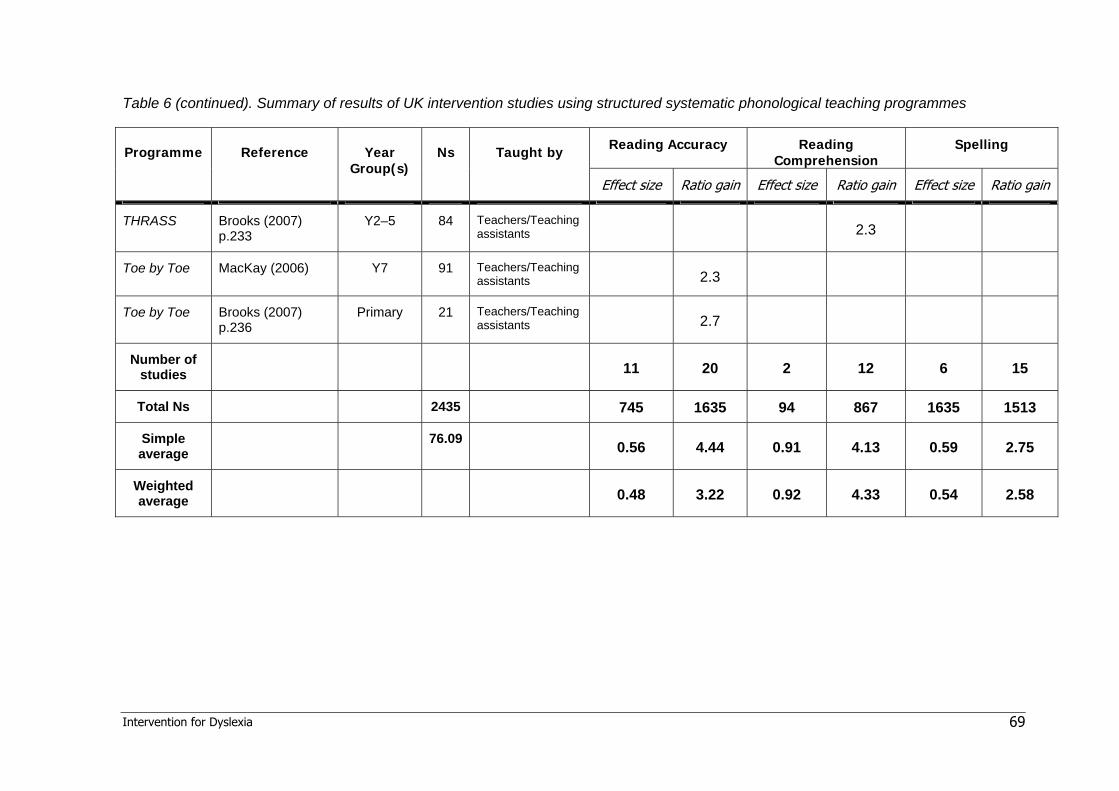
Table 6 (continued). Summary of results of UK intervention studies using structured systematic phonological teaching programmes
Reading Accuracy Reading Comprehension
Spelling Programme Reference Year Group(s)
Ns Taught by
Effect size Ratio gain Effect size Ratio gain Effect size Ratio gain
THRASS Brooks (2007) p.233
Y2–5 84 Teachers/Teaching assistants 2.3
Toe by Toe MacKay (2006) Y7 91 Teachers/Teaching assistants 2.3
Toe by Toe Brooks (2007) p.236
Primary 21 Teachers/Teaching assistants 2.7
Number of studies
11 20 2 12 6 15
Total Ns 2435 745 1635 94 867 1635 1513
Simple average
76.09 0.56 4.44 0.91 4.13 0.59 2.75
Weighted average
0.48 3.22 0.92 4.33 0.54 2.58
Intervention for Dyslexia 69

Notes to Table 6
1. The study by Savage and Carless (2005) has been omitted from this table as the dependent variables were decoding skills (ES 0.56), letter-sound knowledge (ES 0.49) and phonological awareness (ES 0.80). Measures of reading accuracy, reading comprehension and spelling were not included in this study.
2. Ratio gains have been calculated as averages of the results for the separate year groups in the study (weighted for group size).
3. Weighted averages calculated by factoring in the size of each of the samples included in that category.
4. Study carried out with children specifically identified as having dyslexia (total N = 52)
Guide to interpretation of effect sizes (Cohen, 1977) and ratio gains (Brooks, 2007)
Interpretation Effect size (Cohen’s d) Ratio gain
Large impact, of substantial educational significance Above 0.80 3.0 or greater
Medium impact, of useful educational significance 0.50–0.80 2.0–3.0
Small impact, of modest educational significance 0.25–0.50 1.4–2.0
Very small impact, of doubtful educational significance 0–0.25 Below 1.4
70 Intervention for Dyslexia

3.4 Studies in UK specialist dyslexia schools and teaching centres
In the UK, specialist dyslexia teaching is provided in a number of different educational settings, including some state schools, many independent schools and a limited number of schools specialising in education for dyslexic pupils. It is also provided by specialist organisations such as Dyslexia Action and the Helen Arkell Dyslexia Centre, and by a considerable number of independent tutors. There are currently 77 independent schools in the UK that specialise in providing education for pupils with dyslexia and are registered with the Council for the Registration of Schools Teaching Dyslexic pupils (CRESTED). Dyslexia Action employs over 250 specialist dyslexia teachers who teach in its 25 centres and 160 teaching locations, including many schools, around the UK. It should be noted that these organisations tend to take children with the most severe difficulties and co-morbid conditions and hence slower rates of progress are to be expected.
In publications reporting the effectiveness of teaching in UK specialist dyslexia schools and teaching centres, data are often drawn from successive cohorts of pupils over longer periods of time, and a range of approaches may be employed rather than a specific programme (though see above for the use of Phono-Graphix at Moon Hall School in Surrey). For this reason these publications have been considered separately from studies of specific programmes considered above. Unfortunately, however, few organisations have published evidence of the efficacy of their teaching that can be subjected to scientific analysis.
3.4.1 Hornsby and Miles (1980)
Hornsby and Miles (1980) investigated the efficacy of specialist dyslexia teaching methods in three different settings: a hospital clinic, a university teaching unit, and a private teaching centre. The teaching methods used in the three settings were not identical, but all were systematic multisensory phonologically-based programmes, delivered by qualified dyslexia teachers. The results of 107 dyslexic children (mean age at start of teaching: 10 years 10 months) were analysed. The pupils averaged 28 months’ gain in reading age and 28 months’ gain in spelling age over the course of about 20 months of teaching. Before the start of the intervention programmes these children had average ratio gains of 0.53 for reading and 0.32 for spelling; as a result of the intervention their ratio gains increased substantially to 1.4 for both reading and spelling. This accelerated progress as a result of specialist tuition was statistically significant.
3.4.2 East Court School
East Court School is an independent specialist school for dyslexic pupils in Ramsgate, which opened in 1983. Thomson (2003) reported on a study of 252 children who had attended East Court during the period 1983–2000. All the children had been diagnosed by Educational Psychologists as having dyslexia, and most displayed significant deficits in phonological skills, verbal memory and processing speed. On average they spent 2.5 years at the school, which had the objective of returning the children to mainstream education, usually between 11 and 13 years of age. Assessment data included BAS Word Reading, NARA and Vernon spelling. The average chronological age at the outset of
Intervention for Dyslexia 71
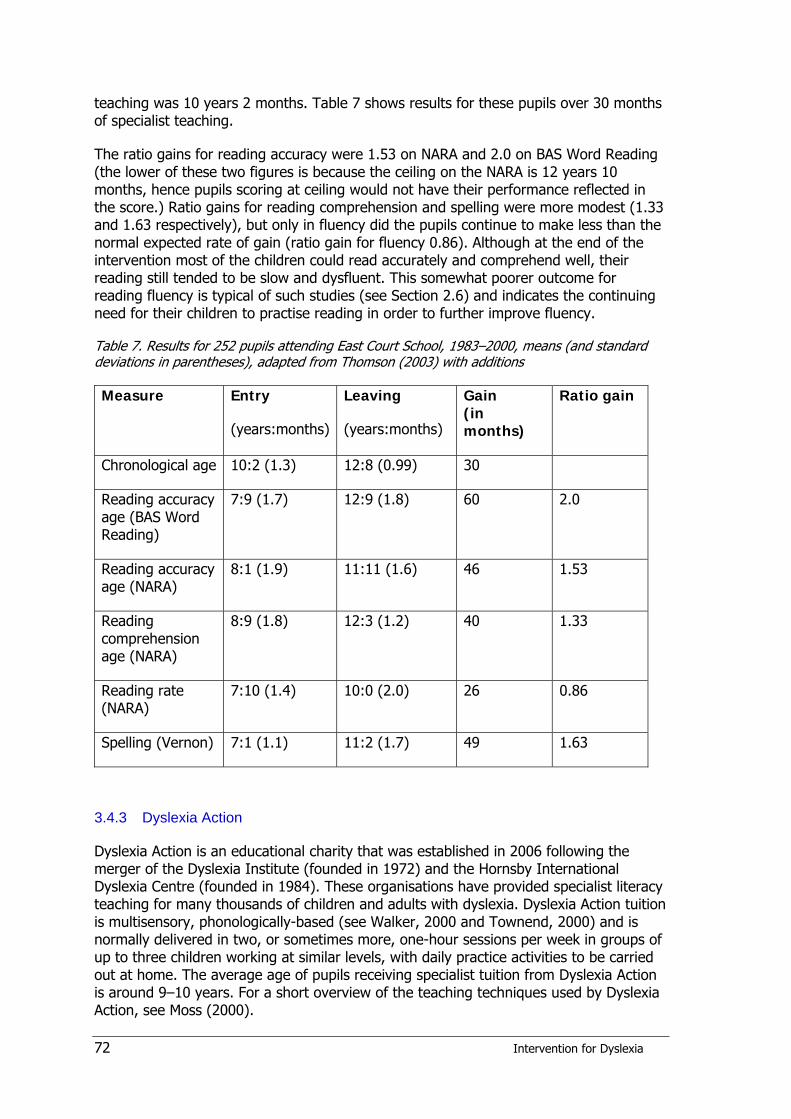
teaching was 10 years 2 months. Table 7 shows results for these pupils over 30 months of specialist teaching.
The ratio gains for reading accuracy were 1.53 on NARA and 2.0 on BAS Word Reading (the lower of these two figures is because the ceiling on the NARA is 12 years 10 months, hence pupils scoring at ceiling would not have their performance reflected in the score.) Ratio gains for reading comprehension and spelling were more modest (1.33 and 1.63 respectively), but only in fluency did the pupils continue to make less than the normal expected rate of gain (ratio gain for fluency 0.86). Although at the end of the intervention most of the children could read accurately and comprehend well, their reading still tended to be slow and dysfluent. This somewhat poorer outcome for reading fluency is typical of such studies (see Section 2.6) and indicates the continuing need for their children to practise reading in order to further improve fluency.
Table 7. Results for 252 pupils attending East Court School, 1983–2000, means (and standard deviations in parentheses), adapted from Thomson (2003) with additions
Measure Entry
(years:months)
Leaving
(years:months)
Gain (in months)
Ratio gain
Chronological age 10:2 (1.3) 12:8 (0.99) 30
Reading accuracy age (BAS Word Reading)
7:9 (1.7) 12:9 (1.8) 60 2.0
Reading accuracy age (NARA)
8:1 (1.9) 11:11 (1.6) 46 1.53
Reading comprehension age (NARA)
8:9 (1.8) 12:3 (1.2) 40 1.33
Reading rate (NARA)
7:10 (1.4) 10:0 (2.0) 26 0.86
Spelling (Vernon) 7:1 (1.1) 11:2 (1.7) 49 1.63
3.4.3 Dyslexia Action
Dyslexia Action is an educational charity that was established in 2006 following the merger of the Dyslexia Institute (founded in 1972) and the Hornsby International Dyslexia Centre (founded in 1984). These organisations have provided specialist literacy teaching for many thousands of children and adults with dyslexia. Dyslexia Action tuition is multisensory, phonologically-based (see Walker, 2000 and Townend, 2000) and is normally delivered in two, or sometimes more, one-hour sessions per week in groups of up to three children working at similar levels, with daily practice activities to be carried out at home. The average age of pupils receiving specialist tuition from Dyslexia Action is around 9–10 years. For a short overview of the teaching techniques used by Dyslexia Action, see Moss (2000).
72 Intervention for Dyslexia

Rack and Walker (1994) presented an analysis of 145 pupils who had been taught by the Dyslexia Institute at its Sheffield centre. Prior to starting specialist literacy teaching at the Dyslexia Institute, these pupils had made an average of a little over 6 months’ progress per calendar year in reading, and a little under over 6 months’ progress per calendar year in spelling (ratio gain approximately 0.5). After about two years of teaching the average rate of progress had increased to just over one year per calendar year in reading and just under one year per calendar year in spelling (ratio gain approximately 1.0).
Rack and Hatcher (2002, see also Rack, 2004) reported on the Dyslexia Institute’s SPELLIT project, in which a national sample of about 240 7-year-old pupils with very weak literacy skills (i.e. in the bottom 10% of their age group in reading and spelling) was allocated randomly to one of three groups: (1) The children received two hours per week of tuition at a Dyslexia Institute centre (maximum of 48 hours’ total tuition); (2) The children received a programme of home activities (15 minutes per day, five times each week for 30 weeks) delivered by parents who had been trained by Dyslexia Institute teachers; (3) The children remained in a ‘waiting control’ with no intervention during the project. The children in groups 1 and 2 received intervention over nine months, during which time the average reading age of group 1 went up from 5 years 9 months to 6 years 8 months (ratio gain 1.2: slightly above ‘normal’ progress). The average reading age of group 2 increased somewhat less: on average from 5 years 10 months to 6 years 7 months (ratio gain 1.0: i.e. exactly ‘normal’ progress). During this period, the children in group 3 fell further behind: their average reading age increased from 5 years 10 months to only 6 years 4 months (ratio gain 0.67, i.e. below ‘normal’ progress).
In the Dyslexia Institute’s SPELLIT project an analysis of the severity of the pupil’s difficulties was also carried out. Those pupils scoring below 85 standard score on reading and who had the lowest scores in phonological skills were classed as ‘severe’ (N=77). Pupils in this category made an average gain of 1.63 standard score points in reading when taught at a Dyslexia Institute centre, but declined by a comparable amount when on the home support programme or in the waiting control group. The effect size of the difference in reading progress between the taught group and the waiting control group was 0.65. The effect size of the difference in reading progress between the taught group and the home support group was 0.56. On the other hand, pupils on the home support programme did make good progress if their difficulties were less severe: on average, 3.4 standard score points gain in reading. The effect size of the difference in reading progress between the less severe pupils in the home support group and that of the less severe pupils in the waiting control group was 0.42.
3.5 Conclusions The studies reviewed in Section 3.3 and summarised in Table 6 demonstrate that, in general, systematic phonologically-based interventions work. Brooks (2007) agrees that such schemes are ‘mostly effective’. Fawcett (2002a), in her review for the DfES of traditional phonologically-based interventions, also concluded that early intervention “…can reduce the severity of impairments, allowing some children to keep pace with their peers and others to move to a milder category of deficit” (p.13). The average ratio gains obtained in the studies presented in the current review were 4.44 for reading accuracy, 4.13 for reading comprehension, and 2.75 for spelling, with medium to large effect sizes (0.56 for reading accuracy, 0.91 for reading comprehension, and 0.59 for spelling). Although only three of these studies focused exclusively on children with
Intervention for Dyslexia 73

dyslexia (and those studies were all very small), all the studies summarised above targeted children with serious reading difficulties, either children in the below average range (standard scores 78–85), who were not yet functionally literate, and/or children in the very low literacy range (standard scores below 78), who were complete non-readers or perhaps semi-literate. In most cases, the participants were on the SEN register at either the School Action or School Action Plus stage. It is highly likely that a substantial proportion of such children were dyslexic.
The results reported from studies in UK specialist schools and teaching centres (Section 3.4) did not produce such impressive results. The ratio gains for the large samples of dyslexic pupils at East Court School were only in the range 0.86–2.0, those studied by Hornsby and Miles (1980) produced ratio gains of 1.9, and in the Dyslexia Institute studies the ratio gains were around 1.0, although effect sizes were moderate. Brooks (2007) has described ratio gains of between 1.4 and 2.0 as having ‘small impact’ and being ‘of modest educational significance’; ratio gains less than 1.4 he classes as being of ‘very small impact’ and ‘of doubtful educational significance’. On this basis all the results reported from studies in UK specialist schools and teaching centres would be regarded as disappointing (or even disregarded altogether), since the largest ratio gain was only 2.0 (except at Moon Hall School – see section 3.3). However, it is well established that dyslexic pupils who do not receive intervention generally decline steadily in literacy relative to their peers. Without help, dyslexic pupils have been found to progress at around only 5 months per calendar year in reading (ratio gain 0.42) and 3 months in spelling (ratio gain 0.25) (Thomson, 1990, 2001; see also Rack and Walker, 1994). Arguably, the achievement of ratio gains of 1.0 or greater represents substantial progress for these individuals. Their progress has been significantly accelerated, although in many cases further efforts will be necessary for them to catch up with their peers. Furthermore, the pupils being served by these interventions are older (average age around 10 years of age) and typically bear the scars of many years of cumulative frustration and failure. Such children can be notoriously ‘hard to teach’ (Rack; 2004; Thomson, 1990; Torgesen, 2005b) and almost invariably require very intensive intervention. Arguably, a greater intensity of intervention than afforded by the two sessions per week typically provided by Dyslexia Action would produce better results. Despite the ratio gain results, real achievements should not be overlooked: at East Court School, for example, the average performance in reading accuracy and comprehension by pupils when leaving the school was well within the normal range. Only spelling and reading fluency – although both much improved – remained below the normal range (which is a common finding in almost all interventions with older, more severe dyslexics). But without this specialist input it is likely that the poor rate of progress that they displayed before the intervention would have continued so that they would otherwise have been considerably further behind in literacy.
Overall, therefore, it is argued that these findings confirm the conclusions drawn at the end of Chapter 2, namely that the literacy skills of children with dyslexia can be substantially improved by use of systematic phonologically-based intervention approaches, and that this often succeeds in bringing these children’s reading accuracy and reading comprehension to within average levels, with reading fluency and spelling (although both much improved) generally remaining somewhat lower. The evidence also indicates that intervention provided in small groups can be just as effective as that delivered to children individually, a conclusion with which Fawcett (2002a) concurred in her review. However, if children also have additional problems, e.g. poor vocabulary skills, then their response to intervention is likely to be less satisfactory, and they will
74 Intervention for Dyslexia
probably require some 1:1 teaching in addition, as demonstrated in a recent study reported by Whiteley, Smith & Connors (2007)
Whiteley et al. (2007) reported on a study of children at risk for dyslexia who attended schools in the north west of England. The children were selected by screening a total of 432 children using the Dyslexia Early Screening Test (DEST) (for details see Section 4.3.3). 90 children (21% of the sample) were found to be at risk and formed the intervention group (which was reduced by participant attrition to 67 children by the end of the study). A control group of children was selected: these were not at risk and were matched for intelligence with the intervention group (control group N=90 initially, reduced to 68 finally). In Year 1 the children in the intervention group received a 20-minute daily lesson delivered over 15 weeks by trained researchers to groups of up to six children, using the programme ‘Launch into Reading Success’ (LIRS) (Ottley & Bennett, 1997). LIRS is a systematic phonological training scheme that focuses on the development of increasingly fine-grained analytical skills, starting with whole words and going down to the phoneme level. The total amount of intervention was 25 hours. After this intervention, 40 of the 67 at-risk children had made ‘noticeable progress’ and the remainder no progress or had declined further. The children who had not benefited from the intervention but remained at risk then received a further 15-week intervention delivered on an individual basis.
At the end of Year 2 all children were re-screened using the Dyslexia Screening Test (DST); 44 of the original at-risk group were classified as not at risk (66%), and four of the control group (6%) were identified as being at risk. The final results showed that 44 (66%) of the at-risk children were able to benefit from the intervention, and although 27 of these achieved this progress in 15 weeks of small group intervention, 16 only progressed after an extended period of 1:1 tuition. This total group of children who benefited from the intervention achieved mean standard scores of 104 for reading and 103 for spelling at the end of the study and could be said to have had their literacy skills ‘normalised’. The at-risk children who had not responded to the interventions (N=23; 34%) had mean standard scores of 85 for reading and 87 for spelling at the end of the study. Poor letter knowledge and poor expressive vocabulary were found to be the most powerful predictors of poor response to intervention. These authors suggest that children who are at risk of dyslexia or reading difficulties and who have poor vocabulary skills require intensive intervention that addresses vocabulary as well as decoding, word recognition and spelling.
Intervention for Dyslexia 75

4 Screening and assessment
4.1 Identifying children with dyslexia In the context of this review, the chief purpose of screening and/or assessment is to identify children who require intervention. However, assessment can also play a role in determining which particular intervention programme would be most appropriate, in shaping the delivery of that programme (e.g. starting points, amount of overlearning incorporated, rate of progression expected) and in evaluating the impact of an intervention on a given child or group of children.
Traditionally, the task of identifying children with dyslexia was exclusively carried out by educational psychologists, primarily using psychological instruments that were ‘closed tests’ (i.e. restricted to use by qualified psychologists). It is not within the scope of this review to provide a full coverage of the ways in which dyslexic children can be identified by educational psychologists. Detailed descriptions of methods and tests are provided elsewhere (e.g. Beech & Singleton, 1997; Reid, 2003; Thomson, 1990; Turner, 1997). Increasingly, however, teachers are taking on the task of identifying dyslexic pupils, partly because the level of demand stimulated by increased awareness of dyslexia cannot be met by the very limited number of educational psychologists available, but also because of the availability of screening tests and assessment instruments that teachers are entitled to use. The chief focus of this chapter will therefore be on screening and assessment methods that are accessible to teachers.
4.1.1 Intelligence and discrepancy
Until relatively recently, the identification of discrepancy between the child’s IQ and their attainments in literacy was a key part of the diagnostic process (see Section 1.2.2 for explanation of the discrepancy criterion). Over the last two decades, however, there has been a growing reaction against the use of IQ in determining dyslexia, largely because poor readers whose reading skills are discrepant from IQ cannot be adequately differentiated from poor readers whose reading skills are not discrepant from IQ (e.g. Fletcher et al., 2002a, 2002b; Joshi, 2003; Lyon, Fletcher & Barnes, 2002; Seigel, 1989; Sternberg & Grigorenko, 2002; Vellutino, Scanlon & Lyon, 2000). Consequently, therefore, psychologists are tending to place less emphasis on discrepancy and more emphasis on cognitive indicators such as verbal memory, rapid naming and phonological awareness. However, there is a counter-argument in favour of retaining a role for discrepancy: Kavale (2005) and Thompson (2003) argue that there is still a relevant place for discrepancy because only measures of discrepancy can document the unexpected nature of the problem. The existence of a discrepancy indicates the presence of underachievement but only the possibility of dyslexia.
4.1.2 Predictors of reading difficulty and dyslexia
Scarborough (1998) carried out a meta-analysis of studies of early predictors of reading difficulties. The results are summarised in Table 8. It can be seen that the strongest predictors include verbal memory, phonological awareness, letter identification, object naming and general language skills. These findings have been replicated in a large number of other studies carried out in several countries (e.g. Boscadin, Muthén, Francis
76 Intervention for Dyslexia

& Baker, 2008; Frost et al., 2005; Puolakanaho et al., 2007; Rayner, Foorman, Perfetti, Pesetsky & Seidenberg, 2001; Savage, Carless & Ferraro, 2007; Schatschneider et al., 2004; Singleton, Thomas & Horne, 2000; Snow, Burns & Griffin, 1998). Catts et al. (2001) and Catts and Hagan (2003) developed a battery of tests for kindergarten children that could predict reading difficulties at 2nd grade level with approximately 90% accuracy. This battery included measures of phonological awareness, rapid automatised naming, sentence imitation and letter identification. Several studies have confirmed that the same predictors can be used to identify children specifically with dyslexia (e.g. Bell, McCallum & Cox, 2003; Elbro, Borstrøm & Petersen, 1998; Olofsson & Neidersøen, 1999).
Other factors, including low socioeconomic status, unsupportive home background, or the child having limited experience of English, will all increase the risk of the child having reading difficulties, but in general these factors are less accurate predictors than the ones listed in Table 8 (Snow, Burns & Griffin, 1998). In the context of dyslexia, which current research knowledge indicates is a genetically-based disorder that impacts mainly on the phonological language processing system (see Vellutino & Fletcher, 2005; Vellutino et al., 2004), it seems sensible to focus on indicators that are congruent with aetiology.
Table 8. Prediction at school entry of reading difficulties 1–3 years later (adapted from Scarborough, 1998)
Predictive factor Number of studies
Correlation coefficient
Verbal memory 11 0.49
Receptive vocabulary 20 0.33
Object naming 5 0.49
Rapid Automatised Naming 14 0.40
Receptive language 9 0.38
Expressive language 11 0.37
Overall language ability 4 0.47
Phonological awareness 27 0.42
Reading readiness 21 0.56
Letter identification 24 0.52
Concepts about print 7 0.49
Accordingly, Torgesen (1998) advocates that for a simple, practical, screening instrument to identify, at school entry, children at risk of developing reading difficulties, teachers can rely mainly on two tests: (1) a test of knowledge of letter names or sounds, and (2) a test of phonological awareness. As children get older and are exposed to instruction in phonological decoding, research indicates that those that experience
Intervention for Dyslexia 77
difficulties in acquiring phonics are likely to develop reading difficulties, and hence a test of phonological decoding (e.g. a non-word or pseudoword decoding test) should become a key part of the screening (Torgesen, 2002). However, it is not always possible to differentiate at school entry between pupils who have dyslexia and pupils who are at risk for reading problems for other reasons, because many children from poor home backgrounds will have poor phonological awareness, and experience difficulties in learning letter/sound correspondences as well as in learning to decode print using phonic decoding strategies. But in cases where the child has good vocabulary knowledge and comes from a home background where there have been ample opportunities to become familiar with books, then difficulties in phonological awareness and in learning letter/sound correspondences become much more reliable indicators of dyslexia. And where a close relative also had early reading problems this further strengthens the case for considering the child to have dyslexia (see Snowling, Gallagher & Frith, 2003). Torgesen (2002) also claims that the number of false negatives can be reduced ‘to virtually zero’ if screening is conducted regularly in 1st, 2nd and 3rd grade.
Torgesen, Foorman and Wagner (2007) have summed up this process thus:
“… we currently understand how to identify students at risk for reading failure with a relatively high degree of accuracy as early as preschool or kindergarten. Reliable tests of phonemic awareness, letter/sound knowledge, or phonemic decoding will show these students to be substantially behind their peers, unless they have already received powerful instructional interventions. … In first grade, reliable tests of phonemic awareness, phonemic decoding, and text reading accuracy and fluency will also identify [dyslexic] students accurately. In later grades, dyslexic students who have not received powerful interventions may still remain relatively impaired in phonemic awareness, and will always perform poorly on tests of phonemic decoding, text reading fluency, and spelling.” (Torgesen, Foorman and Wagner, 2007, p.4)
4.1.3 Response to intervention
Among the findings of the successful intervention study reported by Vellutino et al. (1996) (see Section 2.2.2) was the discovery that children who showed the most accelerated growth in reading as a direct result of intervention approached the level of normal readers and maintained their progress subsequent to the intervention, whereas children who showed the least acceleration in reading development continued to perform worse than the other groups subsequent to the intervention. Hence it is possible to predict outcome (to some degree) by the children’s response to intervention (RTI). Accordingly, Fuchs and Fuchs (1998) called for a rethink of the way in which learning disabilities are identified, based not on the traditional notion of discrepancy between attainment and IQ but, instead, on RTI. In this approach, students are not classified as having learning disabilities unless and until it has been demonstrated empirically that they are not benefiting from the general education curriculum. This technique is similar to that used in developmental medicine, whereby a child’s growth over time is compared to that of a same age group. A child that shows a large discrepancy between his or her height (or weight) and that of a normative sample may be considered a candidate for medical intervention (e.g. growth hormonal therapy). In education, a child that has a discrepancy between the current level of academic performance and that of same-age peers in the same classroom might be considered a candidate for intervention.
78 Intervention for Dyslexia

Unlike traditional learning disabilities assessment that assesses students at one point in time using ability, achievement, and processing measures, the RTI approach repeatedly assesses the student’s progress using curriculum-based measurement (Fuchs & Fuchs, 1997, 1998). Special education is considered only if a child’s performance shows a dual discrepancy in which performance is below the level of classroom peers and the student’s learning rate (growth) is also substantially below that of classroom peers (Gresham, 2002). The intervention itself also functions as the test (Fuchs & Fuchs, 2006), although reading tests can be part of the evaluation (Fuchs, Fuchs et al., 2002). Assessment of reading-related cognitive abilities (including language-based abilities) has no place in mainstream RTI theory and practice (Fuchs, Compton, Fuchs, Bryant & Davis, 2008). However, in the face of strong research evidence (see Section 4.1.2), a few researchers and practitioners working within the RTI framework have recently begun to advocate use of screening batteries that include measures of phonological skills, orthographic knowledge, letter knowledge, vocabulary and syntactic ability (e.g. Davis, Lindo & Compton, 2007).
Vellutino, Scanlon and Jaccard (2003), in a follow-up to their earlier study (Vellutino et al., 1996), confirmed their previous findings and showed that RTI can help determine whether a child’s reading difficulties are caused primarily by basic, neurodevelopmental deficits (e.g. dyslexia) or by experiential factors such as limitations in early reading experience and/or early reading instruction. The children who have the lowest RTI are most likely to be in the former category. Some evidence in support of the RTI approach comes from a study by Speece and Case (2001), in which students identified as non-responsive in an RTI model were found to be more deficient on measures of phonological processing, academic competence, and social skills than those students identified as learning disabled through the traditional discrepancy model diagnostic approach. Note, however, that, unlike many advocates of RTI, Vellutino, Scanlon and Jaccard (2003) do not assert that RTI should be the sole metric on which identification of a neurodevelopmental learning difficulty should be made. Rather, they conclude that the most confident basis for decisions on causality and prognosis can be made using RTI together with assessment of reading-related cognitive skills.
There remains the tricky issue of whether RTI is a legitimate basis for deciding whether or not the child has a learning disability. Does the fact that a child responded adequately to an intervention rule out the possibility that they have a disability? Does adequate RTI inevitably mean that the child’s learning difficulties were caused exclusively by poor instruction? Does the fact that the child did not respond adequately to an intervention mean that he or she has a neurodevelopmental learning difficulty? Advocates of RTI sometimes assert that if child’s learning difficulties have been remediated or normalized, then the issue of whether or not that child had a learning disability in the first place is of little consequence. However, by focusing almost exclusively on reading achievement rather than the component skills involved in reading and associated difficulties, the RTI approach appears to have confounded the category ‘reading difficulties’ with the category ‘specific learning difficulties’ (SpLD). Although children with SpLD typically do have poor reading achievement, they often have other problems as well (such as problems with arithmetic), and even when their reading skills have been normalised, many other problems are likely to remain (see Torgesen, 2005b). In the RTI approach, a low-performing child who shows growth rates similar to that of peers in a low-performing classroom would not be considered a candidate for intervention because the child is regarded as deriving similar educational benefits (although somewhat lower) from that classroom. Torgesen, Foorman and Wagner (2007) also point out that RTI has
Intervention for Dyslexia 79

some validity in cases of students with severe dyslexia because such individuals should respond more slowly to intervention, if at all. However, RTI is less likely to identify as dyslexic a student whose inherent phonological difficulties were mild (because these students should respond well to explicit and intensive instruction).
4.2 Issues in screening
4.2.1 The purpose of screening
The general purpose of screening is the identification of a sub-group from within a larger group or population. The original meaning of the term ‘screening’ was to sieve materials such as coal through a coarse mesh (or ‘screen’) in order to eliminate unwanted matter such as stones or dust. Such a method, although by no means perfect, had the advantage of being speedy and much more economical than having to sort the materials by hand. Screening, therefore, was an acceptable but essentially rough-and-ready approach, and the term has partly (but not entirely) retained this nuance. In its metaphorical sense, the term became popular in medicine, referring first to procedures for identifying in the general population those suffering from a particular disorder (e.g. screening for tubercular lesions by X-ray examination of the lungs) and later to procedures for identifying individuals believed to be at risk of certain disorders (e.g. genetic screening). In the medical context, however, the idea of screening being a rough-and-ready solution to identification steadily gave way to expectations that screening will have fairly high degrees of accuracy and reliability. Periodically there are concerns about accuracy of various medical screening techniques and, in particular, about the rate of false negatives, i.e. cases where screening has not revealed a risk but in which illness subsequently developed. Such concerns reflect not only the awareness that the consequences of false negatives in medical screening are likely to be serious, but also the high cost of medical intervention and the fact that treatment may be harmful if administered to a patient who does not actually require it.
4.2.2 Screening in education
In education, screening has acquired a meaning somewhere between the original use of the term as a rough-and-ready selection process, and the sense now expected in medicine, where reasonably high levels of accuracy are expected. Sometimes, however, commentators seem to be unsure about exactly where, between those two extremes, educational screening properly lies. The consequences of inaccuracy in educational screening might not be as grave as in medical screening, but they are considerably more important than leaving a piece of rock in a bag of coal. If a child who does have a real learning difficulty is shown by a screening procedure to be ‘not at risk’ (i.e. a ‘false negative’) it is unlikely that the child will receive the proper help they need. Moreover, the teachers may quite understandably believe that the child’s poor reading attainment and other problems are the result of lack of effort rather than, say, any constitutional condition. Under these circumstances, the child may well become discouraged and lose motivation and confidence. Hence the child’s problems could become compounded by the outcome of an inaccurate screening process.
In addition to being reasonably accurate, screening instruments are often required to meet certain practical requirements. Satz and Fletcher (1979) have commented: “True screening is rapid and cost effective and does not require professional interpretation.”
80 Intervention for Dyslexia

According to Wolfendale and Bryans (1979), the chief criteria for screening instruments for use in education are:
1. Tests should not be lengthy or elaborate.
2. The collected data should be readily and routinely available within the school.
3. The data should be related to the goals and processes of the school.
4. The teaching methods to be used following identification should be clearly thought out.
It should come as no surprise that there is a trade-off between the two requirements for ease of administration and accuracy of results. Relatively coarse procedures are not, in general, very accurate, and rarely are accurate procedures simple or easy to administer. The principal task confronting anyone attempting to create a screening device for use in education, therefore, is to find a satisfactory compromise between practicality and accuracy: what Singleton (1997a) has referred to as the ‘practicality-accuracy dilemma’.
When educationalists have talked about screening it has not always been clear what type of screening is being referred to. Screening may be broadly divided into two types: classificatory screening and predictive screening. The latter has sometimes been referred to as ‘speculative screening’ (Potton, 1983). In classificatory screening an existing condition or difficulty is identified, while in predictive screening, a condition or difficulty that has yet to become apparent is predicted from its antecedents.
Psychologists and educationists have long recognised the danger of screening results shaping or reinforcing teachers’ expectation of pupils (see Jansky, 1977; Kingslake, 1982; Streiner, 2003). In particular, any screening device will produce a proportion of children who are incorrectly classified. Such misclassification of children may lead to inappropriate action and unrealistic presumptions on the part of the teacher. The danger, of course, is that the true predictive accuracy of a screening device may not properly be known because the results of screening invite action on the part of teachers, and any intervention is likely to have some effect on the phenomena being predicted. Consequently, before any screening device should be accepted for general use, its accuracy should be properly established by means of a prospective validation study, which should be carried out in the absence of intervention. In education, however, rarely have these principles been applied, and all too often screening tests have been championed solely on the twin virtues of faith and face validity.
4.2.3 The accuracy of screening instruments
In theory, screening tests should meet the fundamental requirements of all psychological assessment instruments, in the sense that they should be objective and standardised measures of behaviour, the reliability and validity of which must be assured. They should also be norm-referenced or criterion-referenced in a manner that satisfactorily meets all psychometric criteria. Over and above such preliminaries, however, the paramount question must be: how accurate are they at predicting/ identifying the target group, in this case, children with dyslexia? In statistical terms, screening instruments are binary classification tests: that is, they assign individuals to one or other of two categories, e.g. ‘dyslexic’ or ‘non-dyslexic’ (exceptionally they might also have a third category ‘possibly, or borderline, dyslexic’).
Correlation and discriminant function analysis are the two statistical techniques most frequently used to evaluate screening instruments. The correlation coefficient indicates
Intervention for Dyslexia 81

how well the screening device predicts the criterion across all possible cutting points of the distributions whilst at the same time taking account of the common variance between them. It therefore may be said to represent the predictive validity of the screening instrument, since it covers the predictive efficacy of the test for the whole group, including high and intermediate scorers as well as the low scorers who will typically be of greatest practical interest. It is in the nature of correlational statistics that if the sample size is large then relatively low correlation coefficients will achieve statistical significance. Not all test users may appreciate this, and may believe that a given test is more efficient than it really is.
By contrast, discriminant function analysis must also take into account the number of incorrect categorisations of subjects, and hence gives a measure of predictive accuracy, usually expressed as a percentage. When all the results are reported, this is generally an extremely efficient way to judge the efficacy of a prediction or identification tool. However, what often happens is that only overall identification rates are reported, and these can be extremely high due to the fact that good identification of a large grouping has occurred. This good identification of the large group (e.g. children without dyslexia) may outweigh a poor identification rate of the smaller group (e.g. children with dyslexia) and thus an overall high identification rate can be reported, which is misleading. Proper identification of group membership (e.g. an ‘at risk’ group and a ‘not at risk’ group) should include four reported rates for a proper evaluation to take place, i.e. true positives (those who actually have dyslexia and were identified by the screening test as having dyslexia); true negatives (those who do not have dyslexia and were identified by the screening test as not having dyslexia); false positives (those who do not have dyslexia but were identified by the screening test as having dyslexia); and false negatives (those who do have dyslexia but were identified by the screening test as not having dyslexia). This categorisation is depicted in Figure 4.
Dyslexic?
Yes No
Yes True positive False positive Identified as dyslexic by the screening test? No False negative True negative
Figure 4. Categorisation of cases in order to determine predictive accuracy of a screening test
Jansky (1977) argues cogently that false negative and false positive rates in excess of 25% ought not to be acceptable in any screening instrument. It should be noted, however, that a distinction must be drawn between incidence of false negatives and false positives, and the real percentages of these measures, which must be calculated not as a percentage of the overall sample (which would be misleading) but of the appropriate sub-sample (for discussion see Carran and Scott, 1992; Kingslake, 1982). In other words, of the children who actually have dyslexia, we must ask: what percentage were identified by the screening test as having dyslexia? This statistic is known at the sensitivity of the screening test and may be calculated by the formula TP/(TP+FN) ×100 (where TP = the number of true positive cases, FN = the number of false negative cases). And of the children who do not have dyslexia, we must ask: what percentage was identified by the screening test as not having dyslexia? This statistic is known as the specificity of the screening test and may be calculated by the formula TN/(TN+FP) ×100 (where TN = the number of true negative cases, FP = the number of false positive
82 Intervention for Dyslexia

cases). Glascoe and Byrne (1993) argue that sensitivity rates should be at least 80% and specificity at least 90% to regard the test as satisfactory. In practice, attempts to increase sensitivity cannot be done independently of the level of specificity, and vice versa, so there comes a point at which improvement in one is to the detriment of the other. Grimes and Schultz (2002) point out that in making judgements about screening tests it is sensible to factor in the relative costs (to the individual and to the organisation) of false negatives and false positives. Teachers might argue, for example, that in the context of dyslexia it is important to maximise identification of true cases so that intervention can be provided for all those who need it, even if that means accepting rather large numbers of false positives. In that scenario, the aim would be to maximise sensitivity. On the other hand, budget-holders in education might argue that it is important to minimise false positives to avoid wasting precious resources on providing intervention for children who do not need it. In that scenario, the aim would be to maximise specificity.
For the child who is in the false negative category this is likely to have serious implications for their education. The consequence for a child who is classed as false positive is likely to be less serious – they may only have unnecessarily experienced extra tuition. However, the implications for the teacher and the school may well be different. Both false positives and false negatives can represent an unnecessary resource burden on the education system. In the case of false positives, extra provision may have been made when it was not required, but in the case of false negatives, the effects of failure to recognise a difficulty and the consequent requirement for intensive and more expensive remediation later in schooling may be a greater resource burden in the longer term. False negatives are also more likely to be the individuals who are, in this context, potentially frustrated in their education, and who are likely to experience concomitant loss of confidence and motivation. When designing screening instruments, a view has to be taken as to which type of error, false negatives or false positives, is more important to minimise. It has been argued that a large number of false positives may have adverse consequences for these children (Satz & Fletcher, 1979). However, what is generally regarded as more serious is a large number of false negatives, where children’s real difficulties are overlooked at the time of screening, and may not be properly recognised and addressed until much later in their education.
4.2.4 Teacher training issues
It should be abundantly clear from the discussion in Sections 4.2.2 and 4.2.3 that the issues of practicality, validity and accuracy of tests are vitally important. As well as a wide range of different tests already available to teachers, each year sees the publication of new tests, and consequently the training of specialist dyslexia teachers (and, arguably, of SENCos also) should include instruction in how to judge the usefulness of educational tests, whether used for screening or for other purposes. Such instruction should also encompass an understanding of the limitation of screening, i.e. that all screening tests inevitably generate some classification errors (i.e. false positives and false negatives) and hence an over-reliance on the outcome of screening should be avoided. For example, a child screened at age 6 and found to be negative should not be treated as if dyslexia has been unequivocally ruled out. Such a result should rather be taken as indicating a low probability or low risk of dyslexia, but teachers need to remain vigilant regarding the child’s subsequent development and be prepared to carry out other assessments in due course if the need arises.
Intervention for Dyslexia 83

4.3 Screening tests
4.3.1 Scope
Part of the remit of this review is to consider the range of dyslexia screening tools that are currently available and how these relate to different theoretical models of dyslexia. However, in addressing these issues, it is not proposed to evaluate the practicality, validity or accuracy of different dyslexia screening tests, nor to draw conclusions regarding whether some screening tests are ‘better’ than others. Indeed, it is unlikely that sufficient published evidence exists to carry out such an evaluation properly at the present time. Likewise, no attempt was made in Chapters 2 and 3 to evaluate the different phonologically-based intervention programmes in terms of their relative merits and efficacy. Rather, the approach in Chapters 2 and 3 has been to identify features common to different intervention programmes and teaching techniques for which there is evidence of particular effectiveness for dyslexic children. The same approach to screening and assessment methods will be taken here.
4.3.2 Types of screening test
It is possible to assemble a battery of tests to use in screening for dyslexia, putting together tests of phonological awareness, verbal memory, word reading, pseudoword reading and spelling, for example, but to do so requires a considerable knowledge of dyslexia and of the suitability of various tests that are available. Furthermore, since these will all be attainment tests and not designed specifically for screening, a decision will have to be made regarding cut-off points for risk. A standard score of 85 (i.e. one standard deviation below the mean) is probably the most widely adopted risk threshold, but then the issue arises: On how many of the tests must the child score below standard score 85 to be considered to have dyslexia? All? Most? At least half the tests? It can be appreciated that while interpreting the outcome of such a procedure is probably within the capabilities of most experienced specialist dyslexia teachers, it is unlikely to be within the capabilities of most other teachers.
A solution to this problem has been proposed by Turner (1997), who advocates a two-stage strategic approach to identification: 1) Screening by use of group tests of spelling and non-verbal ability, combined with other information such as results of National Curriculum assessments and differences between literacy levels and capabilities in oral language; 2) Individual assessment of likely candidates indicated by the results of stage 1, using suitable standardised tests of general ability, diagnostic cognitive skills (memory, speed or processing, etc.), and achievement (literacy and numeracy). The average level of underachievement in literacy and numeracy (u), compared with scores predicted by the general ability level, is then calculated. The average difference between the general ability scores and the diagnostic cognitive skills scores is also calculated (d), and the formula (2u + d)/3 is used to obtain what Turner calls the ‘Dyslexia Index’, with the results being expressed in standard deviation units. Turner then suggests the following categorisation:
Less than 0.0: no dyslexia signs
Between 0.0 and 0.4: few dyslexia signs
Between 0.5 and 0.9: mild dyslexia
84 Intervention for Dyslexia

Between 1.0 and 1.4: moderate dyslexia
Between 1.5 and 1.9: severe dyslexia
Above 2.0: very severe dyslexia.
The Dyslexia Index is thus designed to be a systematic approach that can use data from a variety of standardised measures, and the weighting factor deliberately biases it in favour of underachievement as a key determinant of dyslexia (see Section 4.1.1 for a discussion of the discrepancy criterion in the identification of dyslexia). However, it is unclear at the present time how widely Turner’s Dyslexia Index is being used.
Because construction and use of screening batteries is fraught with difficulties, especially for inexperienced teachers, screening tests specifically designed to identify children with dyslexia have become popular in schools in the past ten years or so. In the USA a number of such screening tests are available, of which DIBELS (Dynamic Indicators of Basic Early Literacy Skills; Good & Kaminski, 2002) is a popular one. DIBELS provides measures of phonemic fluency, letter-naming fluency, phonemic segmentation, phonic skills, and oral reading, and has been predictively validated against several well-established measures of reading development (see Elliott, Huai & Roach, 2007). In general, these screening tests meet the requirements specified by Satz and Fletcher (1979) that “True screening is rapid and cost effective and does not require professional interpretation.” They mostly take around 30 minutes or less to administer and are relatively low cost. Administration is straightforward and does not require special training. Interpretation of conventional screening tests (i.e. those that are administered by the teacher) requires the addition of raw scores and following a conversion process to arrive at an index of risk or probability of dyslexia. In the case of computerised screening tests, the teacher does not even have to learn how to administer the test items because the computer delivers them, and the calculation of scores and interpretation is also automatic.
Currently there are four screening tests that are widely used in UK schools for identifying dyslexia, two of which are conventional tests and the other two are computer-based. In addition, there are a further three computer-based assessment batteries that may be called dyslexia profiling systems. Although not designed specifically for screening (i.e. they are not primarily binary classification tests and do not generate an index of risk or probability of dyslexia), these dyslexia profiling systems are nevertheless widely used for screening in schools.
These screening and profiling tests (especially the computer-based tests, which are less demanding of staff time) are sometimes used for general or routine screening, e.g. of a whole class or year group. However at the present time they are more commonly used to assess individual children who are struggling in reading or learning, as a preliminary stage in a process of identifying the nature of the child’s problems so that appropriate intervention can be given.
4.3.3 Conventional dyslexia screening tests
The two screening tests in this category are the Dyslexia Early Screening Test [DEST] (Nicolson and Fawcett, 1996), which is designed for screening children aged 4 years 6 months to 6 years 5 months, and the Dyslexia Screening Test [DST] (Fawcett and Nicolson, 1996), which is designed for screening children aged 6 years 6 months to 16 years 6 months. The latter has recently been split into two forms, a junior form DST-J
Intervention for Dyslexia 85

(age range 6–11) and a secondary form DST-S (age range 11-16). Both tests comprise 12–13 short subtests, some of which were added after the original versions were published; a breakdown is shown in Table 9.
Table 9. Subtests of the Dyslexia Early Screening Test and the Dyslexia Screening Test
Dyslexia Early Screening Test
(age 4½ – 6½ years)
Dyslexia Screening Test (Junior version)
(age 6½– 11 years)
Dyslexia Screening Test (Secondary version)
(age 11 – 16 years)
Rapid Naming Rapid Naming Rapid Naming
Bead Threading Bead Threading Bead Threading
Phonological discrimination One Minute Reading One Minute Reading
Postural stability Postural Stability Postural Stability
Rhyme/Alliteration Phonemic Segmentation Phonemic Segmentation
Forwards digit span Two Minute Spelling Two Minute Spelling
Digit naming Backwards Digit Span Backwards Digit Span
Letter naming Nonsense Passage Reading Nonsense Passage Reading
Sound order One Minute Writing One Minute Writing
Shape copying Verbal Fluency Verbal Fluency
Visual sequential memory* Rhyme* Semantic Fluency
Vocabulary* Vocabulary* Spoonerisms*
Non-verbal Reasoning*
* subtests that were added subsequent to the first version of the test.
The principle behind DEST and DST is that all these subtests, with the exception of those in the general ability category, are potential indicators of dyslexia (‘dyslexia sensitive tests’), and hence the greater the amount of difficulty experienced in these subtests, the higher the risk of dyslexia. DEST and DST do not provide results in conventional standardised score form; instead the raw scores on the dyslexia sensitive tests are converted to scaled scores (which have been derived from z scores9), and these are then summed and divided by the number of tests to arrive at an At Risk Quotient (ARQ), which specifies the degree of risk of dyslexia. Validation of DEST was
9 Z scores (sometimes called ‘standard deviation units’) are a measure of the distance of a given raw score from the mean. A z score of –1.0 is one standard deviation below the mean; on a conventionally standardised test (i.e. one with a mean of 100 and standard deviation of 15) this would be equivalent to a standard score of 85. Correspondingly, a z score of +2.0 would be two standard deviations above the mean (equivalent to SS 130).
86 Intervention for Dyslexia

provided by a study reported in Fawcett, Singleton & Peer (1998), in which an accuracy of 90% in predicting reading difficulties at age 8 was found.
The DEST and DST are both individually administered tests and take 30–45 minutes to administer, and both encompass a wide range of assessment components, which can be loosely divided into five categories, as shown in Table 10.
Table 10. Classification of the DEST and DST subtests into different assessment areas.
Assessment area Subtests
Phonology and language
Rapid Naming; Phonological Discrimination; Rhyme/Alliteration; Sound Order; Phonemic Segmentation; Rhyme; Spoonerisms; Semantic Fluency
Literacy Letter Naming; One Minute Reading; Two Minute Spelling; One Minute Writing; Nonsense Passage Reading
Memory and processing speed
Forwards Digit Span; Backwards Digit Span; Visual Sequential Memory; Digit Naming
Coordination Bead Threading; Shape Copying; Postural Stability
General ability Vocabulary; Non-verbal Reasoning
The subtests in the first three areas (phonology and language; literacy; memory and processing speed) are consistent with the generally accepted view that dyslexia arises from a fundamental difficulty in phonological processing (see Vellutino et al., 2004; Vellutino & Fletcher, 2005), and arguably there would be little controversy about their inclusion in a screening battery of this nature. The subtests in the general ability area are not indicators of dyslexia and, indeed, would not necessarily be expected to be impaired in dyslexia. They provide measures with which the dyslexia indicators can be contrasted and, in effect, introduce an informal discrepancy criterion into the test (see Section 4.1.1 for discussion of discrepancy criterion). However, the subtests in the fourth area (coordination) are rather more controversial. The inclusion of these subtests was as a direct result of the authors’ own research, the findings of which suggested, first, that dyslexics are likely to be impaired in motor skills and coordination (Nicolson and Fawcett, 1990) and subsequently that dyslexic children showed impaired performance on a range of cerebellar tasks (Fawcett, Nicolson and Dean, 1996). These studies revealed that children with dyslexia suffered deficits not only in phonological skill but also in picture naming speed, bead threading and balance. Nicolson and Fawcett (1999) have argued that such deficits are consistent with a cerebellar impairment, and proposed that since the cerebellum is involved in developing ‘language dexterity’ the cerebellar deficit hypothesis provides a causal explanation for dyslexia, subsuming the phonological deficit model (Snowling, 2000; Vellutino et al., 2004) within a broader framework.
Critics of the cerebellar deficit hypothesis (e.g. Ramus, 2003; Ramus, Pidgeon & Frith, 2003) have argued that a wealth of convergent evidence from brain scanning (Price & McCory, 2005), genetic studies (Pennington & Olson, 2005) and cognitive experiments (Vellutino & Fletcher, 2005) all point to deficits not in the cerebellum but in those areas of the cortex concerned with phonological processing and the integration of symbolic
Intervention for Dyslexia 87

visual information with neurological systems subserving verbal memory, auditory processing and phonology. Furthermore, several studies have produced evidence that sensory and motor impairments affect only a subset of dyslexics and cannot by themselves explain the phonological deficit in reading disability (see Ramus, Rosen et al., 2003). White, Milne et al. (2006) found that only about 20% of a sample of dyslexic children had motor deficits, but all except one of these children also had deficits in phonology and the one exception also had visual stress. In a meta-analysis of 17 published studies that compared balance function between dyslexia and control samples, Rochelle and Talcott (2006) concluded that the effects in these studies were highly influenced by the nature of the samples used, and that in studies where there appeared to be evidence suggesting impaired balance function in dyslexia the most probable explanation was that the samples had included participants with symptoms of attention deficit hyperactivity disorder (ADHD) and/or below average IQ. Hence it would appear that motor deficits are associated not with dyslexia per se, but with attentional problems that are sometime co-morbid with dyslexia.
Many teachers who use either the DEST or DST (or both) confess to not using the Postural Stability subtest. In part, this may be because they are aware of the scientific controversy surrounding this test and its theoretical underpinnings, but the main reason given is that they do not feel comfortable administering this test because it involves the child standing upright with feet together and being given a measured push in the back by the teacher, who is required to make a subjective judgement regarding the extent to which balance is upset.
4.3.4 Computer-based screening tests for dyslexia
The advantages of computer-based assessment in education have been explored by Singleton (1991; 1994a, 1994b, 1997b, 2001). Computers provide more precise measurement, especially when complex cognitive skills are being assessed. Tests are administered in an entirely standardised manner for all persons taking the test, which enhances reliability of measurement. Timings and presentation speeds can be controlled precisely. The subjective judgement of the test administrator does not affect the test outcome as it can in conventional tests. Results are available immediately, and when assessing older children and adults, assessment can be largely self-administered: both of these factors help to reduce administrative load and avoid delays. Because the items and instructions are delivered entirely by computer, supervision of the screening can be provided by teaching assistants or personnel other than teachers.
Many computer-based tests are adaptive, conferring considerable efficiencies of time. In an adaptive test the difficulty of the items selected from a test bank is varied in response to the child’s progress on the test. Adaptive computer-based assessment takes about 25% of the time taken by equivalent conventional tests (Olsen, 1990). As well as being time-efficient, adaptive testing is psychologically-efficient because it selects test items that are within the child’s Zone of Proximal Development (ZPD), thus avoiding both the frustration and/or demotivation that can arise in a conventional or non-adaptive test when the child is confronted with many items that are too hard for them, as well as the boredom associated with being required to tackle large numbers of very easy items. Children frequently express a preference for computerised assessment compared with conventional assessment (Horne, 2002; Singleton, 2001). Some computer-based tests can be run on a school network, and consequently can be administered simultaneously to groups of children, thus affording further economies of time. However, when screening younger pupils a greater degree of supervision is usually required.
88 Intervention for Dyslexia

Against the many advantages of computer-based assessment must be set its limitations. Computer technology is not yet sufficiently advanced to permit the use of direct speech input into the computer for assessment purposes because current technology generates error frequencies that would undermine the reliability of the test. Phonological processing and word reading are fundamental areas of deficit in dyslexia, and assessment of either of these skills normally requires an oral response from the child. This technological limitation is therefore a serious one for computer-based tests. It is anticipated that within a few years voice input technology will be adequate for this task, but in the meantime designers of computer tests attempt to circumvent this problem by using multiple-choice items (which changes a word reading or phonological task from production to the somewhat easier task of recognition) or, in the case of reading, using sentence completion or Cloze tasks, which involve comprehension and which consequently are not pure measures of reading accuracy. In view of these problems, some teachers and psychologists may feel that when assessing phonological and word reading skills the conventional approach is still to be preferred; others may feel that the advantages and greater practicality of computer-based screening make the acceptance of these limitations for the time being a price worth paying.
The two computer-based screening tests for dyslexia are the Dyslexia Screener (Turner & Smith, 2004) and Lucid Rapid Dyslexia Screening (Singleton, Horne, Leedale & Thomas, 2003). Both these tests provide automatic scoring in standardised score form and automatic interpretation of results.
The Dyslexia Screener is designed for children aged 5–16 years and comprises the following subtests, which in total take about 30 minutes for the average child to complete:
Non-verbal reasoning Phonics
Spelling
Visual search
Reading
Verbal reasoning.
The decision process used by the Dyslexia Screener is largely based on discrepancy between intelligence (verbal and non-verbal reasoning subtests) and performance on the literacy tests (reading, spelling, phonics) (see Section 4.1.1 for a discussion of the discrepancy criterion in the identification of dyslexia). It incorporates a version of Turner’s Dyslexia Index (see Section 4.3.2), but whereas Turner (1997) advocates using a total of at least 13 tests to calculate the Dyslexia Index (six ability tests, four diagnostic tests, and three achievement tests), the Dyslexia Screener comprises only six. Expected reading and spelling scores are estimated by the program using the combined ability score (derived from verbal and nonverbal reasoning), and based on correlation coefficients typically reported in the psychological literature for the relationships between literacy and general ability. And whereas Turner (1997) includes several memory tests in his analysis, it is notable that, unlike all the other dyslexia screening and profiling tests considered in this Chapter, the Dyslexia Screener does not contain any tests of memory or of phonological processing. Arguably, this deficiency weakens its capability to identify children with dyslexia, particularly if they are of below average intelligence and a discrepancy is not apparent.
Intervention for Dyslexia 89

Lucid Rapid Dyslexia Screening, which takes about 15 minutes, is a shorter test than either the Dyslexia Screener or the conventional tests described in Section 4.3.3. It is designed for children aged 4–15 years, and can be run on a school network. The program comprises the following three subtests, the composition of each differing according to age:
Verbal memory
Phonological awareness
Phonological decoding.
This screening test is based on the phonological deficit theory of dyslexia (Snowling, 2000; Vellutino et al., 2004; Vellutino & Fletcher, 2005). The subtests were validated in a 5-year prospective longitudinal study by Singleton, Thomas and Horne (2000), and in further research by Horne (2002).
4.3.5 Dyslexia Profiling Tests
When educational psychologists assess children for dyslexia they normally use an intelligence test (such as the Wechsler Intelligence Scale for Children – WISC), a battery of cognitive tests of memory, phonology, etc., and various attainments tests (phonological decoding, reading accuracy, reading speed and comprehension, spelling, etc.). The results of these tests can all be put together to create what can be regarded as a profile of the child’s abilities, and this profile is inspected for the characteristic signs of dyslexia in order to make a diagnosis (see Turner, 1997). Computerised dyslexia profiling systems attempt to replicate this process in a way that is easy and accessible to the teacher (Singleton, 2002, 2004). Unlike screening tests, which generate a single conclusion (essentially ‘dyslexic’ or ‘not dyslexic’), dyslexia profiling systems rely on the teacher to inspect the profile of results obtained from a number of subtests and come up with an interpretation. They are thus more challenging for teachers to use than screening tests, and demand a reasonable understanding of the nature of dyslexia. Despite this, dyslexia profiling systems are often used for dyslexia screening, because they also offer a more comprehensive assessment than screening tests (each subtest is independently standardised), can uncover strengths as well as weaknesses, and are viewed as being more helpful for determining teaching and learning strategies.
The two computerised dyslexia profiling systems are Lucid CoPS Cognitive Profiling System (Singleton, Thomas and Leedale, 1996), designed for ages 4–8 years, and Lucid Assessment System for Schools (LASS). The latter is published in two versions: LASS Junior, designed for children aged 8–11 years (Thomas, Singleton & Horne, 2001) and LASS Secondary, designed for children aged 11–15 years (Horne, Singleton & Thomas, 1999). Both these tests can be run on a school network and take about 45 minutes for the average child to complete (although it is recommended that younger children attempt the tests in more than one sitting in order to avoid fatigue). Each test comprises eight subtests, which assess the abilities shown in Table 11.
The theoretical basis of both CoPS and LASS is essentially that of the phonological deficit model. Both tests are accompanied by a Teacher’s Manual that shows example profiles, discusses case studies and suggests intervention strategies. CoPS was validated in a 5-year prospective longitudinal study of 421 children carried out by Singleton, Thomas and Horne (2000), the subtests in the suite being those out of 27 different cognitive tests that proved to be the most useful in prediction of dyslexia (see also Fawcett, Singleton &
90 Intervention for Dyslexia

Peer, 1998). A high overall level of accuracy was obtained in discriminant function analysis, with false negative and false positive rates below 5%. In CoPS, dyslexic profiles are typically those with relatively low scores on the subtests assessing phonological awareness, verbal sequential memory and processing speed, although very young children may also display difficulties on the Phoneme discrimination subtest. Because CoPS provides norms for time as well as accuracy, it is possible to distinguish between children whose overall rate of working is slow and those whose rate of working is slow in certain areas but not others. Strengths (e.g. in visual memory) may be uncovered, which can be used in teaching (see Singleton, 2002).
Table 11. Subtests in Lucid CoPS and LASS
Lucid CoPS (ages 4–8 years)
LASS (ages 7–11 and 11–15 years)
Visual spatial memory Visual spatial memory
Symbolic memory Verbal memory
Processing speed Phonological awareness
Visual sequential memory Phonological decoding
Associative memory Single word reading
Verbal sequential memory Sentence reading
Phonological awareness Spelling
Phoneme discrimination Non-verbal reasoning
Marks and Burden (2005) studied pupils in Devon schools who had been administered a prototype of the CoPS program at age 5 as part of trials being carried out by the British Dyslexia Association in 1996. (The version of CoPS used in this study was superseded by the definitive Windows version of the program that underwent national standardisation with over 2,500 children in 1997.) Sixty-six pupils were followed up, with correlations of 0.4–0.5 being found between CoPS test scores and results of National Curriculum assessments in reading, writing and spelling given at age 7, although the authors acknowledge the “questionable reliability” of National Curriculum assessment results. These findings may be compared with correlations of around 0.6 obtained between CoPS test scores at age 5 and standardised literacy tests at age 9, in the larger study reported by Singleton, Thomas and Horne (2000). It should be pointed out that, in the Devon trials, the children’s CoPS results were available to the teachers and follow-up tuition was encouraged, with training provided for teachers in supporting dyslexic children. This would have been expected to make a difference to the outcomes for the pupils assessed and affect the predictive accuracy of the tests. In the Singleton et al. (2000) study, the children’s CoPS results were not made available to the teachers.
Marks and Burden noted that the CoPS tests of visual spatial memory, symbolic memory, processing speed and phonological awareness also correlated significantly with National Curriculum assessments performance in maths, a finding replicated in a study by Simmons, Singleton and Horne (2008). Marks and Burden suggest that the predictive validity of CoPS tests may derive from a common factor, such as intelligence, although
Intervention for Dyslexia 91

Singleton, Thomas and Horne (2000) found rather low correlations (0.1–0.2) between CoPS tests and standardised tests of verbal and non-verbal intelligence. Although Marks and Burden concluded that CoPS “…had reasonable predictive validity for subsequent attainments in both literacy and numeracy” (p.334), nevertheless they expressed doubts about the validity of the program as a ‘stand-alone’ screening system. In fact, the Teacher’s Manual for the CoPS makes it clear that this is not how the program is intended to be used; rather, the stated aim is to help teachers identify children’s cognitive strengths and weaknesses, so that this information can assist in the identification of dyslexia and other developmental difficulties, and in the creation of appropriate individualised teaching and learning activities.
Nysaeter and Helland (2008) reported on a study of 25 children who had been identified from a family questionnaire as being at risk of dyslexia. These children were assessed at age 6 using a Norwegian language version of CoPS and their literacy skills were assessed two years later, when the children were aged 8. The CoPS subtests assessing phonological awareness, verbal sequential memory and symbolic memory were found to be significant predictors of later difficulties reading and writing.
On LASS, which was validated as a screening test for dyslexia by Horne (2002), dyslexic children tend to show up as having relatively poor literacy skills (relative to non-verbal intelligence) and deficits in phonological awareness, verbal memory and phonological decoding. Strengths may be displayed in visual memory. Children who have poor phonic skills without cognitive deficits can be distinguished from those who have poor phonic skills as well as cognitive deficits, the latter being much more likely to have dyslexia, while the former are more likely to have not received adequate instruction in phonics. Children whose principal difficulty is in spelling (their reading skills being normal) are often found to have poor visual memory (see Singleton, 2004).
4.3.6 Identifying visual stress
As explained in Section 1.4, it is important to distinguish between dyslexia and visual stress, although both impact on reading development. The methods most commonly used for identifying visual stress rely either on the child reporting symptoms of visual stress or on them making a judgment that text is easier to read with a certain colour rather than another. The latter can be done either with a coloured overlay screening test (Whiteley & Smith, 2001; Wilkins et al., 2001), of which there are several types on the market, or by use of the Intuitive Colorimeter (Wilkins, Nimmo-Smith & Jansons, 1992). The Intuitive Colorimeter is an apparatus for determining the optimum colour for comfortable reading, and is used by some orthoptists and in a few NHS eye clinics. Unfortunately, all these approaches carry the disadvantage of subjectivity, which, in turn, can result in unreliability of the measures. Children who suffer from the condition do not necessarily know they have a problem, and if they do report symptoms these may not always be accurate (Northway, 2003).
Wilkins et al. (2001) found that, of a normal sample of children aged 8–11 years, 60% chose a coloured overlay in a screening test. Using a slightly wider age range (5–11 years) Jeanes et al. (1997) found that 53% of children chose an overlay. In most studies, however, after two to eight months, voluntary sustained use is generally found to have dropped to between 20% and 30%. In this situation, it is hard for the teacher to determine whether the child has just forgotten to use the overlay, or the novelty has worn off, or the child is simply being lazy, or simply that they really did not need the overlay in the first place.
92 Intervention for Dyslexia
Recently Singleton and Henderson (2007a, 2007b) developed a reliable and objective method of screening for visual stress based on visual search in visually stressful and visually unstressful conditions, which they have called ViSS (Visual Stress Screener). Using ViSS to screen unselected samples of children aged 7–17 years, it was found that children classified as having high susceptibility to visual stress had significantly larger increases in reading rate with a coloured overlay compared with those classified by ViSS as having low susceptibility to visual stress, thus establishing the validity of the screener. Individuals classified by ViSS as having high susceptibility to visual stress also reported more symptoms, although reports of symptoms were less reliable amongst younger children. The objectivity of ViSS not only makes it more accurate than other methods currently available, but Singleton and Henderson (2007b) also showed that the program is equally capable of identifying susceptibility to visual stress in children with dyslexia, because it is not significantly influenced by reading ability. Because of the increased prevalence of visual stress amongst people with dyslexia, teachers need to be especially vigilant for the signs of visual stress in dyslexic pupils.
4.4 Conclusions There is a considerable weight of evidence that screening and early assessment can identify children at risk of dyslexia (see Section 4.1.2). Such assessment tools are now readily available to teachers, can be used from school entry onwards, and are mostly easy to use (see Section 4.3). Within any group of at-risk children identified in this way, there are likely to be some false positives whose difficulties are not caused by constitutional deficits in neurological systems subserving phonological processing (i.e. dyslexia) but by other factors, such as preschool disadvantage (see Section 4.1.2). It is sometimes possible to identify these false positives using other information, such as general ability. However, implementation of a systematic phonological intervention programme will be likely to benefit both types of child.
The majority of children will respond positively to such intervention and will have literacy skills in, or approaching, the normal range by the end of the intervention (see Section 2.2 and Chapter 3). Inevitably, however, there will be a proportion of at-risk children who fail to respond to intervention and who will therefore require further help (see Section 2.5). Children with the lowest scores on tests of phonological awareness, vocabulary knowledge and letter knowledge are most likely to be the ones who show poor response to intervention (see Section 3.5). In particular, they may need intensive help with vocabulary skills. At each stage of the educational process, the children’s abilities should be regularly re-assessed, not only to ascertain general progress in literacy but also specifically to check whether phonic principles have been fully assimilated.
In addition, a range of approaches can be used by teachers in order to identify visual stress, which can impede the development of reading fluency and comprehension (see Section 1.4.2). Current evidence does not support a biological link between visual stress and dyslexia, but visual stress is more common in dyslexic children and hence it is important to screen for this condition as well.
The scheme outlined above is predicated on screening or early assessment for dyslexia, using a range of cognitive and early literacy measures that are known to be good predictors. This approach is consistent with recommendations in the SEN Code of Practice (DfES, 2001):
Intervention for Dyslexia 93

“The importance of early identification, assessment and provision for any child who may have special educational needs cannot be over-emphasised. The earlier action is taken, the more responsive the child is likely to be, and the more readily can intervention be made without undue disruption to the organisation of the school. Assessment should not be regarded as a single event but rather as a continuous process.”
(DFES, 2001, Paragraph 5:11)
The SEN Code of Practice also advocates the use of standardised screening or assessment tools, as well as a range of other sources of information, in order to ascertain the extent and nature of a child’s special educational needs (DFES, 2001, Paragraph 5:13).
Dyslexia screening tools use a range of subtests of different cognitive abilities that underpin literacy development and from which information is combined to yield a conclusion that is of acceptable reliability and accuracy, although teachers need to be mindful of the limitations of such tests. The alternative technique of screening to identify children who are behind in reading development and using that as a basis for determining which pupils should receive intervention is likely to be far less satisfactory if, in fact, the children have dyslexia. While it is accepted that children who are falling behind in reading should be noticed by teachers, and that appropriate action taken in such cases, nevertheless many dyslexic children slip through the net. Although the correlation between early reading ability and later reading ability is relatively high (usually in the region 0.6–0.7), poor early reading ability per se is not by itself necessarily a very good predictor of later literacy difficulties in individual cases (Fletcher et al., 2002b; Francis, 1992; Lerkkanen, Rasku-Puttonen, Aunola & Nurmi, 2004; Paris, 2005; Singleton, Thomas & Horne, 2000). There are several reasons for this. First, young children exhibit individual fluctuations in reading performance. Second, reading development is not a smooth, continuous process: children follow different paths or trajectories in learning to read. Trajectories of reading development are determined by many factors, including cognitive strengths and weaknesses, vocabulary knowledge, teaching approaches and reading materials employed, differential difficulty of subskills that have to be mastered (letter identification, whole-word recognition, phonics, etc.), and subskill interdependency (e.g. phoneme identification precedes blending and segmenting ability) (Paris, 2005). Children with reading difficulties tend to show particularly heterogenous trajectories of development (Lipka, Lesaux & Siegel, 2006). Consequently, it is possible for a child to have dyslexia but nevertheless to make sufficient early progress in word recognition to escape the teacher’s notice, and even to perform within age-expectations on a standardised test of word reading. The use of investigative measures which are more sensitive to dyslexia, such as formal or informal tests of phonic decoding skills, verbal memory and phonological awareness – which are key features of dyslexia screening and assessment batteries – can avoid such children slipping through the net.
94 Intervention for Dyslexia
5 Reading Recovery
5.1 Introduction
5.1.1 Scope
The chief purpose of this chapter is to address the question: ‘What evidence is there that Reading Recovery is, or is likely to be, an appropriate method of intervention for children with dyslexia?’ More specifically, the remit of the review calls for a summary of published evidence on Reading Recovery delivered as part of Every Child a Reader (ECaR), and of whatever published evidence there may be on the impact of Reading Recovery on children with dyslexia. Since literature searches failed to discover any studies of Reading Recovery which had been conducted with children identified as having dyslexia, the question of the effectiveness of Reading Recovery for children with dyslexia therefore has to be addressed by other means (see Section 5.6). The principal emphasis in the later parts of this chapter, therefore, is on reviewing evidence of the immediate and longer-term impact of Reading Recovery in England. That review covers both the Reading Recovery-based initiative Every Child a Reader (ECaR), which began in 2005 and is still being rolled out to all Reading Recovery providers here, and Reading Recovery as it was before ECaR and in some places still is. However, in both guises Reading Recovery here may be seen as a development of Reading Recovery internationally, and hence it first necessary to discuss the rationale and pedagogy of Reading Recovery, and to review rigorous evaluations.
5.1.2 What is Reading Recovery?
Reading Recovery is an early intervention programme for children who have made a poor start in learning to read and who are therefore at risk of literacy difficulties. The programme was first developed by the late Marie Clay in New Zealand in the 1970s, and has been implemented in that country for over 30 years. Anand and Bennie (2005) reported that, in 2003, 67% of all state primary schools in New Zealand were using Reading Recovery. The programme has also been widely adopted in several other countries, most notably Australia – where it was introduced in 1984 and is most extensively used in Victoria and New South Wales – and the United States, where it was introduced in the same year. Lyons & Beaver (1995) reported that by 1994 a total of 47 US States had implemented the programme to some degree. Reading Recovery has been less extensively adopted in the UK and Ireland.
The Reading Recovery programme comprises 12–20 weeks of intensive, one-to-one, daily tuition, normally targeted at the 20% of children who are the lowest in literacy attainment, delivered by teachers who have been trained to deliver the programme. Formerly implemented after one year of schooling (i.e. in Year 2), in Britain it is now implemented in Year 1. The identification of the at-risk children is usually by teacher selection (e.g. the poorest 20% of readers in the class) together with use of the Observation Survey of Early Literacy Achievement (2nd edition) (Clay, 2002; 1st edition was Clay, 1993a). More recently, the British Ability Scales (2nd edition) Word Reading Test (Elliott et al., 1996) is also used. The Observation Survey, which is non-standardised, comprises criterion assessment of text reading, letter identification, writing to dictation, knowledge of concepts about print, sight words and writing vocabulary. The
Intervention for Dyslexia 95
BAS Word Reading Test (Early Years version) is standardised for the age-range 2:6–7:11.
In each daily session lasting 30 minutes, the Reading Recovery teacher engages the child in a number of set activities around texts selected according to the child’s reading level. These activities include re-reading one or more previously encountered texts, identifying letters and words, writing a story, hearing and writing sounds in words, reassembling a story, and reading a new text. When children have reached the point that they can read texts which the average child in their class can read, and can write several sentences, they are judged to have ‘achieved accelerated progress’ (as recent Reading Recovery parlance has it) and are ‘successfully discontinued’ from the programme (Clay, 1993b). Children who do not achieve this target are usually referred for special education.
5.1.3 Rationale and pegagogy
Reading Recovery may be seen as a pedagogical sibling to the ‘whole-language’ theory of reading, which maintains that reading skills arise naturally out of frequent encounters with interesting and absorbing reading materials (Goodman, 1986; Smith, 1978). According to this theory, the capacity of readers to rely on syntactic and semantic cues in reading is such that only minimal graphophonic cues are necessary, because words can usually be predicted using syntactic and semantic information (Goodman, 1986). Hence, it is argued that children do not need to be taught explicitly about the alphabetic code or the relationships between letters and sounds provided they are immersed in a print-rich environment in which the emphasis is on context and meaning (Smith & Elley, 1994). Arguably, this approach makes the logical error of assuming that cognitive processes adopted by older, skilled readers constitute a satisfactory basis for teaching beginning readers. Although Clay did not use the term ‘whole-language’ to describe her approach, and certainly did not imply that children do not need to be taught how to read, the similarities between ‘whole-language’ theory and her philosophy of Reading Recovery are apparent: “In efficient rapid word perception, the reader relies mostly on the sentence and its meaning and some selected features of the forms of words. Awareness of the sentence context (and often the general context of the text as a whole) and a glance at the word enables the reader to respond instantly” (Clay, 1991, p. 8).10 Clay (1979) described how “…the High Progress Reader even at six years...reads with attention focused on the meaning. What he thinks the text will say is checked by looking for letter-sound associations” (p. 2). She reiterated these beliefs in 1993: “The child checks language predictions by looking at some letters ... can hear the sounds in a word he speaks (i.e., predicts) and checks whether the expected letters are there” (Clay, 1993b, p. 41). Accordingly, in Reading Recovery lessons, children read real story books aloud to the teacher and, while reading, are encouraged to use context as the principal method of identifying words, to monitor for meaningfulness and make corrections only when necessary to make sense, and to use letter-sound clues sparingly in order to confirm context-based predictions (Clay, 1991; 1993b).
10 For a detailed review of Clay’s philosophy see Groff (2004).
96 Intervention for Dyslexia
5.1.4 Reading Recovery and the teaching of early reading
In similar fashion to Goodman’s (1986) model in which reading is based on the simultaneous integration of syntactic, semantic and graphophonic ‘cues’, Clay proposed that, in order to read texts, readers have to integrate information from separate sources, which she identified as semantic, syntactic, graphophonic and visual (Clay and Cazden, 1990). This approach formed the basis of the ‘searchlights’ model of reading originally adopted by the (then) National Literacy Strategy. However, in the revisions to its successor, the Primary National Strategy, that resulted from the Rose review of the teaching of early reading (Rose, 2006) the ‘searchlights’ model was superseded by the ‘simple’ view of reading, which is better supported by current research evidence. In the ‘simple’ view of reading a theoretical and pedagogical distinction is drawn between word recognition and reading comprehension. In word recognition the reader’s phonological knowledge (i.e. their ability to use graphophonic cues) plays a crucial role, whereas the reader’s semantic and syntactic knowledge is more important for reading comprehension. The ‘simple’ view of reading is the theoretical framework that has been adopted by the National Strategies to underpin Wave 1 ‘Quality First’ teaching, in accordance with the recommendation of the Rose review that “The knowledge, skills and understanding that constitute high quality phonic work should be taught as the prime approach in learning to decode (to read) and encode (to write/spell) print.” (Rose, 2006, p.70).
5.1.5 Pressures to increase phonics in Reading Recovery
The original and still predominant philosophy underpinning Reading Recovery is akin to ‘whole language’, the theory that reading (and writing) skills arise naturally out of frequent encounters with interesting and absorbing reading materials. According to this view in its pure form, children do not need to be taught explicitly about the alphabetic code or the relationships between letters and sounds, provided they are immersed in a print-rich environment in which the emphasis is on meaning.
This view has been increasingly contested, e.g. by Pressley (1998), who stated that ‘…the scientific evidence is simply overwhelming that letter-sound cues are more important in recognizing words than either semantic or syntactic cues’ (p.16). Although many children do learn to read by a whole-language method, this is not the technique that the great majority of children actually use in learning to read (see Tunmer & Chapman, 2002). Jeynes and Littell (2000) carried out a meta-analysis of 14 studies of whole-language instruction versus other methods, and did not find evidence that whole-language instruction was beneficial. The National Reading Panel (2000; see also Ehri et al., 2001) in the USA concluded on the basis of meta-analyses of different studies that systematic phonics instruction enabled children to make better progress in reading and spelling than unsystematic or no phonics instruction. Taking a somewhat stricter line on which studies to include (only the 12 RCTs from the entire English-speaking world in which children rather than whole classes had been allocated to conditions), Torgerson et al. (2006) in Britain concluded that systematic phonics instruction within a broad and rich literacy curriculum enabled children to make better progress in reading accuracy, that is, word identification, (emphases added) than unsystematic or no phonics instruction. (They also concluded, however, that there was not enough evidence to decide whether systematic phonics benefited reading comprehension or spelling, or to decide the relative merits of analytic versus synthetic phonics.)
Intervention for Dyslexia 97

The culmination of this pendulum swing in England was the Rose Review (Rose, 2006) which recommended systematic phonics within a broad and rich literacy curriculum as the prime method for teaching children word identification (though there are already attempts to reverse the trend, e.g. Goouch and Lambirth, 2007).
In due course the accumulating evidence on phonics affected Reading Recovery. Three studies which seem to have exercised particular influence on it are:
(1) Iversen and Tunmer (1993) in Rhode Island, a quasi-experimental study which compared what was then standard Reading Recovery with a version with added phonics, and found an advantage for the enhanced programme;
(2) Hatcher et al. (1994) in Cumbria, an RCT which compared a Reading-only programme which was essentially Reading Recovery under another name with a Reading-with-Phonology programme, and also found an advantage for the version with added phonics;
(3) Center, Freeman & Robertson (2001) in Australia, a comparison of the outcomes for children who had participated in Reading Recovery where the overall approach to teaching literacy adopted in their classrooms was either code-oriented (i.e. phonics-based) or meaning-oriented (i.e. whole-language). At the time of data collection, the average age of the children in the study was 7 years 3 months. Overall, the reading proficiency of children (whether receiving Reading Recovery or not) in code-oriented classrooms was found to be significantly better than in meaning-oriented classrooms (effect sizes 0.71–1.04). Children in code-oriented classrooms who were successfully discontinued from the Reading Recovery programme did so in less time than their counterparts in meaning-oriented classrooms, a similar finding to that observed by Iversen and Tunmer (1993). It was found that, although Reading Recovery pupils in code-oriented classrooms outperformed Reading Recovery pupils in meaning-oriented classrooms (8 months’ advantage after 2 years of schooling), the Reading Recovery children nevertheless failed to reach the literacy level of their peers who were not receiving Reading Recovery, irrespective of the classroom approach. Center et al. (2001) concluded that these results contradicted Clay’s (1993b) assertion that Reading Recovery brings the hardest-to-teach students to be full participants in their classroom programmes (since most of them remained well below the average level for their classrooms). They also concluded that Reading Recovery combined with a code-oriented classroom approach, although somewhat more successful than Reading Recovery combined with a meaning-oriented classroom approach, was still insufficient to remediate the hardest-to-teach students, who would require more intensive teaching of phonics.
5.1.6 The place of phonics currently in Reading Recovery in the UK
Brooks (2007, p.74) noted that ‘between the London and Surrey and ECaR studies’ (see below) ‘Reading Recovery changed considerably, to reflect international research, and now includes a large amount of phonological awareness and phonics’. This is reflected in activities at the letter, word and sub-word level incorporated into the revised teaching procedures published by Clay in 2005:
“The child should learn about constructing words and taking words apart in many places in his lessons. The aim of this work with words in isolation is to have him know about how words work and be able to use this awareness while reading texts and while
98 Intervention for Dyslexia

writing. To be able to work on words in isolation is not enough; the reader and writer must also be able to handle those words flexibly in continuous texts.” (Clay, 2005, p. 138)
“When the child’s series of lessons end and he is reading a text of appropriate level he should be able to solve a multi-syllabic word (one that is new, not yet familiar, or unexpected) within continuous text without slowing up too much, and by working flexibly with word parts and clusters of letters from an awareness of how words work.” (Clay, 2005, p.156)
However, it should be noted that neither Reading Recovery delivered as part of ECaR nor Reading Recovery in the UK more generally provides systematic phonics instruction in the sense intended by Rose (2006) and the other authors cited above, namely a programme with a planned sequence and 10 or more minutes of teaching a day. According to ECaR (2008, p.34), in a section entitled ‘Every Child a Reader and effective phonics teaching’:
“High quality phonic work is a fundamental part of Reading Recovery, with teachers being trained to use close observation and assessment of what an individual child already knows in order to carefully tailor how best to extend their phonological skills and phonic knowledge by the fastest possible route. Every lesson with every child includes phonic teaching. Prior to reading the teacher will, for example, help the child think about the sounds in a new word and locate the appropriate letters and words in the text. During reading, teachers will use masking cards to help the child to focus on details within a new word, drawing the child’s eye across the word from left to right. After successful reading, teachers will select an appropriate word to model construction using magnetic letters. Support given for writing helps children to use phonics to spell and write the words they need for their own sentence or paragraph.”
From that description, from mentions on subsequent pages of ECaR (2008) of coordination of the programme with the DCSF framework Letters and Sounds, and from lesson observations provided by Reading Recovery personnel (Gross, 2009, personal communication) it appears that phonics is now one of the regular components of teaching sessions, but certainly not a systematic one and not the main focus. Detailed evidence is now needed on how this plays out in practice, and how it affects children’s progress. However, despite these reported changes to the Reading Recovery programme, a fundamental conflict still remains between its approach and the revised National Literacy Strategy, in which systematic teaching of phonics is now a central feature (see Section 5.1.4).
Teaching of reading based on the ‘simple’ view of reading has been a legal requirement since September 2007, and from April 2009 the Communication, Language and Literacy Development programme has been rolled out to all local authorities. As the teaching of phonics continues to be strengthened, so there continues to be a need for Wave 2 interventions based on guidance around pace and progression in phonics and interventions such as the Early Literacy Support programme (thoroughly re-developed following publication of the 2006 Early Reading Review), and when necessary a wave 3 intervention. Where children are falling behind who have nonetheless had high quality experiences in both Waves 1 and 2, it follows from the principles in the SEN Code of Practice that alternative approaches should be tried and personalised to the specific needs of the child. Reading Recovery is one of those possible interventions but there are others, as outlined in the review by Brooks (2007) and documented in the Every Child a
Intervention for Dyslexia 99

Reader guidance (DCSF, 2008). Evaluations of some of these other interventions are included in Chapter 3 of this report.
5.2 Evaluations of Reading Recovery in the rest of the world
5.2.1 Large-scale international evaluations and reviews
Reading Recovery programmes have been evaluated according to various metrics, the most commonly adopted being the number of pupils who are ‘successfully discontinued’ from the programme – i.e. those who reached the criterion level of improvement. Another metric less commonly employed is the extent to which Reading Recovery pupils are able to keep pace in literacy development with other pupils after the programme has finished. A considerable number of evaluations of Reading Recovery have been carried out in the last 25 years, but these have often been small-scale, not independent, and rarely reported first-hand in peer-reviewed journals. However, literature searches uncovered several larger-scale evaluations carried out in New Zealand, the US and Australia, which show that the percentage of Reading Recovery pupils who have completed a full programme who are successfully discontinued is about 70%–80%, except for New Zealand and the State of Victoria in Australia, where the percentage is somewhat higher: 84%–90% (Anand & Bennie, 2004, 2005; Cosgrave, Bennie & Kerslake, 2002; Gomez-Bellenge, Rodgers and Schulzt, 2005; Kerslake, 1999, 2000, 2001; Lyons, 2003; Lyons & Beaver, 1995; McDowall, Boyd and Hodgen, 2005; Shanahan & Barr; 1995). Between 8% and 20% are referred for additional services. Note that ‘success’ in this context does not necessarily mean that the child will be reading within the normal range nationally, only that the Reading Recovery teacher has judged the child’s book reading ability to be within the average range of the class the child belongs to.
Reviews of Reading Recovery evaluations in the early and mid-1990s were mostly positive, concluding that, although costly, Reading Recovery generally resulted in significant gains in reading (e.g. D’Agostino & Murphy, 2004), although it was noted that it was less effective in maintaining those gains and it would be an unwise strategy to shift all resources for remediation into Reading Recovery because some students would be likely to require additional or continuing support (Wasik & Slavin, 1993; Shanahan & Barr, 1995). Reviews also commented that the effectiveness of Reading Recovery would be likely to be increased if it incorporated techniques that had been shown in research to promote early reading skills, such as explicit instruction in phonics (see also Section 5.1.5). During the 1990s, however, increasing concerns began to emerge in the US and elsewhere in the world regarding Reading Recovery (see Hiebert, 1994; Shanahan & Barr, 1995; Grossen, Coulter & Ruggles, 1997; Elbaum, Vaughn, Hughes & Moody, 2000). Many of the issues concerning evaluation of the effectiveness of Reading Recovery have been summarised and discussed by Reynolds and Wheldall (2007), who concluded:
“RR has established a reputation as being a remarkably successful intervention … research, however, indicates that it has not delivered all that it promised to deliver: long-term change for students and a significant reduction in demand for special education services in later years. Evidence indicates that RR is beneficial for those students who are discontinued but that it is less beneficial for students who have incomplete programmes, are withdrawn, or are referred to special education. In fact, the
100 Intervention for Dyslexia
success of the programme appears to be inversely related to the severity of the reading problem.” (Reynolds and Wheldall, 2007, pp.218-9).
In 2002, 31 eminent reading researchers in the USA wrote an open letter to members of the US Congress detailing the following concerns regarding the adoption of Reading Recovery in US schools (Baker et al., 2002): 1) Lack of good evidence for the success of Reading Recovery with its targeted population, i.e. the lowest performing pupils. The letter highlighted the exclusion of 25%–40% of the poorest performing students from data analyses carried out in non-independent evaluations; 2) Reading Recovery was not a cost-effective solution because of the high cost of training and the insistence on one-to-one tuition when, it was argued, small group tuition has been shown to be just as effective; 3) The excessive costs of Reading Recovery could make it more difficult for schools to provide help for all children who were in need, particularly those children older than the range targeted by Reading Recovery; 4) Reading Recovery efficacy studies did not use standard assessment measures, but instead used their own non-standard measures, which were also used to determine which students were to be included in the sample, thereby inflating outcomes; 5) Reading Recovery had been resistant to integrating the findings of independent, scientific research, particularly concerning the importance of explicit teaching of phonics; although Reading Recovery did include some phonics within its methods, this instruction was not regarded by the authors of this letter as being sufficiently explicit.
It should be emphasised that these concerns applied to Reading Recovery programmes in the USA at that time. They are mentioned here not only because of the unusual prominence of this particular letter to Congress, but also because Reading Recovery here is rooted in the approach as delivered internationally, and it is necessary to consider whether these criticisms also apply to Reading Recovery as currently provided in England (both within ECaR and more generally).
The analysis of studies on Reading Recovery in the rest of this chapter will follow a similar sequence to that adopted for phonologically-based studies earlier in this report, that is, the strongest studies (randomised controlled trials and quasi-experimental studies) from the rest of the world are analysed first, followed by studies conducted in Britain. The reason for this separation is, again, that no relevant RCTs have been conducted in Britain. (Within the study carried out in London and Surrey in the 1990s there was an RCT, but it compared children receiving and not receiving the alternative intervention, Phonological Training, and did not involve those receiving Reading Recovery.)
5.2.2 RCT and quasi-experimental studies of Reading Recovery
A review by the What Works Clearinghouse (2007a) in the USA identified 78 studies on Reading Recovery, of which just four were RCTs which met their evidence standards in full, and one (the Iversen and Tunmer, 1993 study referred to above) was a quasi-experimental study which met the evidence standards with reservations. The Hatcher et al. (1994) study is not listed among the studies that did not meet the evidence standards, presumably because its Reading-only condition was not explicitly called Reading Recovery. All five included studies were conducted in the USA, at dates between the mid 1980s and the start of this decade (thus three of the studies were conducted before the addition of phonics to the programme).
Intervention for Dyslexia 101

The WWC review (What Works Clearinghouse, 2007a, p.3, lightly edited) summarises the five studies as follows:
1) Baenen et al. (1997) was a randomized controlled trial that focused on first-grade students from Wake County, North Carolina. The WWC review focuses on the outcomes of students who qualified for and were randomly assigned to either the Reading Recovery intervention or a comparison group. From an original sample size of 168, outcomes were assessed at three time points: end of first grade (N=147), end of second grade (N=147), and end of third grade (N=127). [N.B. Only the end of first grade results are included in the summary below.]
2) Pinnell, DeFord and Lyons (1988) was a randomized controlled trial. The study
sample was first-grade students distributed across 14 schools in Columbus, Ohio. Two groups were formed by randomly assigning students to an intervention group, which received Reading Recovery in addition to their regular classroom instruction (N=38), or to a control group, which received an alternative compensatory program (N=53). This comparison met WWC evidence standards.
3) Pinnell et al. (1994) was a randomized controlled trial that randomly assigned 10
low-achieving first-grade students in each of 10 Ohio schools. The WWC review focuses only on the eight schools that successfully implemented randomization for the intervention (N=31) and comparison (N=48) conditions.
4) Schwartz (2005) was a randomized controlled trial of first-grade students from 14
states. The WWC focused on the 37 students across several schools who were randomly assigned to receive the intervention during the first half of the year. The other 37 students, who were randomly assigned to receive the intervention during the second half of the year, served as the comparison group during the first half of the year. The groups were compared at mid-year, before the comparison group had begun receiving Reading Recovery.
5) Iversen and Tunmer (1993) was a quasi-experimental design study that included
first-grade students from 30 school districts in Rhode Island. The study compared outcomes for students participating in Reading Recovery (N=32) with students in a comparison group who did not receive Reading Recovery (N=32), who were matched on the basis of pre-test scores. The comparison group received standard small-group, out-of-class support services. [N.B. The third condition in this study, with added phonics as mentioned above, is not included in this description.]
The key findings among the wealth of detail in the WWC review are the following. The Pinnell, DeFord and Lyons (1988), Schwartz (2005) and Iversen and Tunmer (1993) studies between them reported five measures of word recognition or decoding. From these, the WWC analysts calculated an overall effect size of 1.00, signalling a large impact despite some individually non-significant results. The Pinnell, DeFord and Lyons (1988) and Schwartz (2005) studies between them reported three measures of comprehension. The overall effect size was 0.35, small but still significant. All five studies between them reported 10 measures of ‘general reading achievement’ (this covered variously dictation and writing vocabulary from the Clay Observation Survey, and two US reading tests). The overall effect size was 0.92, again large. (It should be noted that these effect sizes were calculated as simple averages of the individual effect sizes, and were not weighted to take account of sample sizes, as would be the practice
102 Intervention for Dyslexia

in a meta-analysis. However, the averages do take account of non-significant and null findings from individual studies.)
It should also be noted that, in the majority of cases, the measures yielding positive results were drawn from Clay’s (1993a) Observation Survey of Early Literacy Achievement, and only in a few cases were results from independent standardised tests. Three of the five studies examined the effects of Reading Recovery on letter knowledge, but only Iversen and Tunmer (1993) found an unequivocally significant positive effect, which was on the Letter Identification subtest of the Observation Survey. Three of the studies examined the effects of Reading Recovery on phonics, with Pinnell, DeFord and Lyons (1988), Iversen and Tunmer (1993) and Schwartz (2005) all reporting significant positive effects on the Word Recognition subtest of the Observation Survey. Iversen and Tunmer (1993) also found significant positive effects on two independent measures: the Dolch Word Recognition Test, and a pseudoword decoding task. In addition, Iversen and Tunmer (1993) reported significant positive effects on two phonemic awareness measures, namely a phoneme deletion task and the Yopp-Singer Phoneme Segmentation Test. Pinnell, DeFord and Lyons (1988), Iversen and Tunmer (1993) and Schwartz (2005) all reported a statistically significant positive effect on the Concepts about Print subtest of the Observation Survey.
The results for fluency and comprehension were more mixed. Schwartz (2005) found significant effects on the Slosson Oral Reading Test (Revised) and the Text Reading Level subtest of the Observation Survey. Pinnell, DeFord and Lyons (1988) found a statistically significant effect on the Reading Comprehension and Reading Vocabulary subtests of the Comprehensive Test of Basic Skills (CTBS). However, Schwartz (2005) reported no statistically significant effect of Reading Recovery on the Degrees of Reading Power Test. In other literacy areas highlighted in the What Works Clearinghouse report (2007a) some positive effects were noted. Pinnell, DeFord and Lyons (1988), Schwartz (2005) and Iversen and Tunmer (1993) all found statistically significant effects of Reading Recovery on two subtests of the Observation Survey: Dictation and Writing Vocabulary. Pinnell et al. (1994) found significant effects on the Gates-MacGinitie Reading Test, the Dictation subtest of the Observation Survey, and the Woodcock Reading Mastery Test (Revised). However, Baenen et al. (1997) did not find a statistically significant effect of Reading Recovery on grade retention.
It should be pointed out that one of the five key studies featuring in the What Works Clearinghouse report (2007a) – that by Pinnell et al. (1994) – has been criticised by Rasinski (1995) on the grounds that instructional time varied across the different treatment conditions used in the study. The What Works Clearinghouse report was only concerned with Reading Recovery and so did not consider data obtained from the alternative interventions. However, when instructional time was factored into the analysis, Rasinski (1995) found that the alternative interventions yielded better outcomes than Reading Recovery.
Another WWC review (What Works Clearinghouse, 2007b) searched for studies evaluating programmes for children in Kindergarten to grade 3 (Years 1-4) intended to improve achievement in the four domains of alphabetics (phonemic awareness and phonics), oral reading fluency, comprehension, or general reading achievement. The reviewers took in both initial teaching schemes and those intended as catch-up programmes. They found 887 studies, of which 51 studies of 24 programmes met their evidence standards, 27 without reservations and 24 with reservations. Of the 24 programmes, at least four are known to be in use in the UK: Accelerated Reader, Corrective Reading, Reading Recovery, and Success for All. Of the 24 programmes, only
Intervention for Dyslexia 103

Reading Recovery had evidence of positive effect in all four domains. The other programmes known to be in use in the UK had evidence for only some domains: Accelerated Reader had positive evidence for comprehension and general reading achievement, Corrective Reading for alphabetics and fluency (but a null finding for comprehension), and Success for All for alphabetics and general reading achievement (but mixed findings for comprehension). Graphs comparing the effects within domains showed that Reading Recovery had the highest of all impacts in alphabetics (from 18 programmes), fluency (from 11 programmes) and general reading achievement (from 5 programmes), and the third highest impact from 19 programmes for comprehension – but its impact here, in common with other programmes, was distinctly lower than in the other three domains. Among the programmes known to be in use in the UK but with no evidence meeting the WWC standards were Direct Instruction (formerly DISTAR), Letterland, ‘Pause, Prompt and Praise’, Project Read and SuccessMaker Reading.
5.3 Reading Recovery in the UK
5.3.1 Reading Recovery in the UK before Every Child a Reader (ECaR)
Reading Recovery was introduced into England in Surrey LEA in 1990 (Prance, 1992; Prance & Wright, 1992; Wright, 1992). A further 20 LEAs in England adopted the programme as a result of government funding during the period 1992–95. Reading Recovery was also widely implemented in Northern Ireland. According to Hobsbaum (1997) about 70% of the children in England who received the full programme were successfully discontinued, with about 30% referred for further support.
In their review of interventions for literacy difficulties, Brooks et al. (1998) examined evidence supplied by over a dozen local Reading Recovery initiatives in England, Wales and Northern Ireland, but found that ‘none of these reports provided either an impact measure or data from which such a measure could be calculated’ (p.37). The only report that satisfied appropriate scientific criteria was a study of Reading Recovery carried out over the period 1992–96 in six LEAs in London and in Surrey (see Section 5.4).
Many LEAs which had taken up Reading Recovery with the help of government funding discontinued it later in the 1990s after funding ceased, although those that continued (such as Stockport and the London Borough of Hackney) claimed that the programme was beneficial (see Brooks, 2007, p.74). By 2001–02 the take-up of Reading Recovery had dwindled to the point that only 4,600 children in the UK and Ireland were receiving tuition (Douëtil, 2003). Annual monitoring reports of Reading Recovery in the UK and Republic of Ireland have been published by the Institute of Education, University of London (IoE), for the period 2002 to 2007; these also include data on children receiving Reading Recovery from 1993 onwards (see Douëtil, 2003, 2004, 2005, 2006, 2007a). These show that the percentage of children who were successfully discontinued from the programmes (referred to in these reports as ‘having achieved accelerated progress’) rose from 70% in 1994–95 to 84% in 2006–07. Other than the annual monitoring reports there are few studies in the period that generated data useful to this review. However, Fudge (2001) studied 145 children in 21 schools in Bristol which were using the Reading Recovery programme during 1999–2001, and reported an average ratio gain of 2.9.
104 Intervention for Dyslexia

5.3.2 Every Child a Reader (ECaR)
In 2005 the Reading Recovery initiative in England was revived by the provision of £10 million in funding committed jointly by government and sponsors, in a project called Every Child a Reader (ECaR). This began in a small number of local authorities and with a small number of teachers who had received the extra training to become ECaR teachers over and above being Reading Recovery teachers; it also started with a small subset of all children receiving Reading Recovery in England. As will be seen shortly, ECaR has expanded rapidly, but at the time of writing in 2009 has not yet been extended to cover all Reading Recovery provision in England, and does not apply in the rest of the UK (or in the Republic of Ireland, which is included in annual reports from IoE). In what follows, where necessary distinctions will be drawn between ECaR and Reading Recovery more generally.
At the end of the first year of the project (2005–06) data for all the children who had completed ECaR programmes during the year (N=373) showed that 77% had been successfully discontinued, and 23% had been referred for further support (ECaR, 2006). At the beginning of the year, the full group of children had an average reading age of 4 years 10 months on the BAS Word Reading Test, and at the end of the intervention this had gone up to an average reading age of 6 years 7 months, an average gain of 21 months. For 286 of these children the average interval between the pre- and post-tests was, apparently, about 4½ months, but for the 87 who were in the ECaR in London study (see Section 5.4.2) it was 10 months. Averaging across the two groups, this equates to a ratio gain of 3.6. The children had received an average of 38.5 hours of one-to-one tuition during the year (ECaR, 2006).
The evaluation of the second year of the project (2006–07) reported on ECaR teaching delivered to 1,838 children, of whom 1,081 had completed their programmes by the end of the school year and the remainder were due to complete during 2007–08 (ECaR, 2007). Data were based on delivery by 245 teachers, who each taught an average of between seven and eight children during the year. The average amount of tuition was 42 hours per child, slightly higher than in 2005-06. As in the 2005-06 samples, participating schools had high proportions of low-achieving children, socio-economic disadvantage, and EAL children. The ECaR children had very low levels of literacy on entry to the programme, as assessed by the Observation Survey. At the beginning of their programmes, the Reading Recovery children who completed them during the year (N=1,081) had an average reading age of 4 years 10 months on the BAS Word Reading Test. The 245 children who were referred made an average gain of 9 months of reading age (ECaR, 2007, p.13), whereas the 836 who were discontinued (ECaR, 2007, Figure 1, p.13) appear to have made an average gain of 21 months of reading age (the sample size given in ECaR, 2007, Table 2, p.14 appears to be erroneous). If these figures are correct, the average gain across the full sample was 18.3 months, giving an overall ratio gain of 4.0.
Douëtil (2006) reported on 3,566 children who had been on Reading Recovery programmes in 2005–06 across Britain and Ireland (including those on ECaR mentioned above): the ratio gain in reading for this group was 4.2; 3,042 (85%) had been successfully discontinued (ibid., Table 3.1, p. 12). Analysing data on 1,440 and 516 children who could be traced and were re-tested three and six months respectively after the end of their programmes, Brooks (2007, p.215) showed that those children made, on average, exactly standard progress. When followed up at Key Stage 1 National Curriculum assessments, 38% of the sample achieved target levels (level 2b or above). However, it could be argued that, since the children on these programmes had made
Intervention for Dyslexia 105
very little progress in their first year of school, and that without intervention they might have been expected to reach a rather low level in KS1 National Curriculum assessments, the achievement of levels 2c and above should be regarded as good progress. On this revised criterion of National Curriculum assessments performance, the percentage becomes nearly 70%.
5.4 Quasi-experimental research studies on Reading Recovery in the UK
All the UK studies so far mentioned are single-group studies; that is, they gathered outcome measures only from children who had received Reading Recovery and not from any comparison or control groups. This section summarises two UK studies in which the performance of children receiving and not receiving Reading Recovery was compared; the first also contained an alternative intervention. (A third UK comparative study, conducted in Northern Ireland in the late 1990s, did not report results in a manner allowing the calculation of impact measures.)
5.4.1 The London and Surrey study, 1992–96
This study was originally reported in Sylva and Hurry (1995a, b) and Hurry and Sylva (1998), all of which have now been superseded by Hurry and Sylva (2007); this last reference is the main basis for the following summary. It should be borne in mind that this study took place before significant amounts of phonics were added to Reading Recovery.
Approximately 400 children in 63 schools in London and Surrey were studied, with 95 children being assigned to Reading Recovery tuition and 97 to an alternative intervention called Phonological Training, and the remainder belonging to comparison groups. The schools were selected such that those in the comparison groups and those providing Phonological Training had similar intakes to those running Reading Recovery programmes. The participants comprised the six poorest readers in Year 2 from each school in the age range 6 years 0 months to 6 years 6 months at the outset (approximately the bottom 20% of readers), selected on the basis of their performance on the Diagnostic Survey (Clay, 1985), forerunner to the Observation Survey. Some of the comparison groups were ‘within-school controls’ (in the schools where the two programmes were running) and the others were ‘between-school controls’ (in schools where neither programme was running).
Children on the Reading Recovery programme received an average of 77 30-minute sessions delivered over an average of 21 weeks, and 89% were successfully discontinued. Children on the Phonological Training programme received sound awareness training involving rhyme and alliteration, together with word-building activities involving plastic letters, following the approach developed by Bradley and Bryant (1985) and Kirtley et al. (1989), each child receiving 40 10-minute individual sessions spread over 10 months. The measures used in the study include BAS Word Reading and Spelling, Neale Analysis of Reading Ability, and the Oddities Test, which measures awareness of rhyme and of initial and final phonemes (Kirtley et al., 1989).
At the first post-test on completion of intervention, it was found that, on average, children who had received Reading Recovery had made significantly greater progress on all measures compared with between-school controls, and on all measures except
106 Intervention for Dyslexia
phonological awareness compared with within-school controls. The statistically significant effect sizes (all except those for phonological awareness) were in the range 0.63 to 0.87, which are classed as medium to large. Those children who had received Phonological Training made gains that were significant only in measures related to phonological awareness (compared with both within-school and between-school controls), and the few statistically significant effect sizes were mostly smaller (range 0.30–0.72). There was a significant interaction (p<0.01) between initial reading ability and response to intervention, with Reading Recovery having greater impact on children who had been non-readers at the outset of the study (effect sizes 1.15–1.22), compared with children with some reading skills at the outset (effect sizes 0.34–0.56).
At the second post-test, one year after completion of the intervention, the gap between the Reading Recovery children and the controls had narrowed considerably. The Reading Recovery children were still significantly ahead of their between-school controls in reading and spelling, with relatively small effect sizes (range 0.32–0.42), but were no longer better than their within-school controls, although this could have been due to the wider benefits of Reading Recovery in those schools. On the other hand, the children who had received Phonological Training were significantly better than between-school controls on all measures, with effect sizes in the range 0.22–0.49. As was found with the Reading Recovery sample, there were no significant differences between the Phonological Training group and within-school controls. There was still a significant interaction (p<0.05) between initial reading ability and response to intervention, but with diminished effect sizes: 0.54–0.59 for children who had been non-readers at the outset and 0.07–0.11 for children with some reading skills at the outset.
A long-term follow-up was also carried out by Hurry and Sylva (1998, 2007) 3½ years after the intervention; this is considered in Section 5.5.1.
5.4.2 Every Child a Reader in London, 2005–06
Burroughs-Lange and her colleagues (Burroughs-Lange, 2006; Burroughs-Lange & Douëtil, 2007) carried out a study comparing outcomes for Year 1 children during the first year of ECaR in five London boroughs, compared with five similar London boroughs where Reading Recovery was not being used, but which were scheduled for implementation of ECaR during 2006–07.11 The total number of participating schools was 42, 21 in each arm of the study. Compared with national averages, all the participating schools had high proportions of low-achieving children, socio-economic disadvantage (as indexed by the proportion of children receiving free school meals), and children for whom English was an additional language (EAL), with no statistically significant differences between the ECaR schools and the non-ECaR schools in these respects. At the beginning of the project no statistically significant differences were found between the ECaR schools and the non-ECaR schools on word reading or phonic skills (Word Recognition and Phonics Skills test; WRaPS), average reading age or British Ability Scales (BAS) Word Reading standard score. On the Observation Survey of Early Literacy Achievement no significant differences were found between Year 1 children in the ECaR schools and the non-ECaR schools, except on the Book Level measure, where the ECaR schools were slightly better (p<0.05).
11 This study is also summarised in the report of the first year of ECaR Reading Recovery (ECaR, 2006).
Intervention for Dyslexia 107

Before the results are summarised a methodological point must be noted. In the following paragraph various average standard scores are quoted from the reports of the study, all of which are in the range 94 to 107 and therefore appear to be well within the average range – which would be surprising for children stated to be the lowest achievers. The explanation is that standard scores for these children were not calculated in the usual way, from the nationally established norms for the tests, but within the samples. This is said to provide greater statistical power (because otherwise standardised scores could not have been calculated for the children who had zero raw scores at the outset, i.e. most of the sample, except by the very rough-and-ready method of attributing them a standardised score one less than the lowest figure in the conversion table). However, this procedure does mean that the ‘standard scores’ quoted are not quite what they seem and need to be interpreted with care. It also means that the effect sizes given may not be equivalent to those that would have been derived from normal standardised scores. It would have been helpful to the profession if normal standardised scores had also been published, to facilitate comparisons with other programmes.
That said, the study found that, at the end of the year, Year 1 classes in the ECaR schools (the whole classes, not just the children receiving the programme) had gained slightly in average WRaPS standard score (from 100 to 102.5), whereas the Year 1 classes in the non-ECaR schools had declined slightly (from 100 to 97). The difference between the groups at the end of the year was statistically significant (p<0.05). The 87 children who received ECaR during the year were found to have significantly increased on WraPS standard score from 102 to 107, compared with the 147 children in comparison schools with no ECaR, for whom the average WraPS standard score declined from 100 to 96. This difference between the groups on WRaPS was statistically significant (p<0.05), with an effect size of 0.84. On BAS Word Reading Test standard score, the children who had received ECaR increased from 103 to 111, and the children in comparison schools declined from 99 to 94. Controlling for the statistically significant difference in initial scores between the groups, this difference between the groups on BAS Word Reading was statistically significant (p<0.05), with an effect size of 1.30. In reading age terms this represented a gain of 20 months (from an average of 4 years 11 months to 6 years 7 months) for the ECaR sample compared with a gain of only 5 months (from an average of 4 years 10 months to 5 years 3 months) for the non-ECaR sample; the ratio gains were therefore 2.0 and 0.6 respectively over the full school year. On measures drawn from the Observation Survey, effect sizes in favour of the ECaR group ranged from 0.81 to 2.10. Teachers rated the ECaR children as ‘having made good progress during the year in literacy, oracy, work habits, social skills and all literacy-related areas’ (Burroughs-Lange, 2006, p.24). In schools with ECaR, teachers also reported such benefits for children who were not actually on the programme, although these were not observed on any of the measures.
5.4.3 Comparing the effects of Reading Recovery and phonologically based schemes
The only British study in which both Reading Recovery and a phonologically based scheme were evaluated was the London and Surrey study summarised in section 5.4.1, but in the reports of that study there are no statistical comparisons between the effects of Reading Recovery and of the phonologically based scheme, Phonological Training. Therefore comparisons have to be sought indirectly, via one or other of the two forms of impact measure described in section 1.5, namely effect sizes and ratio gains. There are not enough points of comparison for spelling or writing, and none at all (of course) for measures internal to Reading Recovery, so comparisons rest on results for reading
108 Intervention for Dyslexia

(accuracy or comprehension or both). The data for these comparisons can be found in Brooks (2007, Table A6 (ratio gains), pp.270-278, and Table A7 (effect sizes), pp.279-81).
Because the calculation of effect sizes requires data from a control or comparison group, Table A7 contains effect sizes only for Reading Recovery in London and Surrey and ECaR in London. Those effect sizes seem large, but (1) the effects of the first study washed out almost completely within three years, by which stage the children involved were still well below national norms; (2) the effect sizes for ECaR were calculated within the samples and not from national standardisation tables (see the second paragraph in section 5.4.2), and are therefore not properly comparable with any others in Table A7. Also, very few phonologically based schemes appear in Table A7, limiting any possible comparisons. The comparisons made here are therefore based on the ratio gains in Table A6. Table A6 shows that the ratio gains for reading accuracy (there are none for comprehension) for Reading Recovery programme groups range from 1.6 to 4.2. This range encompasses a few new ratio gains stated earlier in this chapter. Of the 11 programmes summarised in section 3.3, nine appear in Table A.6 (the exceptions being Phonology with Reading and the London Borough of Sutton study). Ratio gains for these programmes range from 1.4 to 16.1 for reading accuracy (and from 1.9 to 8.3 for comprehension). The lowest ratio gain for accuracy relates to a group of children with moderate learning difficulties. Otherwise the ratio gains for accuracy overlap with those for Reading Recovery at the lower end, but extend well above them at the upper end.
It seems reasonable to conclude that these comparisons on balance favour the phonologically based schemes.
5.5 Long-term effects Most studies of Reading Recovery have been short- or medium-term, but longer-term follow-up is essential to check whether benefits are sustained, since many initially effective educational programmes are known to suffer washout over time. Several longer-term studies of Reading Recovery in several countries have shown washout (Glynn et al., 1989; DeFord et al., 1990; Hiebert, 1994; Shanahan & Barr, 1995; Wasik & Slavin, 1993; Haenn, 2000; Chapman, Tunmer & Prochnow, 2001; Center et al., 2005), but others have shown that gains were maintained (Briggs & Young, 2003; Fraser et al., 2001; Moore and Wade, 1998; Rowe, 1995; Schmitt & Gregory, 2001; Whitehead, 2004). Perhaps significantly, Baenen et al. (1997), the only RCT among those analysed by the What Works Clearinghouse (2007a) to have followed up the children involved into grades 2 and 3, found that the benefits found in grade 1 had washed out – but this study was conducted on an older version of Reading Recovery.
The longest follow-up study conducted in the UK is that reported by Douëtil (2004), on 1,451 children in England who had completed Reading Recovery programmes during 1997-98, and who had been followed-up in 1999 at the end of Key Stage 1. 77% were reported to have been successfully discontinued, of whom less than half (N=493) achieved target levels in Key Stage 1 National Curriculum assessments (level 2b or above), though 882 (80%) achieved level 2c or above. At the end of Key Stage 2, 651 children were tracked and the National Curriculum assessment results of these children showed that, of the ones who had been successfully discontinued from Reading Recovery programmes (N=437), 260 achieved target levels in Key Stage 2 National Curriculum assessments (level 4 or above). This represented 59% of the 437 children
Intervention for Dyslexia 109
who had been successfully discontinued, but only 40% of the 651 children who had been followed up at this stage.
5.5.1 Long-term follow-ups of Reading Recovery in England
In the London and Surrey study described in Section 5.4.1 a long-term follow-up was carried out 3½ years after intervention, the average chronological age of the children at that stage being 10 years 3 months. In the analysis it was necessary to control for social disadvantage (based on free school meals status), as this had become a significant predictor of literacy progress. Testing at this stage comprised NFER-Nelson Group Reading Test 6–12 and Young’s Parallel Spelling Test. It was found that both the Reading Recovery and the Phonological Training intervention groups were still slightly ahead of between-school controls in reading (by about 3 months in reading age) but the differences were not significant and the effect sizes were small (0.15 for Reading Recovery and 0.21 for Phonological Training). In fact, there were no significant differences between the Reading Recovery children and controls (both within-school and between-school) on any measures. However, on the measures of spelling and overall reading/spelling the Phonological Training group was found to be significantly better than the between-school controls (effect sizes 0.26–0.27). Overall, most of the children in the study by Hurry and Sylva (1998, 2007) were still behind national norms for reading and spelling at age 10, with an average reading age of 8 years 6 months and an average spelling age of 8 years 9 months. Clearly, therefore, in the long term, neither Reading Recovery nor this particular Phonological Training intervention had allowed the children to overcome their poor start in reading or spelling.
Every Child a Reader (2008, p.16) provided some information on children from the ECaR in London study one year after the intervention ceased. In July 2007 all the children who could be traced were re-tested – 77 who had received ECaR and 109 comparison children. Comparisons of the previous scores of those who were traced and those who were not showed that those traced were representative of the original samples. Also, the Key Stage 1 assessment results for all the children in the original samples in the London study were obtained, from the DCSF. The ECaR children were reading at age-appropriate levels – an average reading age of 7:9 – whereas the average reading age for the comparison children was 6:9. In the end-of-key stage assessments 86% of the ECaR children achieved Level 2 or above in reading, compared to 84% of children nationally. Also, 77% achieved Level 2b or above in reading, compared with 71% nationally and 57% of the comparison children. In writing, 83% of the ECaR children achieved Level 2 or above, compared to 80% of children nationally. It should be noted that these KS1 results for the children in the ECaR project in London were distinctly better than those for all Reading Recovery children in England and Wales in the same year. The following figures are taken from the Reading Recovery annual report for the UK and Republic of Ireland, 2006-07 (Douëtil, 2007a, Table 6.1, p.19; although the heading of the Table refers to ‘UK and Republic of Ireland’, the data apply only to England and Wales). Of the 1,207 such children, 72% achieved Level 2 or above in reading (cf. 86% in the London study, 84% nationally); 43% achieved Level 2b or above in reading (cf. 77% in the London study, 71% nationally); in writing, 60% achieved Level 2 or above (cf. 83% in the London study, 80% nationally). Clearly, for some reason greater success was being achieved in the London study than in Reading Recovery across the whole of England and Wales. It may be that the fresh, and refreshed, training provided within ECaR in London had particularly enthused the teachers involved and therefore boosted their pupils’ achievements. However that may be, the figures just quoted provide a background for the next section.
110 Intervention for Dyslexia

5.5.2 Key Stage 1 results of Reading Recovery children in England, 2003– 07
A key conclusion in reports published by ECaR is that evidence from National Curriculum assessments in reading and writing at the end of their second year of formal schooling indicates that Reading Recovery not only raises children’s literacy standards but also puts children ‘on track’ for becoming independent readers:
“The programme has demonstrated that providing Reading Recovery is an effective solution to early literacy difficulties. Over three quarters of the children involved – the hardest to teach children in the schools where it is hardest to raise standards – have been returned to average or above literacy levels for their age after only 41 hours of one-to-one teaching.” (ECaR, 2008, p.54) Reading Recovery reports often use achievement of Level 2 or above in Key Stage 1 National Curriculum assessments in reading and writing as a ‘benchmark’ to demonstrate that Reading Recovery has enabled children to become independent readers:
“In national curriculum terms, the children moved from a level ‘W’ (working towards National Curriculum Level 1) to Level 1A. Level 1A would put them well on track for achieving Level 2+ (the nationally expected benchmark) at the end of Key Stage 1, when they are seven.” (ECaR, 2008, p.12)
“Almost three out of four children who received Reading Recovery attained level 2 or above in National Assessments for reading (71.6%), and two out of three for writing (60%). This included children who did not achieve the goals of the programme, and those who received RR in Y2 and were still part way through their series of RR lessons when National Assessments took place. Children who achieved the goals of Reading Recovery had an even greater likelihood of success in National Assessments, with 17 out of 20 (83%) reaching level 2 or above in reading and 14 out of 20 (69%) in writing.” (Douëtil, 2007a)
Presenting the results in this fashion may lead to the (erroneous) assumption that all three sublevels of Level 2 are equivalent in terms of the likely prognosis for children’s continuing successful progress in reading (Level 2+ is described in the second quote above as “the nationally expected benchmark”). However, level-by-level comparisons to all-England samples presented below for 2006 and 2007 reading National Curriculum assessments challenge conclusions drawn from these ‘headline’ figures.
Figure 5 shows the figures from the Annual Reports on Reading Recovery compiled at the Institute of Education for the years 2002–03 to 2006–07, i.e. the percentage of Reading Recovery ‘accelerated progress’ children who completed their Reading Recovery programme and reached the criteria for discontinuation who went on to achieve Level 2 or above in Key Stage 1 National Curriculum assessments in reading and writing. It can be seen that the reading results are consistently better than the writing results – as, indeed, they are nationally.
Performance profiles of ‘accelerated progress’ children and all children who completed Reading Recovery programmes in Key Stage 1 reading National Curriculum assessments are shown in Figure 6 (2003-04), and Figure 7 (2004-05) (data from Douëtil, 2004, 2005).
Intervention for Dyslexia 111

0
10
20
30
40
50
60
70
80
90
100
2002‐3 2003‐4 2004‐5 2005‐6 2006‐7
reading
writing
Figure 5. Percentage of Reading Recovery ‘accelerated progress’ children achieving Level 2 or above in KS1 Reading and Writing National Curriculum assessments
0
10
20
30
40
50
60
70
80
90
100
2 orabove
2b orabove
W 1 2c 2b 2a 3
accelerated progress
all completed programs
Figure 6. Performance profiles of accelerated progress children and all children who completed Reading Recovery programmes in KS1 reading National Curriculum assessments in 2003-04
112 Intervention for Dyslexia

0
10
20
30
40
50
60
70
80
90
100
2 orabove
2b orabove
W 1 2c 2b 2a 3
accelerated progress
all completed programmes
Figure 7. Performance profiles of accelerated progress children and all children who completed Reading Recovery programmes in KS1 reading National Curriculum assessments in 2004-05
The figures reveal similar patterns of performance across the two cohorts (and the same patterns are found also in the 2005-06 and 2006-07 data, which are considered later in relation to all-England Key Stage 1 National Curriculum assessment results in 2006 and 2007). In each cohort, over 80% of ‘accelerated progress’ children achieved Level 2 or above – but this fell to 72% of all children who completed programmes (i.e. both ‘accelerated progress’ and ‘progress-referred’ groups).
Accepting that children enrolled into Reading Recovery were the lowest performing children in their classes, these results appear commendable, with 7 out of 10 children enrolled in and having completed the programme achieving Level 2 or above. However, when we look at percentages achieving Level 2b or above, the picture is less rosy, with just over 50% of ‘accelerated progress’ children and 42% of all children who completed programmes achieving Level 2b or above. That is, only 4 out of 10 children enrolled in and having completed the programme achieved Level 2b or above; 30%-33% of ‘accelerated progress’ children and 24%-30% of all children completing the programme achieved Level 2c. In addition, a further 17% (2003-04) or 15% (2004-05) of ‘accelerated progress’ children and 31% (2003-04) or 28% (2004-05) of all children completing the programme achieved Level 1, or working towards Level 1.
In order to address the question of whether Reading Recovery puts children ‘on track’ for becoming independent readers, it is necessary to examine the characteristics of Level 1 and Level 2c readers, and, in particular, to consider how well developed are the word recognition skills of children at these stages, given that these are the skills that will mostly determine the likelihood of them becoming independent readers. The descriptors for National Curriculum assessment reading levels are shown in Table 12.
Intervention for Dyslexia 113
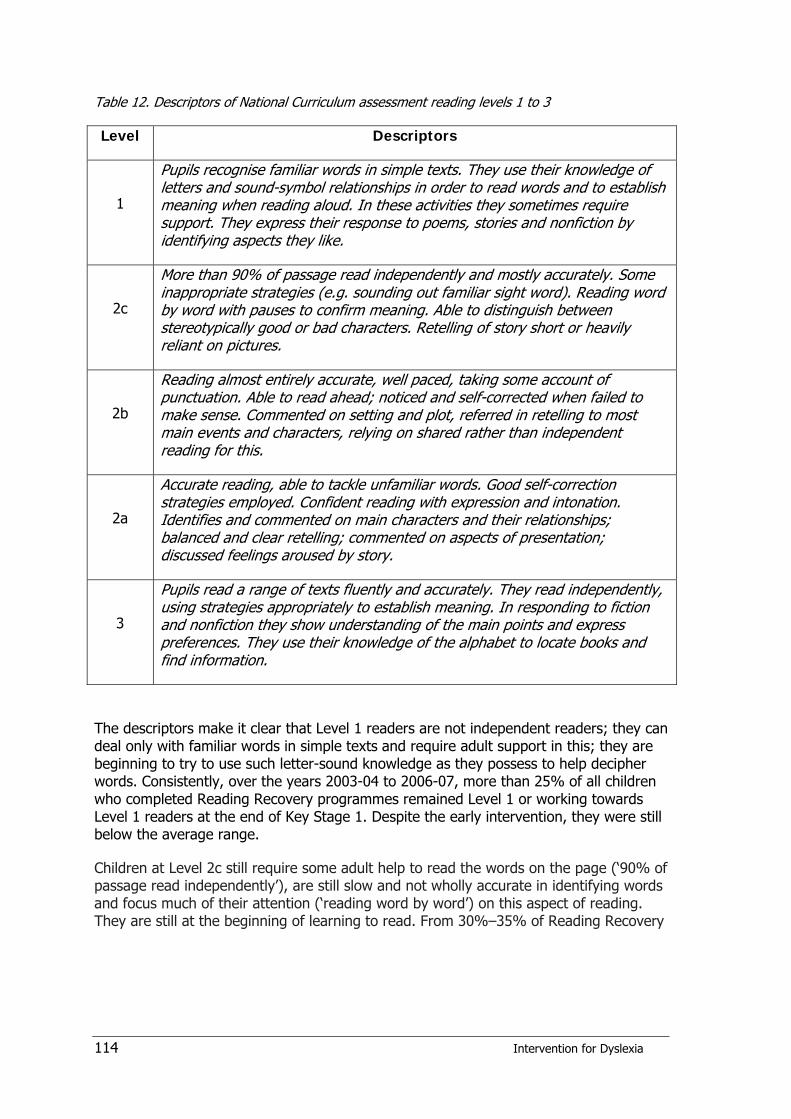
Table 12. Descriptors of National Curriculum assessment reading levels 1 to 3
Level Descriptors
1
Pupils recognise familiar words in simple texts. They use their knowledge of letters and sound-symbol relationships in order to read words and to establish meaning when reading aloud. In these activities they sometimes require support. They express their response to poems, stories and nonfiction by identifying aspects they like.
2c
More than 90% of passage read independently and mostly accurately. Some inappropriate strategies (e.g. sounding out familiar sight word). Reading word by word with pauses to confirm meaning. Able to distinguish between stereotypically good or bad characters. Retelling of story short or heavily reliant on pictures.
2b
Reading almost entirely accurate, well paced, taking some account of punctuation. Able to read ahead; noticed and self-corrected when failed to make sense. Commented on setting and plot, referred in retelling to most main events and characters, relying on shared rather than independent reading for this.
2a
Accurate reading, able to tackle unfamiliar words. Good self-correction strategies employed. Confident reading with expression and intonation. Identifies and commented on main characters and their relationships; balanced and clear retelling; commented on aspects of presentation; discussed feelings aroused by story.
3
Pupils read a range of texts fluently and accurately. They read independently, using strategies appropriately to establish meaning. In responding to fiction and nonfiction they show understanding of the main points and express preferences. They use their knowledge of the alphabet to locate books and find information.
The descriptors make it clear that Level 1 readers are not independent readers; they can deal only with familiar words in simple texts and require adult support in this; they are beginning to try to use such letter-sound knowledge as they possess to help decipher words. Consistently, over the years 2003-04 to 2006-07, more than 25% of all children who completed Reading Recovery programmes remained Level 1 or working towards Level 1 readers at the end of Key Stage 1. Despite the early intervention, they were still below the average range.
Children at Level 2c still require some adult help to read the words on the page (‘90% of passage read independently’), are still slow and not wholly accurate in identifying words and focus much of their attention (‘reading word by word’) on this aspect of reading. They are still at the beginning of learning to read. From 30%–35% of Reading Recovery
114 Intervention for Dyslexia

‘accelerated progress’ children were consistently at this level at the end of Key Stage 1, i.e. they are still beginning readers, despite the early intervention.12
At level 2b (the national ‘target level’) children are ‘almost entirely accurate’ in their reading. 35%–40% of accelerated progress children and 28%–34% of all children completing programmes reached this level. Importantly, it is not until Level 2a that children are ‘able to tackle unfamiliar words’. There is ample research evidence that ability to tackle unfamiliar words is the distinguishing feature of children whose word recognition processes have developed into a self-sustaining system which, as Clay herself described, “continues to accumulate skills merely because it operates” (Clay, 1979, p.5). With this in mind, one might consider attainment of Level 2a in Key Stage 1 reading National Curriculum assessments as the best indicator of the effectiveness of Reading Recovery: children achieving Level 2a have self-sustaining word recognition systems, which put them beyond the fear of failure in terms of ability to decipher new words in a variety of content areas. But only from 9% to 13% of accelerated progress children and 8%–10% of all children completing Reading Recovery achieved Level 2a.
Children achieving Level 3 have completed work on establishing a fluent and self-sustaining word recognition system and read with good understanding. They have moved on from ‘learning to read’ to ‘reading to learn’. This level was (perhaps understandably) achieved by fewer than three in a hundred Reading Recovery children.
The goal of Reading Recovery, as stated in is annual reports is “… for children to develop effective reading and writing strategies in order to work within an average range of classroom performance” (Douëtil, 2007a). In order to examine whether this goal has been achieved, patterns of performance of the 2005–06 and 2006–07 Reading Recovery cohorts (Douëtil, 2006, 2007a) have been compared with the patterns of performance of all children in England in 2006 and 2007 Key Stage 1 National Curriculum assessments, respectively. The results are presented in Figure 8 (2005–06) and Figure 9 (2006–07)13. Note that the patterns of performance for Reading Recovery children are highly similar to those shown for the two earlier cohorts in Figure 6 and Figure 7.
Because ‘accelerated progress’ Reading Recovery children were as likely as all children in England to achieve Level 2 or above in Key Stage 1 National Curriculum assessments, it appears that the Reading Recovery target of children being able to work “within an average range of classroom performance” has been met. However, the goal was not met when all children completing Reading Recovery programmes are considered: Reading Recovery children were 10 percentage points less likely than all children in England to achieve Level 2 or above. Furthermore, it has been shown above that children achieving Level 2c are, in terms of the descriptors for that sublevel, still beginning readers: as with the earlier cohorts, 32%–35% of ‘accelerated progress’ children and 29%–31% of all children completing Reading Recovery programmes achieved Level 2c, compared with 13% of all children in England.
12 Smaller proportions (27%‐31%) of all children completing Reading Recovery achieved Level 2c, as more of them were at Level 1 or Working towards Level 1.
13 Note that published DCSF statistics, from which these data have been obtained, do not give separate figures for levels W, 1, 2b or 2a [2006: www.dcsf.gov.uk/rsgateway/DB/SFR/s000672/index.shtml] [2007: www.dcsf.gov.uk/rsgateway/DB/SFR/s000740/index.shtml].
Intervention for Dyslexia 115
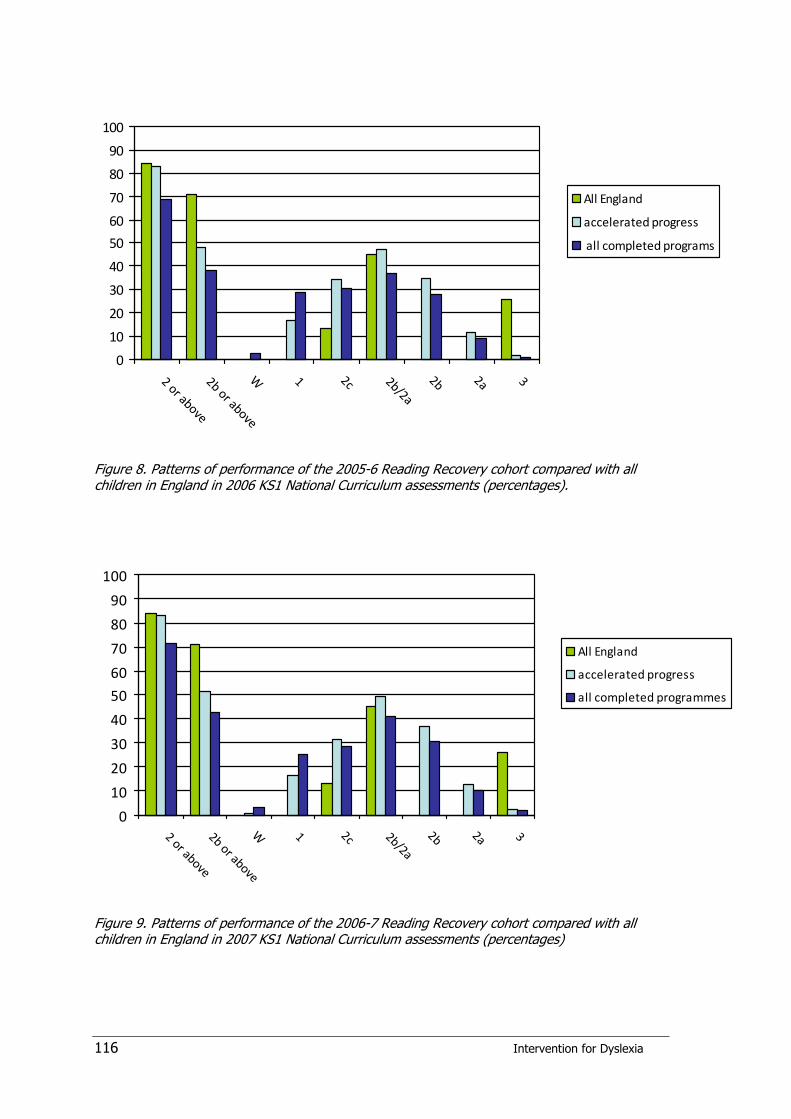
0
10
20
30
40
50
60
70
80
90
100
2 or above
2b or above
W 1 2c 2b/2a
2b 2a 3
All England
accelerated progress
all completed programs
Figure 8. Patterns of performance of the 2005-6 Reading Recovery cohort compared with all children in England in 2006 KS1 National Curriculum assessments (percentages).
0
10
20
30
40
50
60
70
80
90
100
2 or above
2b or above
W 1 2c 2b/2a
2b 2a 3
All England
accelerated progress
all completed programmes
Figure 9. Patterns of performance of the 2006-7 Reading Recovery cohort compared with all children in England in 2007 KS1 National Curriculum assessments (percentages)
116 Intervention for Dyslexia
It is not until Level 2b that children are ‘almost entirely accurate’ readers. 48%–51% of ‘accelerated progress’ Reading Recovery children and 38%-43% of all Reading Recovery children who completed their programmes achieved Level 2b or above, compared with 71% of all children in England in both years. Moreover, most of these Reading Recovery children (35%–37% accelerated progress, 28%-31% all completed programmes) achieved Level 2b, not any level above this. Only 12% of accelerated progress children and 9%–10% of all completed programme children achieved Level 2a, and 3% or fewer achieved Level 3, compared with 26% of all children in England.
At best, Reading Recovery enabled children to perform within the low average range (2c) for their age, whilst about 30% of completed programme children remained consistently at Level 1 or working towards Level 1, and only 10%–12% were working at Level 2a or above. Remember, Level 2a is the level at which children can ‘tackle unfamiliar words’ – the necessary feature that defines successful development of a self-sustaining word recognition system.
The same exercise has been conducted examining the Key Stage 1 writing National Curriculum assessment performance of children on Reading Recovery cohorts from 2003–04 to 2006–07, as well as comparing the 2005–06 and 2006-07 Reading Recovery cohorts with National Curriculum assessment results of all children in England in 2006 and 2007. Without going into all the details, the results tell a similar story to the one described above for reading. 25%-31% of ‘accelerated progress’ children and 36%-40% of all children who completed their Reading Recovery programme scored at the lowest levels for writing (Level 1 or Working towards Level 1). At best, Reading Recovery succeeded in getting about 40% of children who completed their programmes into the low average range of writing performance for their age (2c). A further 35%–40% of children who completed their programmes were below this range. Thus, 75%–80% of children completing Reading Recovery were low average writers or worse by the end of Key Stage 1, with only two in ten writing within the average range (Level 2b) or above, compared with six in ten of all pupils in England. Fewer than one in a hundred Reading Recovery children (whether we count those making accelerated progress or all pupils completing the programme) achieved Level 3 in writing, compared with 13%-14% of all children in England.
5.5.3 Reading Recovery children’s standardised reading test results
The Reading Recovery annual reports for 2004-05 to 2006-07 also give measures of children’s progress on the British Abilities Scales Word Reading Test, Second Edition (BAS-II). For each of the three years the results published are identical: i.e. the average reading age of children entering programmes was 4 years 10 months, and average reading age of children of those who had been ‘successfully discontinued’ was 6 years 7 months (Douëtil, 2005, p.12; 2006, p.12, 2007a, p. 14). On the face of it, this looks like good progress. However, before reaching this conclusion, two factors need to be considered. First, 6 years 7 months was the average reading age of only those children who responded well to Reading Recovery, and does not take into account those pupils for whom Reading Recovery did not seem to be such an effective intervention. Secondly, a child can achieve a reading age of 6 years 7 months on BAS-II with knowledge of only a few words. To attain a reading age of 6 years 7 months, only 21 words on the test have to be read correctly, which can easily be achieved by a child who has memorised some very high frequency common words (e.g. the, up, you, at, said, out), and knows and can use single letter sounds, plus the simple digraphs ‘sh’ and ‘th’. In other words,
Intervention for Dyslexia 117

although the reading age gains look good, in fact, the child with a reading age of 6 years 7 months has minimal reading skills and is still a beginning reader.
5.6 Conclusions
5.6.1 The efficacy of Reading Recovery
There is sufficient evidence of good quality to show that Reading Recovery benefits a considerable proportion of the children with literacy difficulties whom it serves in the short term. Evidence of maintenance of the gains in the longer term is mixed. Some studies show washout, others do not. In particular, the London and Surrey study in 1992–96 had very disappointing long-term outcomes, though this may mean that there was insufficient continuing support for the children when they returned to their classrooms full-time. More recent evidence from ECaR appears to show better maintenance of gains. Comparisons of ratio gains for Reading Recovery and for phonologically based schemes appear on balance to favour the latter.
Moreover, the analysis of National Curriculum assessment results of children on Reading Recovery programmes over the period 2003–2007 (see Section 5.5.2) does not, in fact, support the view that Reading Recovery in England achieves its stated goal for “children to develop effective reading and writing strategies in order to work within an average range of classroom performance”. At the end of Key Stage 1, this was clearly not the case. In Key Stage 1 Reading National Curriculum assessments less than half of Reading Recovery children achieved a Level 2b or better, and although Level 2b is classed as the national ‘target’ level, this is nevertheless below that necessary for effective independent reading. Only 12%–15% of Reading Recovery children completing their programmes between 2003 and 2007 achieved a Level 2a or above in Key Stage 1 Reading National Curriculum assessments, the level at which children can tackle unfamiliar words and have therefore developed a self-sustaining word recognition system. The results on the British Abilities Scales Word Reading Test do not suggest a different conclusion. It remains to be seen whether the recent claims by ECaR for an increased emphasis on phonics teaching in Reading Recovery will be reflected in better achievement for pupils on Reading Recovery programmes. In order to evaluate this matter properly, however, and determine what is the best way for children to learn to tackle unfamiliar words and so develop a self-sustaining word recognition system, an experimental study is required. Such a study should compare the effectiveness of Reading Recovery as currently implemented (i.e. with its proclaimed increased emphasis on phonics) and Reading Recovery which includes daily systematic structured phonics teaching using one – or comparing all three – of the most popular early phonics programmes.
5.6.2 Reading Recovery as an intervention for children with dyslexia
Literature searches failed to uncover any published research studies or evaluations of Reading Recovery being used with pupils who had been identified as having dyslexia. This is not altogether surprising, since Reading Recovery is not designed to be used with dyslexic children, but it is therefore impossible to judge from research evidence whether
118 Intervention for Dyslexia

Reading Recovery specifically benefits children with dyslexia. However, the following argument14 has been put forward by ECaR:
1) Since ECaR claims to address the needs of the “hardest to teach children” and the “lowest attaining children” (ECaR, 2006, p.32; ECaR, 2007, p.32), therefore it would be expected that Reading Recovery cohorts would include at least some dyslexic children, and
2) Since ECaR claims that “providing Reading Recovery is an effective solution to early literacy difficulties” (ECaR, 2007, p.54) therefore Reading Recovery must benefit at least some children who have dyslexia.
Addressing the issue of whether Reading Recovery is an appropriate intervention for children with dyslexia, Douëtil makes a similar assertion:
“The proportion of children who are successful in Reading Recovery is such that it is likely that it must include some who might have been diagnosed as dyslexic. Through personalisation of the literacy curriculum to meet their individual learning needs, which may include learning how to overcome the effects of a particular phonological difficulty, these children have learned how to overcome the effects of dyslexia. The symptoms may still be with them to some degree, and it is possible that they will still require support in other aspects of learning, or a different kind of support as the demands of the literacy curriculum change as they move through Key Stages 2 and 3.” (Douëtil, personal communication, p.13, emphasis added) This is in principle the same as the argument put forward in Section 3.2 to the effect that the 11 interventions summarised in chapter 3 must have included significant proportions of children with dyslexia, and must therefore have been effective for some of those children. The contrary argument is that it is logically possible that all the children with dyslexia within the groups served by Reading Recovery are within the subgroup who are not ‘successfully discontinued’ but referred for further provision. But even if we accept that this is improbable, we still have no way of knowing what proportion of children with dyslexia are ‘successfully discontinued’, and, furthermore, we have no way of knowing what proportion of children with dyslexia who have been ‘successfully discontinued’ have been enabled by this intervention to become independent readers – i.e. those who subsequently go on to achieve Level 2a or better in Key Stage 1 National Curriculum assessments. But the figures suggest that this proportion is likely to be very small indeed, since only about 12%–15% of all ‘successfully discontinued’ children achieve this. It is not possible to establish such figures for the interventions summarised in chapter 3 because none of them have followed children up to the end of a key stage, but the ratio gains comparisons in section 5.4.3 appear on balance to show that, on balance, phonologically based schemes have larger impact in the short term.
To decide the question whether Reading Recovery actually works for children with dyslexia therefore requires further research. However, dyslexic children, by definition, have specific problems in acquiring effective knowledge of letter-sound relationships and
14 This argument was put forward in October 2008 by Jean Gross and other ECaR personnel in presentations to the DCSF Expert Advisory Group, which is attached to the Rose review of provision for children with dyslexia.
Intervention for Dyslexia 119
of the rules that govern these. In order to become independent readers who can tackle unfamiliar words, they are likely to need more rather than less intensive instruction in phonics. In consequence, it would seem irrational to provide intervention for dyslexic children in the form of Reading Recovery, in which the teaching of phonics is less than systematic and which enables only a rather small proportion of children taught by this method to tackle unfamiliar words – i.e. to have mastered phonics and thus to have become independent readers – by the end of Key Stage 1. Indeed, analysis shows that little credence can be attached to Douëtil’s assertion that, by receiving Reading Recovery, “…these children have learned how to overcome the effects of dyslexia”. The conclusion must therefore be that Reading Recovery is unlikely to be an effective intervention for dyslexia.
In fairness, it must be added that few of the phonics-based interventions analysed in chapter 3 have been evaluated specifically with children who have dyslexia either. Those schemes therefore also need to be researched more rigorously. However, those schemes do provide evidence suggesting that, on balance, phonics-based programmes are more likely to benefit children with dyslexia because they are designed to tackle the central phonological problem.
120 Intervention for Dyslexia

6 Computer technology and support of older dyslexic pupils
6.1 Dyslexic difficulties in secondary school Older students with dyslexia continue to face difficulties in learning even if they have received appropriate intervention and have been able to improve their literacy skills significantly as a result (Hunter-Carsch & Herrington, 2001; Riddick, Farmer & Sterling, 1997). Difficulties with tasks involving phonological processing and/or verbal memory tend to persist not only into the teenage years (Goulandris & Snowling, 2001) but also into adulthood (see Beaton, McDougall & Singleton, 1997). The typical adolescent dyslexic will have poor phonic skills, below average word reading skills, average or slightly below average reading comprehension, and very slow reading speed. Spelling is liable to be very weak, and the student will be likely to experience major problems in constructing written work. There may also be problems in mathematics and foreign language learning. Memory will be weak, with consequent problems in rote learning for assessment, and recall in exams is liable to be poor. Organisational and study skills will also be rather limited.
6
7
8
9
10
11
12
13
14
15
16
17
1 2 3
Figure 10. Progress in reading age (dotted line) compared with chronological age (solid line) of a group of 18 dyslexic students studied from chronological age 9 (time 1) to age 12 (time 2) to age 15 (time 3) (data from Goulandris & Snowling, 2001)
Goulandris & Snowling (2001) followed up a group of 18 dyslexic children from age 9 to age 15 and found that none of them had fully overcome their problems and been able to catch up with their peers, despite apparent positive motivation and self-image. The results for reading are shown in Figure 10, and indicate that the gap between them and their peers (who would be expected mostly to have reading ages within a year of their
Intervention for Dyslexia 121
chronological age) did not narrow: in fact, it increased slightly. The results for spelling were worse: at the end of the five-year study the average spelling age of these students was 10 years 5 months, some 5 years and 5 months behind the mean of their age group.
Hunter-Carsch (2001) has reviewed ways in which dyslexic students can be effectively supported in secondary schools. She outlines several main areas of activity that will need careful attention if students’ learning and achievements are to be maximised, including:
Differentiation in writing activities with emphasis on systematic drafting and redrafting
Peer tutoring in which dyslexic students are paired with peers who have good literacy skills and the pairs work together on reading, spelling and writing activities
Use of computer technology, especially for spell checking, organisation of written work, drafting and redrafting
Specialised spelling support: Hughes and Hunter-Carsch (2001) have detailed several ways in which secondary-age students can be taught to improve their spelling skills; Ferrier (2008) has shown how synthetic phonics can be used to teach spelling to dyslexic teenagers, and Brooks (2007) lists six phonics-based schemes which have been used at secondary level
Raising awareness of subject teaching staff and training in practical ways of differentiating work for dyslexic students
Parental support and home-school liaison.
It is clear that conventional instruction still plays a significant part in assisting the older dyslexic student to address their literacy difficulties and general problems with learning. However, these, and many other, professionals in this field also advocate the use of computer technology to enhance and support learning in the secondary school.
6.2 Use of computers in instruction Computers can be used as part of the instructional process in order to help children learn basic skills and curriculum-related material (commonly known as ‘computer assisted learning’ or CAL, for short), and also to facilitate reading, writing and the organisation of information by means of technologies such as text-to-speech, voice input and planning tools. The former is often called ‘computer assisted learning’ (CAL) and most CAL programs in this field are designed for primary-aged pupils. Indeed, several of the successful phonologically-based intervention studies already covered in this review have made good use of CAL (see Sections 3.3.1, 3.3.2, 3.3.3, 3.3.10). The latter is often referred to more generically as ‘assistive technology’, although that label also may include digital technology other than personal computers (e.g. digital voice recorders, hand-held spelling checkers, dictionary pens).
122 Intervention for Dyslexia
6.2.1 The advantages of computer assisted learning (CAL) for dyslexics
Developing effective literacy skills requires large amounts of practice for all children, regardless of whether they struggle with literacy. Without practice, component skills do not become well established so that they can be applied automatically and without conscious effort – a key feature of fluency in reading, spelling and writing (see Section 2.6.6). Children who lag behind in literacy development, as dyslexics do, gain far less practice than other children (Torgesen, Rashotte & Alexander, 2001) and consequently it is increasingly difficult for them to catch up with their peers. Computers have the particular advantage of being able to deliver large amounts of practice in a stimulating and enjoyable way, and thus offer improved prospects of catching up.
Singleton (1991) identified five principal advantages of CAL for dyslexic learners:
Enhanced motivation
Individualised instruction
Delivery of immediate informative feedback
Provision of an active learning environment
Capacity to monitor the pupil’s performance in real time.
It is outside the scope of this review to list all the many CAL programs designed to provide practice in the component skills of reading and spelling. Interested readers are referred to reviews by Crivelli (2008), and Crivelli, Thomson and Andersson (2004). However, the positive features of CAL may be illustrated by examining a single investigation in this field. Singleton and Simmons (2001) reported a study of the use of the program ‘Wordshark’ in 403 primary and secondary schools. Wordshark is a popular CAL program, currently used in around 20% of UK schools. It provides training in word recognition and developing phonic skills for reading and spelling, using a wide range of different games that are entertaining as well as challenging. The program includes different wordlists, including those drawn from the intervention programme ‘Alpha to Omega’ (Hornsby & Shear, 1974), from the original National Literacy Strategy materials, and from the ‘Letters and Sounds’ framework for teaching synthetic phonics. Thus the program is sufficiently flexible to be used with any of these teaching schemes. Type of speech feedback (whole-word or segmented) varies according to the particular task. Wordshark is not designed to be used in isolation or as a stand-alone intervention; rather, the aim is that it should be used to provide regular practice for the child in order to reinforce and consolidate phonic principles that are newly acquired from teacher delivered instruction. To use Wordshark the teacher first identifies the phonic components that the child needs to learn, and the child then selects games that provide practice on those components. Thus instruction is individualised according to the child’s needs. The child’s progress is also continuously monitored by the program so that the teacher can decide when to move the child on to new components.
The motivational aspects of Wordshark are immediately apparent. An example is the game called ‘Sharks’, in which the child uses the mouse pointer first to ‘catch’ a shark (whilst avoiding being ‘eaten’): this requires some manual dexterity. When a shark is ‘caught’ the computer says a word from the current word list and the child has to type in the word. Various supports are provided. When the child gets the word correct the shark is rendered harmless (it loses its teeth). Another example of a game in Wordshark is
Intervention for Dyslexia 123

‘Dictionary Fish’, in which various dictionary skills are practised. The aim is to select the correct part of the dictionary for a given word, whereupon the child can steer a parent fish through a barrier, with the baby fish shoaling after. The aim is to be swift enough to save the babies from the marauding sharks. Singleton and Simmons (2001) found that children’s motivation was improved by engaging in these activities, with 68% of children showing significantly increased motivation and a further 26% showing slightly increased motivation. Van Daal and Reitsma (2000) have reported comparable motivational benefits in a study of a similar type of CAL program used with dyslexic children in the Netherlands. Many other researchers and practitioners have observed the same motivational effects with dyslexic children (e.g. Crivelli, Thomson & Andersson, 2004; Rooms, 2000; Thomson & Watkins, 1990). Hedley (2004) also reported that use of ILS significantly enhances self-esteem of secondary school pupils with literacy difficulties.
The above examples of games in Wordshark also illustrate how the program provides an active learning environment with immediate informative feedback, which may be contrasted with the passive learning environment encountered when carrying out learning activities using conventional book-based or pen-and-paper materials. Of course, in conventional learning tasks the teacher can provide feedback but, except in group work or 1:1 tuition, this is often delayed, reducing its effectiveness in consolidating learning. Singleton and Simmons (2001) also found that 91% of children using Wordshark made improvements in reading skills, including 27% who made substantial improvement. 93% made improvements in spelling, including 36% who made substantial improvement.
6.2.2 Speech feedback
Roth and Beck (1987) were among the first to show that computer programs designed to provide training in word recognition and decoding could result not only in improvements in those skills but also in better comprehension. These authors pioneered the use of digitised speech for both corrective feedback and for assistance when the child is unsure how to proceed. Children (age 9–10 years) with average or below average reading ability showed significant gains, even though they each spent a modest amount of time using the software (about 20–24 hours in total over eight months). It was concluded that such programs can be very cost-effective and could also help older failing readers. Reitsma (1988) found that optional speech feedback – where the spoken form of any word is given by the computer on request – improved the reading ability of 7-year-old beginning readers as much as traditional classroom ‘guided reading’ (i.e. where children read aloud and errors are corrected by a teacher). Subsequent studies confirmed the general importance of speech feedback in computer-assisted literacy learning (e.g. Miles, 1994; Moseley, 1990; Olofsson, 1992; Olson and Wise, 1992; Wise et al., 1989). However, the issue of what type of speech feedback is most effective has proved to be tricky. In a long-term training study with poor readers (mean age 10 years), Wise et al. (1989) found that segmented feedback (i.e. where words are broken down into syllables, onsets and rimes, etc.) was superior to whole-word feedback. However, later studies did not find such an advantage for syllable-segmented feedback (Olson and Wise, 1992; Spaai, Ellermann and Reitsma, 1991; Elbro, Rasmussen and Spelling, 1996).
Subsequent research has shown that there is clearly a role within software designed to improve reading skills for both types of feedback. Some programs, such as Wordshark and Leescircus (Van Daal & Reitsma, 2000) have incorporated both types of feedback, while phonics training programs have mainly used segmented feedback (e.g. Wise, Ring
124 Intervention for Dyslexia
and Olson, 2000). Software designed for beginning readers, especially ‘talking books’ (see Lewin, 1997, 1998, 2000; Underwood, 2000; Underwood & Underwood, 1998) and also programs designed to develop word recognition and text reading skills in older students (e.g. Davidson & Noyes, 1994; Davidson, Coles, Noyes & Terrell, 1991) have mainly relied on whole-word feedback.
6.2.3 Integrated Learning Systems
CAL is often seen at its most advanced in Integrated Learning Systems (ILSs). An ILS incorporates assessment and diagnosis of student skills, delivery of carefully structured learning materials via a computer network, continuous monitoring of performance and automatic adjustment of instruction where required, and generation of individual and group performance data for use by teachers and administrators (Willis, Stephens and Matthews, 1996; Brown, 1997). ILSs have been widely adopted in the USA, but the take-up in the UK has been more cautious, partly because they are very expensive, and partly because there have been reservations about their effectiveness. However, Van Dusen and Worthen (1994) argued that the dearth of positive results from evaluations is not necessarily because ILSs are inherently ineffective, but rather because implementation of the systems has been too weak. UK studies of ILSs have been evaluated by Wood and colleagues, who concluded that, while investigations have failed to produce overall convincing evidence for educational gains of ILSs, some studies have shown positive benefits (Wood, 1998; Wood, Underwood and Avis, 1999). Underwood (2000), in comparing an ILS and a talking book for developing reading skills of primary school children, found that both methods were highly motivating for children and resulted in gains in reading.
Lewis (1999) has reviewed the evidence from eight different research studies on the use of ILS with students with learning difficulties in the UK. The results were mixed, but overall this analysis also failed to produce clear evidence that ILS, as used in these particular studies, has significant benefits for children with special needs. On the other hand, Williams (2001) reported a study of using ILS to develop skills of 200 secondary school pupils with poor literacy; improvement was noted in self-esteem as well as learning. However, perhaps most importantly, all these authors agree that there are good reasons to expect that the effects of an ILS will be mediated and strongly influenced by classroom practice. Miller, DeJean and Miller (2000) highlight how the embedded curricula in an ILS may sometimes be congruent with those of the school or the teacher, but often may be at variance with them, with potentially negative consequences.
On the basis of current evidence there is little to support the use of ILS with dyslexic pupils. It would appear that, as a learning activity, ILS is too generic and insufficiently focused on the needs of pupils with SEN, although if properly integrated within the curriculum so that it complements conventional teaching, it might be a useful (if expensive) way of enabling non-SEN children to practise and apply their literacy skills. Clearly further research is required on this topic.
6.3 Research on computer-based interventions with dyslexic children
The most comprehensive review of the use of computer technology on literacy was conducted by Torgerson and Zhu (2003). Meta-analysis was limited to those with RCT
Intervention for Dyslexia 125
designs and employing children aged 5–16; 12 such studies were identified but, overall, effect sizes were not significantly different from zero. Dynarski et al. (2007) also drew similar conclusions from a large-scale national review in the USA. However, against the rather dismal picture regarding the efficacy of computer technology as a means of educational instruction painted by Torgerson and Zhu (2003) and Dynarski et al. (2007) must be set the results of studies that have focused specifically on children with learning disabilities or dyslexia.
Lewis, Graves, Ashton & Kieley (1998) carried out a study of children’s writing and spelling using training in word processing. 108 children from grades 4 to 8 with learning disabilities received one hour of training per week over 20 weeks. Compared with a control group the trained group showed significant improvements in writing skills, most notably in the amount of spelling errors they made when writing, but with a rather small effect size (ES 0.28).
There have been several notable reviews on the use of computer technology to improve the spelling skills of children with learning disabilities. Fulk and Stormont-Spurgin (1995) reviewed published research on spelling interventions for pupils with learning disabilities, and noted that eight of a total of nine separate studies that used CAL reported positive effects of CAL. In a more recent systematic review and meta-analysis of the field, Torgerson and Elbourne (2002) concluded that at best there was only a modest effect of CAL on spelling development. McArthur et al. (2001) reviewed published data on the use of computers to teach or support literacy in samples of students with learning difficulties. The authors concluded that ‘cautious optimism’ was justified regarding the potential of technology to improve the literacy skills of such students. Wanzek et al. (2006) carried out a review of seven spelling interventions for children with learning disabilities that involved use of computers. Overall, interventions involving spelling with assistive technology using speech feedback, word prediction and spell checking yielded positive effects on students’ spelling.
Van Daal and Reitsma (2000) report on two studies using Leescircus, an interactive CAL program for Dutch children which is similar to Wordshark (although a Dutch version of Wordshark has now been developed). Leescircus comprises a variety of different games designed to draw children’s attention to the phonological structure of words, to learn the correspondences between letters and sounds, and to develop automaticity in word reading and spelling. In the first study, a group of kindergarten children (about 6.5 years) were given regular opportunities to use the program and their reading progress was compared with a control group. At post-test, the experimental group was found to significantly out-perform the control group on both word reading and decoding (non-word reading). During the project, the children spent a total of 1.5–6 hours using the program, and yet the level of reading competence that was achieved was equivalent to that which was normally attained after three months of formal reading instruction. In the second study, a group of learning disabled children (mean age 10.7 years) who had serious spelling difficulties and were experiencing motivational problems used the Leescircus program. The children made significant improvements in spelling and were also found to display more positive behaviours when working with the computer compared with normal classroom activities.
Tijms, Hoeks, Paulussen-Hoogeboom & Smolenaars (2003) reported on a study using LEXY, a highly structured CAL program designed to help dyslexic people learn to recognize and use the phonological and morphological structure of Dutch words. Of the total of 100 dyslexic participants in the study, 83 were of school age. The intervention involved weekly 45-minute computer-based teaching sessions during each of which a
126 Intervention for Dyslexia
new phonic principle was introduced; the participants were also expected to engage in three 15-minute sessions of additional practice at home each week. Results showed that, after 26 weeks of intervention, word reading and text reading were both significantly improved, with moderately large effect sizes (word reading ES 0.54; text reading ES 0.66). Spelling was also significantly improved with a very large effect size (2.15), although there was subsequent washout that reduced the magnitude of this gain somewhat. Tijms (2004) reported on a further study that replicated the earlier findings. Participants showed stable improvements in reading over a period of one to four years after intervention. However, although the gains were substantial, the average reading level of the participants remained below normal levels at the end of the study and thereafter.
A further study of LEXY with 267 Dutch children with dyslexia aged 10–14 years (Tijms & Hoeks, 2005) employed the same design as used by Tijms et al. (2003). The results revealed large, generalized beneficial effects of the intervention, with effects being largest for accuracy, somewhat smaller for fluency. Text reading errors were reduced by 50%, with mean standard scores of reading accuracy increasing from 84 at pre-test to 106 at post-test. Spelling errors were reduced by 80%, with mean standard scores of spelling accuracy increasing from 54 at pre-test to 102 at post-test. Text reading fluency increased more than 25% (SS increase from 61 to 85) and word reading rate by 30% (SS increase from 77 to 88).
Wise, Ring and Olson (2000) studied 200 children in 2nd to 5th grades (age range 7–11 years) who spent 29 hours using a CAL reading intervention program over approximately 6 months. The children were assigned to one of two conditions: a phonologically-based training condition, and a contextual reading condition that emphasized comprehension strategies. The results showed that children who had received the phonologically-based computerized instruction gained significantly more in phonological skills (ES 0.7), phonic decoding (ES 1.0) and untimed word reading ability (ES 0.52), although children who had received the contextual reading intervention were better at timed word reading (ES 0.32).
Lundberg (1995) studied the impact of speech feedback in a CAL program used with a total of 83 poor readers in grades 2 to 8 in Sweden, who regularly used the program 2-3 times per week over the school year. The total amount of computer-based practice averaged about 30 hours. When compared with a group of 59 control children who had received conventional special education without computer training, the group that had received computer-based practice showed gains in reading and spelling, but this was significant only for the students in grade 8.
Nicolson, Fawcett & Nicolson (1999) evaluated a computer-based literacy intervention program called RITA (Reader’s Intelligent Teaching Assistant) with 74 pupils in primary schools (see Section 3.3.2). The computer program RITA does not replace the teacher; rather the teacher uses RITA to specify activities for the child to work through, and RITA stores and analyses the results of the student’s work. Over a 10-week intervention period, and in comparison with control groups matched on age and reading ability, the RITA study produced effect sizes for reading of 0.30–1.34 and for spelling of 0.77–0.98. The authors concluded that this was a successful highly cost-effective intervention. Lynch, Fawcett & Nicolson (2000) also reported significant improvements in reading and spelling for a small group of 8 severely dyslexic secondary school pupils who were taught using RITA.
Intervention for Dyslexia 127
6.4 Studies of assistive technology with older dyslexic students
Miles, Martin and Owen (1998) reported on a study of the effects of using voice dictation software with dyslexic pupils. 12 dyslexic pupils in secondary schools in Devon were studied over a 10-week period. The findings showed that these pupils made an average gain of 13.4 months in reading age (ratio gain 5.4), and 6.1 months in spelling (ratio gain 2.4), and produced 45% more written output in handwriting work than they had before the outset of the project.
Sutherland and Smith (1997) carried out a survey of the use of portable word processors by dyslexic students in secondary schools. They found that 88% of the subject teachers who were teaching these students noted significant improvements in presentation and readability of their work, and 78% observed improvements in their spelling.
Lange, McPhillips, Mulhern and Wylie (2006) studied 93 secondary school pupils with reading difficulties in Northern Ireland. All were below average in reading and 43% were in the lowest 10% of readers (standard score <80). Students were assigned to one of three conditions, with matching across conditions for reading, spelling, verbal and non-verbal IQ, gender and socio-economic status. The intervention group received 45-minute training sessions in using the computer program Texthelp Read&Write GOLD once each week for six weeks. Texthelp Read&Write GOLD is a talking word processor that includes scan-and-read capability, spellchecker, dictionary, and other study tools and visual features. The two other conditions served as controls, and the students in these groups engaged in training activities using Microsoft Word. The results, on tests of text reading comprehension, word meanings and spelling accuracy, showed significant benefits of the Texthelp Read&Write GOLD intervention when compared with the other two groups, indicating that assistive technology can be beneficial for students with dyslexia.
Lewis (2007) compiled a report on the Technology for Learning Disabilities project being carried out in schools under the auspices of Central Washington University over the school years 2005–06 and 2006–07. The technology being used to support writing was ‘Texthelp Read&Write GOLD’. The participants were learning disabled students in grades 6 to 12. Over the course of the first year of the project the students (N=53) were found to have significantly improved on every writing assessment component except keeping sentences on topic. There was a 39% increase in number of words written in the test, and a 10% increase in spelling accuracy. At the end the second year of the study the students who had been using Texthelp Read&Write GOLD were found to have significantly improved their scores from pre-test to post-test on every component of the writing assessment, and also to score significantly higher than a comparison group on every aspect of the writing assessment. In the post-test the Texthelp Read&Write GOLD group produced 60% more words in their writing than the comparison group, and their spelling accuracy was also 8% better.
6.5 Conclusions The impact of computer assisted learning on the development of literacy in children with dyslexia or learning disabilities has been found to vary from study to study. There is little evidence that large-scale Integrated Learning Systems are helpful for pupils with dyslexia, but smaller-scale, more carefully targeted CAL programs can have significant
128 Intervention for Dyslexia

impact on reading and spelling, particularly when programs incorporate speech feedback. In addition, CAL can have motivational benefits for children with dyslexia.
The difficulties that most, if not all, dyslexic students encounter in secondary school may be addressed using a variety of support techniques. Conventional instruction and training can still have a significant role in this work, but, increasingly, assistive technology is used to support the learning of older dyslexics. Research studies on this are rather thin on the ground, but those that have been published indicate that word processing activities, especially those in which there are enhanced supportive features,15 significantly improve writing and spelling skills.
15 Enhanced supportive features for word processing include voice dictation, text-to-speech, and sophisticated spell checking that identifies ‘dyslexic-type’ errors; conventional spelling checkers are really designed to identify typing errors rather than spelling errors and rarely provide appropriate corrections for phonological errors (e.g. ‘sitee’ will not be identified by a conventional spell checker as a misspelling of ‘city’).
Intervention for Dyslexia 129

References Adams, M J. (1991) Why not phonics and whole language? In W. Ellis (Ed.) Whole language and the creation of literacy. Baltimore: Orton Dyslexia Society, pp. 40-53.
Ainley, J., Fleming, M. & McGregor, M. (2002) Three years on: Literacy advances in the early and middle primary years. Melbourne, Australia: Catholic Education Commission of Victoria.
Alexander, A., Anderson, H., Heilman, P.C., Voeller, K.S. & Torgesen, J.K. (1991) Phonological awareness training and remediation of analytic decoding deficits in a group of severe dyslexics. Annals of Dyslexia, 41, 193-206.
Anand, V. & Bennie N. (2004) Annual monitoring of Reading Recovery: the data for 2002. Wellington, New Zealand: Ministry of Education.
Anand, V. & Bennie N. (2005) Annual monitoring of Reading Recovery: the data for 2003. Wellington, New Zealand: Ministry of Education.
Aubrey, C., Eaves, J. Hicks, C. & Newton, M. (1981) The Aston Portfolio. Cambridge: LDA.
Augur, J. & Briggs, S. (1992) The Hickey Multisensory Language Course. Bath: Educational Publishers.
Baenen, N., Bernhole, A., Dulaney, C. & Banks, K. (1997) Reading Recovery: Long-term progress after three cohorts. Journal of Education for Students Placed at Risk, 2, 161.
Baker, S., Berninger, V.W., Bruck, M., Chapman, J., Eden, G. & Elbaum, B., et al. (2002) Evidence-based research in Reading Recovery: Letter to members of the US Congress signed by 31 reading researchers. www.dys-add.com/RR4.pdf
BDA (2007) British Dyslexia Association Policy on the Early Identification of Specific Learning Difficulties. www.bdadyslexia.org.uk/downloads/EarlyIDPolicyNov07.pdf
Beaton, A.A., McDougall, S. & Singleton, C.H. (Eds.) (1997) Dyslexia in Literate Adults. Special Issue of the Journal of Research in Reading, 20 (1).
Beech, J.R. & Singleton, C.H. (Eds.) (1997) Psychological Assessment of Reading. London: Routledge.
Bell, N. (1991) Visualizing and verbalizing for language comprehension and thinking. San Luis Obispo, CA: Gander Publishing.
Bell, S.M., McCallum, R.S. & Cox, E.A. (2003) Toward a research-based assessment of dyslexia: using cognitive measures to identify reading. Journal of Learning Disabilities, 36, 505-517.
Berninger, V.W., Abbott, R., Whitaker, D., Sylvester, L. & Nolen, S. (1995) Integrating low-level skills and high-level skills in treatment protocols for writing disabilities. Learning Disability Quarterly, 18, 293-309.
130 Intervention for Dyslexia

Berninger, V.W., & Hidi, S. (2006) Mark Twain writers’ workshop: A nature-nurture perspective in motivating students with learning disabilities to compose. In S. Hidi & P. Boscolo (Eds.) Motivation in Writing. Dordtrecht, The Netherlands: Kluwer Academic Publishers, pp. 159-179.
Berninger, V.W., Winn, W.D., Stock, P., Abbott, R.D., Eschen, K., Lin, S-J., Garcia, N., Anderson-Youngstrom, M, Murphy, H., Lovitt, FD., Trivedi, P., Jones, J., Amtmann, D. & Nagy, W. (2008) Tier 3 specialized writing instruction for students with dyslexia. Reading and Writing, 21, 95-129.
Beynon J and Mackay H (1993) More questions than answers. In J Beynon and H Mackay (Eds) Computers into Classrooms. Falmer Press, London.
Bishop, D. V. M. (2007) Curing dyslexia and ADHD by training motor co-ordination: Miracle or myth? Journal of Paediatrics and Child Health, 43, 653-655.
Bishop, D. V. M. (2008) Treating reading disability without reading: evaluating alternative intervention approaches. Keynote address delivered at the 7th International Conference of the British Dyslexia Association, Harrogate, March 2008.
Boscadin, C.K., Muthén, B., Francis, D.J. & Baker, E.L. (2008) Early identification of reading difficulties using heterogenous developmental trajectories. Journal of Educational Psychology, 100, 192-208.
Bouldoukian, J., Wilkins, A. J. and Evans, B. J. W. (2002) Randomized controlled trial of the effect of coloured overlays on the rate of reading of people with specific learning difficulties. Ophthalmic & Physiological Optics, 22, 55–60.
Bowyer-Crane, C., Snowling, M.J., Duff, F.J., Fieldsend, E., Carroll, J.M., Miles, J, Götz, K, & Hulme, C. (2008) Improving early language and literacy skills: differential effects of an oral language versus phonology with reading intervention. Journal of Child Psychology and Psychiatry, 49, 422-432.
Bradley, L. & Bryant, P. (1985). Rhyme and reason in reading and spelling. Ann Arbor, MI: University of Michigan Press.
Briggs, C., & Young, B.K. (2003) Does Reading Recovery work in Kansas? A Retrospective Longitudinal Study of Sustained Effects, Journal of Reading Recovery, 3, 59–64.
Bristol Learning Support Service (2005) Evaluation of Wave 3 Literacy Initiative 2004 – 2005. www.bristol-cyps.org.uk/teaching/sen/pdf/sen_wave3_report.pdf
Brooks, G., Flanagan, N., Henkhuzens, Z. & Huchison, D (1998) What works for slow readers? The effectiveness of early intervention schemes. Slough: NFER.
Brooks, G. (2007) What works for pupils with literacy difficulties? The effectiveness of intervention schemes (3rd edition). London: Department for Children, Schools and Families.
Brooks, G., Harman, J. and Harman, M. (2003) Catching Up at Key Stage 3: an evaluation of the Ruth Miskin [RML2] pilot project 2002/2003. A report to the Department for Education and Skills. Sheffield: University of Sheffield.
Intervention for Dyslexia 131
Brown, J. (1997) When is a system an ILS? In J. Underwood & J. Brown (Eds.) Integrated Learning Systems: Potential into practice. London: Heinemann.
Burroughs-Lange, S. (2006) Evaluation of Reading recovery in London schools: Every Child A Reader 2005–2006. London: Institute of Education.
Burroughs-Lange, S. & Douëtil, J. (2007) Literacy progress of young children from poor urban settings: A Reading Recovery comparison study. Literacy Teaching and Learning, 12, 19-46.
Carran, D.T. and Scott, K.G. (1992) Risk assessment in preschool children: Research implications for the early detection of educational handicaps. Topics in Early Childhood Special Education, 12, 196-211.
Carter, M. & Wheldall, K. (2008) Why Can't a Teacher Be More Like a Scientist? Science, Pseudoscience and the Art of Teaching. Australasian Journal of Special Education, 32, 5-21.
Catts, H.W., Fey, M.E., Tomblin, J.B. & Zhang, X. (2001) Estimating the risk of futire reading difficulties in kindergarten children: A research-based model and its clinical implications. Language, Speech and Hearing Services in Schools, 32, 38-50
Catts, H.W. & Hogan, T.F. (2003) Language basis of reading disabilities and implications for early identification and remediation. Reading Psychology, 24, 223-246.
Center, Y., Freeman, L., & Robertson, G. (2001) The relative effect of a code-oriented and a meaning-oriented early literacy program on regular and low progress Australian students in year 1 classrooms which implement Reading Recovery. International Journal of Disability, Development and Education, 48, 207–232.
Center, Y., Wheldall, K., & Freeman, L. (1992) Evaluating the effectiveness of Reading Recovery: A critique. Educational Psychology, 12, 263-273.
Center, Y., Wheldall, K., Freeman, L., Outhred, L. & McNaught, M. (1995) An experimental evaluation of Reading Recovery. Reading Research Quarterly, 30, 240-263.
Chapman, J., Tunmer, W.E. & Prochnow, J.E. (2001) Does success in the Reading Recovery program depend on developing proficiency in phonological-processing skills? A longitudinal study in a whole language instructional context. Scientific Studies of Reading, 5, 141–176.
Chard, D.J., Vaughn, S. & Tyler, B. (2002) A synthesis of research on effective interventions of building reading fluency with elementary students with learning disabilities. Journal of Learning Disabilities, 35, 386-406.
Clay, M.M. (1985) The early detection of reading difficulties. Auckland, NZ: Heinemann.
Clay, M.M. (1987) Learning to be learning disabled. New Zealand Journal of Educational Studies, 22, 155-173.
Clay, M.M. (1991) The early detection of reading difficulties. (3rd edition) London: Heinemann.
132 Intervention for Dyslexia
Clay, M.M. (1993a) Observation Survey of Early Literacy Achievement. London: Heinemann.
Clay, M.M (1993b) Reading recovery, a guidebook for teachers in training. London: Heinemann.
Clay, M.M. (2002) An observation survey of early literacy achievement, 2nd edition. Auckland, NZ & Portsmouth, NH: Heinemann.
Clay, M.M. (2005) Literacy Lessons Designed for Individuals, Part Two, Teaching Procedures. Auckland, NZ: Heinemann.
Clay, M.M. (2006) An observation survey of early literacy achievement. Portsmouth, NH: Heinemann.
Clay, M.M. & Cazden, C.B. (1990) A Vygotskian interpretation of Reading Recovery tutoring. In L. Moll (Ed.) Vygostky and education: Instructional implications and applications of sociohistorical psychology. Cambridge: Cambridge University Press, pp. 206-222).
Clifford, V. & Miles, M (2004) AcceleRead AcceleWrite: A guide to using talking computers to help children to read and write.(2nd edition). Cambridge: Iansyst Ltd.
Cohen, J. (1988) Statistical power analysis for the behavioral sciences (2nd edition). Hillsdale, NJ: Lawrence Erlbaum Associates.
Connelly, V., Johnston, R.S. & Thompson, G.B. (2001) The effects of phonic instruction on the reading comprehension of beginning readers. Reading and Writing, 14, 423-457.
Cornelissen, P. & Singleton, C.H. (Eds) (2007) Visual factors in reading. Oxford: Blackwell.
Cowling, K. & Cowling, H. (1993) Toe by Toe: Highly Structured Multi-Sensory Reading Manual for Teachers and Parents. Toe by Toe Publications.
Crivelli, V. (2008) Using existing and new technology to support dyslexic children. In C.H. Singleton (Ed.) The Dyslexia Handbook. Bracknell, Berks: The British Dyslexia Association, pp. 81-88.
Crivelli, V. Thomson, M. & Andersson, B. (2004) Using information and communication technology (ICT) to help dyslexic children and adults. In G. Reid & A. Fawcett (Eds.) Dyslexia in Context: Research, Policy and Practice. London: Whurr, pp. 304-322.
D’Agostino, J.V., & J.A. Murphy, (2004) A Meta-Analysis of Reading Recovery in United States Schools. Educational Evaluation and Policy Analysis, 26, 23-38.
Darch, C., Kim, S. & Johnson, J.H. (2000) The strategic spelling skills of students with learning disabilities: The results of two studies. Journal of Instructional Psychology, 27, 15-26.
Davidson, J. Coles, D., Noyes, P. & Terrell, C. (1991) Using computer-delivered natural speech to assist in the teaching of reading. British Journal of Educational Technology, 22, 110-118.
Intervention for Dyslexia 133
Davidson, J. & Noyes, P. (1994) Computer-generated speech feedback as support for reading instruction. In C. H. Singleton (Ed.) Computers and Literacy Skills. Hull: Dyslexia Computer Resource Centre, University of Hull, pp. 120-136..
Davis, G.N., Lindo, E.J. & Compton, D.L. (2007) Children at risk for reading failure: Constructing an early screening measure. Teaching Exceptional Children, 39, 32-37.
DCSF (2008) Every Child a Reader – guidance for local authorities. London: DCSF Publications. http://nationalstrategies.standards.dcsf.gov.uk/node/89280
DeFord, D.E., Estice, R., Fried, M., Lyons, C.E. & Pinnell, G.S. (1993) The Reading Recovery program: Executive summary 1984-92. Columbus: The Ohio State University.
DeFord, D.E., Pinnell, G.S., Lyons, C.A., & Place, A.W. (1990) The Reading Recovery follow-up study, Vol. 11, 1987-89. Columbus: Ohio State University.
Denton, C.A., Fletcher, J.M., Anthony, J.L. & Francis, D.J. (2006) An evaluation of intensive intervention for students with persistent reading difficulties. Journal of Learning Disabilities, 39, 447-466.
Derrington, S. (2001a) Early Literacy Support Pilot: Evaluation report. Bristol: Bristol City LEA Achievement Division.
Derrington, S. (2001b) Report on the use of Phono-Graphix™ as a method of helping struggling readers at Key Stage 2. Bristol: Bristol City LEA Achievement Division.
DfES (2001) Special Educational Needs Code of Practice. London: DfES Publications.
DfES (2003) Targeting support: choosing and implementing interventions for children with significant literacy difficulties. Department for Education and Skills, Circular DfES 0201/2003.
Donley, J., Baenen, N., & Hundley, S. (1993) A study of the long-term effectiveness of the Reading Recovery Program. Paper presented at the annual meeting of the American Educational Research Association, Atlanta, GA.
Douëtil, J. (2003) Reading Recovery National Network National Monitoring 2002-2003. London: Institute of Education.
Douëtil, J. (2004) Reading Recovery Annual Report for the United Kingdom and Republic of Ireland: London: Institute of Education.
Douëtil, J. (2005) Reading Recovery Annual Report for UK and Ireland: 2004-2005. London: Institute of Education.
Douëtil, J. (2006) Reading Recovery Annual Report for UK and Ireland: 2005-2006. London: Institute of Education.
Douëtil, J. (2007a) Reading Recovery Annual Report for the UK and Republic of Ireland: 2006-2007. London: Institute of Education.
Douëtil, J. (2007b) International research on long- and short-term outcomes of Reading Recovery, and comparisons with other programmes. London: Institute of Education.
134 Intervention for Dyslexia

www.standards.dfes.gov.uk/primary/publications/literacy/pri_every_chld_rdr0003408/pri_ecar_research03408.pdf
Dyer, P.C. (1992) Reading Recovery: A cost-effectiveness and educational outcomes analysis. Spectrum: Journal of Research in Education, 10, 110-119.
Dynarski, M., Agodini, R., et al. (2007) Effectiveness of reading and mathematics software products: Findings from the first student cohort. Report to Congress. Institute of Educational Sciences National Center for Educational Evaluation and Regional Assistance.
ECaR (2006) Every Child A Reader: the results of the first year. London: Every Child A Reader. www.everychildareader.org/pubs/first_year_final.pdf
ECaR (2007) Every Child A Reader: the results of the second year. London: Every Child A Reader. www.everychildareader.org/pubs/second_year.pdf
ECaR (2008) Every Child A Reader: the results of the third year. London: Every Child A Reader. www.everychildareader.org/pubs/third_year.pdf
Ehri, L.C., Nunes, S.R., Stahl, S.A. & Willows, D.M. (2001) Systematic phonics instruction helps students learn to read: Evidence from the National Reading Panel’s meta-analysis. Review of Educational Research, 71, 393-447.
Elbaum, B., Vaughn, S., Hughes, M. & Moody, S. (2000) How effective are one-to-one tutoring programs in reading for elementary students at risk for reading failure? A meta-analysis of the intervention research. Journal of Educational Psychology, 92, 605-619.
Elbro, C., Borstrøm, I. & Petersen, D.K. (1998) Predicting dyslexia from kindergarten: the importance of distinctiveness of phonological representations of lexical items. Reading Research Quarterly, 33, 36-60.
Elbro, C. & Petersen, D.K. (2004) Long-term effects of phoneme awareness and letter-sound training: An intervention study with children at risk for dyslexia. Journal of Educational Psychology, 96, 660-670.
Elbro, C., Rasmussen, I. & Spelling, B. (1996) Teaching reading to disabled readers with language disorders: A controlled evaluation of synthetic speech feedback. Scandinavian Journal of Psychology, 37, 140–155.
Elliot, C.D., Smith, P., & McCulloch, K. (1996) British Ability Scales, second edition. London: GL Assessment.
Elliott, S.N., Huai, N. & Roach, A.T. (2007) Universal and early screening for educational difficulties: Current and future directions. Journal of School Psychology, 45, 137-161.
Esposito, K. (2004) Reading Recovery program deemed a failure. Isthmus, November 4, 2004. www.nrrf.org/rrp_failure_11-4-04.htm
Evans, B.J.W. (2001). Dyslexia and Vision. London: Whurr.
Everatt, J., Bradshaw, M.F. & Hibbard, P.B. (1999) Visual processing and dyslexia. Perception, 28, 243-254.
Intervention for Dyslexia 135

Fawcett, A.J. (2002a) Reading Remediation: An evaluation of traditional phonologically based interventions. A review for the Department for Education and Skills, the British Dyslexia Association and the Dyslexia Institute. Review 3. www.teachernet.gov.uk/_doc/6025/Dyslexia - Recent research development 3.doc
Fawcett, A.J. (2002b) Evaluating therapies excluding traditional reading and phonological based therapies. A review for the Department for Education and Skills, the British Dyslexia Association and the Dyslexia Institute. www.teachernet.gov.uk/_doc/6025/Dyslexia - Recent research development 2.doc
Fawcett, A. J. & Nicolson, R. I. (1996) The Dyslexia Screening Test. London: Psychological Corporation.
Fawcett, A.J., Nicolson, R.I. and Dean, P. (1996) Impaired performance of children with dyslexia on a range of cerebellar tasks. Annals of Dyslexia, 46, 259–283.
Fawcett, A.J., Nicolson, R.I., Moss, H., Nicolson, M.K. & Reason, R. (2001) Effectiveness of reading intervention in junior school. Educational Psychology, 21, 299-312.
Fawcett, A.J., Singleton, C.H. & Peer, L. (1998) Advances in early years screening for dyslexia in the UK. Annals of Dyslexia, 48, 29-60.
Ferrier, J. (2008) Tackling the spelling problems of dyslexics. In C.H. Singleton (Ed.) The Dyslexia Handbook. Bracknell, Berks: The British Dyslexia Association, pp. 63-70.
Fletcher, J.M., Foorman, B.R., Boudousquie, Barnes, M., Schatschneider, C., & Francis, D.J. (2002b) Assessment of reading and learning abilities: A research-based intervention-oriented approach. Journal of School Psychology, 40, 27-63.
Fletcher, J.M., Lyon, G.R., Barnes, M., Steubing, K.K., Francis, D.J., Olson, R.K, et al. (2002a) Classification of learning disabilities: An evidenced-based evaluation. In R. Bradley, L. Danielson & D. Hallahan (Eds.) Identification of learning disabilities: Research to practice. Mahwah, NJ: Erlbaum, pp. 185-202.
Foorman, B.R. (Ed.) (2003) Preventing and remediating reading difficulties: Bringing science to scale. Baltimore. MD: York Press
Foorman, B.R., Francis, D.J., Winikates, D., Mehta, P., Schatschneider, C., & Fletcher, J.M. (1997). Early interventions for children with reading disabilities. Scientific Studies of Reading, 1, 255–276.
Foorman, B.R., Francis, D.J., Fletcher, J.M., Schatschneider, C. & Mehta, P. (1998) The role of instruction in learning to read: Preventing reading failure in at-risk children. Journal of Educational Psychology, 90, 37-55.
Francis, H. (1992) Patterns of reading development in the first school. British Journal of Educational Psychology, 62, 225-232.
Fraser, H., MacDougall, A., Pirrie, A. & Croxford, L. (2001) National Evaluation of the Early Intervention Programme. Glasgow: Strathclyde University.
Frost, J., Madsbjerg, S., Niedersøe, J. & Olofsson, A. (2005) Semantic and phonological skills in predicting reading development: From 3–16 years of age. Dyslexia, 11, 79-92.
136 Intervention for Dyslexia

Frost, J. & Sørensen, P.M. (2007) The effects of a comprehensive reading intervention programme for Grade 3 children. Journal of Research in Reading, 30, 270-286.
Fuchs, D., Compton, D.L., Fuchs, L.S., Bryant, J. & Davis, G.N. (2008) Making ‘secondary intervention’ work in a three-tier responsiveness-to-intervention model: findings from the 1st grade longitudinal study of the National Research Center on Learning Disabilities. Reading and Writing, 21, 413-436.
Fuchs, D. & Fuchs, L.S. (2006) Introduction to Response to Intervention: What, why, and how valid is it? Reading Research Quarterly, 41, 93-99.
Fuchs, D., Fuchs, L.S., Thompson, A., Al-Otaiba, W.S., Yen, L., Yang, N. et al. (2001) Is reading important in reading-readiness programs? A randomised field trial with teachers as programs implementers. Journal of Educational Psychology, 93, 251-267.
Fuchs, L., & Fuchs, D. (1997) Use of curriculum-based measurement in identifying students with disabilities. Focus on Exceptional Children, 30, 1-16.
Fuchs, L., & Fuchs, D. (1998) Treatment validity: A unifying concept for reconceptualizing the identification of learning disabilities. Learning Disabilities Research and Practice, 13, 204-219.
Fuchs, L.S. & Fuchs, D. (2007) A model for implementing responsiveness to intervention. Teaching Exceptional Children, 39, 14-20.
Fudge, P. (2001) Reading Recovery in Bristol: an evaluation of the first two years of the initiative, 1999–2001. Bristol: Bristol LEA.
Fulk, B.M. (1996) The effects of combined strategy and attribution training on LD adolescents’ spelling performance. Exceptionality, 6; 13-27
Fulk, B.M. & Stormont-Spurgin, M. (1995) Spelling interventions for students with disabilities: A review. Journal of Special Education, 28, 488-513.
Gathercole, S.E., Alloway, T.P., Willis, C.S., & Adams, A.M. (2006) Working memory in children with reading disabilities. Journal of Experimental Child Psychology, 93, 265-281.
Glascoe, F.P. & Byrne, K.E. (1993) The accuracy of three developmental screening tests. Journal of Early Intervention, 17, 368-379.
Glynn, T., Crooks, T., Bethune, N., Ballard, K. & Smith, J. (1989) Reading Recovery in context. Wellington, New Zealand: Department of Education.
Gombert, J.E. (1992) Meta-linguistic development. London: Harvester/Wheatsheaf.
Gomez-Bellenge, F.X., Rodgers, E., & Fullerton, S.K. (2003) Reading Recovery and Descubriendo la Lectura national report 2001–2002. Columbus, OH: Ohio State University.
Gomez-Bellenge, F.X., & Rodgers, E.M. (2004) Reading Recovery and Descubriendo la Lectura national report 2002–2003. Columbus, OH: Ohio State University.
Intervention for Dyslexia 137
Gomez-Bellenge, F.X., Rodgers, E.M. & Schulzt, M. (2005) Reading Recovery and Descubriendo la Lectura national report 2003–2004. Columbus, OH: Ohio State University.
Good, R.H. & Kaminski, R.A. (2002) Dynamic Indicators of Basic Early Literacy Skills. (6th edition) Longmont, CO: Sopris West.
Goodman, K. S. (1986) What’s whole in whole language: A parent-teacher guide. Portsmount, NH: Heinemann.
Goouch, K. and Lambirth, A. (Eds) (2007) Understanding Phonics and the Teaching of Reading: critical perspectives. Maidenhead: Open University Press.
Gordon, J., Vaughn, S. & Schumm, J.S. (1993) Spelling interventions: A review of literature and implications for instruction for students with learning disabilities. Learning Disabilities Research & Practice, 8, 175-181.
Goulandris, N. & Snowling, M.J. (2001) Dyslexia in adolescence: A five-year follow-up study. In Hunter-Carsch, M. & Herrington, M. (Eds.) Dyslexia and effective learning in secondary and tertiary education. London: Whurr, pp. 3-11.
Gresham, F.M. (2002) Responsiveness to intervention: An alternative approach to the identification of learning disabilities. In R. Bradley, L. Danielson, & D. Hallahan (Eds.), Identification of learning disabilities: Research to practice (pp. 467-519). Mahwah, NJ: Lawrence Erlbaum.
Grimes, D. & Shultz, K. (2002) Uses and abuses of screening tests. The Lancet, 359, 881-884.
Groff, P. (2004) A critical analysis of the sources of Reading Recovery: an empiricist perspective. Interchange, 35, 31-58.
Grossen, B., Coulter, G. & Ruggles, B. (1997) Reading Recovery: an evaluation of benefits and costs. University of Oregon. www.darkwing.uoregon.edu/~bgrossen/rr.htm
Haenn, J. F. (2000) Reading Recovery: success for how many? Paper presented at the annual meeting of the American Research Association, New Orleans, LA.
Harris, K.R. & Pressley, M. (1991) The nature of cognitive strategy instruction: Interactive strategy construction. Exceptional Children, 57, 392-404.
Hasbrouck, J.E., Ihnot, C. & Rogers, G. (1999) Read Naturally: A strategy to increase oral reading fluency. Reading Research and Instruction, 39; 27-38
Haslum, M. (2007) What kind of evidence do we need for evaluating therapeutic interventions? Dyslexia, 13, 234-239.
Hatcher, P.J. (2000a) Sound Linkage (2nd edition). London: Pearson.
Hatcher, P.J. (2000b) Sound links in reading and spelling with discrepancy-defined dyslexics and children with moderate learning difficulties, Reading and Writing, 13, 257–72.
138 Intervention for Dyslexia
Hatcher, P.J. (2003) Reading Intervention: A ‘conventional’ and successful approach to helping dyslexic children acquire literacy. Dyslexia, 9, 140-145.
Hatcher, P.J., Hulme, C. & Ellis, A.W. (1994) Ameliorating early reading failure by integrating the teaching of reading and phonological skills: the phonological linkage hypothesis. Child Development, 65, 41–57.
Hatcher, P.J., Hulme, C., Miles, J.N.V., Carroll, J.M., Hatcher, J., Gibbs, S., Smith, G., Bowyer-Crane, C. and Snowling, M.J. (2006) Efficacy of small group reading intervention for beginning readers with reading-delay: A randomised controlled trial. Journal of Child Psychology and Psychiatry, 47, 820-827.
Hedley, I. (2004) Integrated Learning Systems: Effects on learning and self-esteem. In L.Forian & J.Hegarty (Eds.) ICT and Special Educational Needs. Maidenhead, berks: Open University Press, pp. 64-79.
Hickey, K. (1977) Dyslexia: A language training course for teachers and learners. Staines: The Dyslexia Institute.
Hiebert, Elfrieda. (1994) Reading Recovery in the United States: What Difference Does it Make to an Age Cohort? Educational Researcher, 23, 15-25.
IDA (2000) Multisensory teaching. Fact Sheet #69. International Dyslexia Association. www.interdys.org/ewebeditpro5/upload/Multisensory_Teaching.pdf
Hobsbaum, A. (1997) Reading Recovery in England. In S.L.Swatz & A.F.Klein (Eds.) Research in Reading Recovery. Portsmount, NH: Heinemann, pp. 132-147.
Horne, J.K. (2002) Development and evaluation of computer-based techniques for assessing children in educational settings. PhD thesis, University of Hull.
Horne, J.K., Singleton, C. H. & Thomas, K.V. (1999) LASS Secondary. Beverley, East Yorkshire: Lucid Research Ltd.
Hornsby, B. & Miles, T.R. (1980) The effects of a dyslexia-centred teaching programme. British Journal of Educational Psychology, 50, 236-242.
Hornsby, B. & Shear, F. (1974) Alpha to Omega. London: Heinemann.
Hughes, M. & Hunter-Carsch, M. (2001) Spelling support in secondary education. In M. Hunter-Carsch & M. Herrington (Eds.) Dyslexia and effective learning in secondary and tertiary education. London: Whurr, pp. 56-76.
Hunter-Carsch, M. (2001) Learning support in the secondary school: Needs analysis and provision for dyslexic students. In M. Hunter-Carsch & M. Herrington (Eds.) Dyslexia and effective learning in secondary and tertiary education. London: Whurr, pp. 12-37.
Hunter-Carsch, M. & Herrington, M. (2001) (Eds.) Dyslexia and effective learning in secondary and tertiary education. London: Whurr.
Hurry J. & Sylva, K. (2007) Long-term outcomes of early reading intervention. Journal of Research in Reading, 30, 227-248.
Intervention for Dyslexia 139

Hurry, J. & Sylva, K. (1998) The Long-term Effects of Two Interventions for Children with Reading Difficulties, London: Qualifications and Curriculum Authority.
Ihnot, C., Matsoff, J., Gavin, J. & Hendrickson, L. (2001) Read Naturally, St. Paul, MN: Read Naturally.
Irlen, H. (1983) Successful treatment of learning difficulties. Paper presented at the Annual Convention of the American Psychological Association, Anaheim, California.
Iversen, S., & Tunmer, W. (1993). Phonological Processing Skills and the Reading Recovery Program. Journal of Educational Psychology, 85, 112-126.
Jansky, J. J. (1977). A Critical Review of “Some Developments and Predictive Precursors of Reading Disabilities”. In A. L. Benton and D. Pearl (Eds.), Dyslexia. New York: Oxford University Press.
Jeanes, R., Busby, A., Martin, J., Lewis, E., Stevenson, N., Pointon, D. & Wilkins, A. (1997) Prolonged use of coloured overlays for classroom reading. British Journal of Psychology, 88, 531-548.
Jenkins, R.R., Peyton, J.A., Sanders, E.A. & Vadasy, P.F. (2004) Effects of reading decodable texts in supplemental first-grade tutoring. Scientific Studies of Reading, 8, 53-85.
Jeynes, W. & Littell, S. (2000) A meta-analysis of studies examining the effect of Whole Language instruction on the literacy of low-SES students. Elementary School Journal, 101, 21-33.
Johnson, L., Graham, S. & Harris, K.R. (1997) The effects of goal setting and self-instructions on learning reading comprehension strategy: A study with students with learning disabilities. Journal of Learning Disabilities, 30, 80-91.
Joshi, R.M. (2003) Misconceptions about the assessment and diagnosis of reading disability. Reading Psychology, 24, 247-266.
Kavale, K.A. (2005) Identifying specific learning disability: is responsiveness to intervention the answer? Journal of Learning Disabilities, 38, 553-562.
Kavale, K.A. & Forness, S.R. (2000) History, rhetoric, and reality: Analysis of the inclusion debate. Remedial and Special Education, 21, 279-296.
Kerslake, J. (1999) Trends in Reading Recovery data between 1984 and 1998. The Research Bulletin, 10, 72-78.
Kibel, M. (2000) Soundworks early literacy training programme. London: Collins.
Kingslake, B. (1982). The predictive (In) Accuracy of On-entry to school screening procedures when used to anticipate learning difficulties. Special Education, 10, 23-26.
Kirtley, C., Bryant, P., Maclean, M. & Bradley, L. (1989) Rhyme, rime and the onset of reading. Journal of Experimental Child Psychology, 48, 224–245.
Kriss, I. & Evans, B.J.W. (2005) The relationship between dyslexia and Meares-Irlen syndrome. Journal of Research in Reading, 28, 350-364.
140 Intervention for Dyslexia

Kuhn, M.R. & Stahl, S.A. (2003) Fluency: A review of developmental and remedial practices. Journal of Educational Psychology, 95, 3-21.
Lanes, D., Perkins, D., Whatmuff, T., Tarokh, H. and Vincent, R. (2005) A survey of Leicester City Schools using the RML1 and RML2 literacy programme. Leicester, Leicester City LEA.
Lange, A.A., McPhillips, M., Mulhern, G. and Wylie, J. (2006) Assistive Software Tools for Secondary-level Students With Literacy Difficulties. Journal of Special Education Technology, 21, 13-22.
Lerkkanen, M-K., Rasku-Puttonen, H., Aunola, K. & Nurmi, J-E. (2004) Reading performance and its developmental trajectories during first and second grade. Learning and Instruction, 14, 111-130.
Lewin, C. (1997) ‘Test driving CARS’: Addressing the issues in the evaluation of computer assisted reading software. Journal of Computing in Childhood Education, 8, 111–132.
Lewin, C. (1998) Talking book design: what do practitioners want? Computers and Education, 30, 87–94.
Lewin, C. (2000) Exploring the effects of talking book software in UK primary classrooms. Journal of Research in Reading, 23, 149-157.
Lewis, A. (1999) Integrated Learning Systems and pupils with low attainments in reading. British Journal of Special Education, 26, 153-157.
Lewis, C.K. (2007) Technology for Learning Disabilities Project: 2005–2007 Evaluation Report. Portland, OR: RMC Research Corporation.
Lewis, R. B., Graves, A.W., Ashton, T.M. & Kieley, C.L. (1998) Word processing tools for students with learning disabilities: A comparison of strategies to increase text entry speed. Learning Disabilities Research and Practice, 13; 95-108.
Lindamood, P. & Lindamood, P. (l998) The Lindamood Phoneme Sequencing Program for Reading, Spelling, and Speech. Austin, TX: PRO-ED, Inc.
Lipka, O., Lesaux, N.K. & Siegel, L.S. (2006) Retrospective analyses of the reading development of grade 4 students with reading disabilities: Risk status and profiles over 5 years. Journal of Learning Disabilities,39, 364-378.
Lore, P. (2001) Rapid reading improvement and phonological awareness training using Phono-Graphix at a specialist dyslexia school. Paper presented at the 5th International Conference of the British Dyslexia Association, University of York.
Lovett, M.W., Borden, S. L., Lacerenza, L., Benson, N. J. & Brackstone, D. (1994) Treating the core deficits of developmental dyslexia: Evidence of transfer of learning after phonologically-and strategy-based reading training programs. Journal of Educational Psychology, 30, 805-822.
Lovett, M.W., Lacerenza, L. & Borden, S.L. (2000) Putting struggling readers on the PHAST track: A program to integrate phonological and strategy-based remedial reading instruction and maximizing outcomes. Journal of Learning Disabilities, 33, 458-476.
Intervention for Dyslexia 141
Lovett, M.W., Lacerenza, L., Borden, S.L., Frijters, J.C., Steinbach, K.A. & DePalma, M. (2000). Components of effective remediation for developmental reading disabilities: Combining phonological and strategy-based instruction to improve outcomes. Journal of Educational Psychology, 92, 263-283.
Lovett, M.W. & Steinbach, K.A. (1997) The effectiveness of remedial programs for reading disabled children of different ages: Does the benefit decrease for older children? Learning Disability Quarterly, 20, 189-210.
Lundberg, I. (1995) The computer as a tool of remediation in the education of students with reading disabilities: A theory-based approach. Learning Disabilities Quarterly, 18, 89-99.
Lynch, L. Fawcett, A.J. & Nicolson, R.I. (2000) Computer-assisted reading intervention in a secondary school: An evaluation study. British Journal of Educational Technology, 31, 333-348.
Lyon, G.R. (1995) Towards a definition of dyslexia. Annals of Dyslexia, 45, 3-27.
Lyon, G.R., Fletcher, J.M. & Barnes, M (2002) Learning disabilities. In E.J. Marsh & R.A.Barkley (Eds.) Child Psychopathology (2nd edition). New York: Guildford, pp. 520-588.
Lyon, G.R., Fletcher, J.M., Fuchs, L. & Chabra, V. (2006) Learning disabilities. In E. Mash & R. Barkley (Eds.) Treatment of Childhood Disorders (3rd edition). New York: Guildford, pp. 512-591.
Lyon, G.R., Fletcher, J.M., Shaywitz, S.E., Shaywitz, B.A., Torgesen, J.K., Wood, F.B. et al. (2001) Rethinking learning disabilities. In C.E. Finn, R.A.J. Rotherham & C.R. Hokanson, Jr. (Eds.) Rethinking special education for a new century. Washington, DC: Thomas B. Fordham Foundation and Progressive Policy Institute.
Lyon, G. R., Shaywitz, S., & Shaywitz, B. (2003) A definition of dyslexia. Annals of Dyslexia, 53, 1–14.
Lyons, C. A. (2003) Reading Recovery in the United States: More than a decade of data. In S. Forbes & C. Briggs (Eds.) Research in Reading Recovery, Vol 2. Portsmount, NH: Heinemann, pp. 215-230.
Lyons, C.A. & Beaver, J. (1995) Reducing retention and learning disability placement through Reading Recovery: An educationally sound, cost-effective choice. In R. L. Allington & S.A. Walmsley (Eds.) No Quick Fix: Rethinking literacy programs in America’s elementary schools. Newark, DE: International Reading Association, pp. 116-136.
MacArthur, C.A., Ferretti, R.P., Okolo, C.M. & Cavalier, A. (2001) Technology applications for students with literacy problems: A critical review. Elementary School Journal, 101, 273-301.
MacKay, T. (2006) The West Dunbartonshire Literacy Initiative. The Design, Implementation and Evaluation of an Intervention Strategy to Raise Achievement and Eradicate Illiteracy: Phase 1 research report. Dumbarton: West Dunbartonshire Council.
142 Intervention for Dyslexia

Marks, A. & Burden, B. (2005) How Useful are Computerised Screening Systems for Predicting Subsequent Learning Difficulties in Young Children? An Exploration of the Strengths and Weaknesses of the Cognitive Profiling System (CoPS 1). Educational Psychology in Practice, 21, 327–342.
Mathes, P. G., Denton, C. A., Fletcher, J. M., Anthony, J. L., Francis, D. J., & Schatschneider, C. (2005) The effects of theoretically different instruction and student characteristics on the skills of struggling readers. Reading Research Quarterly, 40, 148–182.
Matthews, D. (1998) Special Initiative to Enhance Literacy Skills in Bridgend, Spring 1998. Bridgend: Bridgend County Borough Council Special Needs Services.
McDowall, S., Boyd, S. & Hodgen, E. (2005) Reading Recovery in New Zealand: Uptake, implementation, and outcomes, especially in relation to Mäori and Pasifika students. Wellington: New Zealand Council For Educational Research.
McGuinness, C. & McGuinness, D. (1998) Reading Reflex: The foolproof Phono-Graphix™ method for teaching your child to read. New York: Free Press.
McGuinness, C., McGuinness, D. & McGuinness, G. (1996) Phono-Graphix™: A new method for remediating reading difficulties. Annals of Dyslexia, 46, 73-96.
McNaughton, D., Hughes, C.A. & Clark, K. (1994) Spelling instruction for students with learning disabilities: Implications for research and practice. Learning Disability Quarterly, 17, 169-185.
Meares, O. (1980) Figure/ground brightness contrast and reading disabilities. Visible Language, 14, 13-29.
Meyer, M.S. (2000) The Ability–Achievement Discrepancy: Does it contribute to an understanding of learning disabilities? Educational Psychology Review, 12, 315-337.
Meyer, M.S. & Felton, R.H. (1999) Repeated reading to enhance fluency: Old approaches and new directions. Annals of Dyslexia, 49, 283-306.
Miles, E. (1989) The Bangor Teaching System. London: Whurr.
Miles, M. (1994) The Talking Computer Project. In C. Singleton (Ed.) Computers and Dyslexia. Hull: Dyslexia Computer Resource Centre, University of Hull, pp. 99-110.
Miles, T.R. (1995) Can there be a single definition of dyslexia? Dyslexia, 1, 37-45.
Miles, M., Martin, D. & Owen, J. (1998) A Pilot Study into the Effects of Using Voice Dictation Software with Secondary Dyslexic Pupils (Devon LEA, 1998). DfEE/Becta SEN Speech Recognition Project: Final Report, DfEE, 2000.
Miller, L., DeJean, J. & Miller, R. (2000) The literacy curriculum and use of an Integrated Learning System. Journal of Research in Reading, 23, 149-157
Moore, M., & Wade, B. (1998) Reading Recovery: Its effectiveness in the long term. Support for Learning, 13, 123–128.14
Intervention for Dyslexia 143

Morris, D., Tyner, B. & Perney, J. (2000) Early Steps: replicating the effects of a first-grade reading intervention program. Journal of Educational Psychology, 92, 681-693.
Moseley, D.V. (1990) Literacy: a technological breakthrough. In M. Hunter-Carsch et al. (Eds) Primary English in the National Curriculum. Blackwell: Oxford.
Moss, H. (2000). Using literacy development programs. In J. Townend & M. Turner (Eds.) Dyslexia in Practice: A guide for teachers. London: Kluwer Academic/Plenum Publishers, pp. 155-182.
National Institute of Child Health and Human Development (2000) Report of the National Reading Panel. Teaching children to read: An evidence-based assessment of the scientific research literature on reading and its implications for reading instruction (NIH Publication No. 004769). Washington, DC: U.S. Government Printing Office.
Nicholson, T. (2000) Reading the writing on the wall. Palmerston North, New Zealand: Dunmore Press.
Nicolson, R.I. and Fawcett, A.J. (1990) Automaticity: a new framework for dyslexia research. Cognition, 35, 159–182.
Nicolson, R.I. and Fawcett, A.J. (1995) Dyslexia is more than a phonological disability. Dyslexia, 1, 19–37.
Nicolson, R.I. & Fawcett, A.J. (1996) The Dyslexia Early Screening Test. London: The Psychological Corporation.
Nicolson, R.I. & Fawcett, A.J. (1999) Developmental Dyslexia: The Role of the Cerebellum. Dyslexia, 5, 155-177.
Nicolson, R.I., Fawcett, A.J., Moss, H., Nicolson, M.K. & Reason, R. (1999) Early reading intervention can be effective and cost-effective. British Journal of Educational Psychology, 69, 47-62.
Nicolson, R.I., Fawcett, A.J. & Nicolson, M.K. (2000) Evaluation of a computer-based reading intervention in infant and junior schools. Journal of Research in Reading, 23, 194–209.
Norgate, R. & Bentote, P. (2005) An evaluation of the SIDNEY intervention programme. Winchester: Hampshire Educational Psychology Service Lifelong Learning Team.
Northway, N. (2003) Predicting the continued use of overlays in school children – a comparison of the Developmental Eye Movement test and the Rate of Reading test. Ophthalmic and Physiological Optics, 23, 457-464.
Nysaeter, R. and Helland, T. (2008) Early cognitive markers of dyslexia. Paper presented at the 7th International Conference of the British Dyslexia Association, Harrogate, March 2008.
O’Connor, J. & Wilson, B. (1995) Effectiveness of the Wilson Reading System used in Public School Training. In C. McIntyre & J. Pickering (Eds). Clinical studies of Multisensory Structured Language Education. Salem, OR: International Multisensory Structured Language Education Council.
144 Intervention for Dyslexia

Olofsson, Å (1992) Synthetic speech and computer-aided reading for reading disabled children. Reading and Writing, 4, 165–178.
Olofsson, Ǻ. & Neidersøen, J. (1999) Early language development and kindergarten phonological awareness as predictors of reading problems. Journal of Learning Disabilities, 32, 464-472.
Olsen, J.B. (1990) Applying computerized adaptive testing in schools. Measurement and Evaluation in Counselling and Development, 23, 31-38.
Olson, R.K. and Wise, B.W. (1992) Reading on the computer with orthographic and speech feedback. An overview of the Colorado remediation project. Reading and Writing, 4, 107–144.
Ottley, P. & Bennett, L. (1997) Launch into Reading Success. London: The Psychological Corporation.
Paris, S.G. (2005) Reinterpreting the development of reading skills. Reading Research Quarterly, 40, 184-202.
Pennington, B.F. & Olson, R.K. (2005) Genetics of dyslexia. In M. Snowling & C. Hulme (Eds.) The Science of Reading: A Handbook. Oxford: Blackwell, pp. 453-472.
Pickering, S.J. & Gathercole, S.E. (2004). Distinctive working memory profiles in children with special educational needs. Educational Psychology, 24, 393-408.
Pinnell, G.S., Lyons, C.A., & DeFord, D.E. (1988). Reading Recovery: Early intervention for at-risk first graders. Arlington, VA: Educational Research Service.
Pinnell, G.S., Lyons, C.A., DeFord, D.E., Bryk, A.S., & Seltzer, M. (1994). Comparing instructional models for the literacy education of high-risk first graders. Reading Research Quarterly, 29(1), 9-38.
Plewis, I. (2000). Evaluating educational interventions using multilevel growth curves: The case of Reading Recovery. Educational Research and Evaluation, 6, 83–101.
Pollock, J.S. (1996) Final evaluation report: Reading Recovery program 1995-96. Columbus, OH: Department of Program Evaluation.
Potter, T. (2004). Reading Recovery evaluation. Madison, WI: Planning, Research and Evaluation, Madison Metropolitan School District.
Potton, A., (1983). Screening. London: Macmillan.
Prance, J. (1992) Reading Recovery: early intervention for at-risk six year old children. Addlestone: Runnymede Centre.
Prance, J. & Wright, A. (1992) The Reading Recovery programme in Surrey Education Authority. Support for Learning, 7, 103-128.
Pressley, M. (1998) Reading instruction that works: the case for balanced teaching. New York: Guildford Press.
Intervention for Dyslexia 145

Price, C.J. & McCory, E. (2005) Functional brain imaging studuies of skilled reading and developmental dyslexia. In M. Snowling & C. Hulme (Eds.) The Science of Reading: A Handbook. Oxford: Blackwell, pp. 473-496.
Puolakanaho, A., Ahonen, T. Aro, M. et al. (2007) Very early phonological and language skills estimating individual risk of reading disability. Journal of Child Psychology and Psychiatry, 48, 923-931.
Rack, J.P. (2004) The theory and practice of specialist literacy teaching. In G. Reid & A. Fawcett (Eds.) Dyslexia in Context: Research, Policy and Practice. London: Whurr, pp. 120-131.
Rack, J.P. and Hatcher, J. (2002) SPELLIT: A three-year national research project to investigate literacy difficulties in primary school children, to develop methods of assessment and to evaluate different methods of teaching including specialist teaching and home support programmes. Staines: The Dyslexia Institute.
Rack, J.P., Snowling, M.J., Hulme, C & Gibbs, S. (2007) No evidence that an exercise-based treatment programme (DDAT) has specific benefits for children with reading difficulties. Dyslexia, 13, 97-104.
Rack, J.P. & Walker, J. (1994) Does Dyslexia Institute teaching work? Dyslexia Review, 6(2), 12-17.
Ramus, F. (2003) Developmental dyslexia: specific phonological deficit or general sensorimotor dysfunction? Current Opinion in Neurobiology, 13, 212–218.
Ramus, F., Pidgeon, E., & Frith, U. (2003) The relationship between motor control and phonology in dyslexic children. Journal of Child Psychology and Psychiatry, 44, 712–722.
Ramus, F., Rosen, S., Dakin, S.C., Day, B.L., Castellote, J.M., White, S. & Frith, U. (2003) Theories of developmental dyslexia: insights from a multiple case study of dyslexic adults. Brain, 126, 841–865.
Rashotte, C.A., MacPhee, K., & Torgesen, J.K. (2001) The effectiveness of a group reading instruction program with poor readers in multiple grades. Learning Disability Quarterly, 24, 119-134.
Rasinski, T. (1995). On the effects of Reading Recovery: A response to Pinnell, Lyons, DeFord, Bryk, and Seltzer. Reading Research Quarterly, 30, 264-270.
Raskind, M.H. & Higgins, E.L. (1999) Speaking to read: The effect of speech recognition technology on the reading and speaking performance of children with learning disabilities. Annals of Dyslexia, 49, 251-281.
Rawson, M.B. (1968) Developmental language disability. Baltimore: Johns Hopkins University Press.
Raymond, J.E. & Sorensen, R. (1998) Visual motion perception in children with dyslexia: normal detection but abnormal integration. Visual Cognition, 5, 389-404.
Rayner, K., Foorman, B.R., Perfetti, C.A., Pesetsky, D., & Seidenberg, M.S. 2001. How psychological science informs the teaching of reading. Psychological Science in the Public Interest, 2, 31-73.
146 Intervention for Dyslexia
Reason, R. & Boote, R. (1994) Helping children with reading and spelling: A special needs manual. London: Routledge.
Reid, G. (2003) Dyslexia: A practitioner’s handbook (3rd edition). Chichester: Wiley.
Reinking, D. & Bridwell-Bowles, L. (1991) Computers in reading and writing. In R. Barr, M.L. Kamil, P.B. Mosenthal and P.D. Pearson (Eds) Handbook of Reading Research, Volume 2. New York: Longman, pp. 310–340.
Reitsma, P. (1988) Reading practice for beginners: Effects of guided reading, reading-while listening, and independent reading with computer based speech feedback. Reading Research Quarterly, 23, 219–235.
Reynolds, M. & Wheldall, K (2007) Reading Recovery 20 years down the track: Looking forward, looking back. International Journal of Disability, Development and Education, 54, 199-223.
Riddick, B., Farmer, M. & Sterling, C. (1997) Students and dyslexia: Growing up with a specific learning difficulty. London: Whurr.
Robinson, G.L. & Foreman, P.J. (1999) Scotopic sensitivity/Irlen Syndrome and the use of coloured filters: A long-term placebo-controlled and masked study of reading achievement and perception of ability. Perceptual and Motor Skills, 88, 35–52.
Rochelle, K.S.H. & Talcott, J.B. (2006) Impaired balance in developmental dyslexia? A meta-analysis of the contending evidence. Journal of Child Psychology and Psychiatry, 47, 1159-1166.
Rooms, M. (2000) Information and communication technology and dyslexia. In J. Townend & M. Turner (Eds.) Dyslexia in Practice: A guide for teachers. London: Kluwer Academic/Plenum Publishers, pp. 263-272.
Rose, J. (2006) Independent review of the teaching of early reading: Final report. London: Department for Education and Skills.
Roth, S.F. and Beck, I.L. (1987) Theoretical and instructional implications of the assessment of two microcomputer word recognition programs. Reading Research Quarterly, 22, 197–218.
Rowe, K. (1995) Factors affecting children’s progress in reading: key findings from a longitudinal study. Literacy teaching and learning, 1 (2).
Rutter, M. & Yule, W. (1975) The concept of specific reading retardation. Journal of Child Psychology and Psychiatry, 16, 181-197.
Ryder, J.F., Tunmer, W.E. & Greaney, K.T. (2008) Explicit instruction in phonemic awareness and phonologically-based decoding skills as an intervention strategy for struggling readers in whole language classrooms. Reading and Writing, 21, 349-369.
Santa, C. & Høien, T. (1999) An assessment of Early Steps: A program for early intervention of reading problems. Reading Research Quarterly, 34, 54-79.
Satz, P. & Fletcher, J. M. (1979). Early screening tests: Some uses and abuses. Journal of Learning Disabilities, 12, 43-50.
Intervention for Dyslexia 147

Savage, R. & Carless, S. (2005) Learning support assistants can deliver effective reading interventions for ‘at-risk’ children. Educational Research, 47, 45-61.
Savage, R. & Carless, S. (2008) The impact of early reading interventions delivered by classroom assistants on attainment at the end of Year 2. British Educational Research Journal, 34, 363-385.
Savage, R., Carless, S. & Ferraro, V. (2007) Predicting curriculum and test performance at age 11 years from pupil background, baseline skills and phonological awareness at age 5 years. Journal of Child Psychology and Psychiatry, 48, 732-739.
Scammacca, N., Vaughn, S., Roberts, G., Wanzek, J. & Torgesen, J.K. (2007) Extensive reading interventions in Grade K–3: From research to practice. Portsmouth, NH: RMC Research Corportation, Center on Instruction.
Scarborough, H.S. (1998) Early identification of children at risk for reading disabilities: Phonological awareness and some other promising predictors. In B.K.Shapiro, P.J. Accardo & A.J. Capute (Eds.) Specific Reading Disability: A view of the spectrum. Timonium, MD: York Press, pp. 77-121.
Schatschneider, C., Fletcher, J.M., Francis, D.J., Carlson, C.D. & Foorman, B.R. (2004) Kindergarten prediction of reading skills: A longitudinal comparative analysis. Journal of Educational Psychology, 96, 265-282.
Schmitt, M. C. and Gregory, A. E. (2001) The Impact of Early Intervention: where are the children now? Paper presented to the National Reading Conference, San Antonio, Texas.
Schneider, W., Roth, E., & Ennemoser, M. (2000) Training phonological skills and letter knowledge in children at risk for dyslexia: A comparison of three kindergarten intervention programs. Journal of Educational Psychology, 92, 284–295.
Schwartz, R.M. (2005) Literacy learning of at-risk first-grade students in the Reading Recovery early intervention. Journal of Educational Psychology, 97, 257–267.
Seigel, L.S. (1989) IQ is irrelevant to definition of learning disabilities. Journal of Learning Disabilities, 22, 469-478, 486.
Shanahan, T. & Barr, R. (1995) Reading Recovery: An independent evaluation of the effects of an early instructional intervention for at-risk learners. Reading Research Quarterly, 30, 958-996.
Share, D.L. (1995) Phonological recoding and self-teaching: Sine qua non of reading acquisition. Cognition, 55, 151-218.
Shaywitz, S.E., Fletcher, J.M., Holahan, J.M., Schneider, A.E., Marchione, K.E., Stuebing, K.K. et al. (1999) Persistence of dyslexia: The Connecticut longitudinal study at adolescence. Pediatrics, 104, 1351-1359.
Simmons, F., Singleton, C.H., & Horne, J. K. (2008). Phonological awareness and visual-spatial sketchpad functioning predict early arithmetic attainment: Evidence from a longitudinal study. European Journal of Cognitive Psychology, 20, 711 - 722.
148 Intervention for Dyslexia

Singleton, C.H. (1977) Dyslexia or specific reading retardation? A psychological critique. In J. Gilliland (Ed.) Reading: Research and Classroom Practice. Ward Lock: London, pp. 263-274.
Singleton, C.H. (1987) Dyslexia and cognitive models of reading. Support for Learning, 2, 47-56.
Singleton, C.H. (1988) The early diagnosis of developmental dyslexia. Support for Learning, 3, 108-121.
Singleton, C.H. (1991) A rationale for computer-assisted literacy instruction. In C.H. Singleton (Ed.) Computers and Literacy Skills. Hull: Dyslexia Computer Resource Centre, University of Hull, pp. 9-21.
Singleton, C.H. (1994a) Computer applications in the identification and remediation of dyslexia. In D. Wray (Ed.) Literacy and Computers: Insights from Research. Widnes: United Kingdom Reading Association, pp.55-61.
Singleton, C.H. (Ed.) (1994b) Computers and Dyslexia. Hull: Dyslexia Computer Resource Centre, University of Hull.
Singleton, C.H. (1997a) Screening for early literacy. In J.R. Beech and C.H. Singleton (Eds.) The Psychological Assessment of Reading. London: Routledge, pp. 67-101.
Singleton, C.H. (1997b) Computerised assessment of reading. In J.R. Beech and C.H. Singleton (Eds.) The Psychological Assessment of Reading. London: Routledge, pp. 257-278.
Singleton, C.H. (Ed.) (1999) Dyslexia in Higher Education: Policy, provision and practice. Report of the National Working Party on Dyslexia in Higher Education. Hull: University of Hull.
Singleton, C.H. (2001) Computer-based assessment in education. Educational and Child Psychology, 18, 58-74.
Singleton, C.H. (2001) Dyslexia: Cognitive factors and implications for literacy. In G. Reid and J. Wearmouth (Eds.) Dyslexia and Literacy: Research and Practice. London: Wiley, pp. 115-130.
Singleton, C.H. (2004) Using computer-based assessment to identify learning problems. In L. Florian and J. Hegarty (Eds.) ICT and Special Educational Needs. Open University Press, pp. 46-63.
Singleton, C.H. (Ed.) (2008a) The Dyslexia Handbook. Bracknell, Berks: The British Dyslexia Association.
Singleton, C.H. (2008b) Visual factors in reading. Educational and Child Psychology, 25(3).
Singleton, C.H. (2009) Visual stress and dyslexia. In G. Reid (Ed.) The Routledge Companion to Dyslexia. London: Routledge, pp. 43-57.
Singleton, C.H. & Henderson, L.M. (2006) Visual factors in reading. London Review of Education, 4, 89-98.
Intervention for Dyslexia 149

Singleton, C.H. & Henderson, L.M. (2007a) Computerised screening for visual stress in reading. Journal of Research in Reading, 30, 316-331.
Singleton, C.H. & Henderson, L.M. (2007b) Computerised screening for visual stress in children with dyslexia. Dyslexia, 13, 130-151.
Singleton, C.H., Horne, J.K., Leedale, R.C. & Thomas, K.V. (2003) Lucid Rapid Dyslexia Screening. Beverley, East Yorkshire: Lucid Research Ltd.
Singleton, C.H. and Simmons, F. (2001) An evaluation of Wordshark in the classroom. British Journal of Educational Technology, 32, 317-330.
Singleton, C.H., Thomas, K.V. & Horne, J.K. (2000) Computer-based cognitive assessment and the development of reading. Journal of Research in Reading, 23, 158-180.
Singleton, C.H., Thomas, K.V. & Leedale, R.C. (1996) Lucid CoPs Cognitive Profiling System. Beverley, East Yorkshire: Lucid Research Ltd.
Singleton, C.H. & Trotter, S. (2005) Visual stress in adults with and without dyslexia. Journal of Research in Reading, 28, 365-378.
Skottun, B.C. (2000) On the conflicting support for the magnocellular-deficit theory of dyslexia. Trends in Cognitive Science, 4, 211-212.
Skottun, B.C. (2005) Magnocellular reading and dyslexia. Vision Research, 45, 133-134.
Smith, F. (1978) Understanding reading. New York: Holt, Rinehart & Winston.
Smith, J.W.A. & Elley, W.B. (1994) Learning to read in New Zealand. Auckland, New Zealand: Longman Paul.
Snow, C., Burns, S. & Griffin, P. (1998). Preventing reading difficulties in young children. Washington, DC: National Research Council.
Snowling. M.J. (2000) Developmental Dyslexia. (2nd edition). Oxford: Blakwell.
Snowling, M.J. (2008) Specific disorders and broader phenotypes: the case of dyslexia. Quarterly Journal of Experimental Psychology, 61, 142-156.
Snowling, M.J., Gallagher, A. & Frith, U. (2003) Family risk of dyslexia is continuous: Individual differences in the precursors of reading skill. Child Development, 74, 358-373.
Snowling, M.J. & Hayiou-Thomas, M.E. (2006) The dyslexia spectrum: continuities between reading, speech and language impairments. Topics in Language Disorders, 26, 108-124.
Spaai, G.W.G., Reitsma, P. and Ellermann, H.H. (1991) Effects of segmented and whole-word sound feedback on learning to read single words. Journal of Educational Research, 84, 204–213.
Speece, D.L. & Case, L.P. (2001) Classification in context: An alternative approach to identifying early reading disability. Journal of Educational Psychology, 93, 735-749.
150 Intervention for Dyslexia

Speece, D.L., Case, L.P. & Molloy, D.W. (2003) Responsiveness to general education instruction as the first gate to learning disabilities identification. Learning Disabilities: Research and Practice, 18, 147-156.
Stanovich, K.E. (1986) Matthew effects in reading: Some consequences of individual differences in the acquisition of reading. Reading Research Quarterly, 21, 360-407.
Stein, J.F. (2001) The magnocellular theory of dyslexia. Dyslexia, 7, 12-36.
Sternberg, R.J. & Grigorenko, E.L. (2002) Difference scores on the identification of children with learning disabilities: Its time to use a different method. Journal of School Psychology, 40, 65-83.
Streiner, D. (2003) Diagnosing tests: using and misusing diagnostic and screening tests. Journal of Personality Assessment, 81, 209-219.
Stuebing, K.K., Fletcher, J.M. LeDoux, J.M., Lyon, G.R., Shaywitz, S.E. & Shaywitz, D.B.A. (2002) Validity of IQ-discrepancy classifications of reading disabilities. American Educational Research Journal, 39, 469-518.
Sutherland, M.J. & Smith, C.D. (1997) The benefits and difficulties of using portable word processors with older dyslexics. Dyslexia, 3, 15-26.
Swanson, H.L. (1999) Reading research for students with LD: A meta-analyis of intervention outcomes. Journal of Learning Disabilities, 32, 504-532.
Swanson, H.L. & Hoskyn, M. (1998) Experimental intervention research in students with learning disabilities: A meta-analysis of intervention outcomes. Review of Educational Research, 68, 277-321.
Sylva, K. & Hurry, J. (1995a) The effectiveness of Reading Recovery and phonological training for children with reading problems: Full report. London: Schools Curriculum and Assessment Authority.
Sylva, K. and Hurry, J. (1995b) Early Intervention in Children with Reading Difficulties: an Evaluation of Reading Recovery and a Phonological Training, SCAA Discussion Papers, No.2, London, SCAA.
Thomas, K.V., Singleton, C.H., and Horne, J.K. (2001) LASS Junior. Beverley, East Yorkshire: Lucid Research Ltd.
Thompson, J., Chennault, B., Abbott, R., Raskind, W., Richards, T. Aylward, E. & Berninger, V. (2005) Converging evidence for attentional influences on the orthographic word form in child dyslexics. Journal of Neurolinguistics, 18, 93-126.
Thomson, M. (1990) Developmental Dyslexia (3rd edition). London: Whurr.
Thomson, M. (2001) The psychology of dyslexia: A guide for teachers. London: Whurr.
Thomson, M. (2003) Monitoring dyslexics’ intelligence and attainments: A follow-up study. Dyslexia, 9, 3-17.
Thomson, M. & Watkins, E.J. (1990) Dyslexia: A teaching handbook. London: Whurr.
Intervention for Dyslexia 151
Tijms, J. (2004) A process-oriented evaluation of a computerized treatment for dyslexia. Educational Psychology, 24, 767-791.
Tijms, J. & Hoeks, J. (2005) A computerized treatment of dyslexia: benefits from treating lexico-phonological processing problems. Dyslexia, 11, 22-40.
Tijms, J., Hoeks, J., Paulussen-Hoogeboom, M.C. & Smolenaars, A.J. (2003) Long-term effects of a psycholinguistic treatment for dyslexia. Journal of Research in Reading, 26, 121-140.
Tønnessen, F.E. (1997) How best can we define dyslexia? Dyslexia, 3, 78-92.
Topping, K.J. & Lindsay, G.A. (1992) Paired reading: A review of the literature. Research Papers in Education, 7, 199-246.
Torgerson, C.J., Brooks, G. and Hall, J. (2006) A Systematic Review of the Research Literature on the Use of Phonics in the Teaching of Reading and Spelling. (DfES Research Report 711.) London: Department for Education and Skills. http://www.dfes.gov.uk/research/data/uploadfiles/RR711_.pdf
Torgerson, C. & Elbourne, D. (2002) A systematic review and meta-analysis of the effectiveness of information and communication technology (ICT) on the teaching of spelling. Journal of Research in Reading, 25, 129-143.
Torgerson, C. & Zhu, D. (2003) A systematic review and meta-analysis of the effectiveness of ICT on literacy learning in English, 5– 16. Series: Research Evidence in Education Library. London: EPPI Centre, Social Sciences Research Unit, Institute of education.
Torgesen, J.K. (1998) Catch them before they fall: Identification and assessment to prevent reading failure in young children. American Educator, Spring/Summer 1998, 32-39. www.fcrr.org/science/sciencePublicationsTorgesen.htm
Torgesen, J.K. (2000) Individual differences in response to early interventions in reading: The lingering problem of treatment resisters. Learning Disabilities Research and Practice, 15, 55-64.
Torgesen, J.K. (2002) The prevention of reading difficulties. Journal of School Psychology, 40, 7-26.
Torgesen, J.K. (2005a) Remedial interventions for students with dyslexia: National goals and current accomplishments. In S. Richardson & J. Gilger (Eds) Research-based Education and Intervention: What we need to know. Boston: International Dyslexia Association, pp. 103-124.
Torgesen, J.K. (2005b) Recent discoveries from research on remedial interventions for children with dyslexia. In M. Snowling & C. Hulme (Eds) The Science of Reading: A Handbook. Oxford: Blackwell, pp. 521-537.
Torgesen, J.K., Alexander, A. W., Alexander, J., Voeller, K., Conway, T., Wagner, R.K. & Rashotte, C.A. (2004). Accuracy oriented vs. Accuracy plus fluency interventions: A study of intensive instruction with older students with severe reading disabilities. Tallahassee, FL: Florida Center for Reading Research.
152 Intervention for Dyslexia

Torgesen, J.K., Alexander, A.W., Wagner, R.K., Rashotte, C.A., Voeller, K.K.S & Conway, T. (2001) Intensive remedial instruction for children with severe reading disabilities: Immediate and long-term outcomes from two instructional approaches. Journal of Learning Disabilities, 34, 33-58, 78.
Torgesen, J.K., Foorman, B.R. & Wagner, R.K. (2007) Dyslexia: A Brief for Educators, Parents, and Legislators in Florida. Technical Report #8, University of Florida Center for Reading Research.
Torgesen, J.K. & Hudson, R. (2006). Reading fluency: critical issues for struggling readers. In S.J. Samuels and A. Farstrup (Eds) Reading fluency: The forgotten dimension of reading success. Newark, DE: International Reading Association
Torgesen, J.K., Rashotte, C.A., Alexander, A. (2001). Principles of fluency instruction in reading: Relationships with established empirical outcomes. In M. Wolf (Ed) Dyslexia, Fluency, and the Brain. Parkton, MD: York Press
Torgesen, J.K., Rashotte, C.A., Alexander, A., Alexander, J., & MacPhee, K. (2003). Progress towards understanding the instructional conditions necessary for remediating reading difficulties in older children. In B. Foorman (Ed) Preventing and Remediating Reading Difficulties: Bringing Science to Scale.(pp. 275-298). Parkton, MD: York Press.
Torgesen, J.K., Wagner, R.K. & Rashotte, C.A. (1997) Prevention and remediation of severe reading disabilities: Keeping the end in mind. Scientific Studies of Reading, 1, 217-234.
Torgesen, J.K., Wagner, R. K., Rashotte, C. A., Rose, E., Lindamood, P. & Conway, T. (1999) Preventing reading failure in young children with phonological processing disabilities: Group and individual responses to instruction. Journal of Educational Psychology, 91, 579–593.
Townend, J. (2000) Phonological awareness and other foundation skills of literacy. In J. Townend & M. Turner (Eds.) Dyslexia in Practice: A guide for teachers. London: Kluwer Academic/Plenum Publishers, pp. 1-29.
Townend, J. & Turner, M. (Eds.) (2000) Dyslexia in Practice: A guide for teachers. London: Kluwer Academic/Plenum Publishers.
Troia, G.A. (1999) Phonological intervention research: A critical review of the methodology. Reading Research Quarterly, 34, 28-52.
Truch, S. (2003) Comparing remedial outcomes using LIPS and Phono-Graphix: An in-depth look from a clinical perspective. Calgary, Alberta, Canada: The Reading Foundation.
Tunmer, W. E. & Chapman, J.W. (2002) The relation of beginning readers’ reported word identification strategies to reading achievement, reading-related skills, and academic self-perception. Reading and Writing, 15, 341-358.
Tunmer, W. E. & Chapman, J.W. (2003) The Reading Recovery approach to preventive early intervention: As good as it gets? Reading Psychology, 24, 337-360.
Intervention for Dyslexia 153

Tunmer, W.E. & Chapman, J.W. (2004) The use of context in learning to read. In P. Bryant & T. Nunes (Eds.), Handbook of Children's Literacy. Dordrecht, The Netherlands: Kluwer Academic, pp. 199-212.
Turner, M. (1997) Psychological Assessment of Dyslexia. London: Whurr.
Turner, M. & Smith, P. (2004) The Dyslexia Screener. London: GL Assessment.
Tyrrell, R., Holland, K., Dennis, D. & Wilkins, A.J. (1995) Coloured overlays, visual discomfort, visual search and classroom reading. Journal of Research in Reading, 18, 10-23.
Underwood, G. & Underwood, J.D.M. (1998) Children’s interactions and learning outcomes with interactive talking books. Computers Education, 30, 95–102.
Underwood, J.D.M. (2000) A comparison of two types of computer support for reading development. Journal of Research in Reading, 23, 136-148.
US Office of Education (1977) Assistance to states for education for handicapped children: Procedures for evaluating specific learning disabilities. Federal Register, G1082-G1085.
Vadasy, P.F. & Sanders, E.A. (2008) Repeated reading intervention: Outcomes and interactions with readers’ skills and classroom instruction. Journal of Educational Psychology, 100, 272-290.
Vadasy, P.F., Sanders, E.A. & Abbott (2008) Effects of a supplemental early reading intervention at 2-year follow-up: reading skill growth patterns and predictors. Scientific Studies of Reading, 12, 51-89.
Vadasy, P.F., Sanders, E.A., Peyton, J.A. & Jenkins, J.R. (2002) Timing and intensity of tutoring: A closer look at the conditions for effective early literacy tutoring. Learning Disabilities Research and Practice, 17, 227–241.
Van Daal, V.H.P. & Reitsma, P (2000) Computer-assisted learning to read and spell: Results form two pilot studies. Journal of Research in Reading, 23, 181-193.
Van Dusen, L.M. & Worthen, B.R. (1994) The impact of integrated learning system implementation on student outcomes: Implications for research and evaluation. International Journal of Educational Research, 21, 13–24.
Vaughn, S. & Fuchs, L.S. (2003) Redefining learning disabilities as inadequate response to instruction: The promise and potential problems. Learning Disabilities Research and Practice, 18, 137-146.
Vaughn, S., Gersten. R. & Chard. D.J. (2000) The underlying message in LD intervention research: Findings from research syntheses. Exceptional Children, 67, 99-114.
Vaughn, S., & Linan-Thompson, S. (2003) Group size and time allotted to intervention: Effects for students with reading difficulties. In B. Foornun (Ed.), Preventing and remediating reading difficulties: Bringing science to scale (pp. 275-298). Parkton, MD: York Press.
154 Intervention for Dyslexia

Vaughn, S. & Roberts, G. (2007) Secondary interventions in reading: Providing additional instruction for students at risk. Teaching Exceptional Children, 39, 40-46.
Vellutino, F.R. (2002) On the role of intervention in identifying learning disabilities. In R. Bradley, L. Danielson & D. Hallahan (Eds.) Identification of learning disabilities: Research to practice. Mahwah, NJ: Lawrence Erlbaum, pp. 555-564.
Vellutino, F.R. and Fletcher, J.M. (2005) Developmental dyslexia. In M.J. Snowling and C. Hulme (Eds.) The Science of Reading: A handbook. Oxford: Blackwell, 521-537.
Vellutino, F.R., Fletcher, J.M., Snowling, M.J. & Scanlon, D.M. (2004) Specific reading disability (dyslexia): What have we learned in the past four decades? Journal of Child Psychology and Psychiatry, 45, 2-40.
Vellutino, F.R. & Scanlon, D.M. (1991) The effects of instructional bias on word identification. In I.L. Rieben & C.A. Perfetti (Eds.) Learning to read: Basic research and its implications. Hillsdale, NJ: Elbbaoum, pp. 189-204.
Vellutino, F.R., Scanlon, D.M. & Jaccard, J. (2003) Toward distinguishing between cognitive and experiential deficits as primary sources of difficulty in learning to read. In B.R. Foorman (Ed.) Preventing and remediating reading difficulties: Bringing science to scale. Baltimore. MD: York Press, pp. 73-120.
Vellutino, F.R., Scanlon, D.M. & Lyon, G.R. (2000) Differentiating difficult-to-remediate and readily remediated poor readers: More evidence against the IQ-achievement discrepancy definition of reading disability. Journal of Learning Disabilities, 33, 223-238.
Vellutino, F.R., Scanlon, D.M. & Sipay, E. (1997) Toward distinguishing between cognitive and experiential deficits as primary sources of difficulty in learning to read: The importance of early intervention in diagnosing specific reading disability. In B. Blachman (Ed.) Foundations of reading acquisition and dyslexia: Implications for early intervention. Mahwah, NJ: Lawrence Erlbaum Associations, pp. 347-379.
Vellutino, F.R., Scanlon, D.M., Sipay, E., Small, S., Pratt, A., Chen, R. et al. (1996) Cognitive profiles of difficult-to-remediate and readily-remediated poor readers: Early intervention as a vehicle for distinguishing between cognitive and experiential deficits as basic causes of specific reading disability. Journal of Educational Psychology, 88, 601-638.
Vygotsky, L (1962) Thought and Language. Cambridge, MA: MIT Press.
Walker, J. (2000) Teaching basic reading and spelling. In J. Townend & M. Turner (Eds.) Dyslexia in Practice: A guide for teachers. London: Kluwer Academic/Plenum Publishers, pp. 93-129.
Walker, J. & Brooks, L. (Eds.) (1996) Dyslexia Institute Literacy Programme. Staines: The Dyslexia Institute.
Wanzek, J., Vaughn, S., Wexler, J., Swanson, E.A., Edmonds, M. & Kim, A-H. (2006) A synthesis of spelling and reading interventions and their effects on spelling outcomes of students with LD. Journal of Learning Disabilities, 39, 528-543.
Intervention for Dyslexia 155
Wasik, B.A., & Slavin, R.E. (1993). Preventing early reading failure with one-to-one tutoring: A review of five programs. Reading Research Quarterly, 28, 179-200.
What Works Clearinghouse (2007a) Intervention Report: Reading Recovery. Washington, DC: Institute of Education Sciences, US Department of Education.
What Works Clearinghouse (2007b) Beginning Reading. Institute of Education Sciences, US Department of Education. http://ies.ed.gov/ncee/wwc/pdf/BR_TR_08_13_07.pdf
White, S., Milne, E., Rosen, S., Hansen, P., Swettenham, J., Frith, U. & Ramus, F. (2006) The role of sensorimotor impairments in dyslexia: a multiple case study of dyslexic children. Developmental Science, 9, 237-269.
Whitehead, C. (2004) An evaluation of the reading skills and reading self-concept of successfully discontinued Reading Recovery pupils three and four years after completing the programme, MA Dissertation, Institute of Education.
Whiteley, H.E. & Smith, C.D. (2001) The use of tinted lenses to alleviate reading difficulties. Journal of Research in Reading, 24, 30-40.
Whiteley, H.E., Smith, C.D. & Connors, L. (2007) Young children at risk of literacy difficulties: factors predicting recovery from risk following phonologically based interventions. Journal of Research in Reading, 30, 249-269.
Wilkins, A.J. (1995) Visual Stress. Oxford: Oxford University Press.
Wilkins, A.J. (2003) Reading Through Colour. Chichester, Sussex: Wiley.
Wilkins, A.J., Jeanes, R.J., Pumfrey, P.D. & Laskier, M. (1996) Rate of Reading Test: its reliability and its validity in the assessment of the effects of coloured overlays. Ophthalmic and Physiological Optics, 16, 491-7.
Wilkins, A.J., Huang, J. & Cao, Y. (2004) Visual stress theory and its application to reading and reading tests. Journal of Research in Reading, 27, 152-162.
Wilkins, A.J. & Lewis, E. (1999) Coloured overlays, text and texture. Perception, 28, 641-650.
Wilkins, A.J., Lewis, E., Smith, F., Rowland, E. & Tweedie, W. (2001) Coloured overlays and their benefit for reading. Journal of Research in Reading, 24, 41-64.
Wilkins, A.J., Nimmo-Smith, I. & Jansons, J. (1992) A colorimeter for the intuitive manipulation of hue and saturation, and its application in the study of perceptual distortion. Ophthalmic and Physiological Optics, 12, 381-385.
Williams, A. (2001) Using Integrated Learning Systems to support the students with learning difficulties in a comprehensive school. Support for Learning, 16, 174-178.
Willis, J, Stephens, E, & Matthews, K. (1996) Technology, reading, and language arts. Needham Heights, MA: Allyn and Bacon.
Wilson, B. (1988) Wilson Reading System. Wilson Language Training: Milbury, MA.
156 Intervention for Dyslexia

Wilson, J. & Frederickson, N. (1995) Phonological awareness training: an evaluation, Educational and Child Psychology, 12, 68 – 79.
Wilson, M. & Clarke, J. (2005) Using the Lexia Basic Reading software programme as a Wave 3 intervention: a trial in seven York schools during Spring and Summer terms 2005. York: Inclusion Support Service.
Wise, B., Olson, R., Ansett, M., Andrews, L., Terjak, M., Schneider, V., Kotstuch, J. & Kriho, L. (1989) Implementing a long-term computerised remedial reading program with synthetic speech feedback: Hardware, software and real world issues. Behavior Research Methods, Instruments and Computers, 21, 173–180.
Wise, B.W., Ring, J. & Olson, R.K. (1999) Training phonological awareness with and without explicit attention to articulation. Journal of Experimental Child Psychology, 72, 271-304.
Wise, B.W., Ring, J., & Olson, R.K. (2000) Individual differences in gains from computer-assisted remedial reading. Journal of Experimental Child Psychology, 77, 197-235.
Wolfendale, S. and Bryans, T. (1979) Identification of Learning Difficulties: A Model for Intervention. Stafford: National Association for Remedial Education.
Wood, D. (1998) The UK ILS evaluations: Final report. Department for Education and Employment/BECTa, London.
Wood, D., Underwood, J. & Avis, P. (1999) Integrated learning systems in the classroom. Computers and Education, 33, 91–108.
Worsley, J. (2003) Lexia Phonics Based Reading: report of the trial of the Lexia Phonics Based Reading programme in Norfolk schools, April–July 2003. Norwich: Pupil Access Support Service.
Wright, A. (1992) Evaluation of the first British Reading Recovery programme. British Educational Research Journal, 18, 351–368.
Intervention for Dyslexia 157