intersections the political economy of race and class in the united states
TRANSCRIPT

IntersectionsIntersections
The Political Economy of The Political Economy of Race and Class in the United Race and Class in the United
StatesStates

I. I. Defining Race and ClassDefining Race and Class
A. Little genetic variance exists in humansA. Little genetic variance exists in humans
1. Why? Bottleneck 100,000 – 200,000 years ago1. Why? Bottleneck 100,000 – 200,000 years ago
2. Migration: “The Urge to Merge”2. Migration: “The Urge to Merge”
3. Result: We all have about the same set of 3. Result: We all have about the same set of ancestors in 1000 BC (everyone alive now is ancestors in 1000 BC (everyone alive now is descended from everyone alive then, but in descended from everyone alive then, but in different proportions)different proportions)
B. Race not B. Race not biologicallybiologically significant significant
On average: Two random people of the SAME race On average: Two random people of the SAME race have 90% as many genetic differences as two have 90% as many genetic differences as two random people of DIFFERENT racesrandom people of DIFFERENT races

C. “Race” is a Social CategoryC. “Race” is a Social Category1. Nationality as Race: “How the Irish Became White”1. Nationality as Race: “How the Irish Became White”
2. Ancestry as Race: “One Drop”2. Ancestry as Race: “One Drop”
3. Multiracial Classification: Breaking Down Categories3. Multiracial Classification: Breaking Down Categories

1.1. Usual Criteria: Income, Wealth, PowerUsual Criteria: Income, Wealth, Power
2.2. Prestige occupationsPrestige occupations They Pay MoreThey Pay More
They Require More EducationThey Require More Education
They Entail More Abstract ThoughtThey Entail More Abstract Thought
They Offer Greater AutonomyThey Offer Greater Autonomy
D. What is Social Class?D. What is Social Class?

E. IntersectionalityE. Intersectionality This term refers to ways in which different This term refers to ways in which different
types of divisions or discrimination may types of divisions or discrimination may reinforce each otherreinforce each other
Example: Race and ClassExample: Race and Class Racial stereotyping denies economic Racial stereotyping denies economic
opportunities opportunities lower incomes lower incomes People with lower incomes can’t live in nice People with lower incomes can’t live in nice
neighborhoods neighborhoods housing segregation housing segregation Poor neighborhoods have more crime Poor neighborhoods have more crime racial racial
stereotyping of their residentsstereotyping of their residents Implication: If race and class divisions Implication: If race and class divisions
reinforce each other, tackling one will be reinforce each other, tackling one will be difficult without tackling the otherdifficult without tackling the other

II. Explaining Income Inequality: II. Explaining Income Inequality: Intersectionality or Something Else?Intersectionality or Something Else?

A. Unemployment: What explains A. Unemployment: What explains the racial gap?the racial gap?


1. Name Discrimination1. Name Discrimination
““White” White” names names about 50% about 50% more more likely to be likely to be called for called for interviews interviews than than “Black” “Black” namesnames
Sample Sample stereotypestereotyped names:d names:
““White”White” ““Black”Black”MaleMale FemaleFemale MaleMale FemaleFemale
JakeJake MollyMolly DeShawDeShawnn
TiaraTiara
DustinDustin AmyAmy TyroneTyrone EbonyEbony
BrettBrett ClaireClaire JamalJamal ShaniceShanice
WyattWyatt EmilyEmily DarnellDarnell JasmineJasmine
LoganLogan KatieKatie TerrellTerrell PreciousPrecious

2. Interviewer Bias2. Interviewer Bias
i.i. Identical qualifications Identical qualifications Whites usually hiredWhites usually hired
ii.ii. Identical statements Identical statements Whites Whites perceived as less aggressiveperceived as less aggressive
iii.iii. Experiments: Interviewer race Experiments: Interviewer race affects evaluation of affects evaluation of qualifications (circumstances qualifications (circumstances vs. personal responsibility)vs. personal responsibility)

B. EducationB. Education1. It matters, but can’t explain whole income gap1. It matters, but can’t explain whole income gap

2. Domino Effect: College Education 2. Domino Effect: College Education Reinforces Reinforces ClassClass Divisions Divisions

C. Perceived Workplace Racism: A C. Perceived Workplace Racism: A Problem for Free MarketsProblem for Free Markets

D. Trends in Income InequalityD. Trends in Income Inequality

1. Recent Growth: A rising tide that lifts 1. Recent Growth: A rising tide that lifts some boats faster than others. Why?some boats faster than others. Why?

2. Comparison: US vs. World2. Comparison: US vs. World Gini coefficient (a measure of Gini coefficient (a measure of
inequality): higher numbers mean inequality): higher numbers mean more inequalitymore inequality
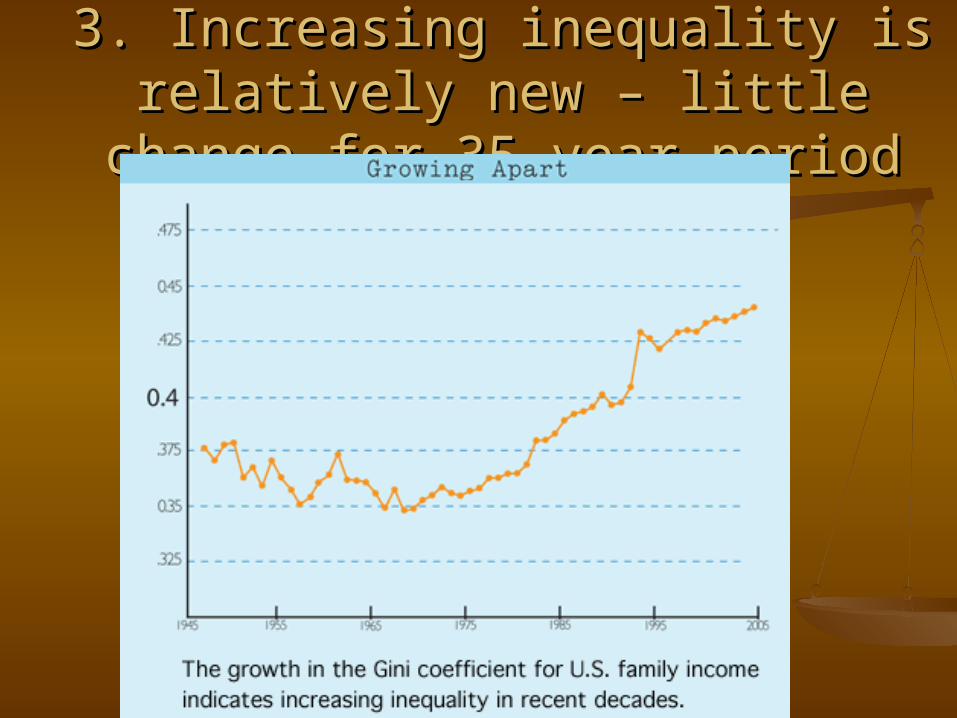
3. Increasing inequality is relatively 3. Increasing inequality is relatively new – little change for 35-year periodnew – little change for 35-year period

III. Wealth Inequality: Obstacles to III. Wealth Inequality: Obstacles to Social MobilitySocial Mobility

A. How Do Families Accumulate A. How Do Families Accumulate Wealth?Wealth?
1. Theory from Classical Economics1. Theory from Classical Economics Savings, Wise Investment, Hard WorkSavings, Wise Investment, Hard Work Life CycleLife Cycle
2. Institutional Accumulation: Wealth 2. Institutional Accumulation: Wealth transferred through legal channelstransferred through legal channels
2/3 of Middle Class Wealth is Home Equity: 2/3 of Middle Class Wealth is Home Equity: Homestead Acts, FHA, Home Mortgage Homestead Acts, FHA, Home Mortgage Interest Deductions promote this form of Interest Deductions promote this form of wealthwealth


A. How Do Families Accumulate A. How Do Families Accumulate Wealth?Wealth?
1. Theory from Classical Economics1. Theory from Classical Economics Savings, Wise Investment, Hard WorkSavings, Wise Investment, Hard Work Life CycleLife Cycle
2. Institutional Accumulation: Wealth transferred 2. Institutional Accumulation: Wealth transferred through legal channelsthrough legal channels
2/3 of Middle Class Wealth is Home Equity: 2/3 of Middle Class Wealth is Home Equity: Homestead Acts, FHA, Home Mortgage Interest Homestead Acts, FHA, Home Mortgage Interest Deductions promote this form of wealthDeductions promote this form of wealth
Education: Land Grant Colleges, GI Bill, Subsidized Education: Land Grant Colleges, GI Bill, Subsidized Student Loans, “Student Loans, “In VivoIn Vivo” wealth transfers from ” wealth transfers from parentsparents
Retirement Accounts: Federal programs, subsidies, Retirement Accounts: Federal programs, subsidies, and tax credits for pensions and savingsand tax credits for pensions and savings
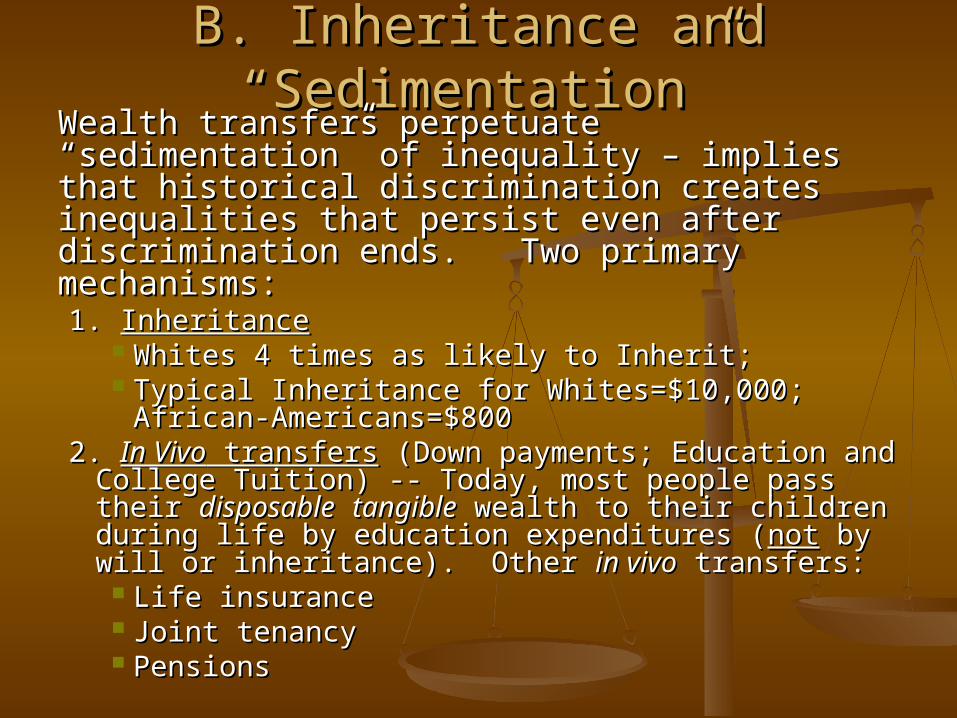
B. Inheritance and “Sedimentation”B. Inheritance and “Sedimentation”Wealth transfers perpetuate “sedimentation” Wealth transfers perpetuate “sedimentation” of inequality – implies that historical of inequality – implies that historical discrimination creates inequalities that discrimination creates inequalities that persist even after discrimination ends. Two persist even after discrimination ends. Two primary mechanisms:primary mechanisms:1. 1. InheritanceInheritance
Whites 4 times as likely to Inherit; Whites 4 times as likely to Inherit; Typical Inheritance for Whites=$10,000; Typical Inheritance for Whites=$10,000;
African-Americans=$800African-Americans=$8002. 2. In VivoIn Vivo transfers transfers (Down payments; Education and (Down payments; Education and
College Tuition) -- Today, most people pass their College Tuition) -- Today, most people pass their disposabledisposable tangibletangible wealth to their children wealth to their children during life by education expenditures (during life by education expenditures (notnot by will by will or inheritance). Other or inheritance). Other in vivoin vivo transfers: transfers:
Life insuranceLife insurance Joint tenancyJoint tenancy PensionsPensions

C. Fragility: Small Assets Dissipate C. Fragility: Small Assets Dissipate During RecessionsDuring Recessions
Example: During the 2001 recession and Example: During the 2001 recession and “jobless recovery,” Latino and African-“jobless recovery,” Latino and African-American families lost over one-quarter of American families lost over one-quarter of their wealth while the wealth of white their wealth while the wealth of white families grew slowly, 2 percent. families grew slowly, 2 percent.

D. Class Mobility in America: Is D. Class Mobility in America: Is Inequality the Future?Inequality the Future?
1. “The high cost of being poor.” Without 1. “The high cost of being poor.” Without savings (wealth) or credit (related to savings (wealth) or credit (related to wealth and income):wealth and income): No deposit – Funnels people to rent-by-the-No deposit – Funnels people to rent-by-the-
week motels, more expensive than apartments week motels, more expensive than apartments (largely due to food costs)(largely due to food costs)
Higher utility and other depositsHigher utility and other deposits Bank scarcity: Reliance on money orders, Bank scarcity: Reliance on money orders,
check-cashing facilities, payday lenders, pawn check-cashing facilities, payday lenders, pawn shops, rent-to-own furniture and appliancesshops, rent-to-own furniture and appliances
Higher costs for groceries (no mega-stores), Higher costs for groceries (no mega-stores), laundry, gaslaundry, gas
Car purchases, loans, insurance much higher Car purchases, loans, insurance much higher for poor, even controlling for driving recordfor poor, even controlling for driving record

2. Intergenerational Mobility2. Intergenerational Mobility
a. Definition: Probability children will a. Definition: Probability children will have different relative income than have different relative income than parentsparents


b. Trend:b. Trend:
ShrinkingShrinking


E. Wealth Gap is Intersectional: E. Wealth Gap is Intersectional: Both Class and Race MatterBoth Class and Race Matter
1. Mobility higher for poor white 1. Mobility higher for poor white children than poor African-American children than poor African-American childrenchildren

2. Net Worth Gap Unlikely to Close 2. Net Worth Gap Unlikely to Close SoonSoon

IV. Housing and Spatial InequalityIV. Housing and Spatial Inequality
A.A. The spatial inequality thesis:The spatial inequality thesis: Social and racial inequities are
“geographically inscribed” (correlated with location)
Government policy helps determine Government policy helps determine geography of inequality (which is not geography of inequality (which is not necessarily “natural” or “neutral”)necessarily “natural” or “neutral”)
Implication: Political decisions about Implication: Political decisions about housing and land use can increase or housing and land use can increase or decrease both racial and class decrease both racial and class inequality. As always, politics creates inequality. As always, politics creates winners and losers…winners and losers…

B. Home OwnershipB. Home Ownership1. Present-Day Institutional 1. Present-Day Institutional
Discrimination: Homeownership and Discrimination: Homeownership and AssetsAssetsa. Mortgages: Blacks have 60% higher a. Mortgages: Blacks have 60% higher
Rejection Rate vs. income/asset-comparable Rejection Rate vs. income/asset-comparable WhitesWhites
b. Interest Rates: Blacks Pay More (About 1/3 b. Interest Rates: Blacks Pay More (About 1/3 of 1%)of 1%) Translates into $12,000 More for Typical Translates into $12,000 More for Typical
Home over 30 yearsHome over 30 years

c. Subprime Loansc. Subprime Loans
Racial gap Racial gap in lending in lending – even – even wealthy wealthy African-African-American American borrowers borrowers get high-get high-risk loansrisk loans

2. Lending Gap Widens Pre-2. Lending Gap Widens Pre-Existing Wealth GapsExisting Wealth Gaps

3. Home Ownership Gap Persists3. Home Ownership Gap Persists

C. “Spatial Racism” -- C. “Spatial Racism” -- De FactoDe Facto SegregationSegregation
1. Decreasing but still 1. Decreasing but still highhigh
2. More prevalent in 2. More prevalent in NorthNorth
3. Causes:3. Causes:a. Fragmentation: Smaller a. Fragmentation: Smaller
school districts and school districts and administrative unitsadministrative units
Milwaukee, the most segregated city in America

b. Government Policyb. Government Policy
““Spatial Racism” reinforced by: Spatial Racism” reinforced by: Zoning laws prevent affordable housing in Zoning laws prevent affordable housing in
many suburbsmany suburbs Housing policies concentrate subsidized Housing policies concentrate subsidized
housinghousing Municipalities subsidize the relocation of Municipalities subsidize the relocation of
businesses out of the citybusinesses out of the city Transportation spending favors highways, Transportation spending favors highways,
metropolitan expansion and urban sprawlmetropolitan expansion and urban sprawl Court decisions prevent metropolitan school Court decisions prevent metropolitan school
desegregationdesegregation School funding is tied to property taxesSchool funding is tied to property taxes

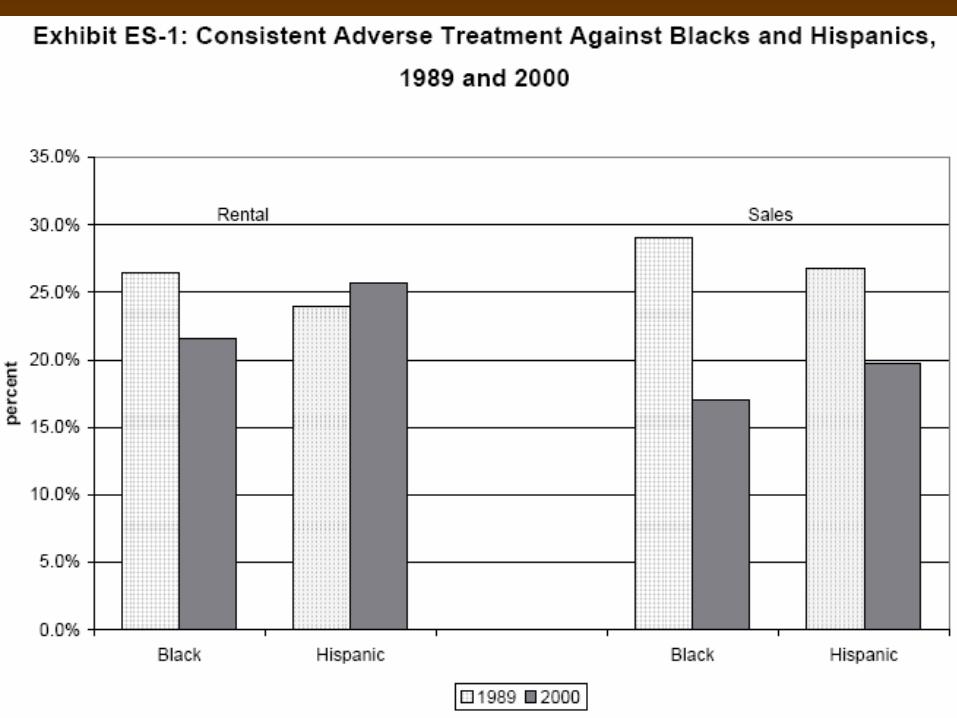
c. Ongoing Housing Discrimination for Renters

Evidence: HDS 2000 ReportEvidence: HDS 2000 Report 4,600 paired testers, one minority and the other 4,600 paired testers, one minority and the other
whitewhite Pose as otherwise identical homeseekers and Pose as otherwise identical homeseekers and
inquire about availability of advertised housing inquire about availability of advertised housing unitsunits
Identifying discrimination:Identifying discrimination: White testers told of available units when African-White testers told of available units when African-
Americans not told: 12.3% of the timeAmericans not told: 12.3% of the time African-American testers told of available units when African-American testers told of available units when
Whites not told: 8.3% of the timeWhites not told: 8.3% of the time Inference: If sample size is large enough, discrimination rate of 4% Inference: If sample size is large enough, discrimination rate of 4%
against African-Americans on this dimensionagainst African-Americans on this dimension Many dimensions aggregated together to provide total Many dimensions aggregated together to provide total
rate of housing discrimination: whether allowed to inspect rate of housing discrimination: whether allowed to inspect apartment/house, quoted rent/price, rent incentives, etc.apartment/house, quoted rent/price, rent incentives, etc.

Other findingsOther findings Systematic “steering” found: Whites likely Systematic “steering” found: Whites likely
to be recommended houses in white to be recommended houses in white neighborhoods, minorities in minority neighborhoods, minorities in minority neighborhoods (remember, neighborhoods (remember, income/employment etc is identical)income/employment etc is identical)
Effect is strongest when older agents Effect is strongest when older agents encountered – consistent with prejudice encountered – consistent with prejudice hypothesishypothesis
Interesting: Austin singled out as unusually Interesting: Austin singled out as unusually likely to generate discrimination against likely to generate discrimination against both Latinos and African-Americans (only both Latinos and African-Americans (only metro area with this “distinction”)metro area with this “distinction”)

d. Personal Choice?d. Personal Choice?


4. Effects of Segregation4. Effects of Segregation Educational inequality: Inter-district busing Educational inequality: Inter-district busing
prohibitedprohibited Also reinforces other spatial inequalities (maps Also reinforces other spatial inequalities (maps
them to racial boundaries)them to racial boundaries)

D. Sprawl, Fragmentation and D. Sprawl, Fragmentation and Housing Opportunity for the PoorHousing Opportunity for the Poor
1.1. Zoning: Suburban regulations drive Zoning: Suburban regulations drive up the cost of housing and limit up the cost of housing and limit rental housingrental housing
a.a. New housing becomes unaffordable to New housing becomes unaffordable to low income residentslow income residents
b.b. Disinvestment in the inner city Disinvestment in the inner city reduces the asset value (wealth) of reduces the asset value (wealth) of homeowners in inner city homeowners in inner city neighborhoodsneighborhoods

Example: Zoning and Housing Example: Zoning and Housing Opportunity in Columbus, OHOpportunity in Columbus, OH
Suburban lot size requirements in the Columbus Suburban lot size requirements in the Columbus suburbs drive up the cost of housingsuburbs drive up the cost of housing
Result: >90% of new single-family homes built 2000-Result: >90% of new single-family homes built 2000-2002 not affordable to >75% of African American and 2002 not affordable to >75% of African American and Latino householdsLatino householdsMinimum Lot Size for Single Family Home
5,000
8,0008,400 8,400
10,000 10,000 10,000
11,000
3,0004,0005,0006,0007,0008,0009,000
10,00011,00012,000
Colum
bus (C
entra
l City
)
Wes
terv
ille
(Suburb
)
Reynold
sburg
(Suburb
)
Grove
City
(Suburb
)
Dublin (S
uburb)
Picke
ringto
n (Suburb
)
Canal
Win
ches
ter (
Suburb)
Gahan
na (S
uburb)
Sq
uar
e F
eet

Jobs have moved away from the labor pool Jobs have moved away from the labor pool in many metropolitan areas, making in many metropolitan areas, making connecting job-seekers with jobs a connecting job-seekers with jobs a challenge which is compounded by poor challenge which is compounded by poor public transportationpublic transportation
40% of all suburban jobs cannot be reached by 40% of all suburban jobs cannot be reached by public transportationpublic transportation
Public investment disproportionately favors Public investment disproportionately favors highways over public transportationhighways over public transportation
2. “Job Sprawl”

Spatial Mismatch:Spatial Mismatch:Job Growth & PublicJob Growth & PublicTransit in BaltimoreTransit in Baltimore
• “Job Sprawl” also correlates with greater segregation for African Americans from employment
Percent Change in Jobs
30 - 66.6
15 - 30
5 - 15
0 - 5
Job Loss
Recent Job Growth 98-02 and Public Transitin the Baltimore Region

E. Opportunity Segregation: Cumulative Impact of Sprawl, Fragmentation and
“Spatial Racism” Low income residents segregated from Low income residents segregated from
opportunities such as:opportunities such as: Good schools, meaningful employment, safe Good schools, meaningful employment, safe
and stable neighborhoodsand stable neighborhoods This is This is “opportunity segregation”“opportunity segregation”
Also reinforces mapping of class and raceAlso reinforces mapping of class and race

V. Political Economy of Criminal V. Political Economy of Criminal Justice: Who Commits the Crime – Justice: Who Commits the Crime –
and Who Does the Time?and Who Does the Time?A.A. JuvenilesJuveniles
1.1. Drug Drug dealing:dealing:
2.2. Use: Use: Hard Hard Drugs Drugs

3. Other Destructive Behavior3. Other Destructive Behavior
Self-reported behavior in interviews

4. Who Does the Juvenile Time?4. Who Does the Juvenile Time?


Juveniles in Juveniles in Adult PrisonsAdult Prisons

B. Who Does the Adult Time?B. Who Does the Adult Time?1. Whites Less Likely to Be Arrested if Reported: 1. Whites Less Likely to Be Arrested if Reported: Graph of % Of African-AmericansGraph of % Of African-Americans
11%
36%29%
54%
27%35%
20%
33%
0%
20%
40%
60%
80%
100%
Rape Robbery Aggr. Assault SimpleAssault
Reported Arrested

2. Is There Police Bias?2. Is There Police Bias?
Increases in minority police Increases in minority police Increases in arrest rate for whites, Increases in arrest rate for whites, no decrease in arrest rates for no decrease in arrest rates for minoritiesminorities

3. Trials3. Trials Television viewers were so Television viewers were so
accustomed to seeing African-accustomed to seeing African-American crime suspects on the American crime suspects on the local news that even when the local news that even when the race of a suspect was not race of a suspect was not specified, viewers tended to specified, viewers tended to remember seeing an Africa-remember seeing an Africa-American suspect.American suspect.

Result: Conviction More LikelyResult: Conviction More Likely

4. Sentencing Disparity4. Sentencing Disparity

5. Racial consequences of the war 5. Racial consequences of the war on drugson drugs
a. Drug Use Rates for Adults (% using past month)a. Drug Use Rates for Adults (% using past month)
6.4 6.4
0
3
6
9
12
15
White Black
Source: 2000 National Household Survey on Drug Abuse

b. Disparate Treatment Based on b. Disparate Treatment Based on RaceRace
African Americans constitute about 13% African Americans constitute about 13% of drug users BUT: of drug users BUT: 36.8% of those arrested for drug 36.8% of those arrested for drug
violationsviolations 42% of those in federal prisons for drug 42% of those in federal prisons for drug
violationsviolations 59% of those in state prisons 59% of those in state prisons

6. Lifetime likelihood of 6. Lifetime likelihood of imprisonmentimprisonment
Among men: Among men: 28.5% African-Americans 28.5% African-Americans 16% Latinos16% Latinos 4.4% Non-Latino Whites4.4% Non-Latino Whites
Among women:Among women: 3.6% African-Americans 3.6% African-Americans 1.5% Latinos1.5% Latinos 0.5% Non-Latino Whites0.5% Non-Latino Whites

C. Class Bias in the Courts?C. Class Bias in the Courts?
Money matters: Wealthy litigants more Money matters: Wealthy litigants more likely to winlikely to win
Amicus CuraeAmicus Curae briefs affect decisions briefs affect decisions State Supreme Courts: Repeat players State Supreme Courts: Repeat players
(Haves) Beat One-Shot Appellants (Haves) Beat One-Shot Appellants (Have-Nots)(Have-Nots) Relationship decreases when outside Relationship decreases when outside amiciamici
favor have-notsfavor have-nots

VI. What should we do?VI. What should we do?
A.A. Simulation resultsSimulation results1.1. Who won?Who won?2.2. What does the starting level of money What does the starting level of money
represent in real life?represent in real life?3.3. What does the “Passing GO” bonus What does the “Passing GO” bonus
represent?represent?4.4. What does the “Thimble rule” What does the “Thimble rule”
represent?represent?5.5. Losers: What could you have done to Losers: What could you have done to
become a winner?become a winner?6.6. Other players: Why should you bother Other players: Why should you bother
playing at all?playing at all?

B. Structured Life Chances:B. Structured Life Chances:Playing the Hand You are DealtPlaying the Hand You are Dealt
Monopoly is an analogy for the social world we Monopoly is an analogy for the social world we live inlive in Rules of the Game: Structures choicesRules of the Game: Structures choices People play the game: AgencyPeople play the game: Agency
Perception vs. RealityPerception vs. Reality Perception: Perception: EveryoneEveryone starts with same $ starts with same $ Reality: People start with varying amountsReality: People start with varying amounts
Individual life chances are largely (but not Individual life chances are largely (but not entirely) structured by the “hand one is dealt”entirely) structured by the “hand one is dealt”
Social design: Rawls and the “Veil of Social design: Rawls and the “Veil of Ignorance”Ignorance”

C. Responses to Income InequalityC. Responses to Income Inequality1.1. Leave it aloneLeave it alone
a.a. Argument: Inequality creates incentives to succeedArgument: Inequality creates incentives to succeedb.b. Problem: Inequality produces social conflict, which can lower Problem: Inequality produces social conflict, which can lower
economic growth. Inequality can reduce incentives if economic growth. Inequality can reduce incentives if perceivedperceived as entrenched as entrenched
2.2. Income redistributionIncome redistributiona.a. Argument: Progressive taxes combined with social welfare Argument: Progressive taxes combined with social welfare
programs reduce inequalityprograms reduce inequalityb.b. Problem: Social support encourages inefficiency and free-Problem: Social support encourages inefficiency and free-
riding behaviorriding behavior
3.3. Reduce effects of inequality: better-funded public Reduce effects of inequality: better-funded public defenders, “Robin Hood” school funding, etc.defenders, “Robin Hood” school funding, etc.
a.a. Argument: Allows incentives created by inequality Argument: Allows incentives created by inequality andand perception of class mobilityperception of class mobility
b.b. Problem: Best outcome is to reduce effects, not eliminate Problem: Best outcome is to reduce effects, not eliminate them (family support, etc) – may be sufficient to reduce them (family support, etc) – may be sufficient to reduce incentives but insufficient to overcome perception of incentives but insufficient to overcome perception of entrenchmententrenchment

D. Race: Affirmative Action?D. Race: Affirmative Action?1.1. Problem: Discrimination (Not Just Disparity) Problem: Discrimination (Not Just Disparity)
ExistsExistsa.a. Housing Housing Education and Wealth Education and Wealthb.b. Employment Employment Income Incomec.c. Law Enforcement Law Enforcement Socioeconomic Outcomes Socioeconomic Outcomes
and Rightsand Rights
2.2. Dilemma: How to Solve? Assume Dilemma: How to Solve? Assume agreement that government shouldn’t agreement that government shouldn’t discriminate…discriminate…
a.a. Government allows discrimination: Cannot avoid Government allows discrimination: Cannot avoid moral choices!moral choices!
b.b. Government bans discrimination: Leads to buck-Government bans discrimination: Leads to buck-passing, enforcement problems.passing, enforcement problems.
c.c. Affirmative Action: Race-based programs to Affirmative Action: Race-based programs to remedy effects of ongoing discriminationremedy effects of ongoing discrimination

3. Rationales and Counter-Arguments3. Rationales and Counter-ArgumentsFocusFocus Argument ForArgument For Argument AgainstArgument Against
PastPast
RacismRacismReparationsReparations IndividualismIndividualism
IdentificationIdentification
PresentPresent
InequalitInequalityy
Unequal Unequal Outcomes by Outcomes by RaceRace
Race-Blind Equality Race-Blind Equality of Opportunityof Opportunity
PresentPresent
PrejudicePrejudiceCheck on Check on DiscriminationDiscrimination
Bureaucratic Bureaucratic Expansion/CrudityExpansion/Crudity
FutureFuture DiversityDiversity DependenceDependence
ResentmentResentment

4. Polls: 4. Polls: InconsistentInconsistent
Does this Does this reflect reflect cognitive cognitive dissonancdissonance?e?
