interrogating the spatial distribution of fuel poverty measures in england
TRANSCRIPT
Multiple vulnerabilities? Interrogating the spatial distribution of fuel
poverty indicators in England
Cait RobinsonEPSRC Centre for Doctoral Training in Power NetworksCollaboratory for Urban Resilience and Energy (CURE)

Getting the measure of fuel povertyFuel poverty as driven by low income, energy efficiency, energy price
LIHC indicator10% indicator
Vulnerability as the likelihood of a household falling into fuel poverty(Middlemiss and Gillard 2015)
Energy related practices, needs, flexibility
To what extent does the new LIHC indicator represent more complex understandings of vulnerability to fuel poverty?

Spatial distribution of DECC indicators
10% Indicator LIHC Indicator Change
ONS 2011, DECC 2014
Considerable reduction in fuel poverty771,014 fewer households fuel poorAn increasingly urban phenomenon 8.1% decrease in rural LSOA, no change in urban LSOA
Lower Super Output Area (LSOA) Scale: 400-1200 households
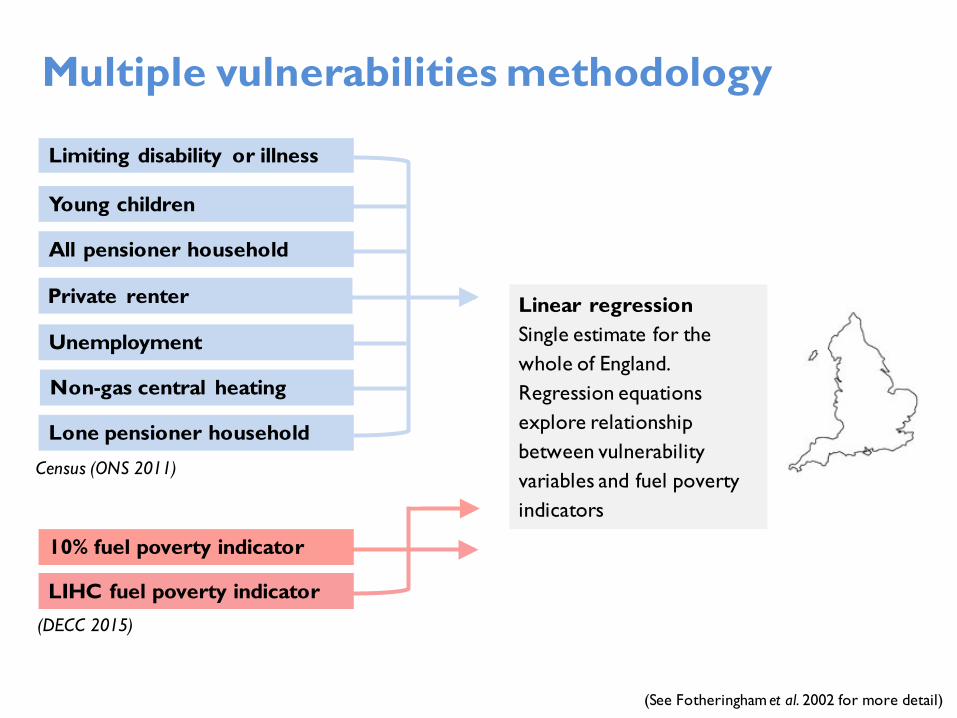
Multiple vulnerabilities methodology
Limiting disability or illness
Young children
All pensioner household
Private renter
Unemployment
Non-gas central heating
Lone pensioner household
10% fuel poverty indicator
Linear regressionSingle estimate for the whole of England.Regression equations explore relationship between vulnerability variables and fuel poverty indicators
LIHC fuel poverty indicator
Census (ONS 2011)
(DECC 2015)
(See Fotheringham et al. 2002 for more detail)
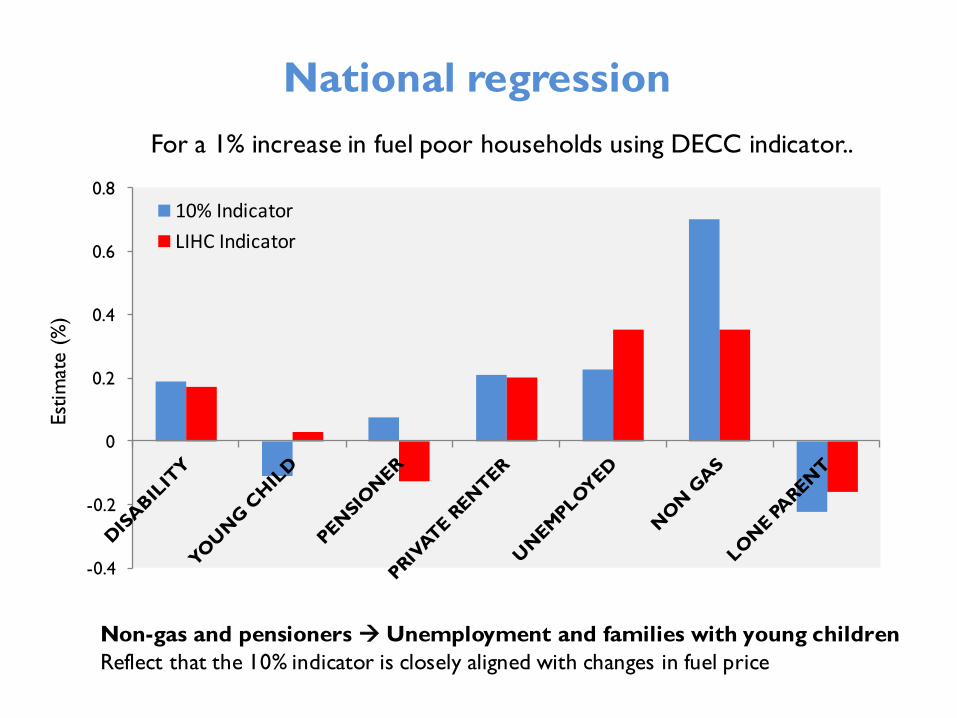
For a 1% increase in fuel poor households using DECC indicator..
National regression
-0.4
-0.2
0
0.2
0.4
0.6
0.8
Estim
ate
(%)
10% IndicatorLIHC Indicator
Non-gas and pensioners à Unemployment and families with young childrenReflect that the 10% indicator is closely aligned with changes in fuel price
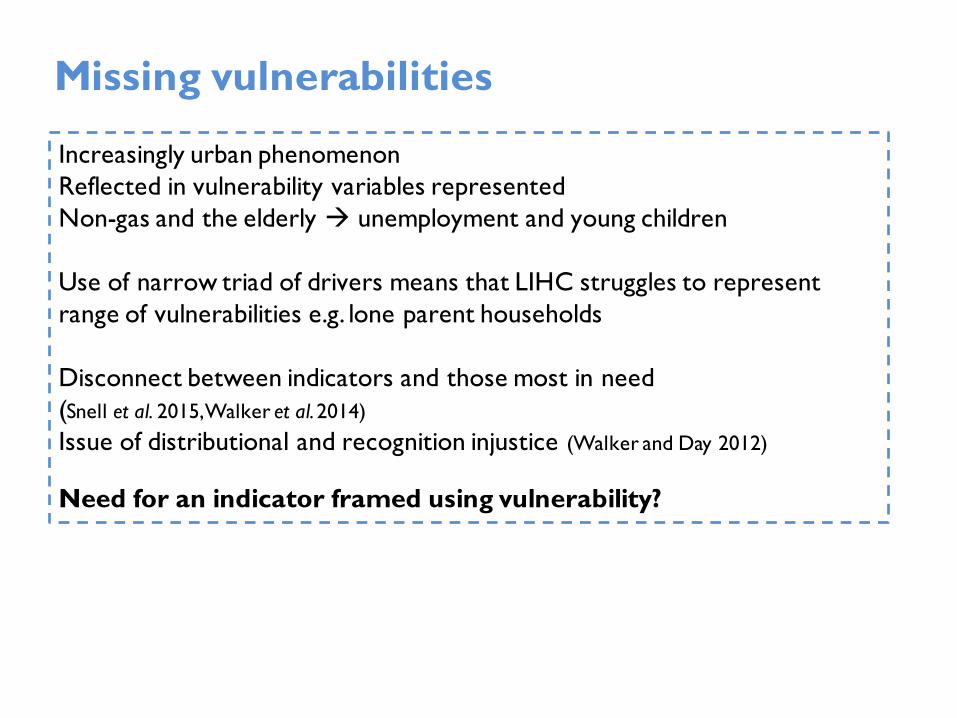
Missing vulnerabilities
Increasingly urban phenomenonReflected in vulnerability variables represented Non-gas and the elderly à unemployment and young children
Use of narrow triad of drivers means that LIHC struggles to represent range of vulnerabilities e.g. lone parent households
Disconnect between indicators and those most in need (Snell et al. 2015, Walker et al. 2014) Issue of distributional and recognition injustice (Walker and Day 2012)
Need for an indicator framed using vulnerability?

[email protected]@caithrobin