interpreting vsp, streamer, and ocean-bottom seismometer ... · the white rose offshore oilfield...
TRANSCRIPT
Interpretation of White Rose field data
CREWES Research Report — Volume 17 (2005) 1
Interpreting VSP, streamer, and ocean-bottom seismometer data from the White Rose oilfield, offshore Newfoundland
Jessica Jaramillo Sarasty and Robert R. Stewart
ABSTRACT During the summer of 2000, a multi-offset-VSP dataset was acquired in Husky
Energy’s H-20 well in the White Rose field, offshore Newfoundland. This survey generated several outputs including corridor stacks, CDP mapping of PP data, and CCP mapping of PS data. The interpretation of these results shows that the best correlations are between the PS synthetic seismograms and the PS offset VSP data. PS images from these synthetic seismograms at the top of the Avalon Formation, show higher amplitude than the adjacent signals. Synthetic and field data indicated that converted-wave (PS) data might be useful in mapping the Avalon reservoir at White Rose (Jaramillo et al., 2002).
During the summer of 2002, an ocean bottom seismometer test line was conducted over Husky Energy Inc.’s L-08 well in White Rose area. The Avalon reservoir at the White Rose field is difficult to image using a conventional marine seismic. Thus, a test was conducted using twenty-one ocean bottom seismometer/hydrophone stations and an airgun source. The correlation between the PP and PS synthetic seismograms from well L-08 and the OBS data (vertical and radial components) gave confidence to the interpretation of the resultant PP and PS seismic sections. The Vp/Vs values obtained from the seismic are similar to the values from the well L-08. There are some vertical and lateral Vp/Vs anomalies on the seismic sections. In general, the Vp/Vs values decrease with depth.
INTRODUCTION
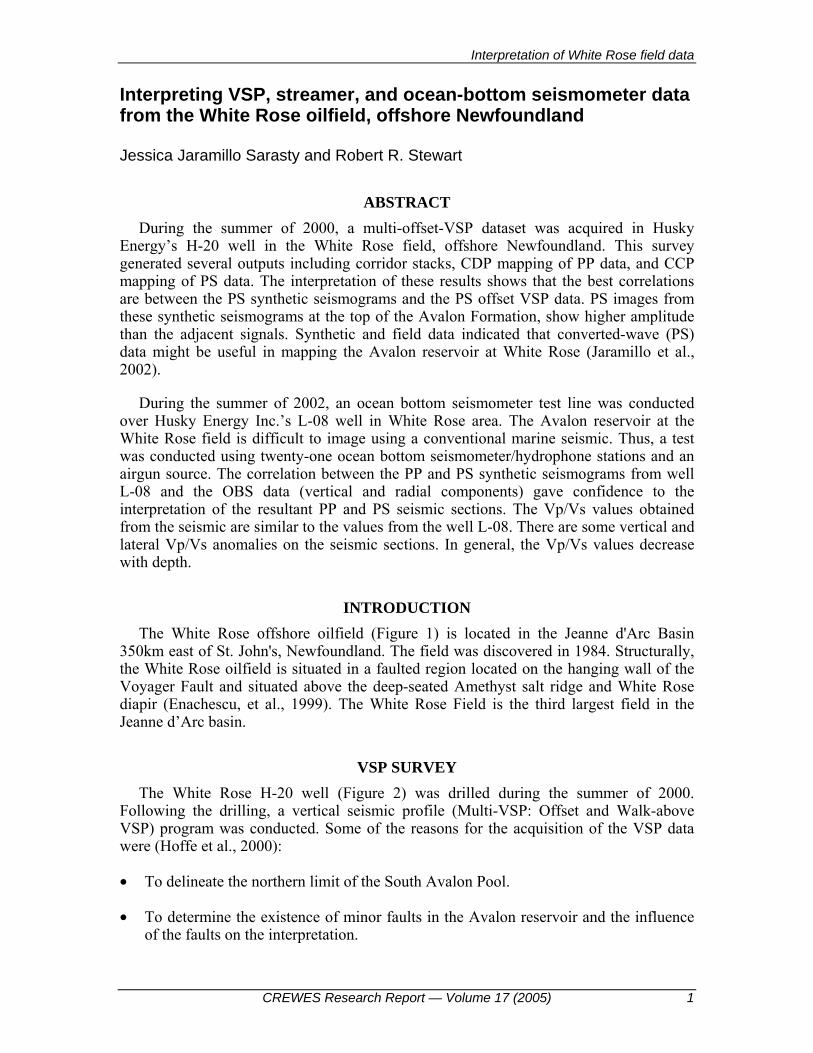
The White Rose offshore oilfield (Figure 1) is located in the Jeanne d'Arc Basin 350km east of St. John's, Newfoundland. The field was discovered in 1984. Structurally, the White Rose oilfield is situated in a faulted region located on the hanging wall of the Voyager Fault and situated above the deep-seated Amethyst salt ridge and White Rose diapir (Enachescu, et al., 1999). The White Rose Field is the third largest field in the Jeanne d’Arc basin.
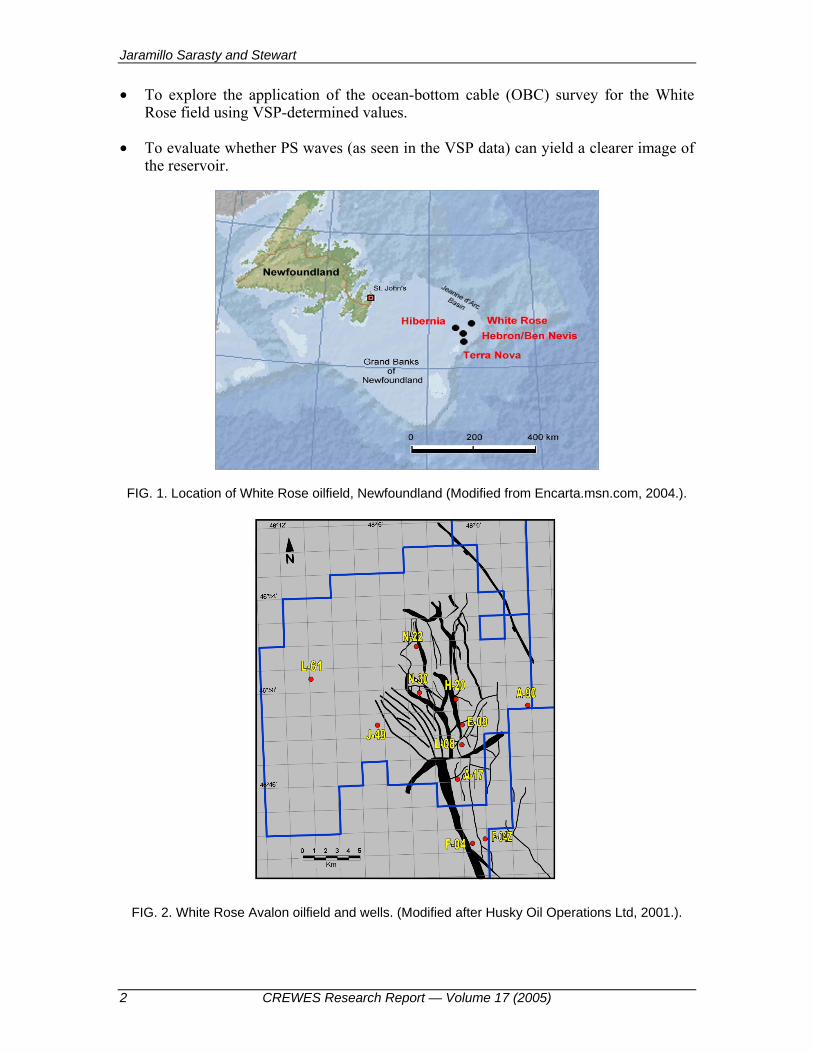
VSP SURVEY The White Rose H-20 well (Figure 2) was drilled during the summer of 2000.
Following the drilling, a vertical seismic profile (Multi-VSP: Offset and Walk-above VSP) program was conducted. Some of the reasons for the acquisition of the VSP data were (Hoffe et al., 2000):
• To delineate the northern limit of the South Avalon Pool.
• To determine the existence of minor faults in the Avalon reservoir and the influence of the faults on the interpretation.
Jaramillo Sarasty and Stewart
2 CREWES Research Report — Volume 17 (2005)
• To explore the application of the ocean-bottom cable (OBC) survey for the White Rose field using VSP-determined values.
• To evaluate whether PS waves (as seen in the VSP data) can yield a clearer image of the reservoir.
FIG. 1. Location of White Rose oilfield, Newfoundland (Modified from Encarta.msn.com, 2004.).
FIG. 2. White Rose Avalon oilfield and wells. (Modified after Husky Oil Operations Ltd, 2001.).
Interpretation of White Rose field data
CREWES Research Report — Volume 17 (2005) 3
The processing of the VSP dataset was conducted by Schlumberger, Canada, and their processing generated several outputs such as (1) the corridor stack, (2) VSP-CDP map of the PP, and (3) VSP-CCP map of the PS data. In this section, I will review the analysis of the well logs and the correlation of the reflected P (P-P) and converted S (P-S) synthetic seismograms to the seismic data. The correlations will be shown for:
• PP synthetic seismograms to the PP offset VSP data;
• PP synthetic seismogram to the walk-above VSP (PP only) data;
• PP synthetic seismograms to the seismic section (PP only);
• PS synthetic seismograms to the PS (S) offset VSP data;
• Walk-above VSP P-wave data to the P wave seismic section.
Two VSP datasets resulted from the acquisition of the VSP. They were the offset and walk-above VSP.
Interpretation For the synthetic seismograms, a suitable wavelet was chosen to attempt to match the
surface seismic wavelet. The wavelet used in the synthetic seismogram generation was a Ricker wavelet with a centre frequency of 45 Hz. The next step was to match the synthetic seismogram with the P-P seismic section and with the P wave and PS VSP data. The procedure is described below.
Tie of PP synthetic seismograms with PP offset VSP field data. The matching of the PP synthetic seismogram with the PP VSP-CDP transformed data
section (Figure 3) shows a good correlation. The events correlated are described as follows:
Eocene (EOCN): The Eocene is a significant event in the synthetic surface seismic display (Panel 3a). The modelled offsets were from 0 (synthetic seismogram) to 2000 m (the offset in the VSP).
South Mara (Smara): The South Mara event is easy to interpret on the synthetic seismogram. In the synthetic seismic plot, the amplitude decreases from the 1200 m to 2000 m offset. In the VSP-CDP data, the South Mara is a strong event. The South Mara events near the 0 distance offset, however, begin to exhibit distortion at the inner VSP offsets.
Base of Tertiary Unconformity (Btrt): This is a strong event on both sets of traces. The VSP-CDP events show NMO problems at shallow depths (Panel (a)). The neighbouring amplitudes decrease with offset in the synthetic seismogram.
Nautilus (Naut): This event is also easy to recognize on the synthetic. The amplitude on both data sections (Panels 3a and 3b) is a strong peak and decreases slightly with offset in the synthetic seismogram. The formation event in the VSP-CDP section shows

Jaramillo Sarasty and Stewart
4 CREWES Research Report — Volume 17 (2005)
events that can be correlated to several subunits of the Nautilus shale between the Nautilus and the Avalon events. In the VSP-CDP data, the subunit events are possibly contaminated by mode-converted residual SV events.
Avalon (Aval): The top of this formation is a siltstone. This is in contact with the basal unit of the Nautilus, which is a silty sandstone that grades upward into siltstone. The low amplitude events are associated with this event. The acoustic impedance values of the various layers of the Avalon result in low reflection coefficients. In the synthetic seismogram, the Avalon sandstone reflection event is powerful; however, the VSP-CDP reflections are less clear.
Eastern Shoals (Eshl): This is a clear event seen in both Panels 3a and 3b.
FIG. 3. Result from matching the PP synthetic seismogram (Panel a) and the offset VSP section (Panel b). Key: Eocene EOCN, South Mara Smara, Base Tertiary Btrt, Nautilus Naut, Avalon Aval, Eastern Shoals Eshl.
Tie of PS synthetic seismograms with PS offset VSP-CCP field data Figure 4 shows the correlation of the P-S synthetic seismogram with the same
reflections seen on the VSP-CCP, as described below:
Eocene (EOCN): The shallow Eocene event in Panel 3a shows a much lower amplitude than the same event in the VSP-CCP section.
South Mara (Smara): The South Mara events correlate in Panels 3a and 3b. On the synthetic seismogram, the reflection amplitude increases with offset. The VSP-CCP data show less amplitude change.

Interpretation of White Rose field data
CREWES Research Report — Volume 17 (2005) 5
Base of Tertiary Unconformity (Btrt): This is a strong event on the synthetic and real data, Panels (a) and (b). The amplitude increases with offset in the synthetic seismogram, since the shear waves have small reflections at near offset.
Nautilus Shale (Naut): The top of this formation is easy to recognize on the real data. The amplitude of the event on Panels (a) and (b) is strong and increases with offset. The three subunits of the Nautilus shale are interpretable in these panels.
Avalon Formation (Aval): As shown in the PP analysis, the reflection coefficient between the Nautilus silty sandstone and the Avalon siltstone is low. However, in this analysis (PS synthetic seismogram and S-VSP section), the match is clearer. The predicted ρ value shows minor improvement on the event. At the base of the Avalon Formation one can see events probably related to the basal subunit that has shales interbedded with sandstones.
Eastern Shoals (Eshl): It is easy to follow the event on the synthetic seismogram, but in the VSP-CCP section the interpretation is not clear.
FIG. 4. Result from matching the PS synthetic seismogram (Panel a) and the Offset VSP section (Panel b). Key: Eocene EOCN, South Mara Smara, Base Tertiary Btrt, Nautilus Naut, Avalon Aval, Eastern Shoals Eshl.
PP synthetic seismogram with the walk-above VSP (PP) field data Figure 5 is the result of comparing the PP synthetic seismogram events and the walk-
above VSP-CDP transformed VSP section. In the synthetic traces, the Eocene, South Mara, Base of Tertiary Unconformity, and the Nautilus Shale events have high amplitude. In the walk-above VSP data these events are difficult to follow. This is due to the lack of VSP fold near the surface.

Jaramillo Sarasty and Stewart
6 CREWES Research Report — Volume 17 (2005)
The Avalon Formation has the same problem. The interface between the Nautilus shale and the top of the Avalon sandstone is again difficult to observe. The Avalon event amplitude is low, due to the near constant lithology, and the event in the VSP section is not easily defined. The walk-above VSP is still providing a low-fold event. The Eastern Shoals event is easy to follow on both sections (Panels 5a and 5b).
FIG. 5. Result from matching the PP synthetic seismogram (Panel a) and the Walk-above VSP section (Panel b). Key: Eocene EOCN, South Mara Smara, Base Tertiary Btrt, Nautilus Naut, Avalon Aval, Eastern Shoals Eshl.
PP synthetic seismograms with the seismic section (PP) The comparison between the walk-above VSP (P wave) and the PP seismic section,
the correlation is reasonable. It is possible to postulate a fault crossing the Avalon sandstone reservoir. However, the interface between the Nautilus shale and the top of the Avalon sandstone (which is a siltstone) is difficult to observe.
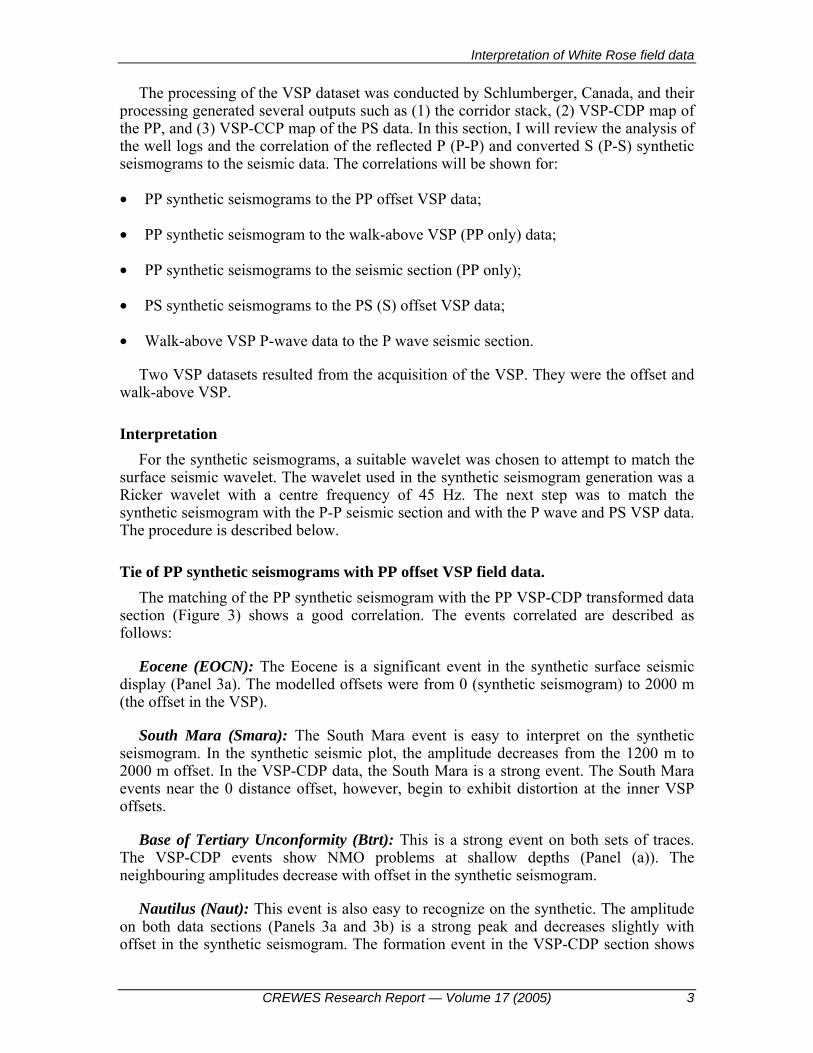
As a final comparison, Figure 6 shows the PP synthetic seismogram and the PP seismic section (streamer survey acquired by Husky in 1997). The comparison of the synthetic seismogram and seismic section data in Panel (b) shows that the tops in the synthetic seismogram correlate well with the seismic section. South Mara, Base of Tertiary and Nautilus are mostly flat events that can be follow along the section. Avalon and Eastern shoals events are affected by faulting.
The PS section (Figure 4) assists in the correlation of the zones of interest (the interface between the Nautilus and Avalon formations). The PP correlation was less clear for the lithological correlation. The difficulty in defining the boundary between the Nautilus shale with the Avalon siltstone still remains.
Interpretation of White Rose field data
CREWES Research Report — Volume 17 (2005) 7
FIG. 6. Result from matching the PP synthetic seismogram (Panel a) and the PP seismic section (Panel b). Key: Eocene EOCN, South Mara Smara, Base Tertiary Btrt, Nautilus Naut, Avalon Aval, Eastern Shoals Eshl.
2000 OBS SURVEY During the summer of 2000, Dalhousie University in Halifax (Nova Scotia) and other
institutes acquired an ocean-bottom seismometer/hydrophone (OBS/H) transect off the east coast of Canada (Figure 7) as part of the SCREECH (Studies of Continental Rifting and Extension on the Eastern Canadian Shelf) project (Louden and Funck, 2000). According to Louden and Funck (2000), the objectives of this survey were mainly continental margin information.
Survey equipment To acquire this survey, 2 ships were used. The R/V Oceanus deployed and recovered
the 4C-OBS/H and the R/V Ewing was the source vessel. The instruments were deployed in water depths up to and exceeding 4000 m. An 8540 cu. in. air gun array provided the acoustic source for the OBS/H and the multi-channel seismic (MCS) data was recorded on a 480-channel, 6-km long streamer (Louden and Funck, 2000). The equipment used to acquire the wide-angle data for the survey consisted of 29 ocean-bottom receivers.
The program was divided into three transects (Figure 7). This paper looks at the third transect. On each transect, the OBS line was shot at a 200-metre shot spacing to reduce noise from previous shot.
Interpretation A preliminary analysis of the 4C receiver gathers (from the 2000 SCREECH survey)
on transect 3 was conducted (Stewart et al., 2001). Vertical and radial NMO-corrected receiver gathers showed some interesting events (Figure 8). We were able to identify a

Jaramillo Sarasty and Stewart
8 CREWES Research Report — Volume 17 (2005)
strong event that could be the Base of Tertiary unconformity. From this point, the identification of several events on the sections motivated the development of the OBS seismic survey in 2002.
FIG. 7. Location of SCREECH survey, showing three transects of the survey across the Newfoundland continental margin. (Modified from odp.tamu.edu)
FIG. 8. Vertical and radial component seismic sections at station 3090 (Stewart et al, 2001). Note that the reflector at 4000 ms in Panel (a) could be related to the Base of Tertiary event and may correspond to the event at 6000 ms in panel (b).
Interpretation of White Rose field data
CREWES Research Report — Volume 17 (2005) 9
2002 OBS SURVEY
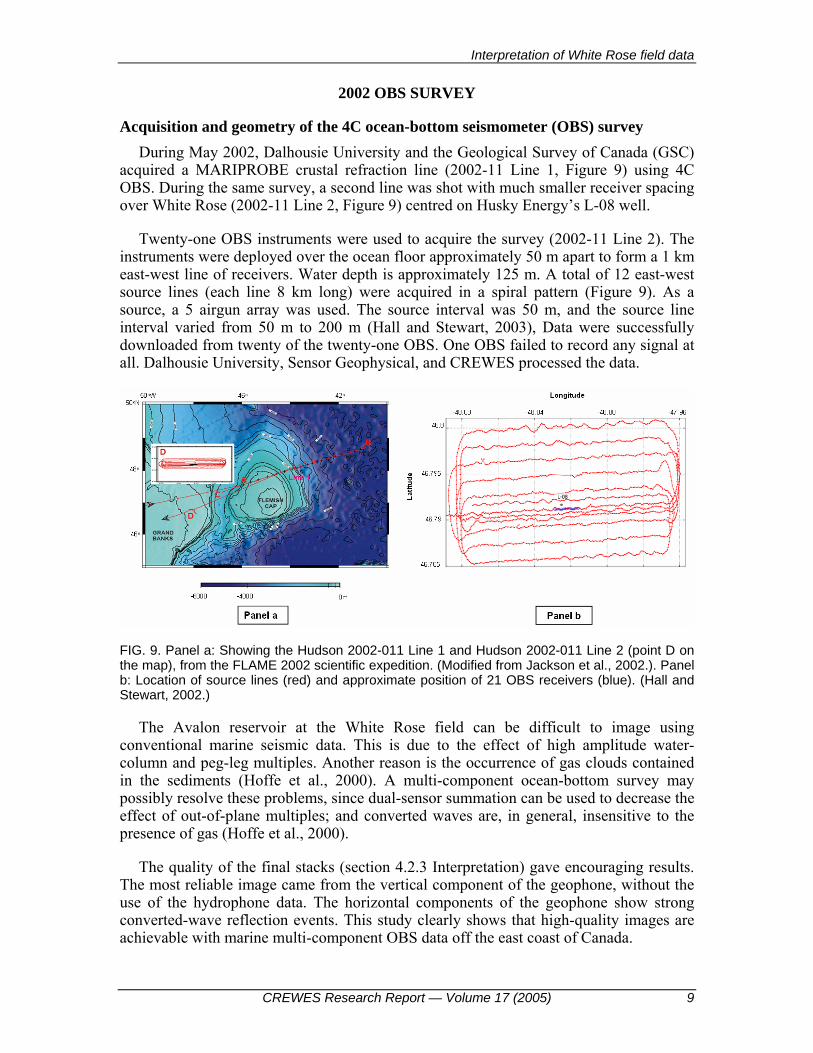
Acquisition and geometry of the 4C ocean-bottom seismometer (OBS) survey During May 2002, Dalhousie University and the Geological Survey of Canada (GSC)
acquired a MARIPROBE crustal refraction line (2002-11 Line 1, Figure 9) using 4C OBS. During the same survey, a second line was shot with much smaller receiver spacing over White Rose (2002-11 Line 2, Figure 9) centred on Husky Energy’s L-08 well.
Twenty-one OBS instruments were used to acquire the survey (2002-11 Line 2). The instruments were deployed over the ocean floor approximately 50 m apart to form a 1 km east-west line of receivers. Water depth is approximately 125 m. A total of 12 east-west source lines (each line 8 km long) were acquired in a spiral pattern (Figure 9). As a source, a 5 airgun array was used. The source interval was 50 m, and the source line interval varied from 50 m to 200 m (Hall and Stewart, 2003), Data were successfully downloaded from twenty of the twenty-one OBS. One OBS failed to record any signal at all. Dalhousie University, Sensor Geophysical, and CREWES processed the data.
FIG. 9. Panel a: Showing the Hudson 2002-011 Line 1 and Hudson 2002-011 Line 2 (point D on the map), from the FLAME 2002 scientific expedition. (Modified from Jackson et al., 2002.). Panel b: Location of source lines (red) and approximate position of 21 OBS receivers (blue). (Hall and Stewart, 2002.)
The Avalon reservoir at the White Rose field can be difficult to image using conventional marine seismic data. This is due to the effect of high amplitude water-column and peg-leg multiples. Another reason is the occurrence of gas clouds contained in the sediments (Hoffe et al., 2000). A multi-component ocean-bottom survey may possibly resolve these problems, since dual-sensor summation can be used to decrease the effect of out-of-plane multiples; and converted waves are, in general, insensitive to the presence of gas (Hoffe et al., 2000).
The quality of the final stacks (section 4.2.3 Interpretation) gave encouraging results. The most reliable image came from the vertical component of the geophone, without the use of the hydrophone data. The horizontal components of the geophone show strong converted-wave reflection events. This study clearly shows that high-quality images are achievable with marine multi-component OBS data off the east coast of Canada.

Jaramillo Sarasty and Stewart
10 CREWES Research Report — Volume 17 (2005)
Processing of the OBS data There were numerous problems with the data, but some promising final sections were
achieved for both PP waves (vertical channel) and PS waves (radial channel). Processes applied to the data included data clipping repair, F-K and tau-p filtering, PP and PS stacking, and post-stack migration. The final images show substantial promise for multi-component marine data in the White Rose area (Cary and Stewart, 2003).
Interpretation Before we start the interpretation of the OBS data, we need correlate of the well log
data from well H-20 (previous section) and well L-08 (Figure 2). This would lend confidence to the interpretation of the different horizons on the OBS seismic sections. First, the synthetic seismograms from both wells were compared. In this case, we used a 45-Hz Ricker wavelet for both wells. The interpretation is in Figure 10, Panels (a) and (b).
Eocene (EOCN)-Tertiary E event (TrtE): From the H-20 synthetic, the Eocene event is a strong peak which maintains nearly the same amplitude with offset; on the PS synthetic the event increases amplitude with offset. In the L-08 synthetics, the event is strong in both PP and PS modes but less strong than the H-20’s results. These two events are difficult to match.
South Mara (Smara): The South Mara event is easy to identify in both wells, having a strong peak. In well H-20, the amplitude is constant on the PP section, and on the PS section the amplitude increases with offset. In well L-08, the amplitude decreases with offset for the P wave and increases with offset for the S wave. The events are easy to correlate.
Base of Tertiary Unconformity (Btrt): The Base of Tertiary unconformity is our event guide, as the strongest event is the seismogram. On both wells, the event is constant on the PP synthetic and increases amplitude with offset in the PS seismogram. The event is very easy to correlate between wells.
Nautilus Shale (Naut): The Nautilus shale has a strong response in well H-20, exhibiting increasing amplitude with offset. The event in the well L-08 is not as strong as well H-20 but still recognizable. In well L-08, the event decreases in amplitude with offset. The event can be matched between wells.
Avalon Formation (Aval): The Avalon formation shows a strong event in well H-20. The event increases in amplitude with offset for the P and S sections. In well L-08, the event is not easy to identify. The amplitude of the event is not strong and the event is related to a zero crossing of the trace in the P and S seismograms. It was not possible to correlate the event between wells.
Eastern Shoals (Eshl): This event is strong in both wells. On the P seismograms from both wells, the amplitude increases with offset. The PS seismograms in both wells show that the event decreases its amplitude with offset. The Eastern Shoals event is correlated between wells.

Interpretation of White Rose field data
CREWES Research Report — Volume 17 (2005) 11
It is important to remember that the distance between these two wells is close to 4 km. This could be one of the reasons for the difficulty in correlating the Avalon Formation between the wells, in addition to the complexity of the structures present in the area. Below the Tertiary unconformity, the presence of several regional faults affects the sequence, as do the compaction processes that took place in the area, affecting the lithological units in some manner at each location.
FIG. 10. Results from correlating the PP and PS synthetics from wells H-20 and L-08.
After the correlation between H-20 and L-08 wells, we applied a bandpass filter (4/8 25/30) to our 45-Hz Ricker wavelet seismograms to obtain a better result (Figure 11). The analysis of the interpretation is in Figure 11, Panels (a) and (b).
Tertiary E event (TrtE): This event is strong on both panels. The amplitude is constant with offset for the P section. An increase in amplitude with offset is seen in the PS section.
South Mara (Smara): The South Mara is a strong event and easy to identify. The amplitude is also constant, with an increase in amplitude with offset in the PS seismogram.
Base of Tertiary Unconformity (Btrt): This event has a strong response with the bandpass applied. The amplitude increases with offset on both synthetics.
Nautilus (Naut): This event is not evident on the P seismogram. On the PS seismogram, the event is defined as a zero crossing and as a peak, but is still difficult to distinguish.

Jaramillo Sarasty and Stewart
12 CREWES Research Report — Volume 17 (2005)
Avalon (Aval): The results are good; we can see the event on both sections. The P seismogram shows an event that decreases its amplitude with offset but can be seen at ~1000 m offset. The PS synthetic shows a better reflection that is easy to follow.
Eastern Shoals (Eshl): The Eastern Shoals is also a strong event. The amplitude increases with offset and we can correlate both synthetics easily.
FIG. 11. Result from matching the PP and PS synthetics from well L-08.
After doing the interpretation and correlation of these two wells (L-08 and H-20, Figures 10 and 11) we can start with the OBS interpretation. These correlations between wells will help in the process of correlation between the well L-08 and the OBS seismic data.
During the interpretation stage of the project, we used Hampson-Russell PROMC software. This software is designed to help in the analysis and interpretation of multi-component seismic data. The OBS data and the L-08 well data (Vp, Vs, GR, and ρ — Figure 4.14) were loaded to start the interpretation. After loading the OBS data (P, S and hydrophone component data), well L-08 was tied, to lend more confidence to the horizons defined on the OBS data.
Before interpretation, the Base of Tertiary unconformity event was flattened to facilitate an improved image of the horizons below this event. The horizons were picked on the seismic sections. The interpretation of the seismic data began with the correlation of the Base of Tertiary unconformity on both sections (well log data and seismic), and from that point the other events were correlated — in this case, Tertiary formation, South Mara, Nautilus, Avalon, and Eastern Shoals. On the seismic, the presence of a strong and continuous event below the Eastern Shoals was also noticeable, which we called Horizon.
Interpretation of White Rose field data
CREWES Research Report — Volume 17 (2005) 13
This event was used as a complementary guide to help define the main events (Tertiary E, South Mara, Base of Tertiary, Nautilus, Avalon, and Eastern shoals).
PP (Vertical component) interpretation The data found in this component is clear (Figure 12): there are some seismic events
that can be followed along the survey without difficulty (South Mara, Base of Tertiary, and Nautilus). The analysis is seen in Figure 12. In general, the seismic section shows that the Tertiary events are continuous, with strong seismic signatures. Below the Tertiary unconformity, events can be followed; however, there is a lot of disturbance in the Avalon and Eastern Shoals events. This could be due to imaging, structural factors, unattenuated multiples or out off line energy.
After tying the L-08 well log to the OBS vertical seismic data, we used the PP synthetic seismogram (4/8 25/30 bandpass wavelet, Figure 11, Panel (a)) to help us obtain a better correlation of the horizons, which are defined as follows:
South Mara (Smara) and Base of Tertiary unconformity (Btrt): are the two events that have a strong seismic signature along the survey. Both events are strong and display a flat horizon;
Nautilus (Naut): this event can be interpreted as a “flat horizon”. Analyzing the data from north to south we can observe that the top is affected by some compressional faults on the west side of the survey, the presence of these thrust faults is more evident on the east side of the survey than on the west side, where the faults do not affect the event as much.
Avalon (Aval): this event appears as a continuous horizon that in some parts seems to disappear into an upper event. This disturbance could be due to imaging, structural factors, unattenuated multiples or out off line energy. In other parts, it is easy to follow.
Eastern Shoals (Eshl): the event can be followed, although in some parts there are some break-ups in the event which could indicate faulting events or imaging problems.
After comparing the seismic vertical component data and the PP synthetic (Figure. 12), a good correlation between the Tertiary E, South Mara, Tertiary Unconformity and Eastern Shoals was found. The results for the Avalon, and Nautilus are not as good as the other events, but are encouraging. As noted previously, the Base of Tertiary event was flattened; however, the events below this unconformity show a certain uplift on the west side that could be due to the effect of the faults that surround the area where well L-08 is located (Figure 12).
Hydrophone (pressure component) interpretation This component (Figure 13) shows clear seismic results, most of the horizons being
easy to follow. The seismic result shows a very approachable section, where the Tertiary events are identified easily, and that can be followed from E to W. The Cretaceous horizons are easy to follow, although they seem to be affected by faulting. Even so, almost the entire event can be followed along the seismic section. The quality of these sections could be due to the increase sensitivity of the hydrophone to the reflected waves.
Jaramillo Sarasty and Stewart
14 CREWES Research Report — Volume 17 (2005)
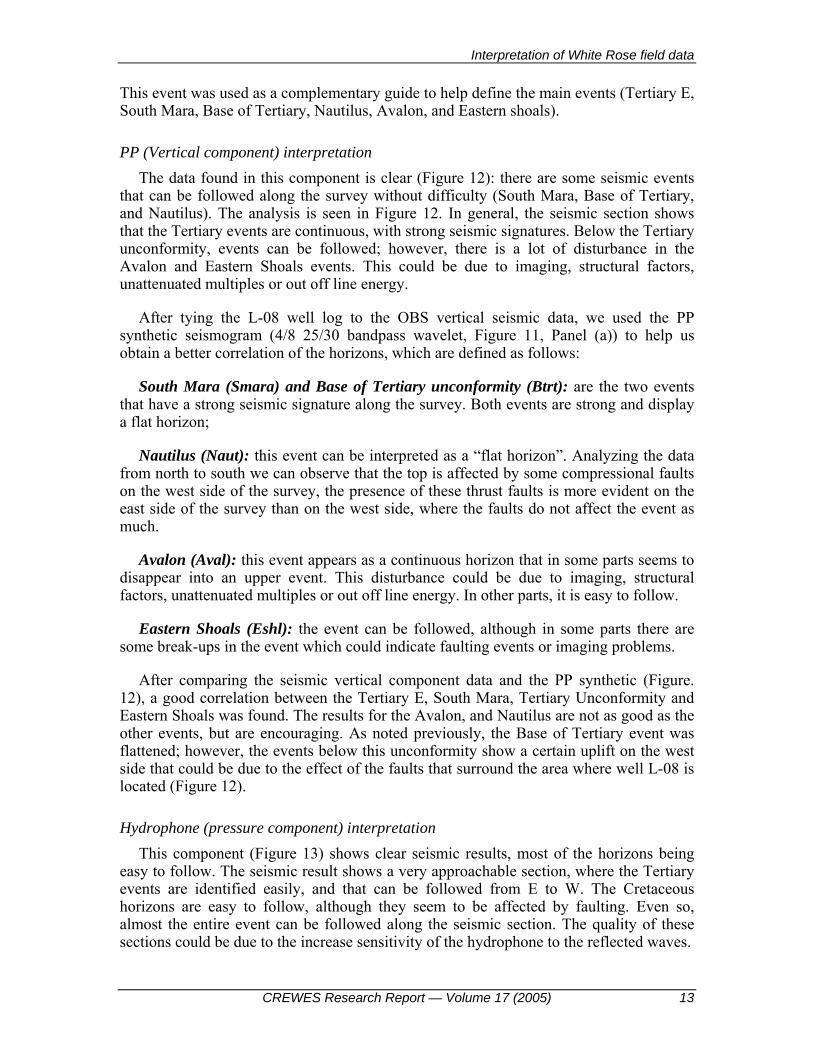
After tying the L-08 well log to the OBS horizontal seismic data, we used a PP synthetic seismogram (4/8 25/30 bandpass wavelet; Figure 11, Panel (a)). The following analysis refers to Figure 13:
FIG. 12. Well L-08 PP synthetic and vertical component sections, showing Inline 19 in a W-E direction. The horizons have been defined (TrtE, South Mara, Base of Tertiary, Nautilus, Avalon, and Eastern Shoals) after tying the well L-08 with the seismic. The data were flattened at the Base of Tertiary unconformity to facilitate the interpretation.
South Mara (Smara) and Base of Tertiary unconformity (Btrt): both events are easy to identify. Still, the Base of Tertiary event has stronger impedance than the South Mara event. These events can be seen as flat features, very similar to those seen on the vertical and radial components. The Base of Tertiary event is not as strong as it is on the vertical component; this is similar to the response of the radial component, allowing us to have better reflections from the Avalon event. These results, along with the similar results from the PS component, give an improved image of the reservoir over that obtained if we just used the PP results. Both events can be followed easily along the survey.
Nautilus (Naut): is a continuous event. This event shows up better on this component than on the vertical or radial components. The amplitude is strong and it seems to be affected by some faults on the NE side of the survey.
Avalon (Aval): can be followed along the section. The amplitude is strong. It seems to have some faults affecting the event. This component shows an improved image of the horizon.
Eastern Shoals (Eshl): is only seen in the SW part of the section, where it has continuous and strong amplitude that diminishes laterally until nearly disappearing. On the PP section, this event does not appear to be affected by faults. For that reason, the disappearance of the event could be due to imaging problems.
Interpretation of White Rose field data
CREWES Research Report — Volume 17 (2005) 15
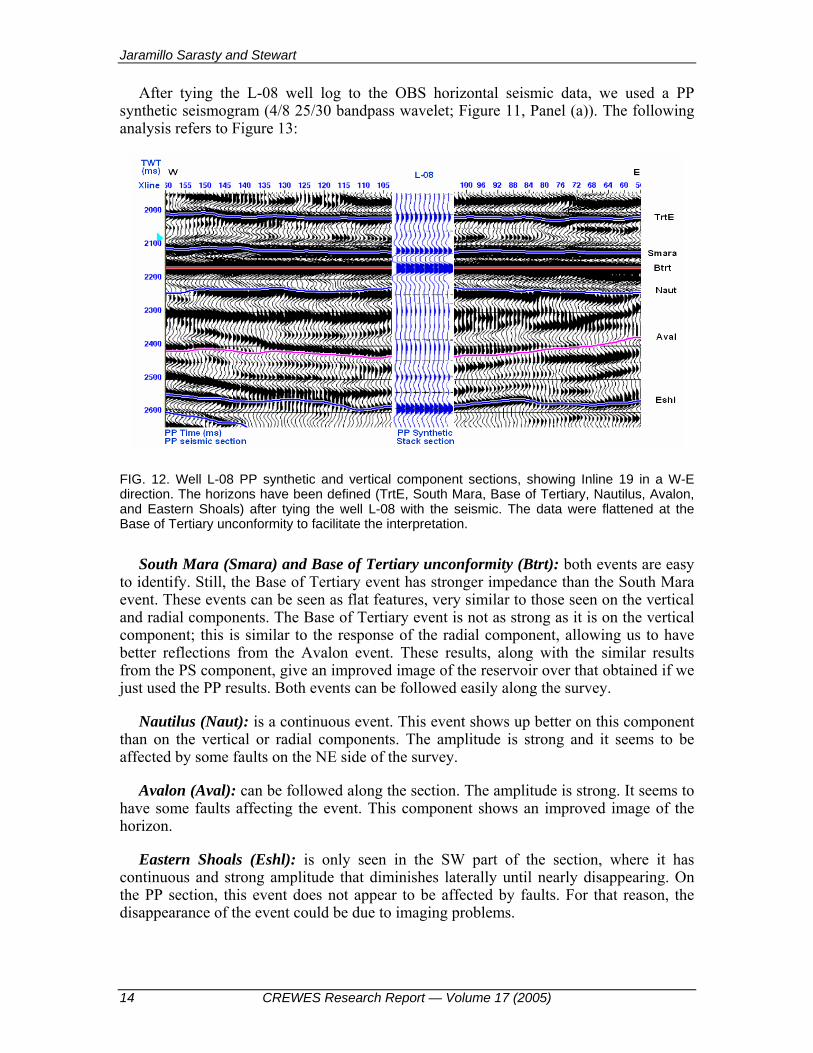
The results from the comparison between the seismic pressure component data and the PP synthetic (Figure 13), are similar to those obtained from the PP section (Figure 12). It is possible to match the Tertiary events and the Eastern Shoals events. The other events (Nautilus and Avalon) could appear to be shifted due to sonic stretch.
FIG. 13. Well L-08 PP synthetic and hydrophone component section. The horizons defined (TrtE, South Mara, Base of Tertiary, Nautilus, Avalon and Eastern Shoals) after tying the well L-08 with the seismic. The data were flattened at the Base of Tertiary unconformity to facilitate the interpretation. Showing Inline 19.
PS (Radial component) interpretation This component (Figure 14) reveals complex seismic results. Most of the horizons are
difficult to follow, but in general, the final outcome is reasonable. The Tertiary events show some irregularities; they are not continuous as in the PP seismic section. The amplitude of the Tertiary events is lower than the amplitude found in the PP seismic section. For the Cretaceous events, below the Nautilus (~4100 ms PS time) the horizons cannot be easily defined: there is irregularity that could be due to the imaging or to the presence of faults that are affecting the horizons (for example, around 2400 ms on the W side of the PP section Figure 12), and that make it difficult to follow the events (Avalon and Eastern Shoals Formations).
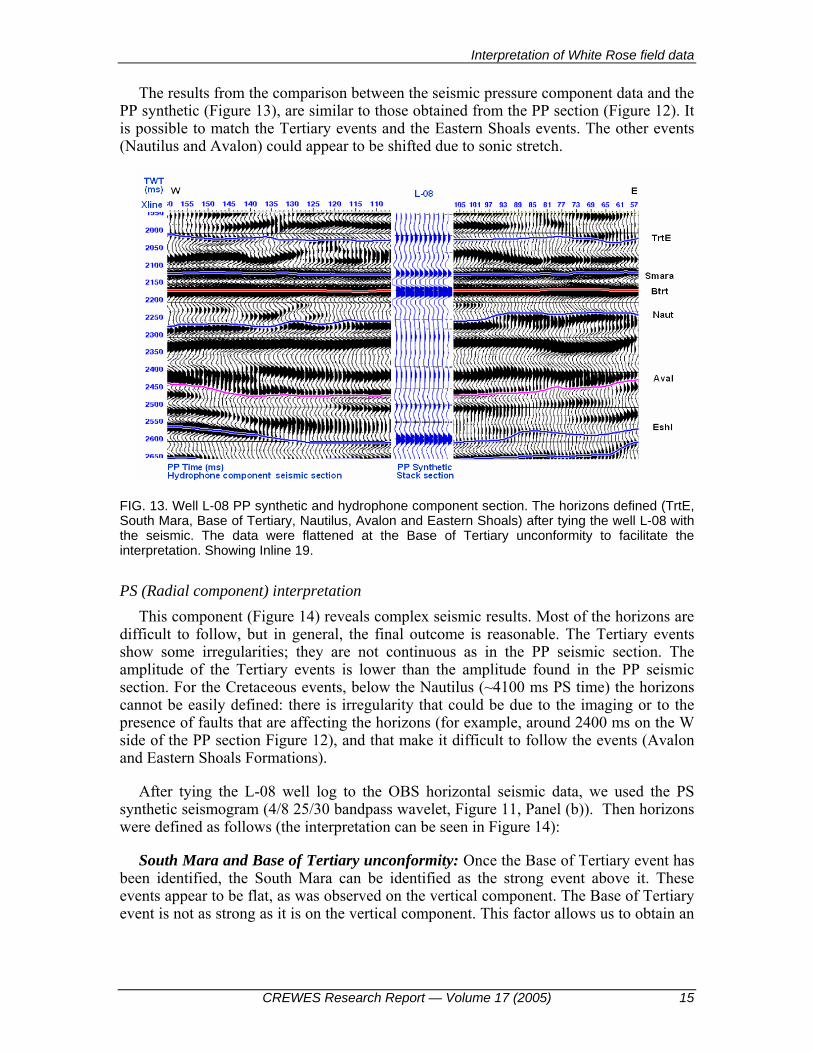
After tying the L-08 well log to the OBS horizontal seismic data, we used the PS synthetic seismogram (4/8 25/30 bandpass wavelet, Figure 11, Panel (b)). Then horizons were defined as follows (the interpretation can be seen in Figure 14):
South Mara and Base of Tertiary unconformity: Once the Base of Tertiary event has been identified, the South Mara can be identified as the strong event above it. These events appear to be flat, as was observed on the vertical component. The Base of Tertiary event is not as strong as it is on the vertical component. This factor allows us to obtain an

Jaramillo Sarasty and Stewart
16 CREWES Research Report — Volume 17 (2005)
improved image of the reflections from the Avalon Formation. The South Mara is not a continuous event in the north section of the survey.
Nautilus: This is a strong event that is difficult to follow, despite its strong seismic signature. This event is faulted and irregular in most of the area.
Avalon: On the PP section, this event is difficult to define; on the PS section it is difficult to see any continuity of the event in the north section of the survey. Of all the previous events, the Avalon event is the most affected. However, the interpretation of this event along the south section of the survey is possible. The difficulty of seeing the event clearly in the north section could be due to the presence of noise and faulting affecting the area. The amplitude of the event varies along the survey.
Eastern Shoals: Comparing the results from the Avalon top, this event, shows a small continuity of the horizon. It is still not a strong peak, but gives some kind of continuity of the event. The amplitude of this event varies continually, making it difficult to define the horizon.
FIG. 14. Well L-08 PS synthetic and radial component section showing Inline 19. The horizons were defined (TrtE, South Mara, Base of Tertiary, Nautilus, Avalon, and Eastern Shoals) after tying well L-08 with the seismic. The data were flattened at the Base of Tertiary unconformity to facilitate the interpretation.
The results from the comparison between the seismic radial component data and the PS synthetic (Figure 14) are encouraging. The correlation of the Nautilus, Avalon and Eastern Shoals events are improved in the PS analysis. However, we have to bear in mind that the weak event continuity on the radial section sometimes makes it difficult to follow the events (Avalon and Eastern Shoals Formations) along the seismic section. Despite this the results are reasonable.

Interpretation of White Rose field data
CREWES Research Report — Volume 17 (2005) 17
Correlation
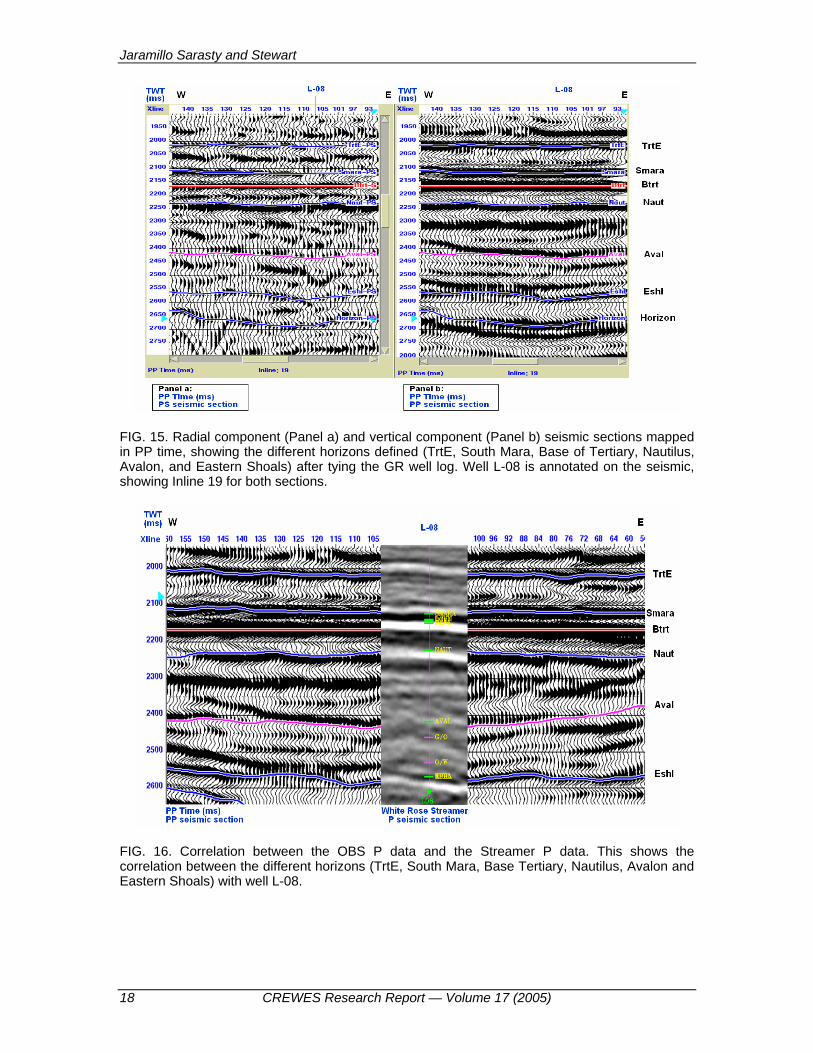
PP (Vertical component OBS data) - PS (Radial component OBS data) Once the radial component is mapped into PP time, we can correlate it with the
vertical component seismic section (Figure 15). It is observable that all the different events involved in the interpretation (TrtE, South Mara, Base of Tertiary, Nautilus, Avalon and Eastern Shoals, Horizon) have a reasonably good match, although there is still some ambiguity with the Nautilus and Avalon events. There are some problems in correlating these formations, but despite this, the results shows promise in imaging the reservoir.
PP (Vertical component OBS data) – Streamer P data 1997 During the summer of 1997, a streamer seismic survey (the White Rose PGS 97) was
acquired over a hexagonal area of 311 km2. This survey was done to understand the structural and tectonic framework, to correlate stratigraphy, and locate delineation and development wells for interpreting the White Rose Field (Husky Oil Operations Ltd, 2001).
There was a reasonable correlation between the P streamer data and the OBS P data (Figure 16). The match of the different horizons (South Mara, Base of Tertiary, Nautilus, Avalon and Eastern Shoals) was reasonable.
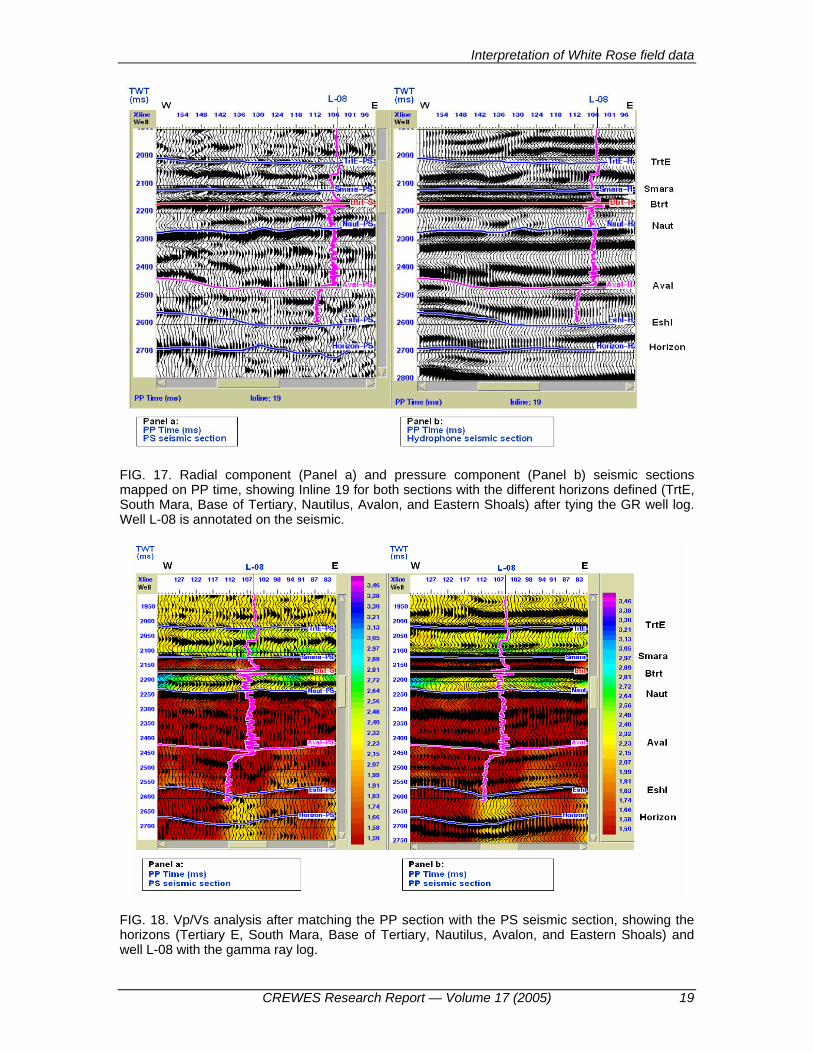
PS (Radial component OBS data) - Hydrophone (Pressure component OBS data) The pressure component and the radial component seismic sections (Figure 17) show a
reasonable correlation for the Tertiary events (South Mara and Base of Tertiary). The TrtE event is shifted. The Cretaceous events do not show good correlation. The Nautilus and Avalon events can be followed from component to component. There is no correlation for the Eastern Shoals and the Horizon events.
Vp/Vs analysis After mapping the PS data into PP time, the horizons from the vertical and radial
components were correlated, making it possible to see the Vp/Vs values used on the matching process of the seismic sections (Figure 18).
Figure 18 shows that for the Tertiary E horizon there is a Vp/Vs of ~1.84–3.59, interpreted as indicating shales, while South Mara, with a Vp/Vs ~1.81–2.21, is interpreted as being composed of sandstones and siltstones. The horizon directly beneath the Tertiary unconformity is comprised of sediments of Petrel limestone; the values found in the seismic section are ~1.81–2.23. Nautilus has approximate values of 1.67–1.98 for shales and sandstones. The Avalon horizon has a range of values from ~1.52–1.91. Eastern Shoals has a wide range of values from ~1.7–1.81, interpreted as belonging to calcareous sandstone-siltstone
Jaramillo Sarasty and Stewart
18 CREWES Research Report — Volume 17 (2005)
FIG. 15. Radial component (Panel a) and vertical component (Panel b) seismic sections mapped in PP time, showing the different horizons defined (TrtE, South Mara, Base of Tertiary, Nautilus, Avalon, and Eastern Shoals) after tying the GR well log. Well L-08 is annotated on the seismic, showing Inline 19 for both sections.
FIG. 16. Correlation between the OBS P data and the Streamer P data. This shows the correlation between the different horizons (TrtE, South Mara, Base Tertiary, Nautilus, Avalon and Eastern Shoals) with well L-08.
Interpretation of White Rose field data
CREWES Research Report — Volume 17 (2005) 19
FIG. 17. Radial component (Panel a) and pressure component (Panel b) seismic sections mapped on PP time, showing Inline 19 for both sections with the different horizons defined (TrtE, South Mara, Base of Tertiary, Nautilus, Avalon, and Eastern Shoals) after tying the GR well log. Well L-08 is annotated on the seismic.
FIG. 18. Vp/Vs analysis after matching the PP section with the PS seismic section, showing the horizons (Tertiary E, South Mara, Base of Tertiary, Nautilus, Avalon, and Eastern Shoals) and well L-08 with the gamma ray log.

Jaramillo Sarasty and Stewart
20 CREWES Research Report — Volume 17 (2005)
The Vp/Vs analysis of the different horizons is explained as follows, beginning with an analysis of the Vp/Vs values from the well log data and following with an analysis of the average interval Vp/Vs maps for each horizon from the seismic section (Figure 19).
Tertiary E Horizon (TrtE). Most of the Tertiary sediments are shales. Tertiary E shale is about ~149.88 m thick (from well log data). This Formation could be divided into three sections where the upper section shows decreasing Vp/Vs values with depth from ~3.59–1.9; the middle section (at ~2155 m) shows increasing Vp/Vs value with depth (~2.0–2.35); and the lower section (at ~2254 m) has Vp/Vs values decreasing significantly with depth (~2.35–1.84). From the Vp/Vs map (Figure 19) the main range of values is ~1.9-3.12, likely indicating shales and some sandstones. These values are reasonably distributed along the area of the study. On the NW section there are some higher values ~3.37, interpreted as indicating high shaly areas.
South Mara Horizon (Smara): This sandstone-siltstone formation is about ~55.88 m thick. There are anomalous Vp/Vs values; this could be due to its proximity to the Tertiary unconformity at the bottom of the formation. The upper section of the formation increases values with depth (~1.8–2.21). At ~2300 m the values of Vp/Vs decrease with depth (~2.21–1.8). Figure 19 shows an average interval in the main area of ~1.74–2.15, which could be interpreted as sandstones and siltstones. Anomalous values ~3.37 on the NW side of the area were found.
Base of Tertiary Horizon (Btrt): Directly beneath the unconformity there is the Petrel limestone with ~148.88 m of thickness. At the top of the formation the values increase with depth drastically (~1.8–2.23); this could be due to the unconformity. Below ~2320 m, the values decrease with depth in the well (2.23–1.8). The presence of anomalous values is noticeable on the well log data. The average interval Vp/Vs map for this horizon (Figure 19) shows a main trend of ~1.9–2.25 that could indicate limestones. Some anomalous values ~2.87–3.37 lie to the NW.
Nautilus Horizon (Naut): The Nautilus shale at 350.38 m has a general trend of decreasing Vp/Vs values with depth (~1.98–1.67). There are anomalous values. The Nautilus Formation is subdivided into three units of silty sandstones to siltstones, with limestone also present. The average interval map (Figure 19) shows a general trend of ~2.0–2.62. This range can be interpreted to indicate anything from sandstones to siltstones, including limestones. Also of note are the anomalous values in the NW (~2.87–3.37) and along the south section of the map (~1.75–2.12).
Avalon Horizon (Aval): This horizon has a Vp/Vs range from sandstone to shale values. The approximately thickness is ~279.38 m (well log data). In general, Vp/Vs values increase with depth. According to the ΦD (sandstone matrix) analysis, the range of porosity is from ~0–20% in the Formation. There are several events that help to divide the Formation into three units. From the top of the Formation to the Gas-Oil Contact (GOC), the Vp/Vs values range ~1.52–1.75. At the very top the values are low; this is the shale section with low ΦD values. From the GOC to the Oil-Water Contact (OWC), the values of Vp/Vs increase from ~1.6 to 1.91. From the OWC to the bottom of the formation the range of values decreases to ~1.65–1.75. Figure 19 shows the main range of Vp/Vs for this horizon ~1.6–2.87. These values can indicate rocks ranging from sandstones to shales. There are anomalous values, which in this case could be due to the

Interpretation of White Rose field data
CREWES Research Report — Volume 17 (2005) 21
image of the discontinuous event on the PS seismic section. During the early Cretaceous, the Avalon sandstones were deposited as shoreface sands along a north-south trending shoreline roughly parallel to the eastern margin of the Jeanne d’Arc Basin (Husky Oil, 2001). It is possible to perceive a general north-south trend to the sandstones (Figure 19) in the apparent average interval Vp/Vs Avalon map. It is important to see that the regional trend is observable in a local area.
Eastern Shoals Horizon (Eshl): The Eastern Shoals calcareous sandstone-siltstone horizon has 21 m of thickness. The general trend of the formation (well log data) is decreasing Vp/Vs values (~1.81–1.70) with depth. The average interval Vp/Vs map (Figure 19) shows a main trend of ~1.7–2.5 values, indicating sandstones and siltstones. Anomalous values are present to the NE and SW sides of the area. On the PS section, this horizon is not a continuous event, which could be due to the presence of anomalous values in this horizon and in the Avalon horizon.
FIG. 19. Apparent average interval Vp/Vs maps for each horizon (Tertiary E, South Mara, Base of Tertiary, Nautilus, Avalon, and Eastern Shoals). Well L-08 is shown on each Vp/Vs map. The inline and xline are gridding onto 25x25 bin spacing. Refer to Table 4.1 for Vp/Vs comparison.
Table 1 summarizes the Vp/Vs analysis. The values from the well L-08 data are related to the Vp/Vs values from the OBS seismic (Jaramillo and Stewart, 2004). The presence of higher values in the seismic section could be due to the extension of the area analyzed or difficult picks through low signal/noise events; also, with the OBS analysis, it was possible to see lateral Vp/Vs anomalies in the area.

Jaramillo Sarasty and Stewart
22 CREWES Research Report — Volume 17 (2005)
Table 1. General behaviour of Vp/Vs, showing the general trend found in each Formation for well L-08 and for the OBS seismic data. Key: ♦ indicates the Formation that is directly beneath the Base of Tertiary unconformity.
Vp/Vs
Formation Lithology L-08 logs OBS
Tertiary E Shales ~1.84–3.59 ~1.9–3.12
South Mara Sandstone-siltstone ~1.8–2.21 ~1.74–2.15
Petrel Member♦ Limestone ~1.81–2.23 ~1.9–2.25
Nautilus Shale-mudstone ~1.67–1.98 ~2.0–2.62
Avalon Sandstone-shale ~1.52–1.91 ~1.6–2.87
Eastern Shoals Calcareous sandstone-siltstone ~1.70–1.81 ~1.7–2.50
CONCLUSIONS The P-P synthetic seismograms match reasonable well with the Offset VSP (PP) field
data, with the Walk-above VSP (PP) and the seismic section (PP). The P-S synthetic seismograms correlate with the Offset VSP (PS) field data. Comparing the PS to the PP synthetic seismograms and comparing the field results of the Offset VSP (PS) to the offset VSP (PP), the PS images indicate the event at the top of the Avalon Formation.
Detailed correlation information from the wells L-08 and H-20 enabled the interpretation of the low impedance contrast between the Avalon and Nautilus formations on the synthetic seismograms.
A reasonable data match was found for: 1) PP synthetics & PP vertical component seismic section (OBS): 2) PS synthetics & PS radial component seismic section (OBS).
Vp/Vs values from the seismic and the well L-08 are related, presence of lateral Vp/Vs anomalies is evident on the seismic.
Acquiring converted wave images with the help of an OBS survey should help address the different image challenges of White Rose field.
ACKNOWLEDGEMENTS We would like to thank Larry Mewhort and David Emery from Husky Energy Inc,
Richard Xu and Kevin Hall, from CREWES, Dr Brian Russell from Hampson-Russell, Keith Louden from Dalhousie University for their help in this project. We also thank the CREWES sponsors for their support. We deeply appreciate the release of the log and seismic data from Husky Energy Inc.
Interpretation of White Rose field data
CREWES Research Report — Volume 17 (2005) 23
REFERENCES Cary, P. and Stewart, R. R., 2003, Processing Ocean-Bottom Seismic (OBS) Data from the White Rose
oilfield, offshore Newfoundland, CREWES Research Report, 15. Enachescu M. E., Meehan, P. J., Smee, G. W., Emery, D., Hodder, J., Deutsch, K. and Mayo, L. 1999,
White Rose Oil Field, Offshore Newfoundland (part 1): Drilling History, Geophysical Characterization and Structural Setting. Husky Oil Operation ltd., Calgary, Alberta Canada.
Hall. K. W., and Stewart, R. R., 2002, Survey design and acquisition of a 4-C ocean-bottom seismometer survey over the White Rose oilfield, offshore Newfoundland, CREWES Research Report, 14.
Hoffe, B.H., Lines, L.R., Stewart, R.R., Wright, J.A., and Enachescu, M.E., 2000, A proposed 4C Ocean Bottom Cable (OBC) experiment in the White Rose field, Jeanne-d’Arc basin, offshore Newfoundland, 32 pages.
Husky Oil Operations, 2001, White Rose oilfield development application volume 2 development plan. Jackson, R., Asprey, K., Chapman, B., Goold, S., Girouard, P., Johnston, L., and Louden, K., 2002,
Hudson 20002-011 cruise report. Flemish Cap Margin Transect. Geological Survey of Canada, Open file # 1234. 40 pages.
Jaramillo, S. J., Stewart, R. R., and Emery D. 2002, Interpretation of well log, VSP, and streamer seismic data from the White Rose oilfield, offshore Newfoundland, CREWES Research Report Volume, 14.
Jaramillo, S. J., and Stewart, R. R., 2004, Interpretation of PP and PS seismic data from the White Rose oilfield, offshore Newfoundland. CREWES Research Report, 16.
Louden, K.E. and Funck, T., 2000, SCREECH: Study of continental rifting and extension on the eastern Canadian shelf, Cruise Report OC359-2. 105 pages.
Stewart, R. R., Jaramillo, S. J., and Nieto, C., 2001, 4-C ocean-bottom seismometer data from the 2000 SCREECH, CREWES Research Report, 13.
WEB PAGES World Atlas, 2004, www.encarta.msn.com Ocean Drilling Program, http://www-odp.tamu.edu