interpreting bargaining strategies of developing...
TRANSCRIPT

by
Valeria Costantini, Giorgia Sforna, Mariangela Zoli
Interpreting bargaining strategies of developing countries in climate negotiations – A quantitative approach.
SEEDS is an interuniversity research centre. It develops research and higher education projects in the fields of ecological and environmental economics, with a special focus on the role of policy and innovation. Main fields of action are environmental policy, economics of innovation, energy economics and policy, economic evaluation by stated preference techniques, waste management and policy, climate change and development.
The SEEDS Working Paper Series are indexed in RePEc and Google Scholar. Papers can be downloaded free of charge from the following websites: http://www.sustainability-seeds.org/. Enquiries:[email protected]
SEEDS Working Paper 12/2015 July 2015 by Valeria Costantini, Giorgia Sforna, Mariangela Zoli
The opinions expressed in this working paper do not necessarily reflect the position of SEEDS as a whole.
1
Interpreting bargaining strategies of developing countries
in climate negotiations – A quantitative approach
Valeria Costantini* Giorgia Sforna
† Mariangela Zoli
‡
Abstract
Despite the efforts made during the last climate conferences (COPs), countries
participating in the negotiation process are still far from reaching an agreement on the
implementation of a new Post-Kyoto climate regime. The growing role played by
developing countries in negotiations is one of the main causes behind the deadlock.
Further attention should therefore be paid to the composition of the coalitions formed by
developing countries in order to better understand the key structural features driving
their bargaining positions. By applying a cluster analysis, this paper aims to investigate
the role played by heterogeneity in specific characteristics of developing countries in
forming bargaining coalitions in climate negotiation. By clustering developing countries
according to their economic, geographic, environmental, energy and social
characteristics, the paper presents some considerations on climate political economy
strategies in these countries.
Keywords: Climate negotiations, Developing countries, Vulnerability, Cluster analysis,
Climate models
J.E.L. codes: O19; Q54; Q56
* Department of Economics, Roma Tre University, Italy.
† Department of Economics, Roma Tre University, Italy.
‡ Department of Economics and Finance, University of Tor Vergata, Italy.
2
1. Introduction
In 2007, during the COP13 in Bali, the Parties started to negotiate for a new climate
agreement to be implemented at the end of the first commitment period defined by the
Kyoto Protocol (KP) in 2012 (UNFCCC, Decision 1/CP.13). Nevertheless, the so-called
Bali Action Plan was too ambitious and the Parties failed to achieve a new binding
agreement for all countries. As a result, the KP has been extended for a second
commitment period (2013-2020), with the intent of reaching an agreement by 2015 for
the implementation of a new climate regime to be effected by 2020.
Despite this failure, climate negotiations have been characterized by a remarkable
novelty: compared with the first phase, when the main objective was to get Annex I
“reluctant” countries to ratify the KP whereas developing country concerns remained
marginal (Najam et al., 2003), in current negotiations developing countries have
assumed a central role (Cantore et al., 2009; Ott et al., 2008).
The attention devoted to developing countries' interests results in two major
decisions. The first one is the implementation of Nationally Appropriate Mitigation
Actions (NAMAs), debated during COP16 (Cancun 2010) and COP17 (Durban 2011).
By submitting country-specific NAMAs, developing countries can obtain support in
terms of technology, financing and capacity-building transfer from economically
advanced Parties to enable and facilitate their mitigation efforts.4
The second
achievement is represented by the institution of the Green Climate Fund (GCF), created
to become the main financial instrument for promoting the adoption of mitigation and
adaptation measures in developing countries (UNFCCC, Decision 1/CP.16; Decision
3/CP.17). The GCF, in particular, constitutes a great success for developing countries
that have actively supported it (especially the ALBA group)5
and have a strong
representation in its current management structure.6
Other relevant decisions concerning developing countries were taken during COP19
held in Warsaw in 2013 such as the establishment of the Warsaw International
Mechanism for Loss and Damage (UNFCCC/CP/2013/L.15), intended to address the
4 This process is facilitated by the implementation of the NAMA registry, a web platform where
developing countries publish their mitigation plans so that developed countries can decide whether to
participate or not. 5The ALBA group consists of Bolivia and other Latin American and Caribbean countries with the
exception of Brazil. 6 12 out of 24 Board members represent developing countries.
3
adverse impacts of climate change in developing countries that are expected to be
particularly vulnerable to extreme events (IPCC, 2014).
In this complex scenario, the Parties seem to be far from reaching the main objective
of negotiations: a new agreement for the implementation of an ambitious climate regime
that limits average global warming to 2°C above pre-Industrial Revolution levels. The
only step ahead is given by the agreement signed by COP20 (Lima 2014), where the
Parties agreed on the basic rules to be adopted in order to facilitate the Intended
Nationally Determined Contributions (INDCs) that will form the foundation for climate
action post 2020 when the new agreement expected in COP21 (Paris 2015) is set to
come into effect. The regulation of INDCs constitutes a small contribution to escaping
the deadlock, since they only suggest how Parties should contribute to the discussion in
climate negotiations, without concrete solutions to the distribution of mitigation efforts
and the allocation of investment resources.
The causes behind the deadlock are diverse and involve both the huge projected
global costs of achieving ambitious emission targets and the global public good
characteristics of climate change, which provide incentives for countries to act as free
riders, impeding the implementation of the Agreement (Zhang and Shi, 2014).
Nevertheless, another reason behind the deadlock is related to the emergence in
climate negotiations of more differentiated positions compared with the traditional
segmentation between developed and developing countries. In particular, the group of
developing countries (known as the G77) has become significantly fragmented
(Brunnée and Streck, 2013), with large emerging economies that frequently negotiate
bilaterally with major developed countries on climate and energy issues and marginalize
the more vulnerable countries that could benefit from the adoption of more stringent
commitments (Kasa et al., 2008). As has become evident during the last COPs,
countries within the G77 group have different expectations and concerns. We can
therefore expect divisions within the group to exacerbate in the future, leading to the
formation of new or differently shaped alliances that promote their interests. At the
same time, the role of these groups has not been yet comprehensively addressed in the
negotiations literature (Blaxekjaer and Nielsen, 2014).
With regard to this last point, in this paper we investigate how the characteristics of
developing countries may explain their differentiated positions. Specifically, by
4
exploiting countries’ specificities and structural features, we perform a cluster analysis
and identify subgroups of countries pooled together by reasonably homogeneous
interests and characteristics. By presuming that countries that have common features
and concerns will advocate the same interests in negotiations, our analysis can help to
understand different attitudes of participant countries in climate agreements. Our
clusters of developing countries are then compared with existing climate bargaining
coalitions, with the aim of investigating to what extent the two types of grouping
overlap. By analysing overlapping and similarities, we can then define the main
determinants of coalitions’ stability and consequently the major interests and concerns
influencing their bargaining positions.
The rest of the paper is organized as follows. Section 2 presents a literature review
concerning climate negotiations with a focus on developing countries. Section 3
describes the dataset and the empirical methodology, Section 4 discusses the empirical
results and Section 5 provides some concluding remarks.
2. The climate change negotiations process
The issue of climate negotiations has been widely debated in recent years and several
contributions have emphasized the need for a better understanding of the role and needs
of developing countries whose interests have been systematically marginalized during
the initial negotiation and implementation phase. The key interests of developing
countries are the creation of an implementable and equitable climate regime within a
sustainable development framework, as well as improvements in countries capacities to
react to the effects of climate change, enhancing the adaptive capacity and resilience,
especially of the more vulnerable countries (Najam et al., 2003; Sokona et al., 2002).
The claim that mitigation must be accompanied by sustainable development, especially
with regard to energy issues, has always been advocated by developing countries, also
with regard to the Post-Kyoto debate: “a post-2012 regime that advances development
goals sustainably must find a way to help provide the energy needed for development.
But it must also find a way to help ensure that the energy in question does not lock us
into decades of high-emission technologies” (Cosbey, 2009, p. 27).
With regard to climate change action, in recent years equity has been one of the most
debated issues, being a highly contentious area of negotiation for the design of a 2015
5
agreement (Markandya, 2011; Mathur et al., 2014; Morgan and Waskow, 2014;
Ngwadla, 2014). In particular, great emphasis has been given to the different
interpretation of the CBDR principle and its consequences, both in terms of deadlock in
negotiations and burden sharing implications (Winkler and Rajamani, 2014; Zhang and
Shi, 2014). According to Article 3.1 of the Convention:“[t]he Parties should protect the
climate system for the benefit of present and future generations of humankind, on the
basis of equity and in accordance with their common but differentiated responsibilities
and respective capabilities. Accordingly, the developed country Parties should take the
lead in combating climate change and the adverse effects thereof.” The CBDR principle
can be considered the focal point of climate negotiations, its interpretation determining
the burden sharing of emissions targets in the future climate regime.
Developing countries have interpreted responsibilities according to historic
contributions to the climate problem, insisting on a rigid differentiation between
developed and developing countries, and hence requiring rich nations to take on a
bigger share of the burden for carbon cuts (Brunée and Streck, 2013). In contrast,
developed countries have resisted the notion of historic responsibility as well as clear
distinctions between North and South, focusing instead on current and future
contributions to climate change and shifting the responsibility towards fast developing
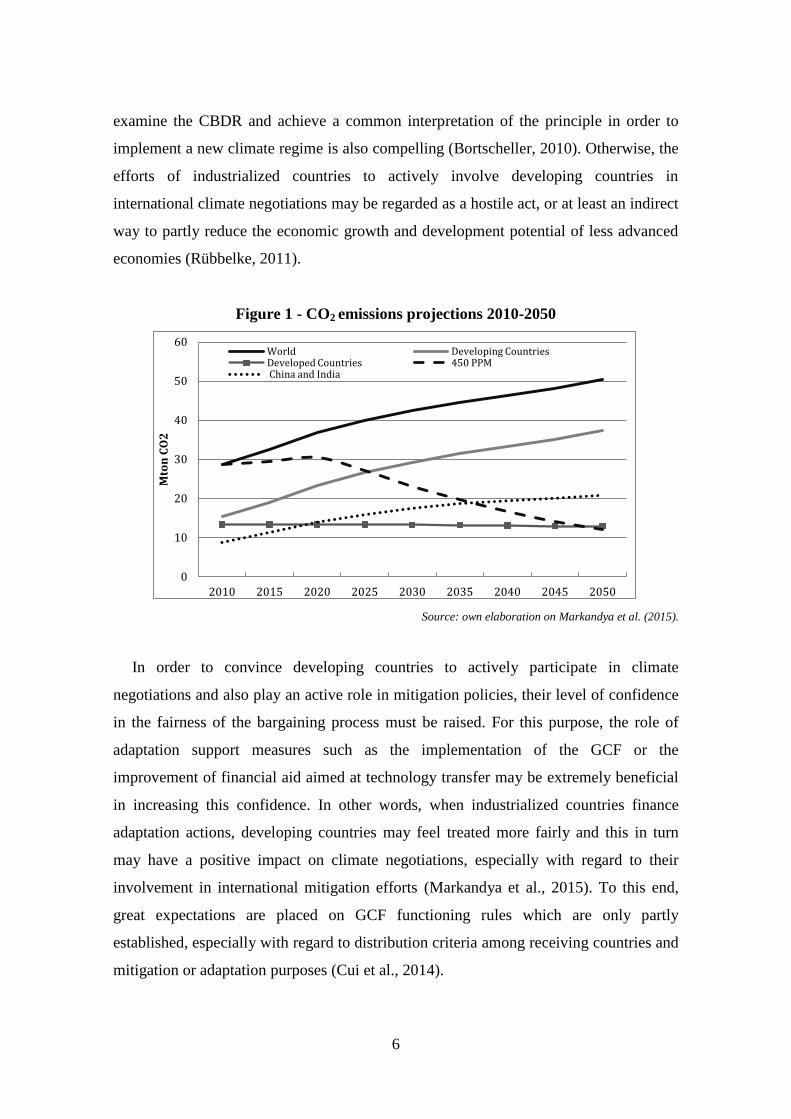
economies, such as China and India. Indeed, the share of GHG emissions by developing
countries, and in particular emerging economies, is expected to substantially increase in
the future, whereas emissions from developed countries are projected to remain fairly
stable. In Figure 1, we report the CO2 emission flows target scenario of ensuring a stable
concentration of GHGs in the atmosphere of 450 PPM by 2050, in order to limit
average global warming to 2°C above pre-Industrial Revolution levels (Markandya et
al., 2015). As a matter of fact, the increasing share over time of emissions associated
with the development process of emerging and less advanced economies shows how
crucial active involvement of the developing part of the world is in climate negotiations.
Even though China and other developing countries have refused to make
international commitments, considering past economic growth paths of industrialized
countries responsible for climate change, it is clear that failing to engage developing
countries in serious efforts at emissions reduction will have dramatic consequences on
the possibility of controlling climate related problems. At the same time, the need to re-
6
examine the CBDR and achieve a common interpretation of the principle in order to
implement a new climate regime is also compelling (Bortscheller, 2010). Otherwise, the
efforts of industrialized countries to actively involve developing countries in
international climate negotiations may be regarded as a hostile act, or at least an indirect
way to partly reduce the economic growth and development potential of less advanced
economies (Rübbelke, 2011).
Figure 1 - CO2 emissions projections 2010-2050
Source: own elaboration on Markandya et al. (2015).
In order to convince developing countries to actively participate in climate
negotiations and also play an active role in mitigation policies, their level of confidence
in the fairness of the bargaining process must be raised. For this purpose, the role of
adaptation support measures such as the implementation of the GCF or the
improvement of financial aid aimed at technology transfer may be extremely beneficial
in increasing this confidence. In other words, when industrialized countries finance
adaptation actions, developing countries may feel treated more fairly and this in turn
may have a positive impact on climate negotiations, especially with regard to their
involvement in international mitigation efforts (Markandya et al., 2015). To this end,
great expectations are placed on GCF functioning rules which are only partly
established, especially with regard to distribution criteria among receiving countries and
mitigation or adaptation purposes (Cui et al., 2014).
0
10
20
30
40
50
60
2010 2015 2020 2025 2030 2035 2040 2045 2050
Mto
n C
O2
World Developing Countries Developed Countries 450 PPM China and India
7
Several approaches have been developed in order to contribute to escaping the
deadlock. Weiler (2012) investigates the determinants of bargaining success in climate
change negotiations by adopting a political economy perspective, where success is
defined by evaluating the coherence of the final decision with expectations on single
bargaining coalitions. Specifically, bargaining success is measured as the distance from
the state’s original positions to the negotiated outcomes, also adjusted to account for the
relevance of each negotiation issue. On the basis of these measures, he finds that
countries’ external power (measured by their GDP), their vulnerability to climate
change, as well as the adoption of soft bargaining strategies for relevant issues,
positively affect bargaining success, whereas assuming extreme positions and the state’s
share of emissions have a negative influence. These conclusions suggest that, in order to
assess the relative bargaining power of different coalitions, it is necessary to fully
understand the characteristics of the countries forming the groups. Along the same lines,
Kasa et al. (2008) analyse countries’ specificities and provide interesting insights into
understanding the positions of developing countries in climate negotiations. While
poverty and other common problems related to economic and political
underdevelopment have been driving factors behind the formation of the G77 as a group
and the maintenance of unitary positions in the early period of the climate regime, the
increasing economic heterogeneity among members has led to the emergence of
bilateral agreements between the richest developing countries (such as Brazil, China,
and India) and the major advanced countries on relevant climate and energy issues. This
new type of cooperation weakens the position of the rest of the developing countries,
especially those that would benefit most from the adoption of universal, strict
commitments, since they are the most vulnerable to the adverse impacts of climate
change.
As a result, there is no agreement in the scientific literature about what factors
determine bargaining success or disease, especially in large (global) negotiations.
According to Weiler (2012), there are two ways of evaluating the success of an
international negotiation process. The first refers to a success that consists in a final
agreement, preferably followed by a legal document. The second consists in appraising
to which extent a party has influenced the outcome of the negotiations. In analysing this
second aspect, the strategic choices in climate change negotiations have been mainly
8
investigated with respect to the party specific success, without a quantitative analysis of
the underlying preferences driving bargaining positions of parties.
To account for the relevance of countries’ specificities in determining the formation
of negotiating groups, we draw on the methodology developed by Costantini et al.
(2007) which explores the bargaining positions of developing countries in World Trade
Organization (WTO) negotiations by assuming that the under-lying preferences of
parties can proxied by the structural features of parties with respect to the specific issue
under negotiation. Individual countries are expected to join coalitions on the basis of
similar expected benefits that arise from a specific negotiation outcome. Thus, member
countries of existing coalitions should present a certain degree of homogeneity with
regard to a set of variables related to the aspects covered by the negotiation process
under scrutiny.
As emphasized in Depledge (2008), it is possible to define the concept of salience as
how important climate change is for a country, which in turn depends heavily on the
expected consequences of a changing climate for a given country.
Going beyond the measurement approach proposed by Depledge (2008) based on the
amount of efforts played by a government in discussing at the national level the climate
change issues, we adopt a quantification relative to several dimensions influencing both
vulnerability to climate change and vulnerability to mitigation costs. According to
Hasson et al. (2010), the mitigation vs. adaptation investment remains an unsolved
dilemma. Our quantitative exercise allows also quantifying how different countries are
positioned with respect to this dilemma.
This is in line with the quantitative assessment proposed by Nagashima et al. (2009),
which explicitly address the issue of quantifying costs and benefits of large coalitions in
participating to climate negotiations, finding that complimentary policies might ensure
stability to large coalitions, but not arrive at a Grand coalition, able to reach a final
international agreement.
In our paper we reveal that the structural features explaining effective coalitions
allow explaining the instability of bargaining coalitions. In order to reach a consensus
on a final global agreement, such differences should be carefully accounted for. As a
matter of fact, if complimentary and compensatory measures might be the right way to
reach stable coalitions, it is necessary to design differentiated measures in order to
9
minimize defection risk.
3. The empirical methodology
3.1. Dataset description
In the case of climate negotiations, relevant country features relate to several aspects,
such as the vulnerability to climate change, the current and projected level of GHG
emissions, the level of technological capabilities, the availability of knowledge capital
and so forth. Hence, in order to cluster countries with respect to their interests in climate
negotiations, the choice of the variables that form the dataset to be used in subsequent
analysis is a preliminary step.
Given the aim of this research, we have excluded from the analysis emerging
economies which are characterized by strong specificities (from an institutional and
economic point of view) that distinguish them from other developing countries. The
statistical analysis has been carried out on a sample of 89 countries, where two driving
criteria are used for the selection: i) the ratification of the Kyoto Protocol as Non-Annex
I Parties; ii) the availability of information covering all the selected structural features
for the years 2011-2013.7
For all the considered countries, several variables representing different country
features have been included in order to reduce subjectivity bias in the statistical results
as much as possible. In addition, the average value of variables in the period 2011-2013
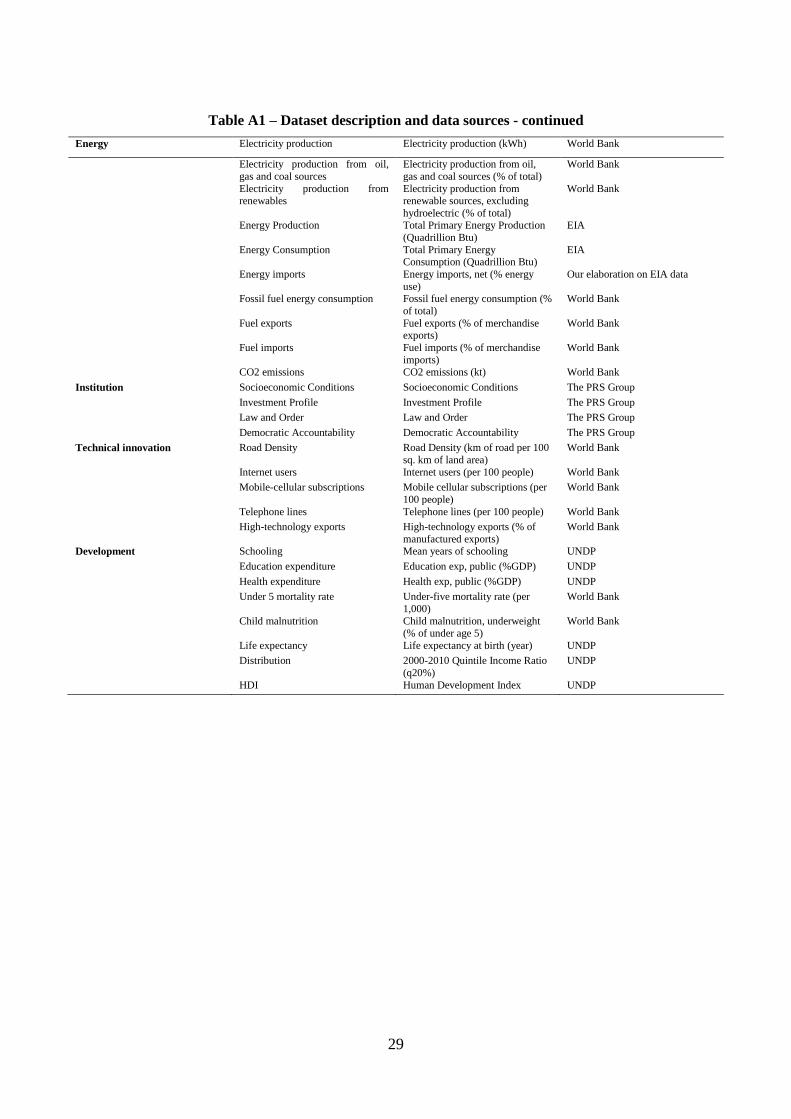
has been considered to avoid the biasing effect of fluctuations. We have selected 55
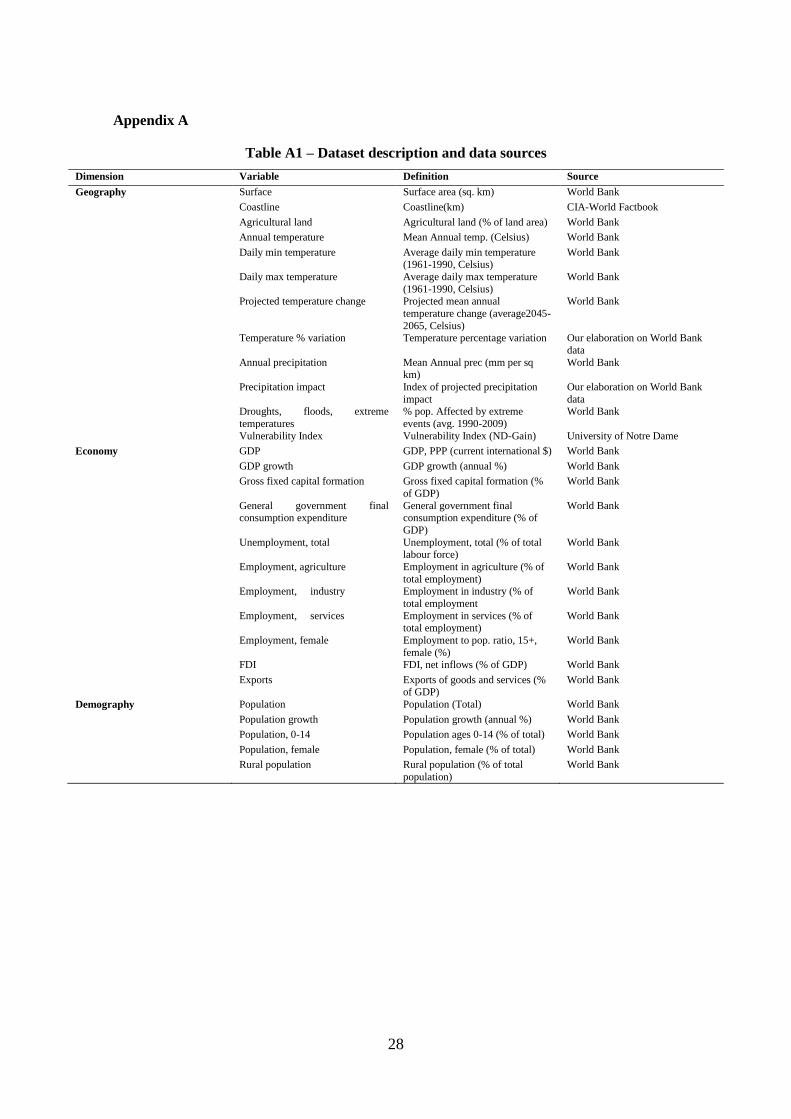
variables that can be divided into seven dimensions: geography, economy, demography,
energy, institutional quality, technological innovation and development. The complete
list of variables used in the analysis and data sources are provided in Table A1,
Appendix A.
1. Geography. This dimension includes all homogeneously available physical
7Countries included in the analysis are: Algeria, Argentina, Armenia, Azerbaijan, Bahrain, Bangladesh,
Benin, Bolivia, Botswana, Burkina Faso, Cambodia, Cameroon, Chile, Colombia, Comoros, Congo,
Republic, Costa Rica, Cote d'Ivoire, Cuba, Dominican Republic, Ecuador, Egypt Arab Republic, El
Salvador, Ethiopia, Gabon, Gambia, Georgia, Ghana, Guatemala, Honduras, Indonesia, Iran Islamic
Republic, Iraq, Jamaica, Jordan, Kazakhstan, Kenya, Kuwait, Kyrgyz Republic, Lao PDR, Lebanon,
Madagascar, Malawi, Malaysia, Maldives, Mali, Mauritius, Mexico, Morocco, Mozambique, Namibia,
Nepal, Nicaragua, Niger, Nigeria, Oman, Pakistan, Panama, Paraguay, Peru, Philippines, Qatar, Rwanda,
Saudi Arabia, Senegal, Sierra Leone, Sri Lanka, St. Lucia, St. Vincent and the Grenadines, Sudan,
Suriname, Swaziland, Syrian Arab Republic, Tajikistan, Tanzania, Thailand, Togo, Trinidad and Tobago,
Tunisia, Turkmenistan, Uganda, United Arab Emirates, Uruguay, Uzbekistan, Venezuela, Vietnam,
Yemen, Zambia, Zimbabwe.
10
characteristics related to geography, including, among others, surface area, length of
coastline and temperature. Special attention has been devoted to climatic characteristics,
related to the degree of vulnerability to climate change of each country and other crucial
aspects in climate negotiations. The main statistical source for geographical information
is the World Bank, with the exception of the Vulnerability Index and the “Index of
projected precipitation impact”. The first one is provided by the University of Notre
Dame together with the Readiness Index in order to calculate the ND-GAIN (Notre
Dame Global Adaptation Index), an index that represents the degree of vulnerability to
climate change as well as a country's readiness to adaptation (University of Notre
Dame, 2013).
To evaluate the impact of projected precipitation, we have constructed an indicator,
known as the “Index of projected precipitation impact”, obtained in three steps. First,
the average value between the minimum and the maximum projected precipitation
values has been calculated as an indicator of “rain direction” (a positive average value
indicates a probability that precipitation will increase and vice versa). Second, on the
basis of the “Mean annual precipitation per squared km”, a coefficient has been
assigned to each country in order to classify all countries from the driest (5) to the
wettest (-5). Finally, this coefficient has been multiplied by the average value between
the minimum and the maximum projected precipitation measure previously calculated,
obtaining an “impact index” that has been normalized in order to assume values from 0
(negative impact) to 1 (positive impact).8
2. Economy. This dimension provides a comprehensive representation of the
economic structure of each country, containing information on GDP, employment,
exports, FDI and many other aspects. All data are taken from the World Bank WDI
online database.
3. Demography. Several measures regarding population issues constitute this
dimension, such as, for instance, the number of inhabitants, the growth rate, and the
share of female or rural population. Here too, the source of data is represented by the
World Bank WDI.
4. Energy. This dimension contains information on the energy sector, such as energy
8 A negative impact is registered, for example, if precipitation is expected to increase in very wet
countries and decrease in very dry ones and vice versa (positive impact if precipitation decreases in wet
countries and if it increases in dry ones).
11
and electricity production and consumption, as well as information on the use of
renewable energies. Data come from the World Bank WDI tool and the EIA (Energy
Information Administration) online data service. This dimension also includes the level
of CO2 emissions from fuel combustion (as defined by IEA, 2013); accurate data for
developing countries are taken from the World Bank WDI tool.
5. Institution: As a proxy for the quality of institutions, we have used data from the
Political Risk Services Index (PRI), provided by the PRS Group (2014). Among the
indices provided by PRI, we have selected four indicators of political and socio-
economic characteristics: Socioeconomic Conditions (SE), Investment Profile (IP), Law
and Order (LO) and Democratic Accountability (DA). Since the maximum values of the
indices are different (6 for LO and DA; 12 for IP and SE), in order to conduct the
analysis, values have been normalised to a common 12 maximum value.
6. Technological Innovation. This dimension contains information on infrastructure
endowments as well as on technology diffusion, including road density, number of
internet users, number of telephone lines, and degree of specialization in high
technology exports. All data are taken from the World Bank WDI.
7. Development. We have considered indicators focused on aspects related to
climate issues. Accordingly, variables included in this dimension refer to poverty,
income distribution, the well-being level as designed in the human development
framework, and public policies for basic needs, such as health and education. The
sources of these data are the World Bank and the UNDP. We have also included the
Human Development Index (HDI), one of the most widely used indicators of
development, calculated by the UNDP on the basis of the country’s average
achievements in three dimensions: a long and healthy life, access to education and a
decent standard of living.
3.2. Cluster analysis
The methodology used to classify developing countries in homogeneous groups on the
basis of the previously described dimensions is represented by a cluster analysis. This is
a “generic term for procedures that seek to uncover groups in data” (Everitt et al., 2001,
p. 5). In other words, it allows for the identification of groups of units that are similar to
each other within the group, but different from units that belong to other groups.
12
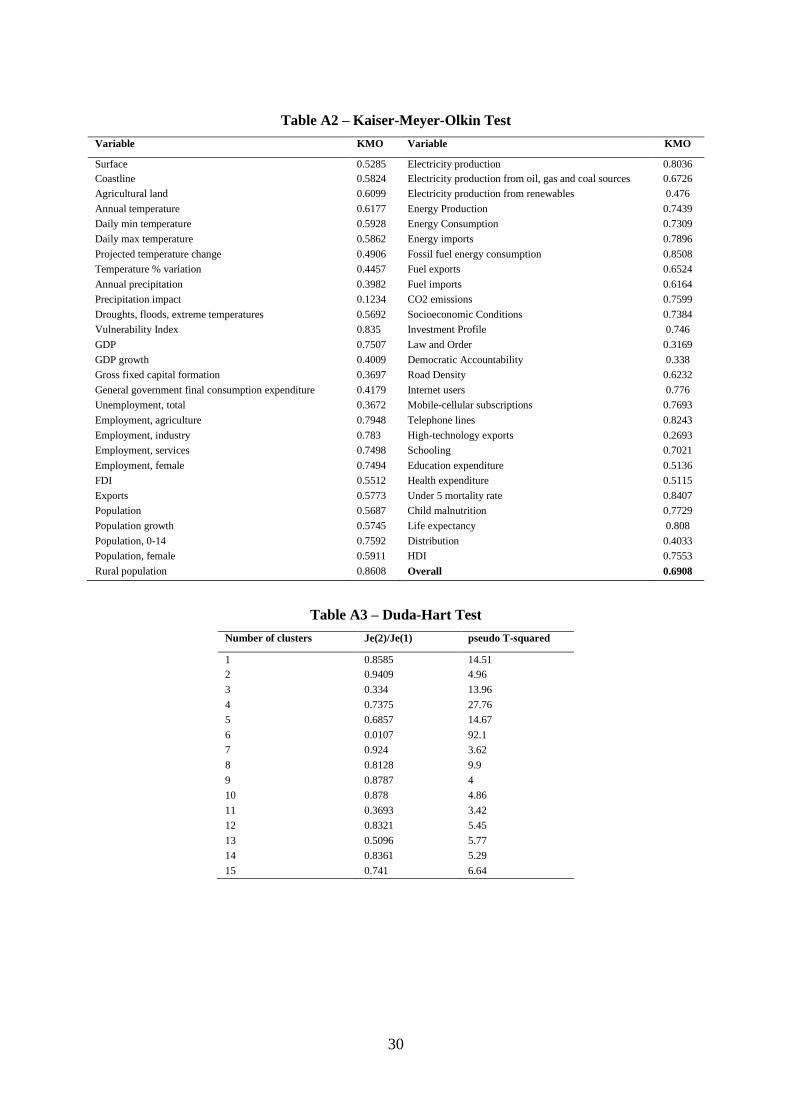
Given the multiplicity of variables adopted in this study and in order to avoid
potential correlations between variables in the cluster procedure, we perform a
preliminary Principal Component Analysis (PCA) on the original dataset.9 PCA is a
technique for reducing the dimensionality of datasets by extracting only the information
that is strictly necessary for representing the variance of the phenomena. Accordingly, it
replaces the original variables by a smaller number of derived variables, the principal
components (PCs), which are linear combinations of the original variables (Jolliffe,
2005).
Several methods can be used to select the number of PCs to be retained. The most
widely used in literature are: i) the Kaiser criterion, according to which the components
to be selected are those with eigenvalues greater than 1 (Hsieh et al., 2004; Kaiser,
1960); ii) the cumulative percentage of total variation criterion (Lee et al., 2006;
Mazzanti and Montini, 2014). As illustrated by Jolliffe (2002), it consists of selecting
the number of components that explains an established variance threshold level. This
level should be in the range 70% to 90%, assuming lower values when the number of
variables is high. Following this criterion and given that, according to Jackson (1993),
this method can overestimate the number of PCs, a fairly low threshold has been chosen
in this study. In particular, two attempts have been made to apply the cluster analysis to
two different numbers of PCs that explain 75% (9 PCs) and 80% (11 PCs) respectively
of the cumulative variance. With a threshold level at 75%, countries are classified into
seven clusters, whereas with a 80% threshold, the optimal number of clusters is seven or
nine. It is also worth mentioning that in the case of seven clusters, the specific countries
entering the groups are almost totally overlapping by choosing 9 or 11 PCs.
Accordingly, we have performed the cluster analysis by selecting 9 or 11 PCs in order
to select the most stable and robust results.
The cluster analysis is conducted in two steps. The first one consists of a hierarchical
cluster analysis that is needed to determine the optimal number of clusters. When the
number of clusters is defined, the second step consists of using the number of clusters to
inform a non-hierarchical clustering process by imposing the number of clusters
obtained in the first step.
With regard to the first step of the cluster analysis, the process of hierarchical
9 Table A2 in Appendix A shows the Kaiser-Meyer-Olkin test. An overall value higher than 0.5 suggests
the use of a PCA.
13
clustering consists of four phases (Johnson, 1967): i) to assign each item to a cluster so
that there are N clusters, each containing just one item; ii) to find the closest (most
similar) pair of clusters and merge them into a single cluster so that there is one cluster
less; iii) to compute distances (similarities) between the new cluster and each of the old
clusters; iv) to repeat phases two and three until all items are clustered into a single
cluster of size N. Phase three can be done in different ways which is what distinguishes
alternative methods. The method used in this analysis is Complete Linkage, according
to which the distance between one cluster and another cluster is equal to the greatest
distance from any member of one cluster to any member of the other cluster. This is
computed in terms of the Euclidean distance, defined as the square root of the squares of
the differences between the coordinates of the points. Once the complete hierarchical
tree was obtained, in order to choose the optimal number of clusters (k), the Duda-Hart
test was conducted (Duda and Hart, 1973) and interpreted according to Cao et al.
(2008). The implementation of this test gives as a result a matrix made of three
columns: the first column represents the number of clusters, the second column provides
the corresponding Duda–Hart Je(2)/Je(1) index stopping-rule,10
whereas the third one
gives the pseudo-T-squared values. From the comparison of these two values, as already
mentioned, seven and nine are found to be the best numbers of clusters, as they have a
high Duda–Hart Je(2)/Je(1) value (0.92 and 0.88, respectively) associated with a low
pseudo T-squared value (3.62 and 4.00, respectively).11
Thus, the analysis were carried
on both seven and nine clusters. Results show that there are no substantial differences
between the composition of groups which are the same with the exception that two
clusters become part of two others when considering seven groups. Thus, in order to
choose the best number of clusters, considerations regarding the dataset structure must
be made. In particular, it is worth noting that it is composed of variables that explain the
overall structure of countries but it does not include mere geodesic information (e.g.
latitude and longitude) that otherwise would have driven the cluster analysis. As a
result, we choose the classification that has the best geographical representation, namely
the one with nine clusters.
10
The Duda–Hart Je(2)/Je(1) index is the ratio between the total within sum of squared distances about
the centroids of the clusters for the two-cluster solution (Je(2)) and the within sum of squared distances
about the centroid when only one cluster is present (Je(1)). 11
See Table A3 in Appendix A.
14
Thus, after the implementation of the Complete Linkage hierarchical tree, the
optimal number of PCs representing the dataset here explored is 11, and the optimal
number of clusters is nine.
This is the final number of clusters implemented in the second step of the cluster
analysis, consisting of a non-hierarchical k-means clustering in which the number of
groups must be pre-determined and aims to minimize the sum of the distances of each
item from the centroid of its cluster, thus the intra-cluster variance (MacQueen, 1967).
In particular, the k-means algorithm is made up of four phases: i) to determine the
centroids; ii) to calculate the distance between cluster centroid to each object and assign
each object to a cluster based on the minimum distance; iii) to compute the new centroid
of each group based on the new memberships; iv) to repeat phases two and three until
the assignments no longer change. At the end of the process, the final composition of
the nine clusters is achieved.
4. Cluster analysis results feeding the political economy discussion
4.1. Definition of climate clusters
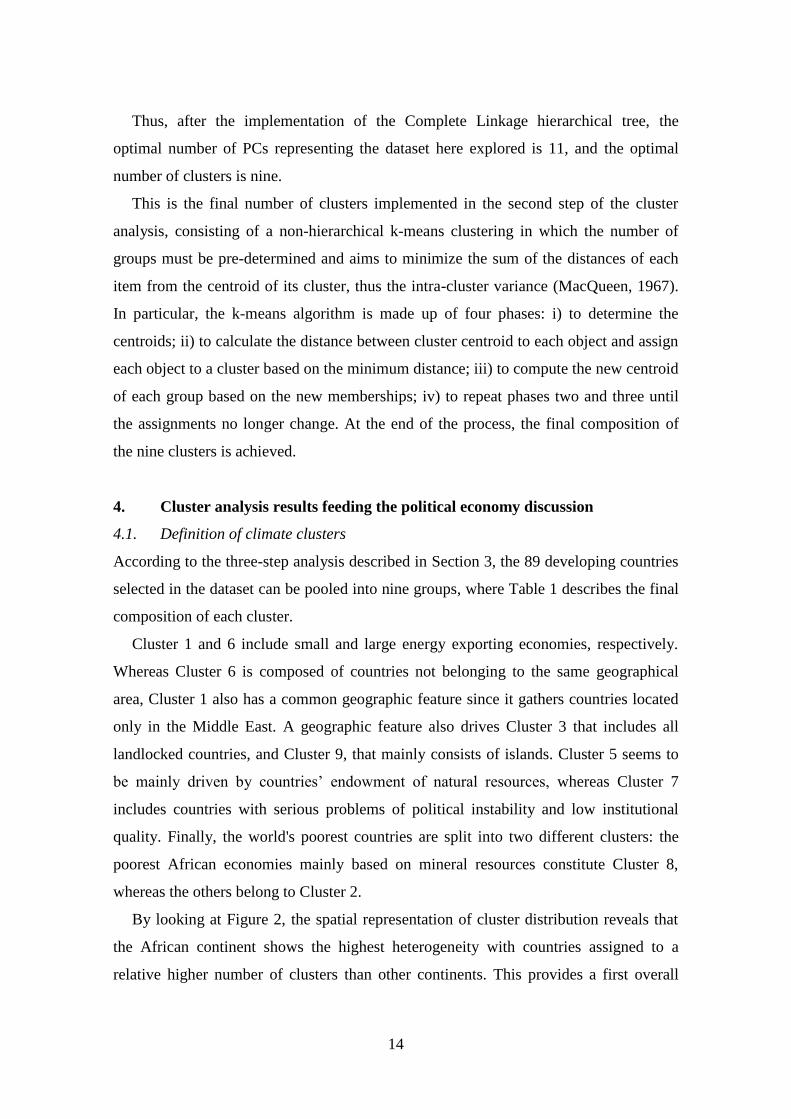
According to the three-step analysis described in Section 3, the 89 developing countries
selected in the dataset can be pooled into nine groups, where Table 1 describes the final
composition of each cluster.
Cluster 1 and 6 include small and large energy exporting economies, respectively.
Whereas Cluster 6 is composed of countries not belonging to the same geographical
area, Cluster 1 also has a common geographic feature since it gathers countries located
only in the Middle East. A geographic feature also drives Cluster 3 that includes all
landlocked countries, and Cluster 9, that mainly consists of islands. Cluster 5 seems to
be mainly driven by countries’ endowment of natural resources, whereas Cluster 7
includes countries with serious problems of political instability and low institutional
quality. Finally, the world's poorest countries are split into two different clusters: the
poorest African economies mainly based on mineral resources constitute Cluster 8,
whereas the others belong to Cluster 2.
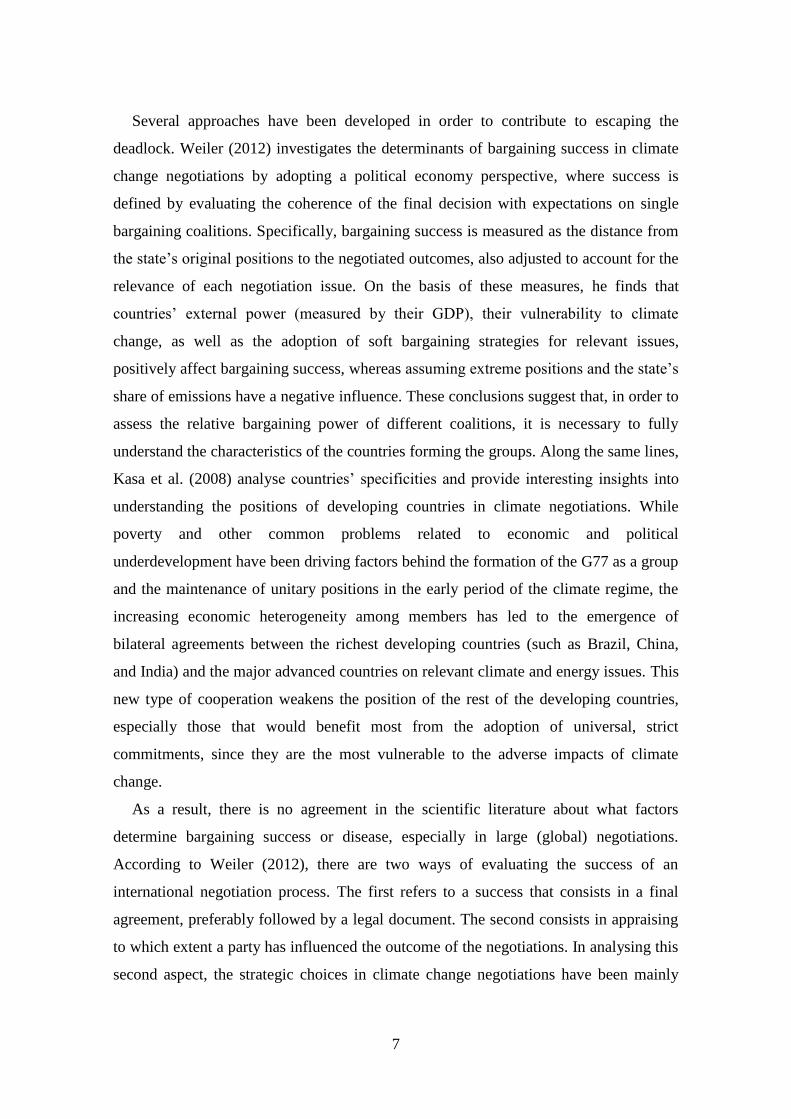
By looking at Figure 2, the spatial representation of cluster distribution reveals that
the African continent shows the highest heterogeneity with countries assigned to a
relative higher number of clusters than other continents. This provides a first overall
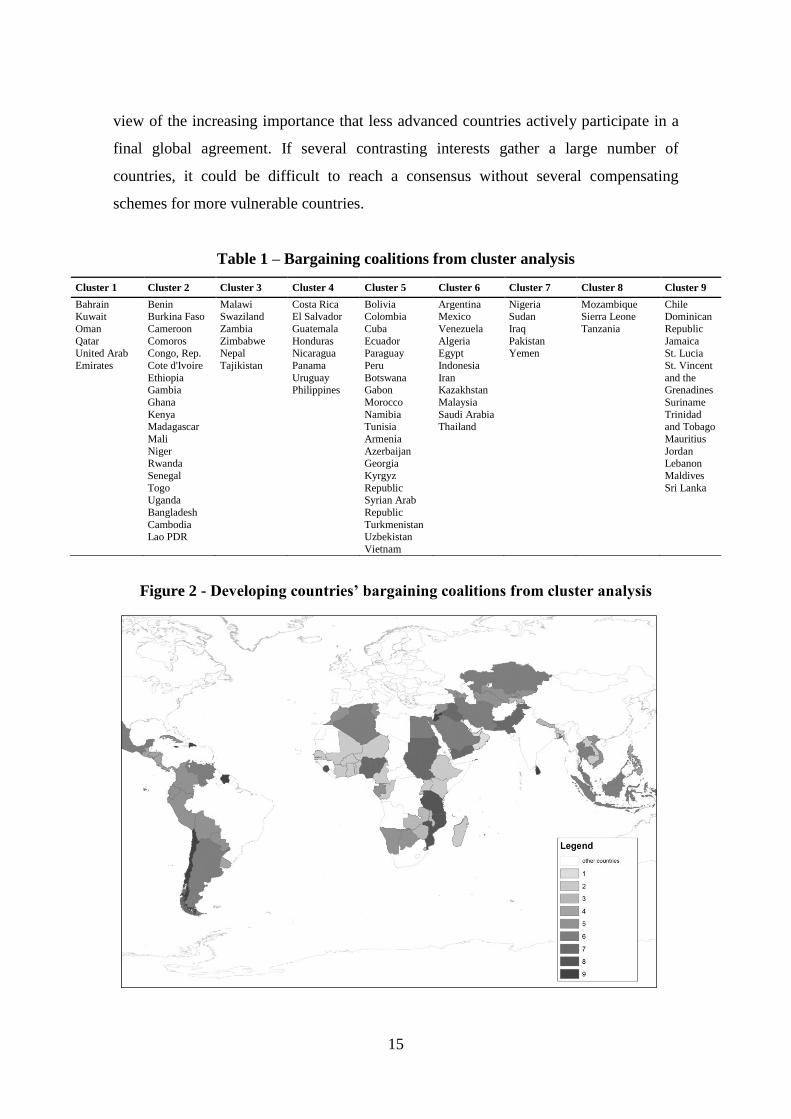
15
view of the increasing importance that less advanced countries actively participate in a
final global agreement. If several contrasting interests gather a large number of
countries, it could be difficult to reach a consensus without several compensating
schemes for more vulnerable countries.
Table 1 – Bargaining coalitions from cluster analysis
Cluster 1 Cluster 2 Cluster 3 Cluster 4 Cluster 5 Cluster 6 Cluster 7 Cluster 8 Cluster 9
Bahrain Kuwait
Oman
Qatar United Arab
Emirates
Benin Burkina Faso
Cameroon
Comoros Congo, Rep.
Cote d'Ivoire
Ethiopia Gambia
Ghana
Kenya Madagascar
Mali
Niger Rwanda
Senegal
Togo Uganda
Bangladesh
Cambodia Lao PDR
Malawi Swaziland
Zambia
Zimbabwe Nepal
Tajikistan
Costa Rica El Salvador
Guatemala
Honduras Nicaragua
Panama
Uruguay Philippines
Bolivia Colombia
Cuba
Ecuador Paraguay
Peru
Botswana Gabon
Morocco
Namibia Tunisia
Armenia
Azerbaijan Georgia
Kyrgyz
Republic Syrian Arab
Republic
Turkmenistan Uzbekistan
Vietnam
Argentina Mexico
Venezuela
Algeria Egypt
Indonesia
Iran Kazakhstan
Malaysia
Saudi Arabia Thailand
Nigeria Sudan
Iraq
Pakistan Yemen
Mozambique Sierra Leone
Tanzania
Chile Dominican
Republic
Jamaica St. Lucia
St. Vincent
and the Grenadines
Suriname
Trinidad and Tobago
Mauritius
Jordan Lebanon
Maldives
Sri Lanka
Figure 2 - Developing countries’ bargaining coalitions from cluster analysis
16
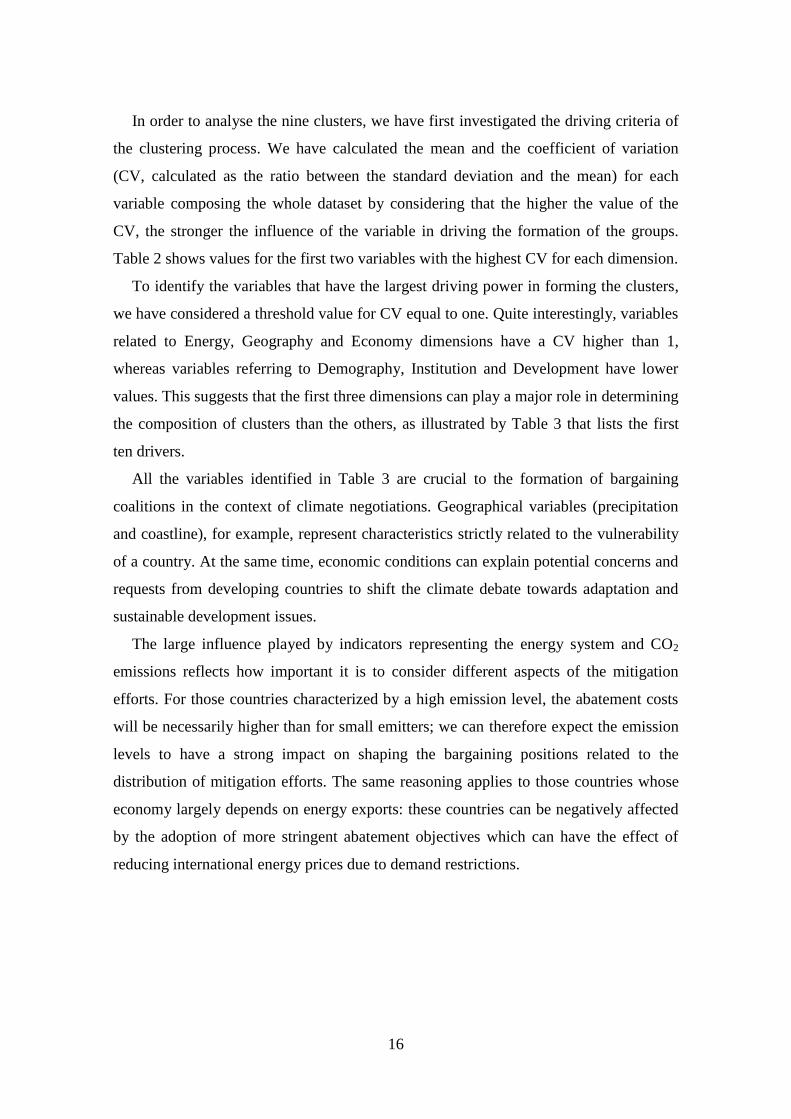
In order to analyse the nine clusters, we have first investigated the driving criteria of
the clustering process. We have calculated the mean and the coefficient of variation
(CV, calculated as the ratio between the standard deviation and the mean) for each
variable composing the whole dataset by considering that the higher the value of the
CV, the stronger the influence of the variable in driving the formation of the groups.
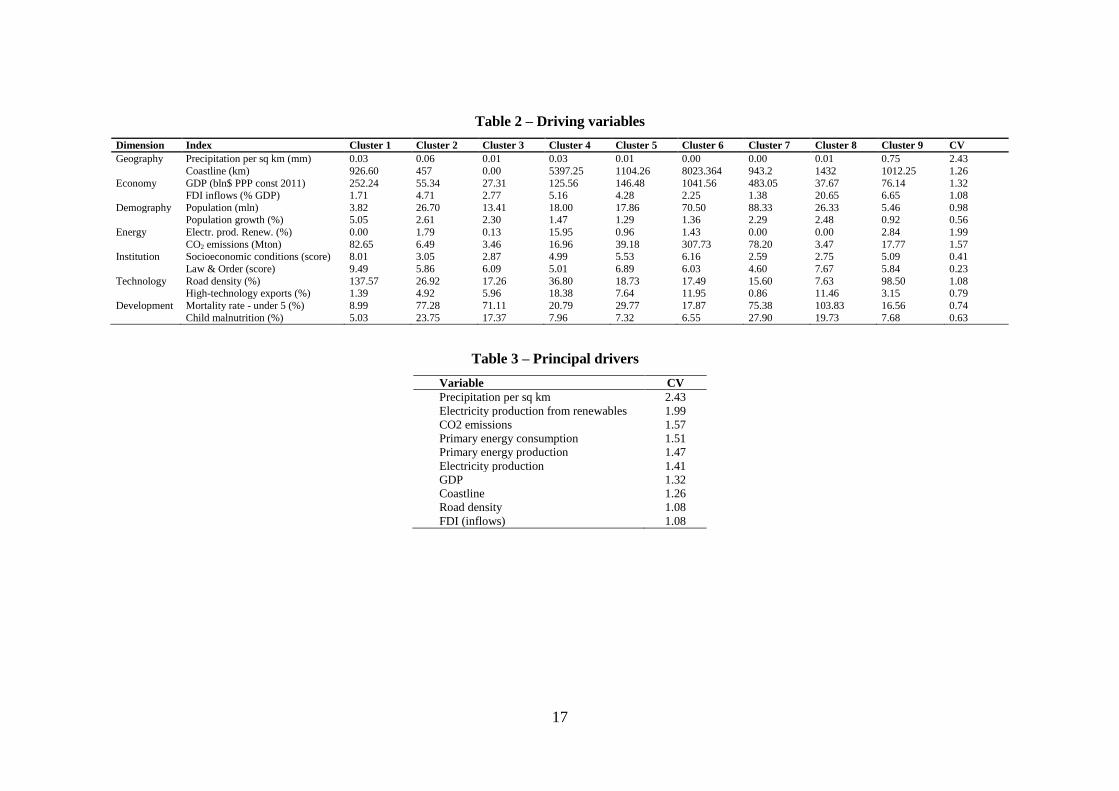
Table 2 shows values for the first two variables with the highest CV for each dimension.
To identify the variables that have the largest driving power in forming the clusters,
we have considered a threshold value for CV equal to one. Quite interestingly, variables
related to Energy, Geography and Economy dimensions have a CV higher than 1,
whereas variables referring to Demography, Institution and Development have lower
values. This suggests that the first three dimensions can play a major role in determining
the composition of clusters than the others, as illustrated by Table 3 that lists the first
ten drivers.
All the variables identified in Table 3 are crucial to the formation of bargaining
coalitions in the context of climate negotiations. Geographical variables (precipitation
and coastline), for example, represent characteristics strictly related to the vulnerability
of a country. At the same time, economic conditions can explain potential concerns and
requests from developing countries to shift the climate debate towards adaptation and
sustainable development issues.
The large influence played by indicators representing the energy system and CO2
emissions reflects how important it is to consider different aspects of the mitigation
efforts. For those countries characterized by a high emission level, the abatement costs
will be necessarily higher than for small emitters; we can therefore expect the emission
levels to have a strong impact on shaping the bargaining positions related to the
distribution of mitigation efforts. The same reasoning applies to those countries whose
economy largely depends on energy exports: these countries can be negatively affected
by the adoption of more stringent abatement objectives which can have the effect of
reducing international energy prices due to demand restrictions.
17
Table 2 – Driving variables
Dimension Index Cluster 1 Cluster 2 Cluster 3 Cluster 4 Cluster 5 Cluster 6 Cluster 7 Cluster 8 Cluster 9 CV
Geography Precipitation per sq km (mm) 0.03 0.06 0.01 0.03 0.01 0.00 0.00 0.01 0.75 2.43
Coastline (km) 926.60 457 0.00 5397.25 1104.26 8023.364 943.2 1432 1012.25 1.26
Economy GDP (bln$ PPP const 2011) 252.24 55.34 27.31 125.56 146.48 1041.56 483.05 37.67 76.14 1.32
FDI inflows (% GDP) 1.71 4.71 2.77 5.16 4.28 2.25 1.38 20.65 6.65 1.08
Demography Population (mln) 3.82 26.70 13.41 18.00 17.86 70.50 88.33 26.33 5.46 0.98
Population growth (%) 5.05 2.61 2.30 1.47 1.29 1.36 2.29 2.48 0.92 0.56
Energy Electr. prod. Renew. (%) 0.00 1.79 0.13 15.95 0.96 1.43 0.00 0.00 2.84 1.99
CO2 emissions (Mton) 82.65 6.49 3.46 16.96 39.18 307.73 78.20 3.47 17.77 1.57
Institution Socioeconomic conditions (score) 8.01 3.05 2.87 4.99 5.53 6.16 2.59 2.75 5.09 0.41
Law & Order (score) 9.49 5.86 6.09 5.01 6.89 6.03 4.60 7.67 5.84 0.23
Technology Road density (%) 137.57 26.92 17.26 36.80 18.73 17.49 15.60 7.63 98.50 1.08
High-technology exports (%) 1.39 4.92 5.96 18.38 7.64 11.95 0.86 11.46 3.15 0.79
Development Mortality rate - under 5 (%) 8.99 77.28 71.11 20.79 29.77 17.87 75.38 103.83 16.56 0.74
Child malnutrition (%) 5.03 23.75 17.37 7.96 7.32 6.55 27.90 19.73 7.68 0.63
Table 3 – Principal drivers
Variable CV
Precipitation per sq km 2.43
Electricity production from renewables 1.99
CO2 emissions 1.57
Primary energy consumption 1.51
Primary energy production 1.47
Electricity production 1.41
GDP 1.32
Coastline 1.26
Road density 1.08
FDI (inflows) 1.08
18
At a general level, these results show that the clusterization process is mainly driven
by those characteristics that represent the most debated issues in climate international
negotiations. This suggests that specific country features must be considered in order to
understand the origins of bargaining positions and foresee potential new alliances of
defections based on countries’ common or divergent interests.
4.2. Climate bargaining strategies of developing countries
These statistical results help to explain the bargaining interests of developing countries
and compare existing countries’ coalitions and the groups derived by the cluster
analysis, in order to highlight potential hot spots in climate agreements. Starting with
fossil fuels exporters (Cluster 1 and 6), it is worth mentioning that these countries have
a strong interest in avoiding economic losses that may arise as a consequence of
mitigation actions. We can therefore expect them to try and keep the international
demand for fossil fuels high by assuming negotiating positions intended to limit
mitigation actions.
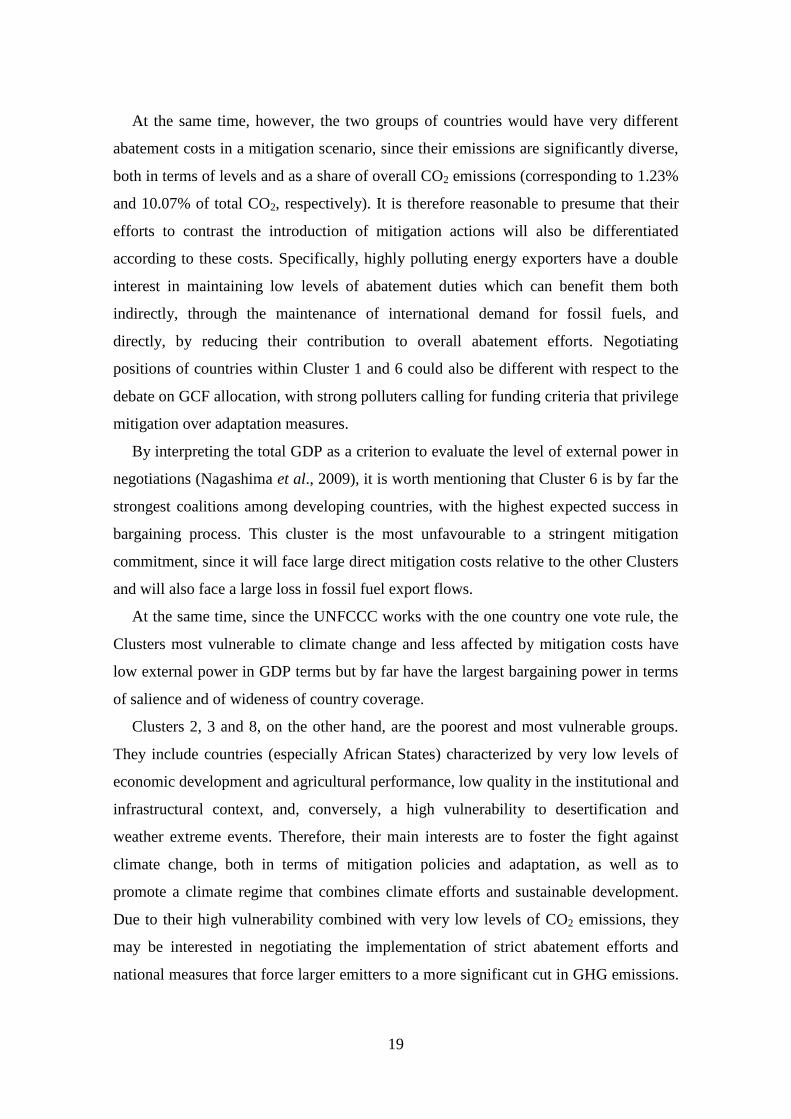
Consequently, the large decrease in fossil fuel demand at the international level will
substantially reduce net gains for energy exporters. It is also worth noting that efforts
made by these countries to delay and prevent the implementation of mitigation actions
are also justified by their low level of vulnerability to the negative effects of climate
change. Compared with other developing countries, energy exporters (Cluster 1 and 6)
are the countries with the highest GDP per capita associated with the lowest degree of
vulnerability, as illustrated in Table 4.
Table 4 – Comparison between GDP per capita, CO2 emissions and vulnerability
of clusters
Cluster GDP p.c. ($ PPP
constant 2011)
Vulnerability
Index
Coastline
(%)
CO2
(Mton)
Share of world
CO2 (%)
Fuel exports
(%)
Institution
quality
1 71,586 0.31 6.22 413.23 1.23 76.77 8.20
2 2,231 0.51 1.08 129.71 0.39 11.18 5.52
3 2,751 0.46 0.00 20.73 0.06 3.99 5.04
4 9,935 0.36 2.70 135.66 0.40 2.14 7.01
5 9,788 0.35 0.42 744.44 2.21 33.17 6.19
6 19,146 0.30 0.58 3,385.08 10.07 48.72 6.59
7 6,386 0.49 0.13 390.99 1.16 73.72 5.18
8 1,424 0.55 0.34 10.42 0.03 9.88 6.49
9 14,334 0.34 24.56 213.18 0.63 8.67 7.03
19
At the same time, however, the two groups of countries would have very different
abatement costs in a mitigation scenario, since their emissions are significantly diverse,
both in terms of levels and as a share of overall CO2 emissions (corresponding to 1.23%
and 10.07% of total CO2, respectively). It is therefore reasonable to presume that their
efforts to contrast the introduction of mitigation actions will also be differentiated
according to these costs. Specifically, highly polluting energy exporters have a double
interest in maintaining low levels of abatement duties which can benefit them both
indirectly, through the maintenance of international demand for fossil fuels, and
directly, by reducing their contribution to overall abatement efforts. Negotiating
positions of countries within Cluster 1 and 6 could also be different with respect to the
debate on GCF allocation, with strong polluters calling for funding criteria that privilege
mitigation over adaptation measures.
By interpreting the total GDP as a criterion to evaluate the level of external power in
negotiations (Nagashima et al., 2009), it is worth mentioning that Cluster 6 is by far the
strongest coalitions among developing countries, with the highest expected success in
bargaining process. This cluster is the most unfavourable to a stringent mitigation
commitment, since it will face large direct mitigation costs relative to the other Clusters
and will also face a large loss in fossil fuel export flows.
At the same time, since the UNFCCC works with the one country one vote rule, the
Clusters most vulnerable to climate change and less affected by mitigation costs have
low external power in GDP terms but by far have the largest bargaining power in terms
of salience and of wideness of country coverage.
Clusters 2, 3 and 8, on the other hand, are the poorest and most vulnerable groups.
They include countries (especially African States) characterized by very low levels of
economic development and agricultural performance, low quality in the institutional and
infrastructural context, and, conversely, a high vulnerability to desertification and
weather extreme events. Therefore, their main interests are to foster the fight against
climate change, both in terms of mitigation policies and adaptation, as well as to
promote a climate regime that combines climate efforts and sustainable development.
Due to their high vulnerability combined with very low levels of CO2 emissions, they
may be interested in negotiating the implementation of strict abatement efforts and
national measures that force larger emitters to a more significant cut in GHG emissions.

20
In fact, Table 4 shows that, despite the multiplicity of countries included, Clusters 2, 3
and 8 are all characterized by low levels of CO2 emissions (and low percentages in
terms of overall emissions, corresponding respectively to 0.39, 0.06 and 0.03%),
associated with the highest degree of vulnerability. While confirming one of the main
paradoxes associated with climate change, i.e. countries most affected by the negative
impacts of climate change are those that are not responsible for it, these considerations
also provide a potential interpretation of recent changes in negotiation alliances towards
more differentiated positions. Indeed, it is quite evident that these countries will try to
negotiate the allocation of more financial resources to adaptation rather than mitigation
support.
Cluster 4 and 5 include countries characterized by low levels of vulnerability. Cluster
4 is also geographically homogenous, consisting mainly of Latin American States. We
discuss these two clusters together because they include several countries belonging to
the same existing negotiating coalitions, namely the ALBA and AILAC,12
which have
played an active role in recent climate meetings. However, as our cluster analysis
suggests, these alliances encompass countries with different geographical and economic
characteristics that can potentially affect their positions within the coalition and can lead
to future defections. Countries in Cluster 4, for instance, have a larger coastline surface
than Cluster 5, signalling a higher exposition to the negative effects of global warming;
on the other hand, they contribute to a lower share of global emissions (0.40%
compared with 2.21%)and fuel exports. These aspects may give rise to different
attitudes in climate negotiations, with countries grouped in Cluster 4 that advocate
stronger mitigation actions or, at least, an allocation of GCF that is more unbalanced
towards adaptation support.
By looking at Cluster 7, we can see that it consists of five countries, namely Nigeria,
Sudan, Iraq, Pakistan and Yemen, characterized by high political instability, terrorism, a
high crime rate and corruption, as demonstrated by the low value of the indicator for the
quality of institutions. From the climatic bargaining point of view, they represent a very
interesting group, because, although they have a high level of fuel exports, they can be
12
ALBA (Bolivarian Alliance for the Peoples of Our America) includes Antigua and Barbuda, Bolivia,
Cuba, Dominica, Ecuador, Grenada, Nicaragua, Saint Kitts and Nevis, Saint Lucia, Saint Vincent and the
Grenadines and Venezuela, while AILAC (Independent Alliance of Latin America and the Caribbean)
includes Chile, Colombia, Costa Rica, Guatemala, Panama and Peru.
21
classified as poor and vulnerable countries when comparing their GDP per capita and
vulnerability index. This suggests that they may have conflicting interests and positions
in climate negotiations depending on the main direction adopted in future agreements.
In fact, on the one hand, they may benefit from stricter abatement efforts that may
reduce the expected adverse effects of climate change; on the other, their economies are
strongly linked to fossil fuels exports and a reduction in global consumption would
seriously threaten their opportunities of economic growth. These contrasting interests
can lead these countries advocating different positions, joining alternative bargaining
coalitions (LCDs as well as fossil fuel producers) during different COPs. These
considerations also suggest that, whatever the final outcomes in negotiations, they will
probably experience some losses, since they have to sacrifice improvements in terms of
vulnerability in favour of economic benefits or vice versa.
The same contrasting positions characterize countries belonging to Cluster 9: as
shown in Table 4, they have a relatively high GDP per capita and emissions compared
with other clusters formed by LDCs, combined with a low general vulnerability, even
though they are highly vulnerable to the risk of flooding and sea level rise. Indeed,
Cluster 9 is characterized, on average, by the highest percentage of coastline (almost
25% of the surface), including several islands that are countries that are some of the
most vulnerable to the effects of climate change. Due to these considerations, we can
expect them to be interested in a new agreement for a greater effort in adaptation as well
as mitigation actions, even though it would imply their active contribution in mitigation
efforts. At the same time, they will advocate more funds for adaptation purposes,
requiring special investment efforts in actions oriented towards reducing the specific
climate risk of sea level rise.
As suggested by our statistical cluster results, developing countries are characterized
by heterogeneous concerns and conflicting interests that can contribute to explaining the
deadlock in climate negotiations. In particular, our analysis reveals that in some
circumstances, countries may advocate, at the same time, interests that are potentially
contrasting, leading to the possibility that very fragile, variegate alliances will be
formed. This has become particularly evident in recent years when several new sub-
groups (more or less formalized) have been created in order to defend their interests.
New negotiating blocks include, for instance, the BASIC countries (Brazil, South
22
Africa, India and China) which include emerging and large emitting countries and the
LDCs, including the more vulnerable countries. Other alliances are the Central
American Integration System (SICA), the AILAC, the ALBA, the Alliance of Small
Island States (AOSIS) and the Group of like-minded (GLM) developing countries
(Roberts and Edwards, 2012). However, these coalitions are strongly influenced by the
heterogeneity of their members and are expected to be highly unstable. The AOSIS
group, for example, is composed of islands that are threatened by climate change in very
different ways; clearly, their degree of involvement in climate efforts is different and
individual interests may differ a great deal from those representing the true coalition’s
interests (Betzold, Castro and Weiler, 2012). This is particularly relevant if we consider
that, in recent years, some negotiating blocks (Latin American blocks, in particular)
have been able to influence climate negotiations, determining deadlocks as well as
important decisions such as the implementation of the GCF.
As seen above, when we compare existing coalitions with our clusters, we can
observe that there is no perfect overlapping between them. If we look at AILAC and
ALBA groups, for instance, we can see that their member countries belong to three
different clusters (Cluster 4, 5 and 9), whereas Venezuela belongs to Cluster 6.
Differences in countries’ distribution among the clusters reflect potential weaknesses
in existing bargaining coalitions and suggest that potential hot spots and critical
situations may arise. By looking, for instance, at Nicaragua and comparing it with the
rest of ALBA members, we can observe that it has a lower level of emissions (4.54
against 28.82Mton), a higher percentage of electricity production from renewable
sources (22% against 2%) and higher energy imports (83% against 19% of energy use).
Furthermore, these values are more similar to those for other AILAC members grouped
in Cluster 4. Colombia and Peru, on the other hand, are more similar to ALBA members
since their data show higher values than those associated with AILAC countries.
These different structural features of member countries can lead to the adoption of
different positions in the bargaining process; consequently, we can expect divergent
interests to create problems for the stability of existing alliances, complicating the
negotiation process and leading to a standstill.
5. Conclusions
23
In recent years we have seen the emergence of several new bargaining groups within
climate negotiations and the scientific literature has poorly emphasized their crucial role
in producing or escaping from a deadlock. Given the heterogeneities of countries
included in these bargaining groups and their relative differences in the costs and
benefits related to climate actions, it is reasonable to presume that future climate
negotiations will be characterized by more nuanced, unstable alliances. This issue is
particularly timely in view of the deadline for a global climate agreement at COP21
which will be held in Paris in December 2015.
In light of this emerging debate, our analysis identifies the main driving factors
behind countries’ interest and constraints and provides a sketch of future potential
bargaining positions based on their respective interests and concerns. As our analysis
suggests, countries belonging to different groups can have different attitudes towards
mitigation and adaptation issues, depending on their specificities in terms of socio-
economic and geographical aspects that determine their relative peculiarities and
vulnerabilities.
The comparison of the groups formed by the statistical cluster approach proposed
here with the already existing bargaining coalitions emphasizes that the relative position
toward mitigation vs. adaptation support and with respect to the stringency level of
future mitigation pathways is highly dependent of the structural features that
characterize single countries.
Given this high heterogeneity, the policy implication we draw is that, in order to
maximize the likelihood of a successful climate agreement in the short term, it will be
necessary to design differentiated supporting actions according to countries’ specific
interests and weaknesses in order to equalize costs and benefits of mitigation policies
and vulnerability to climate change.
Accordingly, our policy advice is that the already existing compensation
mechanisms, primarily the GCF, should be better designed in order to become useful in
reducing the distance between the domestic optimal solution desired by each country
from the climate negotiations and the final global agreement achieved. The GCF, or
whatever complimentary supporting measure will be adopted, should be interpreted not
only as a compensation instrument, but also as an active tool for maximizing a
successful international climate agreement. Consequently, the distribution criteria across
24
countries and objectives (mitigation vs. adaptation; different types of adaptation costs)
should be planned according to quantitative assessment analysis instead of following
requirements from unstable bargaining coalitions.
To this purpose, our paper also provides some suggestions with respect to informing
ex-ante evaluation models in order to better specify regional aggregation respecting the
under-lying preferences of actors with respect to climate change issues, in order to build
up payoff matrices more coherent with real costs and benefits. This will allow better
computing also those complimentary efforts required to reduce conflicts in negotiations
thus reaching to a global climate agreement more rapidly.
Acknowledgements
Financial support was received from the EU D.G. Research (research project
“CECILIA2050 – Choosing efficient combinations of policy instruments for low-carbon
development and innovation to achieve Europe’s 2050 climate targets”, grant agreement
no. 308680), and the Italian Ministry of Education, University and Research (Scientific
Research Program of National Relevance 2010 on “Climate change in the
Mediterranean area: scenarios, economic impacts, mitigation policies and technological
innovation”).
References
Betzold, C., Castro, P., Weiler, F. (2012). AOSIS in the UNFCCC negotiations: from
unity to fragmentation?. Climate Policy, Vol. 12(5), 591-613.
Blaxekjær, L.O., Nielsen, T. (2014). Mapping the narrative positions of new political
groups under the UNFCCC, Climate Policy, forthcoming.
Bortscheller, M.J. (2010). Equitable But Ineffective: How The Principle Of Common
But Differentiated Responsibilities Hobbles The Global Fight Against Climate
Change. Sustainable Development Law and Policy, Vol. 10(2), 65-68.
Brunnée, J., Streck, C. (2013). The UNFCCC as a negotiation forum: towards common
but more differentiated responsibilities. Climate Policy, Vol. 13(5), 589-607.
Cantore N., Peskett L., Dirk Willem te Velde (2009), Climate negotiations and
development: How can low-income countries gain from a Climate Negotiation
25
Framework Agreement?, Overseas Development Institute (ODI), Working Paper
312.
Cao, F., Lisani, J.L., Morel, J-M., Mus , P., Sur, F. (2008). A Theory of Shape
Identification. Springer.
Cosbey, A. (2009). Developing Country Interests in Climate Change Action and the
Implications for a Post-2012 Climate Change Regime, United Nations Conference on
Trade and Development.
Costantini, V., Crescenzi, R., De Filippis, F., Salvatici, L. (2007). Bargaining Coalitions
in the WTO Agricultural Negotiations. The World Economy, Vol. 30(5), 863-891.
Cui, L., Zhu, L., Springmann, M., Fan, Y. (2014). Design and analysis of the green
climate fund. Journal of Systems Science and Systems Engineering, Vol. 23(3), 266-
299.
Depledge, J. (2008). Striving for no: Saudi Arabia in the climate change regime. Global
Environmental Politics, Vol. 8(4), 9–35.
Duda, R.O., Hart, P.E. (1973). Pattern Classification and Scene Analysis. Wiley, New
York.
Everitt, B., Landau, S., Leese, M. (2001). Cluster Analysis (London: Arnold).
Hsieh, M., Pan, S., Setiono, R. (2004). Product, Corporate and country-image
dimensions and purchase behavior: a multicountry analysis. Journal of the Academy
of Marketing Science, Vol. 32(3), 251-270.
IEA (2013). CO2 Emissions From Fuel Combustion Highlights 2013. IEA, Paris.
IPCC (2014). IPCC Fifth Assessment Synthesis Report. Geneva, Switzerland.
Hasson, H., Löfgren, Å., Visser, M. (2010). Climate change in a public goods game:
Investment decision in mitigation versus adaptation. Ecological Economics, Vol.
70(2), 331-338.
Jackson, D.A. (1993). Stopping Rules in Principal Components Analysis: A
Comparison of Heuristical and Statistical Approaches. Ecology, Vol. 74(8), 2204-
2214.
Johnson, S.C. (1967). Hierarchical Clustering Scheme. Psychometrika, Vol. 2, 241-254.
Jolliffe, I. (2002). Principal Component Analysis, Second Edition. Springer-Verlag New
York.
26
Jolliffe, I. (2005). Principal Component Analysis. Encyclopedia of Statistics in
Behavioral Science.
Kaiser, H.F. (1960). The application of electronic computers to factor analysis.
Educational and psychological measurement, Vol. 20, pp. 141-151.
Kasa, S., Gullberg, A.T., Heggelund, G. (2008). The Group of 77 in the international
climate negotiations: recent developments and future directions. International
Environmental Agreements: Politics, Law and Economics, Vol. 8(2), 113-127.
Lee, C.S., Li, X., Shi, W., Cheung, S.C., Thornton, I. (2006). Metal contamination in
urban, suburban, and country park soils of Hong Kong: A study based on GIS and
multivariate statistics. Science of The Total Environment, Vol. 356(1–3), 45-61.
MacQueen, J.B. (1967). Some Methods for classification and Analysis of Multivariate
Observations, University of California Press, 281–297.
Markandya, A. (2011). Equity and Distributional Implications of Climate Change.
World Development, Vol. 39(6), 1051–1060.
Markandya, A., Antimiani, A., Costantini, V., Martini, C., Palma, A., Tommasino, C.
(2015). Analysing Trade-offs in International Climate Policy Options: the Case of
the Green Climate Fund, World Development, forthcoming.
Mathur, V.N., Afionis, S., Paavola, J., Dougill, A.J., Stringer, L.C., (2014). Experiences
of host communities with carbon market projects: towards multi-level climate justice.
Climate Policy, Vol. 14(1), 42-62.
Mazzanti, M., Montini, A. (2014). Waste management beyond the Italian north-south
divide: spatial analyses of geographical, economic and institutional dimensions.
Handbook on Waste Management, Cheltenham, UK: Edward Elgar Publishing.
Morgan, J., Waskow, D. (2014). A new look at climate equity in the UNFCCC. Climate
Policy, Vol. 14(1), 17-22.
Nagashima, M., Dellink, R., van Ierland, E., Weikard, H-P. (2009). Stability of
international climate coalitions - A comparison of transfer schemes. Ecological
Economics, Vol. 68(5), 1476-1487.
Najam, A., Huq, S., Sokona, Y. (2003). Climate negotiations beyond Kyoto: developing
countries concerns and interests. Climate Policy, Vol. 3(3), 221-231.
Ngwadla, X. (2014). An operational framework for equity in the 2015 Agreement.
Climate Policy, Vol. 14(1), 8-16.
27
Ott, H.E., Sterk, W., Watanabe, R. (2008). The Bali roadmap: new horizons for global
climate policy. Climate Policy, Vol. 8(1), 91-95.
Roberts, T., Edwards, G. (2012). A New Latin American Climate Negotiating Group:
The Greenest Shoots in the Doha Desert. Brookings, December 2012.
Rubbelke, D.T.G. (2011). International support of climate change policies in developing
countries: Strategic, moral and fairness aspects. Ecological Economics, Vol. 70(8),
1470-1480.
Sokona, Y., Najam, A., Huq, S. (2002). Climate change and sustainable development:
views from the South, IIED World Summit on sustainable development.
UNFCCC (2007). Report of the Conference of the Parties on its thirteenth session, held
in Bali from 3 to 15 December 2007.
UNFCCC (2010). Report of the Conference of the Parties on its sixteenth session, held
in Cancun from 29 November to 10 December 2010.
UNFCCC (2011). Report of the Conference of the Parties on its seventeenth session,
held in Durban from 28 November to 11 December 2011.
UNFCCC (2013). Draft decision -/CP.19, Warsaw international mechanism for loss and
damage associated with climate change impacts.
University of Notre Dame (2013). Global Adaptation Index. Detailed Methodology
Report.
Weiler, F. (2012). Negotiating climate change: positioning behavior, cooperation and
bargaining success. Climate Policy, Vol. 12(5), 552-574.
Winkler, H., Rajamani, L. (2014). CBDR and RC in a regime applicable to all. Climate
Policy, Vol. 14(1), 102-121.
Zhang, Y., Shi, H. (2014). From burden-sharing to opportunity-sharing: unlocking the
climate negotiations. Climate Policy, Vol. 14(1), 63-81.
28
Appendix A
Table A1 – Dataset description and data sources
Dimension Variable Definition Source
Geography Surface Surface area (sq. km) World Bank
Coastline Coastline(km) CIA-World Factbook
Agricultural land Agricultural land (% of land area) World Bank
Annual temperature Mean Annual temp. (Celsius) World Bank
Daily min temperature Average daily min temperature (1961-1990, Celsius)
World Bank
Daily max temperature Average daily max temperature
(1961-1990, Celsius)
World Bank
Projected temperature change Projected mean annual
temperature change (average2045-
2065, Celsius)
World Bank
Temperature % variation Temperature percentage variation Our elaboration on World Bank
data
Annual precipitation Mean Annual prec (mm per sq
km)
World Bank
Precipitation impact Index of projected precipitation
impact
Our elaboration on World Bank
data Droughts, floods, extreme
temperatures
% pop. Affected by extreme
events (avg. 1990-2009)
World Bank
Vulnerability Index Vulnerability Index (ND-Gain) University of Notre Dame
Economy GDP GDP, PPP (current international $) World Bank
GDP growth GDP growth (annual %) World Bank
Gross fixed capital formation Gross fixed capital formation (%
of GDP)
World Bank
General government final consumption expenditure
General government final consumption expenditure (% of
GDP)
World Bank
Unemployment, total Unemployment, total (% of total labour force)
World Bank
Employment, agriculture Employment in agriculture (% of
total employment)
World Bank
Employment, industry Employment in industry (% of
total employment
World Bank
Employment, services Employment in services (% of
total employment)
World Bank
Employment, female Employment to pop. ratio, 15+,
female (%)
World Bank
FDI FDI, net inflows (% of GDP) World Bank
Exports Exports of goods and services (% of GDP)
World Bank
Demography Population Population (Total) World Bank
Population growth Population growth (annual %) World Bank
Population, 0-14 Population ages 0-14 (% of total) World Bank
Population, female Population, female (% of total) World Bank
Rural population Rural population (% of total
population)
World Bank
29
Table A1 – Dataset description and data sources - continued
Energy Electricity production Electricity production (kWh) World Bank
Electricity production from oil,
gas and coal sources
Electricity production from oil,
gas and coal sources (% of total)
World Bank
Electricity production from renewables
Electricity production from renewable sources, excluding
hydroelectric (% of total)
World Bank
Energy Production Total Primary Energy Production
(Quadrillion Btu)
EIA
Energy Consumption Total Primary Energy Consumption (Quadrillion Btu)
EIA
Energy imports Energy imports, net (% energy
use)
Our elaboration on EIA data
Fossil fuel energy consumption Fossil fuel energy consumption (%
of total)
World Bank
Fuel exports Fuel exports (% of merchandise exports)
World Bank
Fuel imports Fuel imports (% of merchandise
imports)
World Bank
CO2 emissions CO2 emissions (kt) World Bank
Institution Socioeconomic Conditions Socioeconomic Conditions The PRS Group
Investment Profile Investment Profile The PRS Group
Law and Order Law and Order The PRS Group
Democratic Accountability Democratic Accountability The PRS Group
Technical innovation Road Density Road Density (km of road per 100
sq. km of land area)
World Bank
Internet users Internet users (per 100 people) World Bank
Mobile-cellular subscriptions Mobile cellular subscriptions (per
100 people)
World Bank
Telephone lines Telephone lines (per 100 people) World Bank
High-technology exports High-technology exports (% of
manufactured exports)
World Bank
Development Schooling Mean years of schooling UNDP
Education expenditure Education exp, public (%GDP) UNDP
Health expenditure Health exp, public (%GDP) UNDP
Under 5 mortality rate Under-five mortality rate (per
1,000)
World Bank
Child malnutrition Child malnutrition, underweight
(% of under age 5)
World Bank
Life expectancy Life expectancy at birth (year) UNDP
Distribution 2000-2010 Quintile Income Ratio
(q20%)
UNDP
HDI Human Development Index UNDP
30
Table A2 – Kaiser-Meyer-Olkin Test
Variable KMO Variable KMO
Surface 0.5285 Electricity production 0.8036
Coastline 0.5824 Electricity production from oil, gas and coal sources 0.6726
Agricultural land 0.6099 Electricity production from renewables 0.476
Annual temperature 0.6177 Energy Production 0.7439
Daily min temperature 0.5928 Energy Consumption 0.7309
Daily max temperature 0.5862 Energy imports 0.7896
Projected temperature change 0.4906 Fossil fuel energy consumption 0.8508
Temperature % variation 0.4457 Fuel exports 0.6524
Annual precipitation 0.3982 Fuel imports 0.6164
Precipitation impact 0.1234 CO2 emissions 0.7599
Droughts, floods, extreme temperatures 0.5692 Socioeconomic Conditions 0.7384
Vulnerability Index 0.835 Investment Profile 0.746
GDP 0.7507 Law and Order 0.3169
GDP growth 0.4009 Democratic Accountability 0.338
Gross fixed capital formation 0.3697 Road Density 0.6232
General government final consumption expenditure 0.4179 Internet users 0.776
Unemployment, total 0.3672 Mobile-cellular subscriptions 0.7693
Employment, agriculture 0.7948 Telephone lines 0.8243
Employment, industry 0.783 High-technology exports 0.2693
Employment, services 0.7498 Schooling 0.7021
Employment, female 0.7494 Education expenditure 0.5136
FDI 0.5512 Health expenditure 0.5115
Exports 0.5773 Under 5 mortality rate 0.8407
Population 0.5687 Child malnutrition 0.7729
Population growth 0.5745 Life expectancy 0.808
Population, 0-14 0.7592 Distribution 0.4033
Population, female 0.5911 HDI 0.7553
Rural population 0.8608 Overall 0.6908
Table A3 – Duda-Hart Test
Number of clusters Je(2)/Je(1) pseudo T-squared
1 0.8585 14.51
2 0.9409 4.96
3 0.334 13.96
4 0.7375 27.76
5 0.6857 14.67
6 0.0107 92.1
7 0.924 3.62
8 0.8128 9.9
9 0.8787 4
10 0.878 4.86
11 0.3693 3.42
12 0.8321 5.45
13 0.5096 5.77
14 0.8361 5.29
15 0.741 6.64