interpretation of biochemical tests - axónmedia.axon.es/pdf/87598_2.pdf · interpretation of...
TRANSCRIPT
HANDBOOK OF CLINICAL BIOCHEMISTRY (Second Edition)© World Scientific Publishing Co. Pte. Ltd.http://www.worldscibooks.com/medsci/7126.html
b1107 Handbook of Clinical Biochemistry
chapter 1
Interpretation of Biochemical Tests
Introduction
Biochemical tests are now an important part of investigation andmanagement of patients. Understanding the factors which influ-
ence laboratory results and how laboratory results could be used forthe diagnosis and treatment, is important for the rational and effec-tive use of laboratory tests. As with other investigations, biochemicalresults should be taken in the context of patients’ clinical features(signs and symptoms) and other relevant findings.
Biochemical tests are performed for four main reasons — diagno-sis, management, prognosis and screening. When used appropriately,biochemical tests can contribute substantially to the overall care of thepatient. However, when used inappropriately, it can lead to unneces-sary further investigations, pain and suffering to the patient andincreased costs to the health service.
Diagnosis
Clinical diagnosis is usually based on history, physical examinationand results of investigations. History and examination are the impor-tant elements in arriving at a diagnosis and studies show that up to80% of cases can be diagnosed from history and clinical findingsalone. Biochemical tests very often help to confirm the diagnosis oridentify a metabolic syndrome. Seldom are they diagnostic except ina few instances, such as inherited disorders of metabolism.
1
b1107_Chapter-01.qxd 6/16/2011 4:24 PM Page 1

HANDBOOK OF CLINICAL BIOCHEMISTRY (Second Edition)© World Scientific Publishing Co. Pte. Ltd.http://www.worldscibooks.com/medsci/7126.html
b1107 Handbook of Clinical Biochemistry
Management
Biochemical tests are most often used in the management of patients.Approximately 60–70% of all biochemical tests are used for monitoringtreatment or to follow the progress of the disease. Serial measure-ments are valuable in management, e.g. in patients with diabeticketoacidosis, frequent measurements of blood glucose help to assessthe response to insulin and to adjust dosage; in hypothyroid patientson thyroxine replacement therapy, regular measurements of thyroidfunction tests guide the adequacy of thyroxine replacement.
Biochemical tests are also useful in assessing the severity of thedisease. The degree of abnormality in biochemical tests is (usually butnot always) related to the severity of the disease. For example, in renalfailure, the greater the plasma urea and creatinine, the more severe thereduction in renal function.
Prognosis
Biochemical tests, either individually or in combination, can give anindication of the prognosis, e.g. in patients with malignant tumours,serial measurements of tumour markers are of value in assessing theresponse to treatment and the possibility of recurrence.
Screening
When tests are done to detect the presence of a disease before clinicalfeatures are evident, it is described as screening. Screening may beapplied to a population (population screening), to a selected sub-group of a population (selective screening), individuals (individualscreening) or it could be opportunistic.
Population screening
These tests are done in an apparently healthy population to identifythose who may have subclinical disease or those who are at risk of
2 Chapter 1
b1107_Chapter-01.qxd 6/16/2011 4:24 PM Page 2
HANDBOOK OF CLINICAL BIOCHEMISTRY (Second Edition)© World Scientific Publishing Co. Pte. Ltd.http://www.worldscibooks.com/medsci/7126.html
b1107 Handbook of Clinical Biochemistry
developing a disease. Population screening programmes should satisfythe following criteria:
1. The disease should have a significant effect on the quality of lifeor life expectancy, e.g. screening for Gilbert’s syndrome, an inher-ited disorder of bilirubin metabolism, is of no value as it has nolong-term effect on the health of the patient.
2. The screening test can detect the disease before irreversible dam-age has occurred.
3. Effective treatment is available and is acceptable for asymptomaticpatients.
4. The screening test should be effective (specific and sensitive) andacceptable to the population to be screened.
5. The prevalence of the disease and the benefits of treatment shouldjustify the cost of screening.
6. The population at risk can be defined.
Unequivocal benefits of screening have only been established fora few conditions. These include screening for phenylketonuria andhypothyroidism in the newborn and cervical screening for the detec-tion of cervical carcinoma.
Selective screening
Screening can also be applied to a subgroup of the population knownto be at risk of developing that disease, e.g. family members of apatient with hypercholesterolaemia or premature coronary heartdisease could be screened for high cholesterol.
Individual screening
Here an individual is screened for a particular disease or diseases basedon the individual’s history. An example is antenatal screening of a foe-tus for inherited disease when a previous child of the parents has beenfound to have that disease or when there is a strong family history ofthat disease.
Interpretation of Biochemical Tests 3
b1107_Chapter-01.qxd 6/16/2011 4:24 PM Page 3
HANDBOOK OF CLINICAL BIOCHEMISTRY (Second Edition)© World Scientific Publishing Co. Pte. Ltd.http://www.worldscibooks.com/medsci/7126.html
b1107 Handbook of Clinical Biochemistry
Opportunistic screening
Opportunistic screening is when a patient is screened for certain diseaseswhen he presents to the doctor with an unrelated condition, e.g.detection of hypertension.
Other Uses of Laboratory Tests
Biochemical profiling
With the availability of multichannel analysers, it is now possible toanalyse a small blood sample for a large number of biochemical tests.When a group of tests is applied to otherwise healthy individuals orto all admitted to hospitals, it is termed biochemical ‘profiling’. Ingeneral, this type of approach has caused more harm than good as theefficiency of detection of a disease is low. Unnecessary investigationsmay follow when non-specific abnormalities in test results are found.It has been argued that admission profiling can detect potentiallytreatable diseases at an early stage. Diseases that can be detected byscreening hospital patients include hyperparathyrodism, hypothy-roidism, diabetes mellitus, renal disease and liver disease (alcoholism).However, the value of such admission screening is yet to be estab-lished as this approach can detect diseases, which may not manifest inthe lifetime of the patient.
Baseline
Biochemical tests are often also used as a baseline before startingtreatment to detect any harmful effects of treatment or to monitor thetreatment.
Collection of Specimens
Biochemical investigations are done in body fluids, most often inplasma or serum. It is essential that blood samples are collectedappropriately to prevent artefacts. In patients receiving intravenous
4 Chapter 1
b1107_Chapter-01.qxd 6/16/2011 4:24 PM Page 4
HANDBOOK OF CLINICAL BIOCHEMISTRY (Second Edition)© World Scientific Publishing Co. Pte. Ltd.http://www.worldscibooks.com/medsci/7126.html
b1107 Handbook of Clinical Biochemistry
therapy, blood should be collected from a different site to avoidcontamination of the blood sample with the infusion fluid.Tourniquet is often used to obstruct venous blood flow in order tomake the venepuncture easy. However, if the tourniquet is applied toolong, the increased pressure will cause transfer of water and smallmolecular weight constituents into the interstitial compartment. Thiswill often result in an increase in the concentration of large molecularweight substances such as proteins and in protein-bound substancessuch as calcium in the serum sample.
While transferring the blood from the syringe into the bottle, careshould be taken to avoid haemolysis.
Once the blood is taken, it should be put into appropriate bottlescontaining the appropriate preservatives. Most investigations arenow done in serum. However, there are some investigations forwhich plasma is required, e.g. measurement of fibrinogen requiresplasma. Inappropriate use of anticoagulants has often led to spuriousresults, e.g. taking blood sample for electrolytes into an EDTA tubewill cause very high potassium and low calcium concentrations.Blood for the measurement of glucose concentration should betaken into a fluoride tube; otherwise the blood glucose will artifi-cially decrease due to continued glycolysis by red cells. Once theblood is collected, it should be transported to the laboratory withina specified time to prevent artificial results, e.g. if the blood sampleis left at room temperature for several hours, it will lead to highpotassium concentration. Storing samples below room temperaturehas similar effects.
Some investigations are done in urine — a random or a 24-hoururine collection. Appropriate preservatives should be used to avoidartefactual results, e.g. urine for calcium should be collected in a con-tainer with acid preservative to prevent precipitation of calciumphosphate. When 24-hour samples are required, patients should begiven appropriate instructions on how to collect the urine samples. Ininvestigations done on 24-hour samples, the most important source oferror is incomplete urine collection. Measurement of urine creatinineconcentration is sometimes used to check whether urine collection iscomplete.
Interpretation of Biochemical Tests 5
b1107_Chapter-01.qxd 6/16/2011 4:24 PM Page 5
HANDBOOK OF CLINICAL BIOCHEMISTRY (Second Edition)© World Scientific Publishing Co. Pte. Ltd.http://www.worldscibooks.com/medsci/7126.html
b1107 Handbook of Clinical Biochemistry
Identification of Patient Specimens
It is essential that the sample is collected from the correct patient.Many errors have occurred due to improper identification of thepatient. Once collected, the sample should be correctly labelled andaccompanied by a properly completed request form.
Interpretation of Laboratory Results
In interpreting laboratory results, one of two questions is usuallyasked:
(i) Is the result normal or abnormal?(ii) Has the result changed significantly from a previous result?
In answering the first question, the result is compared to a range(reference range).
Reference Ranges
Reference ranges can be either population-based or risk-based.
Population-based reference ranges
To determine the population-based reference range, blood samplesare taken from a defined population — usually healthy individuals,but it can be from any defined population. If the analyte concerned isknown to be affected by sex and age, the population should bedivided according to these two factors. Once the blood is analysed, theresults are examined to see whether it follows a Gaussian (symmetrical)distribution. If the result fails to follow a Gaussian distribution, trans-formations such as a log transformation can be done. The referencerange is calculated as mean ± 2 standard deviation (SD), but often therange is taken as the value that represents 95% of the population(2.5–97.5%) when the values are ranked. This type of reference rangeexcludes 5% of the population who are apparently healthy. It is also pos-sible that some subjects with an undiagnosed ‘disease’ may be included
6 Chapter 1
b1107_Chapter-01.qxd 6/16/2011 4:24 PM Page 6

HANDBOOK OF CLINICAL BIOCHEMISTRY (Second Edition)© World Scientific Publishing Co. Pte. Ltd.http://www.worldscibooks.com/medsci/7126.html
b1107 Handbook of Clinical Biochemistry
in the population used to establish the reference range (for example,undiagnosed diabetes mellitus).
The probability of finding abnormal results in a healthy popula-tion increases if multiple tests are done at the same time, especially ifthe tests are not dependent on each other. If 20 independent tests aredone, the probability of finding at least one result outside the refer-ence value is 64%.
Risk-based reference range
Reference range is sometimes based on disease risk. The reference val-ues for cholesterol are based on the risk of developing coronary heartdisease. Epidemiological studies have shown that a cholesterol valueof 4.0 mmol/L or lower carries a low risk of coronary heart disease.
It is important to remember that results within the referencerange do not exclude disease and results outside the referencerange do not always indicate the presence of a pathological disease.However, the more abnormal the result, the greater the chance thatthere is a disease process. The diagnosis is seldom based solely onbiochemical results. Test results should be taken in conjunction withclinical findings and usually there is no absolute demarcation or cut-off values between disease and normal.
Detection of a Significant Change
The second question asked about a test result is whether there is asignificant change from a previous result. In deciding whether a sig-nificant change has occurred, several factors need to be taken intoaccount. These include analytical variation, biological variationrelated to the time of sampling and the procedure used. Ideally bio-logical variation should be minimised by taking the sample underidentical conditions of time, posture, etc. Other preanalytical factorsshould be minimised by using exactly the same techniques. Whenthese factors are minimised, the variation between two resultsdepends on the imprecision of the assay. If the difference between tworesults is equal to or more than 2.8 times the standard deviation (SD)
Interpretation of Biochemical Tests 7
b1107_Chapter-01.qxd 6/16/2011 4:24 PM Page 7
HANDBOOK OF CLINICAL BIOCHEMISTRY (Second Edition)© World Scientific Publishing Co. Pte. Ltd.http://www.worldscibooks.com/medsci/7126.html
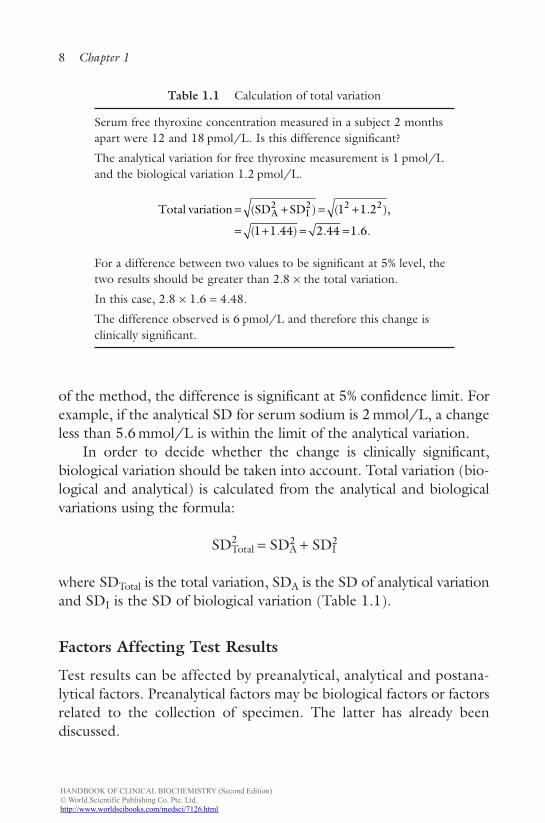
Table 1.1 Calculation of total variation
Serum free thyroxine concentration measured in a subject 2 monthsapart were 12 and 18 pmol/L. Is this difference significant?
The analytical variation for free thyroxine measurement is 1 pmol/Land the biological variation 1.2 pmol/L.
For a difference between two values to be significant at 5% level, thetwo results should be greater than 2.8 × the total variation.
In this case, 2.8 × 1.6 = 4.48.
The difference observed is 6 pmol/L and therefore this change isclinically significant.
Total variation SD SDA2
I2= + = +
= + = =
( ) ( . ),
( . ) . . .
1 1 2
1 1 44 2 44 1 6
2 2
b1107 Handbook of Clinical Biochemistry
of the method, the difference is significant at 5% confidence limit. Forexample, if the analytical SD for serum sodium is 2 mmol/L, a changeless than 5.6 mmol/L is within the limit of the analytical variation.
In order to decide whether the change is clinically significant,biological variation should be taken into account. Total variation (bio-logical and analytical) is calculated from the analytical and biologicalvariations using the formula:
SD2Total = SD2
A + SD2I
where SDTotal is the total variation, SDA is the SD of analytical variationand SDI is the SD of biological variation (Table 1.1).
Factors Affecting Test Results
Test results can be affected by preanalytical, analytical and postana-lytical factors. Preanalytical factors may be biological factors or factorsrelated to the collection of specimen. The latter has already beendiscussed.
8 Chapter 1
b1107_Chapter-01.qxd 6/16/2011 4:24 PM Page 8

HANDBOOK OF CLINICAL BIOCHEMISTRY (Second Edition)© World Scientific Publishing Co. Pte. Ltd.http://www.worldscibooks.com/medsci/7126.html
b1107 Handbook of Clinical Biochemistry
Biological Factors (Table 1.2)
Age
Many biochemical variables vary with age, and an appropriate age-related reference range should be used to interpret results of thesetests. Examples of tests which vary with age include alkaline phos-phatase, phosphate and gonadotrophins.
Sex
Tests such as sex hormones, serum creatinine, urate and GGT showdifferences between sexes.
Body composition
Body fat and lean body mass can influence some results. Creatinineand creatine kinase, which are derived from muscle, are said to berelated to muscle mass. Triglycerides tend to be higher in obeseindividuals.
Interpretation of Biochemical Tests 9
Table 1.2 Biological factors affecting biochemical results
Factors Biochemical tests
Age Alkaline phosphatase, uric acid, creatinineSex Gonadotrophins, gonadal steroids, creatinineBody composition Creatinine, creatine kinase, triglyceridesRace/Ethnicity Creatine kinase, prostate specific antigenTime CortisolPosture Protein, renin, aldosteroneStress Prolactin, cortisolFood intake Glucose, triglyceridesAlcohol TriglyceridesExercise Creatine kinaseDrugs — in vivo effects Phenytoin — gamma-glutamyl transferase
Thiazides — potassiumOestrogens — sex hormone-binding globulin
b1107_Chapter-01.qxd 6/16/2011 4:24 PM Page 9
HANDBOOK OF CLINICAL BIOCHEMISTRY (Second Edition)© World Scientific Publishing Co. Pte. Ltd.http://www.worldscibooks.com/medsci/7126.html
b1107 Handbook of Clinical Biochemistry
Ethnicity/race
The range found in healthy individuals from different ethnic groupsvary for some analytes. Prostate specific antigen (PSA) is higher inAfrican Americans and lower in Japanese compared to Caucasians.Serum creatine kinase (CK) values in African Americans are higherthan in Caucasians.
Time of day
Cortisol, osteocalcin, parathyroid hormone, etc. show a circadianrhythm. Some analytes show seasonal changes, e.g. plasma 25-hydroxycholecalciferol.
Stress
Stress causes the release of cortisol, ACTH, prolactin, growth hor-mone, catecholamines, etc. Thus, it is very important to avoid stresswhen taking samples for these measurements.
Posture
Posture increases aldosterone and renin activity. Plasma proteins andprotein-bound compounds tend to be higher on attaining a standingposture. This is due to the movement of fluid from the vascular com-partment to the interstitial compartment.
Food intake
Glucose, triglycerides and insulin are examples of substances affectedby food.
Drugs
Drugs can influence results by either interfering with the analysisor by physiological mechanisms. For example, in patients takingphenytoin, serum gamma-glutamyl transpeptidase (GGT) is higherdue to enzyme induction.
10 Chapter 1
b1107_Chapter-01.qxd 6/16/2011 4:24 PM Page 10
HANDBOOK OF CLINICAL BIOCHEMISTRY (Second Edition)© World Scientific Publishing Co. Pte. Ltd.http://www.worldscibooks.com/medsci/7126.html
b1107 Handbook of Clinical Biochemistry
Exercise
Exercise and trauma release CK and myoglobin.
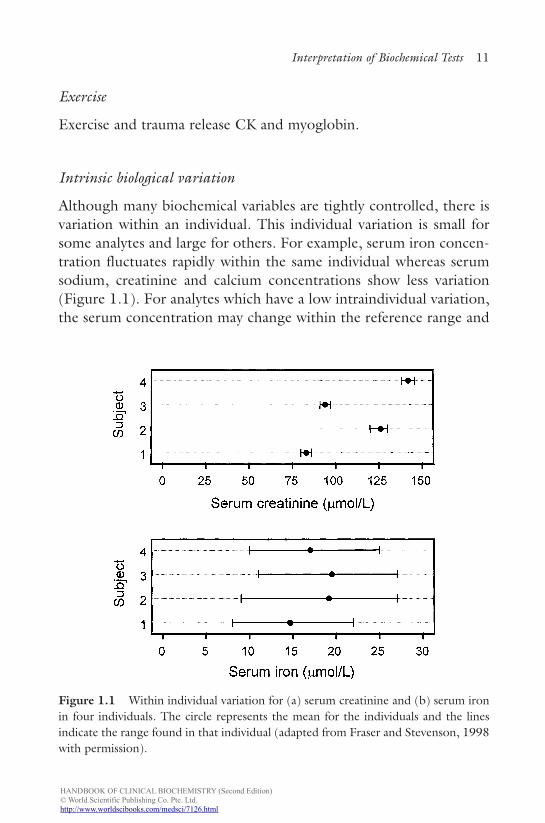
Intrinsic biological variation
Although many biochemical variables are tightly controlled, there isvariation within an individual. This individual variation is small forsome analytes and large for others. For example, serum iron concen-tration fluctuates rapidly within the same individual whereas serumsodium, creatinine and calcium concentrations show less variation(Figure 1.1). For analytes which have a low intraindividual variation,the serum concentration may change within the reference range and
Interpretation of Biochemical Tests 11
Figure 1.1 Within individual variation for (a) serum creatinine and (b) serum ironin four individuals. The circle represents the mean for the individuals and the linesindicate the range found in that individual (adapted from Fraser and Stevenson, 1998with permission).
b1107_Chapter-01.qxd 6/16/2011 4:24 PM Page 11
HANDBOOK OF CLINICAL BIOCHEMISTRY (Second Edition)© World Scientific Publishing Co. Pte. Ltd.http://www.worldscibooks.com/medsci/7126.html
b1107 Handbook of Clinical Biochemistry
become abnormal for that individual. For analytes with low intrain-dividual variation, population reference ranges are less useful.
Analytical Factors
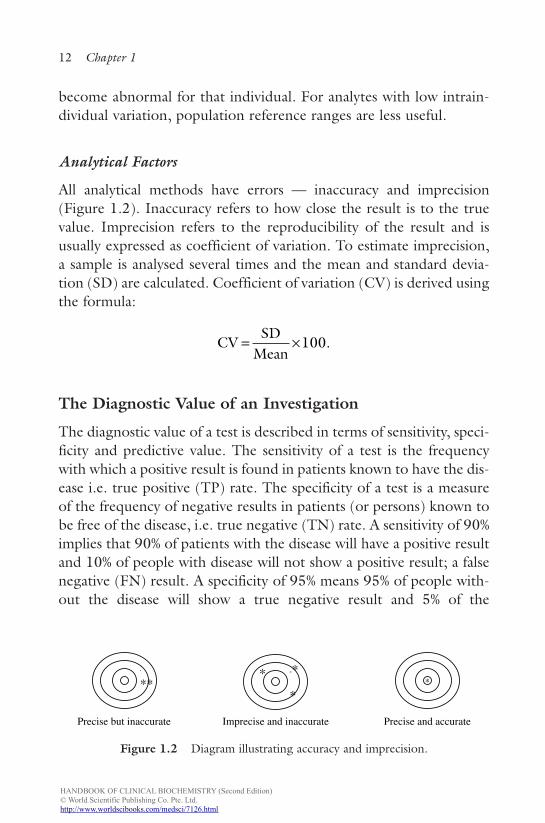
All analytical methods have errors — inaccuracy and imprecision(Figure 1.2). Inaccuracy refers to how close the result is to the truevalue. Imprecision refers to the reproducibility of the result and isusually expressed as coefficient of variation. To estimate imprecision,a sample is analysed several times and the mean and standard devia-tion (SD) are calculated. Coefficient of variation (CV) is derived usingthe formula:
The Diagnostic Value of an Investigation
The diagnostic value of a test is described in terms of sensitivity, speci-ficity and predictive value. The sensitivity of a test is the frequencywith which a positive result is found in patients known to have the dis-ease i.e. true positive (TP) rate. The specificity of a test is a measureof the frequency of negative results in patients (or persons) known tobe free of the disease, i.e. true negative (TN) rate. A sensitivity of 90%implies that 90% of patients with the disease will have a positive resultand 10% of people with disease will not show a positive result; a falsenegative (FN) result. A specificity of 95% means 95% of people with-out the disease will show a true negative result and 5% of the
CVSD
Mean= ¥100.
12 Chapter 1
Precise but inaccurate Imprecise and inaccurate Precise and accurate
* **
*
** *
Figure 1.2 Diagram illustrating accuracy and imprecision.
b1107_Chapter-01.qxd 6/16/2011 4:24 PM Page 12
HANDBOOK OF CLINICAL BIOCHEMISTRY (Second Edition)© World Scientific Publishing Co. Pte. Ltd.http://www.worldscibooks.com/medsci/7126.html
b1107 Handbook of Clinical Biochemistry
population without the disease will have a positive result, a false pos-itive (FP) result. An ideal test should be 100% sensitive and 100%specific. However, in practice, no such test exists. Specificity andsensitivity can be calculated from the following formulae:
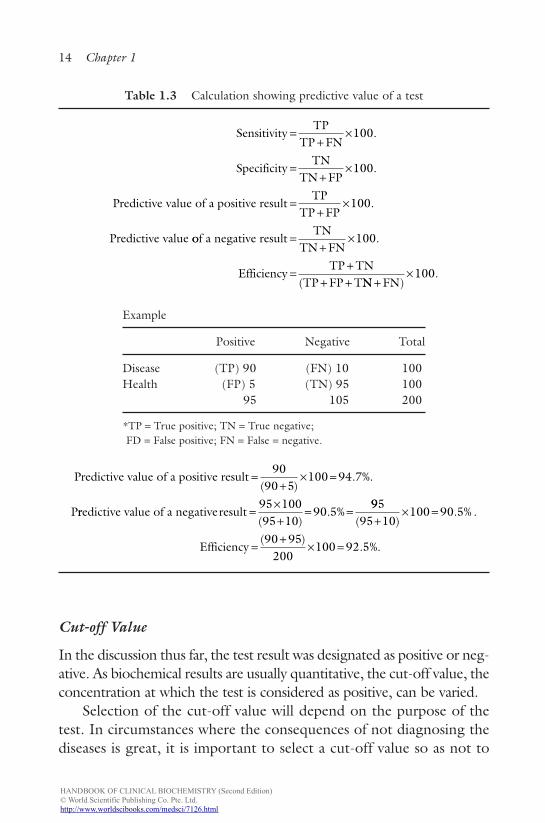
The predictive value of a positive test is a measure of the likelihoodof having the disease under consideration when the test is positive.The predictive value of a negative result is the likelihood of not hav-ing the disease when the test result is negative. In determining thespecificity, sensitivity and predictive values, it is important to be ableto assign subjects to the right categories, i.e. patients should be allo-cated to a particular disease based on independent diagnosis. Forsome diseases, histological confirmation may be the only way ofconfirming the diagnosis. Calculation of predictive values is illustratedin Table 1.3.
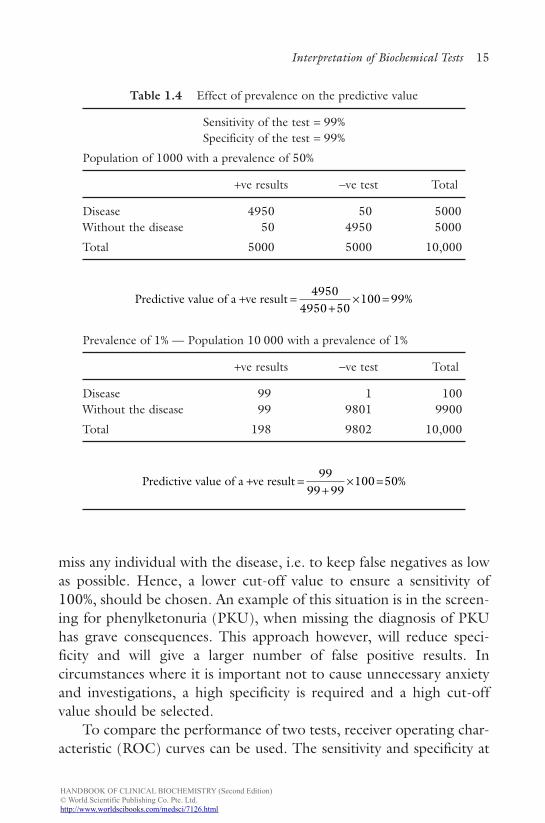
In the preceding discussion, it has been assumed that the preva-lence of the disease is 50%. When establishing the diagnostic valueof a new test, it is not unusual to apply the test to selected groupsof equal sizes — a group with the disease and a control group — aprevalence of 50%. In clinical practice however, the test will beapplied to a larger number of people where the prevalence will belower. The example given in Table 1.4 illustrates the effect of preva-lence on the predictive value of a test, which has a sensitivity of 99%and specificity of 99%. When the prevalence is 50%, the predictivevalue of a positive result is 99%. However, when the prevalence is1%, the predictive value falls to 50%. The predictive value of a testfalls with decreasing prevalence. One way of improving the efficacyof a test would be to use the tests more selectively, i.e. by applyingthe test only on sound clinical grounds, thus increasing the preva-lence of the disease.
Specificitytrue negative
false positive true negative
Sen
=+
¥100.
ssitivitytrue positive
true positive false negative=
+¥100.
Interpretation of Biochemical Tests 13
b1107_Chapter-01.qxd 6/16/2011 4:24 PM Page 13
HANDBOOK OF CLINICAL BIOCHEMISTRY (Second Edition)© World Scientific Publishing Co. Pte. Ltd.http://www.worldscibooks.com/medsci/7126.html
b1107 Handbook of Clinical Biochemistry
Cut-off Value
In the discussion thus far, the test result was designated as positive or neg-ative. As biochemical results are usually quantitative, the cut-off value, theconcentration at which the test is considered as positive, can be varied.
Selection of the cut-off value will depend on the purpose of thetest. In circumstances where the consequences of not diagnosing thediseases is great, it is important to select a cut-off value so as not to
14 Chapter 1
Table 1.3 Calculation showing predictive value of a test
Example
Positive Negative Total
Disease (TP) 90 (FN) 10 100Health (FP) 5 (TN) 95 100
95 105 200
*TP = True positive; TN = True negative;FD = False positive; FN = False = negative.
Predictive value of a positive result
P
=+
¥ =90
90 5100 94 7
( ). %.
rredictive value of a negative result =¥+
= =95 10095 10
90 5( )
. %995
95 10100 90 5
90 95200
100 92 5
( ). % .
( ). %.
+¥ =
=+
¥ =Efficiency
SensitivityTP
TP FN
SpecificityTN
TN FP
Predictive
=+
¥
=+
¥
100
100
.
.
value of a positive resultTP
TP FP
Predictive value
=+
¥100.
oof a negative resultTN
TN FN
EfficiencyTP TN
TP FP T
=+
¥
=+
+ +
100.
( NN FN)+¥100.
b1107_Chapter-01.qxd 6/16/2011 4:24 PM Page 14
HANDBOOK OF CLINICAL BIOCHEMISTRY (Second Edition)© World Scientific Publishing Co. Pte. Ltd.http://www.worldscibooks.com/medsci/7126.html
b1107 Handbook of Clinical Biochemistry
miss any individual with the disease, i.e. to keep false negatives as lowas possible. Hence, a lower cut-off value to ensure a sensitivity of100%, should be chosen. An example of this situation is in the screen-ing for phenylketonuria (PKU), when missing the diagnosis of PKUhas grave consequences. This approach however, will reduce speci-ficity and will give a larger number of false positive results. Incircumstances where it is important not to cause unnecessary anxietyand investigations, a high specificity is required and a high cut-offvalue should be selected.
To compare the performance of two tests, receiver operating char-acteristic (ROC) curves can be used. The sensitivity and specificity at
Interpretation of Biochemical Tests 15
Table 1.4 Effect of prevalence on the predictive value
Sensitivity of the test = 99%Specificity of the test = 99%
Population of 1000 with a prevalence of 50%
+ve results −ve test Total
Disease 4950 50 5000Without the disease 50 4950 5000
Total 5000 5000 10,000
Prevalence of 1% — Population 10 000 with a prevalence of 1%
+ve results −ve test Total
Disease 99 1 100Without the disease 99 9801 9900
Total 198 9802 10,000
Predictive value of a ve result + =+
¥ =99
99 99100 50%
Predictive value of a ve result + =+
¥ =4950
4950 50100 99%
b1107_Chapter-01.qxd 6/16/2011 4:24 PM Page 15
HANDBOOK OF CLINICAL BIOCHEMISTRY (Second Edition)© World Scientific Publishing Co. Pte. Ltd.http://www.worldscibooks.com/medsci/7126.html
b1107 Handbook of Clinical Biochemistry
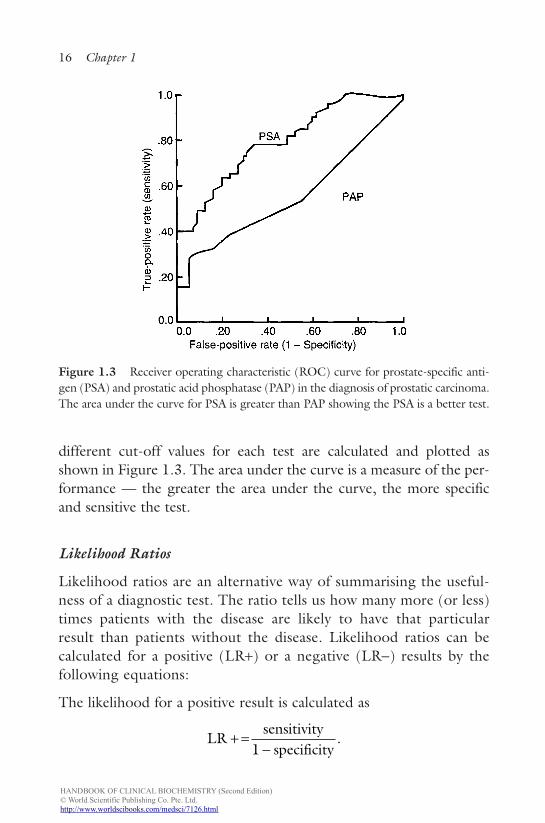
different cut-off values for each test are calculated and plotted asshown in Figure 1.3. The area under the curve is a measure of the per-formance — the greater the area under the curve, the more specificand sensitive the test.
Likelihood Ratios
Likelihood ratios are an alternative way of summarising the useful-ness of a diagnostic test. The ratio tells us how many more (or less)times patients with the disease are likely to have that particularresult than patients without the disease. Likelihood ratios can becalculated for a positive (LR+) or a negative (LR−) results by thefollowing equations:
The likelihood for a positive result is calculated as
LRsensitivity
specificity+ =
-1.
16 Chapter 1
Figure 1.3 Receiver operating characteristic (ROC) curve for prostate-specific anti-gen (PSA) and prostatic acid phosphatase (PAP) in the diagnosis of prostatic carcinoma.The area under the curve for PSA is greater than PAP showing the PSA is a better test.
b1107_Chapter-01.qxd 6/16/2011 4:24 PM Page 16
HANDBOOK OF CLINICAL BIOCHEMISTRY (Second Edition)© World Scientific Publishing Co. Pte. Ltd.http://www.worldscibooks.com/medsci/7126.html
b1107 Handbook of Clinical Biochemistry
The likelihood for a negative result is calculated as
The higher the likelihood ratio of a positive result, the greater thechances of finding the disease. Likelihood ratios above 10 and below0.1 are considered strong evidence to rule in or rule out diagnosesrespectively.
General Principles
Steady State vs. Transient State
In order to understand the pathophysiology of diseases, it is impor-tant to explain the difference between steady state and transient state.This principle can be illustrated by the following case example:
In a patient with chronic renal failure, the following blood resultsare found:
Sodium (mmol/L) 138 135–145Potassium (mmol/L) 5 3.5–5.0Bicarbonate (mmol/L) 18 23–32Chloride (mmol/L) 102 90–108Urea (mmol/L 35 3.5–7.2Creatinine (µmol/L) 565 40–60
If students are asked about the urinary excretion of creatinine in thispatient, most students will say that the excretion of creatinine will below due to the low glomerular filtration rate. Similarly, if studentswere asked about the excretion of carbon dioxide in a patient withchronic obstructive airways disease, most would answer that it wouldbe decreased and the arterial partial pressure of carbon dioxide isincreased. However, in both these examples, it is likely the excretionwill not be low as these patients are in a steady state. This can beexplained using the diagram below (Figure 1.4).
LRsensitivity
specificity- =
-1.
Interpretation of Biochemical Tests 17
b1107_Chapter-01.qxd 6/16/2011 4:24 PM Page 17
HANDBOOK OF CLINICAL BIOCHEMISTRY (Second Edition)© World Scientific Publishing Co. Pte. Ltd.http://www.worldscibooks.com/medsci/7126.html
b1107 Handbook of Clinical Biochemistry
18 Chapter 1
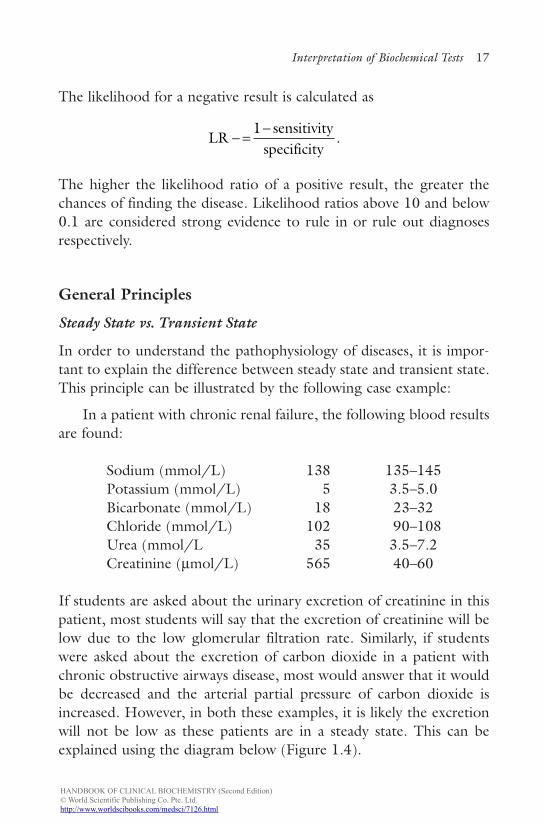
Figure 1.4 Theoretical changes in plasma concentration, GFR, production rateand urinary excretion of creatinine before and after a reduction in GFR. (Reproducedwith permission.)
When the patient is healthy, the amount of creatinine excreted isequal to the amount produced (which depends on the person’s mus-cle mass). As creatinine is excreted by filtration without reabsorptionor significant secretion, the amount excreted is equal to the amountfiltered (Equation 1).
Amount produced = amount excreted = amount filtered,= GFR × plasma creatinine. (1)
If the GFR falls, the amount filtered will fall resulting in less excre-tion. This will increase the plasma concentration. As the plasmaconcentration increases, the filtered amount will increase thus excre-tion will increase. Eventually, the amount excreted will be equal to theamount produced, and the plasma concentration will be steady at ahigher value. In this new steady state, input (production of creatininein this case) will be equal to the output (urinary excretion).
In the steady state if there is a transient increase in input (e.g. sud-den increase in potassium intake), the plasma concentration and the
b1107_Chapter-01.qxd 6/16/2011 4:24 PM Page 18
HANDBOOK OF CLINICAL BIOCHEMISTRY (Second Edition)© World Scientific Publishing Co. Pte. Ltd.http://www.worldscibooks.com/medsci/7126.html
b1107 Handbook of Clinical Biochemistry
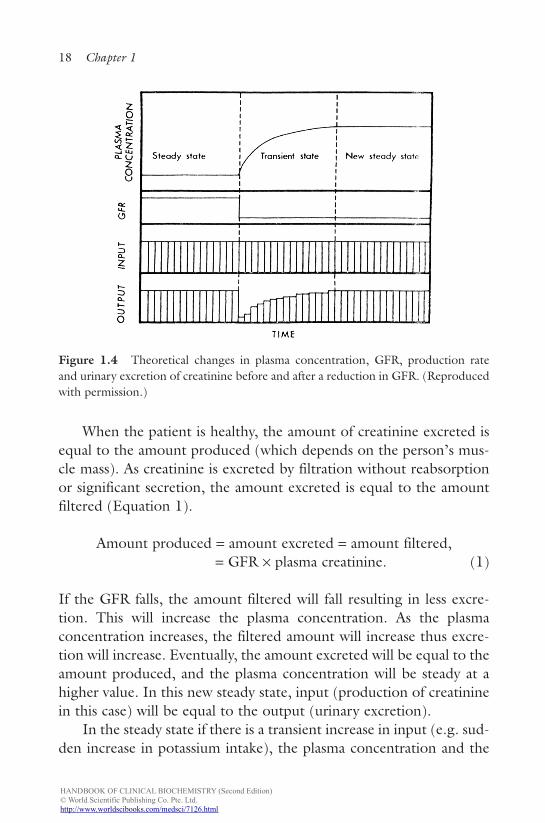
excretion will increase until the load is excreted and the plasma con-centration will come back to the previous level (Figure 1.5a). If thesteady state is an abnormal one (like the patient with chronic renalfailure described above), the increase in plasma concentration willbe greater and it will take a longer time before the steady state isre-established (Figure 1.5b).
The following general principles will be of help in the under-standing of changes in plasma concentration:
1. A change in plasma concentration of a substance is the result ofeither a change in input rate (production or intake) or due to achange in the output rate (metabolism or excretion).
2. When the steady state is disturbed, plasma concentration and out-put will change until input and output are equal — a new steadystate.
Interpretation of Biochemical Tests 19
Figure 1.5 Changes in plasma concentration, input and output with time of potas-sium following a transient increase in input, (a) in the normal steady state and (b) inan abnormal steady state; chronic renal failure with reduced glomerular filtration rate.
b1107_Chapter-01.qxd 6/16/2011 4:24 PM Page 19

HANDBOOK OF CLINICAL BIOCHEMISTRY (Second Edition)© World Scientific Publishing Co. Pte. Ltd.http://www.worldscibooks.com/medsci/7126.html
b1107 Handbook of Clinical Biochemistry
3. In the steady state, irrespective of weather, this is a normal orabnormal state, input and output are equal.
4. A transient increase in input when the steady state is abnormal willbe handled at a different rate than when the steady state is normal.
Concentration vs. Amount
Most clinical biochemistry investigations are done in plasma or serumand what is measured is the concentration. A change in concentrationof an analyte can be due to a change in the amount of substance inplasma or due to a change in the volume of fluid. It is a common mis-take to assume that when the plasma sodium concentration is low, theamount of sodium in the body is low. However, very often a lowplasma sodium concentration is due to an increase in water content.
Concentration vs. Activity
In many circumstances, we measure the total concentration of a sub-stance in serum or plasma. However, the substance may be partlybound to proteins, and very often, it is the unbound or free analytewhich is the physiologically important fraction. For example, calciumin serum is bound to proteins (mainly albumin) and the physiologi-cally active form is ionised calcium. The total concentration however,may change due to changes in the binding protein concentration, e.g.in pregnancy, the concentration of binding protein for thyroxineincreases due to increased synthesis and this will cause the totalthyroxine concentration to be high with normal free thyroxine con-centration. Therefore, in interpreting the total concentration of ananalyte, it is important to bear in mind that the total concentrationmay change without a change in the active fraction.
Urinary Excretion
When the excretion or concentration of a substance is measured inthe urine, it is important to remember that there is no referencerange. This is particularly true for urine electrolytes, urea and
20 Chapter 1
b1107_Chapter-01.qxd 6/16/2011 4:24 PM Page 20
HANDBOOK OF CLINICAL BIOCHEMISTRY (Second Edition)© World Scientific Publishing Co. Pte. Ltd.http://www.worldscibooks.com/medsci/7126.html
b1107 Handbook of Clinical Biochemistry
osmolality. The concentration of electrolytes in serum is highly reg-ulated such that, if there is a change in serum concentration,homeostatic mechanism(s) will return the serum concentrationback to the original value. Urinary excretion, on the other hand, isa method of regulating plasma concentration. Therefore, onecannot determine a reference value for it. In the steady state,urinary excretion is a reflection of input. In the case of electrolytes,it is a reflection of intake. For example, a urinary excretion of100 mmol/d of sodium implies that the person is taking 100 mmolper day of sodium . On the other hand, if we know that the personis taking 50 mmol of sodium per day, a urinary excretion of100 mmol/d of sodium tell us that he is losing sodium through hiskidneys. Interpretation of urinary values should be done in relationto the input (intake) and/or in relation to the clinical state. Forexample, if a person is volume depleted (extracellular volume islow), the body’s response is to increase sodium reabsorption and theurinary exertion should be very low (usually < 20 mmol/L or d).Any value higher than this implies that the person is losing sodiumthrough his kidneys.
Further Reading
1. Fraser CA, Stevenson HP. Production and use of data on biological varia-tion in laboratory medicine. CPD Bulletin in Clin Biochem 1998; 1: 14–17.
2. Fraser CA. Biological Variation: From Principles to Practice 2001. AACCPress.
3. Payne RB, Morgan DB. Sodium, water and acid–base balance: Teachingtransient and steady states. Med Educ 1977; 11:133–135.
Summary/Key Points
1. Biochemical tests are useful in the diagnosis, monitoring, screen-ing and prognosis of disease. Most biochemical tests are done formonitoring treatment or to detect complications of treatment.Biochemical screening of healthy subjects are of little value exceptin a few well-defined situations.
Interpretation of Biochemical Tests 21
b1107_Chapter-01.qxd 6/16/2011 4:24 PM Page 21
HANDBOOK OF CLINICAL BIOCHEMISTRY (Second Edition)© World Scientific Publishing Co. Pte. Ltd.http://www.worldscibooks.com/medsci/7126.html
b1107 Handbook of Clinical Biochemistry
22 Chapter 1
2. A test result can vary due to biological and analytical variation.Analytical variation or imprecision is assessed by the standarddeviation (or coefficient of variation).
3. When interpreting results, they are usually compared to a refer-ence range, which encompasses 95% of values in a healthypopulation. For analytes such as serum cholesterol and serum25-hydroxyvitamin D concentration, this approach is not validand risk-based value is used to compare results.
4. A test result within the reference range does not necessarily implythat there is no disease and a test result outside the referencerange does not indicate disease.
5. Tests results can vary due to many physiological factors such asage, gender, ethnicity, time of day, body size, etc.
6. Even when these physiological factors are controlled, there isintrinsic variation within an individual. This intraindividual varia-tion is large for some analytes (e.g. iron, cortisol) and low forothers (e.g. sodium, calcium and thyroxine).
7. For an analyte with low within person biological variation, a changewithin the reference range is potentially clinically significant.
8. The diagnostic value of a test is described by sensitivity (percent-age of positive results in a group with the disease) and specificity(percentage of negative results in a group without the disease).The predictive value of a test is influenced by the prevalence of thedisease in the population. For a disease with low prevalence, evena test, which is highly specific and sensitive, will give a large num-ber of false positives.
9. The value of two tests can be compared using the receiver oper-ating characteristic curves (ROC) in which specificity is plottedagainst sensitivity.
b1107_Chapter-01.qxd 6/16/2011 4:24 PM Page 22