interpretation of airborne spectral reflectance measurements … · 2008-04-14 · remote sensing...
TRANSCRIPT

REMOTE SENSING OF ENVIRONMENT 6 183-200 (1977) 183
Interpretation of Airborne Spectral Reflectance Measurements Over Georgian Bay
J. R. MILLER, S. C. JAIN, N. T. O'NEILL,
Centre for Research in Experimental Space Science, York Universi~, 4700 Keele Street, Toronto, Ontario M3J 1P3
W. R. MCNEIL,
W. R. McNeil and Associates, lnc., 47 Victoria Park Ave., Toronto, Ontario M4E 3S1
and K. P. B. THOMSON
Applications Section, Canada Centre for Remote Sensing, 717 Belfast Road, Ottawa, Ontario K1A OE4
Airborne spectral measurements were made along 3 flight lines over Georgian Bay in August and October 1974. Spectral data were collected in the wavelength regions 0.44 to 0,46/am, 0.55 to 0.59/~m, 0.68 to 0.70/~m and 0.72 to 0.75 /~m using a four-channel spectral scanning photo- meter. The airborne spectral reflectance curves over several stations were compared with subsur- face volume reflectance measurements made as part of the Canada Centre for Inland Waters 1974 Lake Huron-Georgian Bay ship cruise. These comparisons permitted an evaluation of the water surface reflection effects on the airborne data. The airborne spectral reflectance curves are then interpreted using a two-flow radiative transfer model to derive chlorophyll concentration line profiles. Correlation coefficients between calculated and ship-measured chlorophyll data range from 0.810 to 0.984.
1. Introduction
The evidence of the correlation of water color changes with variations in the water chlorophyll concentration were reported in color index measurements (e.g. Jerlov (1968)) and in spectral re- flectance measurements (Clarke et al. (1970)). These reports were followed by efforts to empirically arrive at a unique relationship between spectral reflectance ratios (color indices) and chlorophyll concentration (e.g. Arvensen et al. (1971), McNeil et al. (1976), Miller et al. (1973, 1976) and Ramsey and White (1973)). Empirical approaches to this
problem have shown only limited success due to variations in observing conditions and perhaps more important because of the effect of the interrelationship of the scattering and absorption properties of the water medium on the observed spec- tral reflectance (or water color).
Various radiative transfer models have also recently been applied to the ocean, e.g. Gordon (1973), Gordon and Brown (1973), Kattawar and Humphreys (1976) and McCluney (1974) to compute the spectral reflectance expected from var- ious backscattering probabili ty functions and absorption coefficients. More re- cently, Jain and Miller (1976) have corn-
© Elsevier North Holland, Inc., 1977

184 J . R . MII.LER ET AL.
bined an ocean-color model with an optimization method so that observed spectral reflectance curves can be inter- preted in terms of chlorophyll concen- tration and the Mie scattering coefficient. The model provides a physical under- standing for the observed reflectance c u r v e s .
This paper reports on spectral measure- ments made in collaboration with the 1974 CCIW Lake Huron-Georgian Bay Survey cruise. The airborne spectral reflectance data is interpreted using a two-flow ocean color model and is com- pared to ship data.
2. The Physical Basis for Interpretation of the Airborne Spectral Data
For an airborne passive optical sensor the radiance signal received at altitude z is normally written in the form
L:(~,) = Lo(X)Ta(X ) + La(X), (1)
where L:(X) is the apparent radiance of the earth's surface at wavelength ~ and at altitude z , L o ( X ) is the radiance at the earth's surface, T~(R) is the atmo- spheric transmittance at ~ and L~(X) is the radiance signal generated by insola- tion back-scattered by the atmosphere. Because of the effects of atmospheric absorption and scattering, L,(X) can differ significantly from Lo(~,), espe- cially for observations made at high altitudes. Moreover, in the case of mea- suring the radiance over a water surface, Lo(X) must be considered as the sum of (1) the inherent radiance L~(X) (the radiance transmitted upward from be-
neath the water surface) and (2) Lra(Xt the radiance generated by Fresnel re- flection of sky light and possibly a surface-reflected direct solar input com- ponent Lrs(X). The inherent radiance is the quantity whose spectral varia- tion yields information about the water medium. (The radiance contribution from reflection from the lake or ocean bottom may also be important in certain cases).
In order to derive the inherent spectral reflectance of a scene using a passive optical sensor, it is desirable to make continuous measurements of the solar irradiance so that one can account for the spectral and intensity variability of the natural source incident solar radiation. Alternatively, under clear sky observation conditions i! may be justi- fied to neglect in-flight solar insolation variations and simply make pre-flight and postflight solar measurements. In this case, if our optical sensor were to observe a perfect Lambertian diffuser (100% reflectance) on the ground, the measured radiance Ls0iX) would be re- lated to the total incident irradiance II o (X) by :
Lso(Z) : Ho(Z), (2) 7?
where the total incident solar irradiance H0(~) is made up of a collimated direct- sun component t tos IX) and a diffuse sky- light component Hoa(?~). The ratio of the upwelling radiance from the scene to the radiance from the perfect diffuser
L z ( ,", ) Raz = Ls o(~}, (3)

GEORGIAN BAY AIRBORNE SPECTRAL REFLECTANCE 185
is called the apparent reflectance since it
represents the reflectance of the scene as observed by the sensor at altitude z with- out corrections for atmosphere or surface effects.
The apparent spectral reflectance R,,(X) may be written in a more detailed form through equations (l), (2) and (3) by expressing the surface radiance L, as L, + L, + L, and letting F represent the diffuse sky component HOd as a fraction of the total solar irradiance so that HOd
equals FH,-, and Ho, equals (l-F)H,, :
The surface reflectance can be defined according to Eq. (3) so that the surface reflectance for diffuse radiation rod is given by LrdrlHOd and direct radiation
ros is LrS~IHos. The Fresnel water re- flection coefficient for normal incidence y. is of special interest because for a nadir-viewing optical sensor rod is simply given by yo. However ros for the nadir- viewing sensor is a strong function of the solar zenith angle and the wave state of the surface so that it is useful to represent yes by rof where f is a factor which accounts for the departure from a zenith sun and a perfectly smooth sea surface. Accordingly the apparent spectral reflectance for nadir-viewing is
(5)
It is the inherent reflectance of the scene L, (X)/L,,(X) which can be directly re- lated to the volume reflectance R, re- ferred to in McNeil and Thomson (I 974) that is fundamentally related to the ab- sorption and scattering properties of the water medium. Ideally, one should deter- mine all the other parameters in Eq. (5) to derive the inherent reflectance.
By making the airborne measurements at low altitudes (at 1500 feet in this proj- ect) it may be reasonable to assume T,(X) = 1 .O and also possibly L,(h) = 0. Then the apparent reflectance is repre- sented simply by:
L (A) R,(h) = u -ho 0)
+ roF + ro(l-FK (6)
which consists of the inherent reflec- tance plus two reflectance terms which arise from specular reflection of sky light and from specular reflection of direct sunlight. Under clear sky conditions the importance of the skylight reflectance may be estimated using data by Jerlov (1968) to obtain F as a function of the solar elevation angle and using the Fres- nel reflection coefficient y. = 0.02 for nadir-viewing. Under completely over- cast conditions (F = 1) this term equals

186 .1. R. MILLER EI' At..
25f, a very significant addition to the in- herent reflectance term. The direct-sun specular reflection is normally minimized by planning field observations when the solar zenith angle is sufficiently large (30 ° for this project) to avoid viewing the surface glitter zone. The effective- ness of this technique is a function of the solar zenith angle and the sea state, the variability of which is accounted for by .f in Eq. (6). In practice, it is desirable to determine this term directly through field measurements.
3. Instrumentation
Tile principal airborne sensor used for this study was a four-channel spectral- scanning photometer. The photometer measures simultaneously the upwelling spectral radiance in four spectral bands: in addition, it is capable of spectral scanning four different spectral regions, each up to 400A in extent, at a resolu- tion of about 30A. Figure 1 shows the 15 spectral response curves for each of the four photometer optical channels. One complete spectral scan requires about 4 seconds during which the scene is viewed in 60 spectral bands. (A more complete description of the spectral- scanning photometer design can be found in Miller et al. (1072) and Gordon (1975)k Fcr the present experiment, interference filters were chosen to study four important spectral regions: ( 1 ) - 0.46 #m where the chlorophyll a absorption is near maximum (2) -0.56 #m where chlorophyll a absorption is low and water penetration is high, (3) -0.70 #m and (4) - 0.75 #m to respond to changes in water
turbidity and/or plant material floating on the water. As shown in Fig. 1, this photometer design provides spectral in- formation in the spectral regions 0.44 to 0.40 #m, 0.55 to 0.59 pin, 0.68 to 0.70 /Jm, and 0.72 to 0.75 /~m at a re- solution of about 30A (0.003/~m).
A disadvantage of this photometer design is that tile motion of tile aircraft causes a continual change in the scene as observed by tile nadir-viewing photo- meter during the 4 second spectral span. With tile airborne measurements carried out at 1500 feet (457 m), tile photo- meter 15 ° full angle field of view results in a scene diameter on the water surface of 390 feet (118 ml. At typical airspeeds of 200 ft/sec the photometer field-of- view traverses 2 scene diameters during each spectral scan. So to obtain valid spectral data in all 60 photometer spec- tral elements it is necessary to assume that tile average water optical properties within a 390 foot scene diameter change very little between adjacent scene dia- meters. Previous data and present data (see Sec. 5.1) show this to be a valid assumption for most lake water mea- surements: however, in coastal regions where large variations are often observed within 100 feet this instrumental feature would significantly limit the usefulness of tile data. It is importanl to note that at each step of the photometer, upwelling spectral radiance measurements are made simultaneously in four passbands for 100 msec during which time the airplane moves only 20 feet. Therefore, if the data is required from (rely 4 passbands, valid spectral radiance data can be ob- tained at 4 second intervals without assumptions about spatial homogeneity.

G E O R G I A N BAY A I R B O R N E S P E C T R A L R E F L E C T A N C E 187
PHO TOME TER STEP 4 ~ 16 /4 12 I0 8 6
I I I I I I I ! i l . 0
0 .0 4 4 0 0 4 4 5 0 4 5 0 0 4 5 5 0 4 6 0 0 4 6 5 0 "
16 14 12 I0 0 6 4 2
' I i ' - - . ' ' ' ' ' ' I 1 I'0 ~05 ~'vl
o 5 6 0 0 5 6 5 0 5 7 0 0 5 '50 5 0 0 0 5 0 5 o 5 9 0 0
WAVELEH6TH (,~) PHOTOMETER STEP # 12 IO 8 6 4 2 18 14 ,a
I I I I I I I ! 1 . 0 ~ •
I ~ . 0 6 7 0 0 6 7 5 0 6 0 0 0 6 0 5 0 6 9 0 0 0 9 5 0 7 0 0 0
PHO TOME TER S T E P ,#, 8 6 4 2 1 6 1 4 M I 0
I I 1 I I I I I I I . 0 7o., ! 0
7 2 0 0 7.°50 7 3 0 0 7 3 5 0 Z 4 0 0 7 4 5 0 P 5 0 0 WAVELENGTH (41)
FIG. 1. The p h o t o m e t e r ins t rumental response curves.
4. Field Measurements
Flights were planned over selected portions of the Canada Centre for In- land Waters (CCIW) 1975 Lake Huron and Georgian Bay Survey cruises. The network of ship sampling stations on Georgian Bay and the three flight lines flown are illustrated in Fig. 2.
The photometer was flown on board a Canada Centre for Remote Sensing (CCRS) DC-3 aircraft specially instru- mented for remote sensing work. Each flight was subject to the flight criteria of 1500 feet flight altitude, less than 10% cloud cover and solar elevation be- tween 30 ° and 60 ° . Flights made on
August 7 and October 11, 1974 will be reported on in this paper.
Because this photometer is not cap- able of in-flight solar irradiance mea- surements, pre-flight and post-flight solar calibrations were made at Malton Airport and Wiarton Airport. The photometer was then taken out on the runway about 30 feet from the aircraft and directed obliquely at a horizontally oriented Lambertian white diffuser (an aluminum plate coated with Eastman Kodak Stan- dard 100% White Reflectance Paint (Grum & Luckey (1968)). Then, through Eq. (3) these measurements provide the basis for calculating the apparent spectral reflectance from the airborne spectral radiance data.

188
¢ ~3
J. R. MILLER ET AL.
m
7¢_71. GEORGIAN BAY
M.V. ~ Y, ax'].eem
1974 Su.'~vey ,3~11y 28-- ~ J . 2
?4 - 05 - 104
;ZS
I l I
I i dP 24 h r . S ta t ion
FIG. 2. Georgian Bay CCIW ship sampling stations and the three selected flight lines.
A scanning spectrometer (AB Incen- tives Quanta meter) was used to measure the upwetling and downwelling irradiance in the 400 nm to 700 nm spectral region at a depth of about 1 meter. These sub- surface irradiance spectral reflectance measurements (that is, the ratio of up- welling to downwelling irradiance R v (X)) were made at selected cruise stations (whenever possible) as part of the ship- based water quality measurement pro- gram. The subsurface irradiance reflec- tance data Rv(X) can be related to the
above-surface irradiance reflectance R~ (X) by the approximate simple relation- ship R "(X) ~ 0.52 Rv(X) (Austin (1974), McNeil & Thomson (1974)); this rela- tionship accounts for the effect of the internal reflection at the water-air inter- face arising from the change in index of refraction. If we consider the water back-scattered radiation to be isotropic then the calculated above-surface irra- diance reflectance R ~(X) should be equal to the inherent water radiance reflectance Lu(X)/Lso(X) determined from the air-

GEORGIAN BAY AIRBORNE SPECTRAL REFLECTANCE 189
based data. Therefore, at a particular station, comparison of the airborne spectral reflectance curve with that de- rived from the in situ irradiance reflec- tance should differ only because of sur- face specular reflection and atmospheric path radiance effects. Consequently, such comparisons permit these effects to be evaluated for each of the cruise over-flights.
The ship-based chlorophyll concen- tration data were obtained from 0 to
20m integrated samples at each of the monitoring stations.
5. Presentation and Interpretation of Airborne Data
The photometer output signals, which were recorded on board with an analog instrumentation tape recorder, were digitized and used to derive data files of apparent reflectance. The desired para- meter, the inherent water reflectance, differs from the derived apparent re- flectance due to the specular reflec- tion terms (see Eq. (6)).
Under clear sky conditions the spec- ular reflectance due to skylight may be readily calculated. In the absence of diffuse/global solar radiation field mea- surements, data from Jerlov (1968) were used to provide the diffuse/global solar irradiance ratio F as a function of wavelength and solar zenith angle which was combined with a Fresnel reflection coefficient r 0 of 0.02 for nadir- viewing to evaluate the correction term roF ranging from 0.0016 to 0.0056 for the data presented. This small correction was applied to all the data during the
processing resulting in data files of the reflectance
Lu(X) R a z - - - + r o ( 1 - F ) [ . (7)
L, oC~)
5.1 Apparent Spectral Reflectance Curves
An overview of the data available on a particular flight line is provided by plotting the apparent spectral reflec- tance curves as shown in Fig. 3. A series of similar spectral reflectance curves are shown with a regular displacement be- tween curves. The solid part of each curve represents the spectral reflectance data from the photometer and the dashed lines are added to aid the eye in following a particular spectral curve. Starting at the top of the figure, the first curve represents the reflectance spectrum ob- tained with the sensor viewing the shore near Owen Sound; the left upper most cross is the corresponding axes inter- section for this plot with the vertical scale being % albedo (or reflectance) as indicated on the left side of the plot and the wavelength in nanometers as the horizontal axis. In order to pre- sent all the Line 1 data on one graph each reflectance curve represents the average of 7 photometer spectral scans. In order to make successive spectral reflectance curves distinguishable, each successive curve is plotted with its ver- tical axis shifted downward to the next cross. Therefore, with Line 1 flown in a northward direction, successive curves going down in Fig. 3 represent reflec- tance spectra starting in Owen Sound and ending in the middle of Georgian Bay at Station 23.

190 J. R. MILLER ET AL.
e d
i
.,,,/' J
+
,v: :: s ? 00
+/- % . . . . . . %
_¢._ . . . . %
4ro..o ,,~ oo o . . . s..oo ' ' I t R V E L E N G r H
0 8 I
I ' i
- - f - - . - 7
- - - - u w / . . . _ . ~ l l
r......-- z z
zz
FIG. 3. Ref lec tance spectra a long line #1 for the August F l igh t /CClW Cruise ~9/4-05-104.
A significant difference is apparent between reflectance curves 1 and 2. The most dramatic difference occurs in the near infrared region (0.72 to 0.75 /Jm) where the reflectance for curve 1 is about 15% (off-scale in Fig. 3) compared to about 1.7% in curve 2: this difference is
characteristic of the high reflectance of vegetat ion on shore compared to the l ow reflectance o f water in the near infrared. In fact, this dramatic near in- frared reflectance change provides a con- venient event marker in the data to signal the transition from shore to water. The

GEORGIAN BAY AIRBORNE SPECTRAL REFLECTANCE 191
spectral curves from 3 to 18 over the water show almost imperceptable change; that is, there appear to be no large, significant anomalies in water optical properties along Line 1. Although the successive reflectance curves in Fig. 10 represent 7 photometer scan averages, a detailed scan-by-scan examination yields the same conclusion-no signif- icant changes with the photometer 390 foot field of view.
5.2 August Flight-CCIW Cruise #74-05-104
The presentation of the August data is prefaced by the comment that the overflight for this cruise was not pos- sible until six days after the ship cruise was completed. However, generally clear weather conditions prevailed over this period.
The photometer apparent reflectance spectrum R'z (X) obtained over the mid- lake Station 23 is shown in Fig. 4(a) along with (1) the ship-based in situ measurement of the subsurface irradiance spectral reflectance, Rv (X), shown as the upper solid curve and (2) the above- surface inherent spectral reflectance
!
R~0t), shown as the lower solid curve, which is inferred from the in situ volume reflectance data (i.e. R~ -~ 0.52R~). In the near infrared region the ship-based optical data indicates that the above- surface reflectance originating from upwelling subsurface radiance is ex- pected to be 0.1% compared to the apparent reflectance of 0.6% measured by the photometer. At these wavelengths it appears that about 80% of the signal observed by the photometer arises
from solar specular refection and/or atmospheric backscatter. The 0.5% dif- ference in reflectance has been inter- preted as solar glitter (represented by the term r0(1-F)f in Eq. (2.6) and/or atmospheric backscatter. Accordingly, it is assumed that the subtraction of 0.5% from the apparent reflectance results in the desired inherent spectral reflectance Lu (X)/Ls o (x).
According to the above interpretation one would expect that the apparent reflectance spectrum should be simply displaced from R ~(X) by 0.5%; however, it is noted .that this is true instea.t for Rv(X ) and that the shape of R'(X) and R" z(x) do not in fact agree very well. The reason for this discrepancy is not clear. Although this disagreement be- tween the ship and airborne spectral re- flectance data remains unresolved, the surface reflection correction term deter- mined by examining the near infrared re- flectances can reasonably be accepted as a valid measurement since R ' (0.7)/ n Z
t
Ru(0.7) ~ 6. The photometer reflectance data ob-
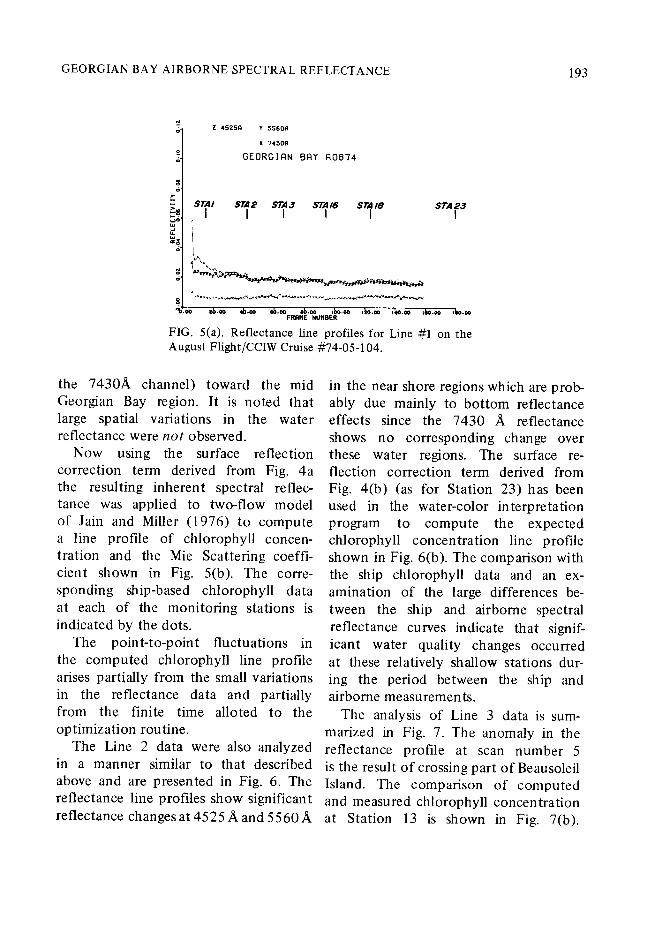
tained on Line 1 on August 7, 1974 is shown in Fig. 5(a). The spectral re- flectance curves given in Sect. 5.1 were shown to be slowly-varying smooth functions. Therefore, to simplify the data manipulations, reflectance data at only four wavelengths R'z(4524 A), R A), R (6995 A) and Raz "z(556o ' QZ
(7430 A), one in each of the spectral regions scanned, were selected for de- tailed study. The photometer obtains reflectance data at these four wave- lengths simultaneously when the photo- meter mask is in position 14 (see Fig. 1). Thus, the photometer yields a reflec-

192 .1 R. MILLER El AI
.O8
k ~ . o 6 ta ua
~ .O4
. 0 2
. 0 0
CCRS To~( ~ 74 - 37 Airborne photometer doto ....
CCIW Cruise 74-05-104 STA 23 opticol doto
I I I .45 .50 . 5 5 .60 .65
WAVELENGTH (microns)
Aug 7,/974
July 30, /974
I ' I
.70 .75
FIG. 4(a). Compar i son of r emote ly -measu red radiance spectral re f lec tance to the ship-based i r radiance spectral re f lec tance data at s ta t ion 23. The upper solid curve represents the in situ wHume ref lec tance data whereas the lower solid curve indicates the expec ted spectral re f lec tance for above the wate r surface•
. 0 8
. 0 6
~ .04 ";..'""
. 0 2
. 0 0 I • 45
FIG. 4(bL ref lec tance s ta t ion 7.
CCRS Tosk • 7 4 - 3 7 Airborne phofomwler dofo ...
CC/W Cruise 7 4 - 0 5 4 0 4 S?'A 7 ship op#icol do#o
Aug T,1974
Aug.l,19?'4
.•'-•.•%
I ; i l I • 5 0 . 5 5 . 6 0 . 6 5 . ? 0 . 7 5
WAVELENGTH {microns)
( ' om pa r i s on of r emote ly -measu red radiance spectral to ship-based i r radiance spectral ref lec tance data at
tance measurement at these four wave- lengths once per scan (every 4 seconds). These reflectances are plotted as a function of the accumulative scan (or frame) number, which is related to dis- tahoe along the track and tile correspon- ding water depth in the middle figure.
The reflectance line profiles at three wavelengths (one photometer channel malfunctioned) in Fig. 5(a) indicate significant reflectance changes only in the near-shore area in Owen Sound. Along the remainder of tile flight line the re- flectance decreased slowly (except for
GEORGIAN BAY AIRBORNE SPECTRAL REFLECTANCE 193
z 4525/ I Y 5S60R
X 7430R
GEORGIAN BAY A0874
STIA/ Sr~e STIA3 ~r~/6 s~m STA~3
FRRttE NUMSER
FIG. 5(a). Reflectance line profiles for Line #1 on the August Flight/CCIW Cruise #'74-05-104.
the 7430A channel) toward the mid in the near shore regions which are prob- Georgian Bay region. It is noted that large spatial variations in the water reflectance were n o t observed.
Now using the surface reflection correction term derived from Fig. 4a the resulting inherent spectral reflec-
ably due mainly to bot tom reflectance effects since the 7430 A reflectance shows no corresponding change over these water regions. The surface re- flection correction term derived from Fig. 4(b) (as for Station 2 3 ) h a s been
tance was applied to two-flow model used in the water-color interpretation of Jain and Miller (1976) to compute program to compute the expected a line profile of chlorophyll concen- chlorophyll concentration line profile tration and the Mie Scattering coeffi- shown in Fig. 6(b). The comparison with cient shown in Fig. 5(b). The corre- sponding ship-based chlorophyll data at each of the monitoring stations is indicated by the dots.
The point-to-point fluctuations in
the ship chlorophyll data and an ex- amination of the large differences be- tween the ship and airborne spectral reflectance curves indicate that signif- icant water quality changes occurred
the computed chlorophyll line profile at these relatively shallow stations dur- arises partially from the small variations ing the period between the ship and in the reflectance data and partially airborne measurements. from the finite time alloted to the The analysis of Line 3 data is sum- optimization routine, marized in Fig. 7. The anomaly in the
The Line 2 data were also analyzed reflectance profile at scan number 5 in a manner similar to that described is the result of crossing part of Beausoleil above and are presented in Fig. 6. The Island. The comparison of computed reflectance line profiles show significant and measured chlorophyll concentration reflectance c h a n g e s a t 4 5 2 5 A a n d 5 5 6 0 A at Station 13 is shown in Fig. 7(b).

94 J. R. MILLER ET A[
STA I STA ~ STA 3 STA I6 STA I8 STA 2 3 o . . . . I , I , I , I , i , , . 1 ,
i 1 8 GEORGIFIN 8R¥ A0874 i~°o:'. -
~ o ~:. l~ STA2 STA3 STAI6 $TAI8 STA23
°~o I I I I I~ z,~ ro ~
oS~
o
~oo =boo ,~,.oo ,6.o0 ,b.=~ ,~)o.~o ,~o.~ ,ao.oo ,~o.c,o I~. SCAN NUMBER
FIG. 5{h). ( ' o m p u t e d ch lorophyl l c o n c e n t r a t i o n line profile for line 1 compared to the measured s ta t ion ch lo rophyl l values ( shown as dots) ob t a ined on the CCIW Cruise #74-05-104 ,
Z 45Z5~1 Y 5560A
k 7430R
GEORGIAN BAY B0874
; ~ SrA 7 S T A a
8 ds ~a ~.~ =3.00 ~.~ *~.~ 4~.~ s~.~ s'J.~ e~.~
FRRItE NUflBE R /7- OO
FIG. 6(,a}. Ref lec tance line profi les for Line ~2 ~m the August F l ight /C( ' IW Cruise N74-05-104.

GEORGIAN BAY AIRBORNE SPECTRAL REFLECTANCE 195
SI'A 7 ST"A • "~ o I n /o /n t o ~n I no
I BO ~0
o
;8
d
OEORGIBN BAY 80874 o
~o z
z o w
u.
STA 7 BTA 8 |~o
• fZ
oo it, 4k.oo s~.oo s'L .oo e~.oo ~ . ' J : SCAN NUMBER
FIG. 6(b). Computed chlorophyll concentration line profile for line #2 compared to the measured chlorophyll values (shown as dots) obtained on CCIW Cruise #74-05-104.
.06
GEORGIAN BAY C0874
4 5 2 5 A Z~
.04 7 4 3 0 A o
~ .02
I ! "OCo ~ I 0 15 2 0
SCAN NUMBER
FIG. 7(a). Reflectance line profiles for Line #3 on the August Flight/CCIW Cruise #75-05-104.

.96 J. R. MILLER ET AL.
l ~ t , Y I
1.4 ] N
1.0 ,,4
I O.B
0.6
~ 0.4 0
GEORGIAN BAY COB?4
\ / / I I I
,ff I 0 18 SCAN NUMBER
FIG. 7( b t. Computed chlorophyl l concentra t ion line profile for Line #3 compared to the mea- sured chlorophyl l value at station ~13 obtained on the CCIW Cruise #74-05-104.
5.3 October Flight-CCIW Cruise ~g74-05-106
The October overflight provides air- borne data which is time-delayed from the ship data between 1 and 3 days. The reflectance profiles for Line 1 are pre- sented in Fig. 9. These curves show con- siderably more variation along the flight line than that observed in the August data.
Of all the water monitoring stations that were overflown, ship-based optical measurements were made on only Stations 2 and 23, both on Line 1. The ship-based and airborne spectral reflec- tance data for Stations 2 and 23 are shown in Fig. 8(a) and 8(b), respectively. Both spectrum comparisons indicate a solar specular reflection component of
about 1.3<~; this significant solar glitter problem was evident in the aerial track- recovery photography. The 1.3',~, surface rellection correction telln obtained from Fig. 8 was used in the water-color inter- pretation program to calculate the ex- pected Line 1 chlorophyll concentration line profile shown in Fig. 0. Agreement is found within about 30c:5., between the remote sensing determinations and the ship-based chlorophyll measurcme n t.
6. Discussion and Conc lus ions
A summary of the comparison of the ship-based chlorophyll concentration measurements with those derived from the analysis of airborne spectral reflec- tance data from this Georgian Bay pro- ject is shown in Fig. 10. The correlation coefficient for all the data is 0.810. Circled data points indicate probable interpretation errors because of bottom reflection signal contributions for the shallower Stations 7, 8 and 13. If these data are excluded the correlation coef- ficient becomes 0.948. Spectral data has been previously investigated by Jain et al. (1975) for a larger range of mea- sured chlorophyll values, from 0.6 to 18 mg/m s. For these data a correlation coefficient of 0.98(~ was found. These correlations suggest that physical mod- elling has reached a stage where quantita- tive water parameters can be derived by remote sensing means with useful accuracy.
Although this scanning photometer provided reflectance in 60 spectral channels the present data suggest that airborne radiometric measurements in

GEORGIAN BAY AIRBORNE SPECTRAL REFLECTANCE 197
CCRS Task # 7 4 - 5 7 • 0 8 Airborne photometer d a t a .... Oct. U, 1974
CCIW Cruise 74 -05 -106 STA 2 opt ical d a t a OcfllO,19T4
. 0 6
. 0 2 •
. 0 0 I i I L I I I . 4 5 . 5 0 . 5 5 . 6 0 . 6 5 . 7 0 . 7 5
WAVELENGTH ( m i c r o n s )
FIG. 8(a). Comparison of remotely measured radiance spectral reflec- tance to the ship-based irradiance reflectance at station 2.
t ~ . 0 6
~j ~ . 0 4
CCRS Tosk # 7 4 - 3 7 Airborne photometer data . . . .
CCIW Cruise 7 4 - 0 5 - 1 0 6 STA 23 ship opt ical da ta
Oct. I I , 19 74
O ~ I 8" / 9 7 4
• 02 ~ ..... <.
• 00 l i ""'~3"~"~'~, i i • 4 5 . 5 0 . 5 5 . 6 0 . 6 5 • 7 0 . 7 5
WAVELENGTH (microns)
FIG. 8(b). Comparison of remotely measured radiance spectral reflectance to the ship-based irradiance spectral reflectance at station 23.
only 4 spectral channels, selected in the appropriate wavelength regions, can pro- vide useful water quality information. The importance of this result lies in the feasibility of using simpler instrumenta- tion with less demanding data analysis requirements for routine optical water quality monitoring•
The analysis of this data has illustrated the importance of making a field mea-
surement of the surface reflection com- ponent of the radiance signal as observed at aircraft altitudes. The comparison of airborne and in situ reflectance data in the near infrared (~ 0.7/am) showed that most of the observed signal originated from the surface. These measurements demonstrate the validity of the use of optical measurements in the near infrared to determine the specular reflectance

108 ,I. R, MILLER ET AL.
g
6-
452SR Y 5560R
÷ 699SR
GEORGIRN BAh' ¢11074
STA1 STy2 STA3 STA16 STA J.8 $TA23 I I I I
,oo tb.OO ,46,OO eb.oo a6.oo ibo.oo i to .oo 140.cO i~, .oo Ibo.oo FRRtI[ NUMBER
FIG. 9(a). Reflectance line profiles for Line :~1 on the October Flight/('CIW Cruise ~74-05-106.
g
1 Q
I
g-
5:
GEORGIAN BAY A1034
STA 16 STA ).8 STA23
I I I
1
~ T I :"I /,
2~r ' i - . , ,p, , j ' j~
~b[. oo 20.00 40 oo 6o.oo so.oo ioo,oo i Io .oo 14o.oo leo ,oo SCRN NU~qBFR
C 6 ~
N - -
Z
D
18.
FIG. 4(b). C o m p u t e d ch lorophyl l c o n c e n t r a t i o n line profi le for Line #1 compared to the measured ch lo rophy l l values ( shown as dots) ob ta ined on the CCIW Cruise #74-05-106 .
signal• For turbid water one would measurement near 0.97 /~m, at the water expect the upwelling signal to form a absorpt ion max imum, should provide a much more impor tan t part o f the ap- more effective use o f this technique to parent reflectance at 0.7 #m so that a determine the specular reflectance.

GEORGIAN BAY AIRBORNE SPECTRAL REFLECTANCE 199
1.4
• 1 2 -
~ I.O
0.4
0 .2
G E O R G I A N BAY 197'4
®
I I I 0.2 O.4 O.6
MEASURED
®
®
I I I I I (9.8 LO L2 L4 L6
CHL OROPH YL L CONCEN TRA TION
( M o / m 3 ) FIG. 10. Correlation curve for the computed and measured chlorophyll concentrations obtained from the Georgian Bay overflights. The data points in which contamination by bottom reflectance was evident are indicated by circled dots.
This work was possible because o f the support o f the Canada Centre for hlland Waters through DSS contract #0554- 0078. The authors are grateful to Dr. K. S. Gordon who contributed a great deal to the analysis o f this data and to the personnel o f the Data Acquisition Section o f CCRS, the Airborne Sensing Unit o f the Canadian Armed Forces and to the personnel involved in the data
collection on the ship M. V. Martin Karlsen.
References
Arveson, J. C., Weaver, E. C., and Millard, J. P. (1971) Rapid assessment of water pollution by airborne measurement of chlorophyll content, AIAA Joint Conference of Remote Sensing of Environmental Pollutants, Palo Alto, California, November.

200 J. R. MILLER ET AL.
Austin, R. W., / 1974). R e m o t e sensing of spec- tral radiance in Optical Aspects of Ocean- ography IN. G. Jer lov and E. S teeman, Eds. L Neilsen, Academic Press, L o n d o n and New York, p. 371.
Clarke, G. L., Ewing, G. ('., and Lorenzen , C. J. (1970L Spectra of backsca t te red light f rom the sea ob ta ined f rom aircraf t as a measure of ch lo rophyl l concen t ra t ions , Science. 167, 1119.
Gordon , lt. R., (1973) , Simple ca lcula t ion of the diffuse ref lec tance of the ocean, Appl. Opt. 12, 2830.
Gordon , tt. R., and Brown, O. B., (1973~ Irra- diance ref lect ivi ty of a flat ocean as a func- t ion of its opt ical proper t ies , Appl. Opt. 12, 154~.
Gordon . K. S., (1975) . The spectra l and angular var ia t ion of sunl ight backsca t t e red f rom nat- ural water, Ph.D. Thesis, York Universi ty, Toron to .
Grum, F., and Luckey, G. W. (,1908), Opt ical sphere paint and a work ing s tandard of reflec- tance, Appl. Opt. 7, 2289.
Jain, S. ('., and Miller, J. R. (1976) , Subsurface water parameters : o p t i m i z a t i o n app roach to the i r d e t e r m i n a t i o n f rom remote ly sensed water color data , Appl. Opt. 1 5 , 8 8 6 .
Jain, S. (', Miller, J. R,, and McNeil, W. R. 119751, An evalua t ion of a ma thema t i ca l model for water co lour spectra l analysis, Proc. 3rd Canadian Symposium of Remote Sensing, E d m o n t o n , Alber ta , S e p t e m b e r 22-24, p. 289.
Jerlov, N. G., (1908) , Optical Oceanography, Elsewer Publ ishing Co., Amste rdam, L o n d o n and New York.
Kat tawar , G. W., and t t umphreys , I . J. t 197b~ Remote sensing of ch lorophyl l in an a tmo- sphere - ocean e n v i r o n m e n t : A theore t ica l s tudy, Appl. Opt. 15, 27,?.
McCluney, W. R. (1974) . Ocean color spec t rum calculat ions, Appl. Opt. 13, 2422.
McNeil, W. R., and T h o m s o n , K. P. B. 11974), Remote measu remen t of waler colour and its app l ica t ion to water qual i ty surveillance, Proc. 3rd Symposium ot~ Rcmote Sensing of Earth Resources, (F. Shahroktu , Ed . )Vol . IIl, VTSI, Tul lahoma, 'I enn.
McNeil, W. R., l ' ho ln son , K. P. B., and Je rome J. (1072) Fhe appl ica t ion of r emote spectral measu remen t s to water qual i ty moni tor ing , Canadian J. Rein. Sens. 2, 49,
Miller, J. R., Gordon , K. S., and Kamykowki , D. 119761 Ai rborne wate r co lour measure- ments of the Nova Storm coast, ~nadian J. Rein. Sere. 2, 42,
Miller, J, R.. Shepherd , tJ. G., and Koehler , R. A. (1971 ), A four channel scanning pho tom- e ter for r emote sensing, Canadian Aeronaut. Space J. 18, 325.
Miller J. R., Shepherd , G. G., and Koehler , R, A. (1973) Ai rborne spec t roscopic mea- sure lnents over water, Canadian Aeronaut. SpaceJ. 1 9 , 5 2 1 .
Ramsey, R. C. and White, P. G. (July 1973) Ocean color analysis applied to MDCS and SIS data, NOAA contract repor t .
Received 22 November 1976; revised 10 March 1976