interplay of packing and flip -flop in local bilayer ... · khalifat et al. lipid flip -flop and...
TRANSCRIPT

Khalifat et al. Lipid flip-flop and bilayer tubulation.
1
Interplay of packing and flip-flop in local bilayer deformation. How
phosphatidylglycerol could rescue mitochondrial function in a cardiolipin-
deficient yeast mutant.
Nada Khalifat†‡, Mohammad Rahimi§, Anne-Florence Bitbol§║, Michel Seigneuret** *, Jean-
Baptiste Fournier**, Nicolas Puff**║║, Marino Arroyo††, Miglena I. Angelova**║║ *
†UPMC Univ Paris 06, UMR 168, Institut Curie, 26 rue d’Ulm, 75248 Paris Cedex 05, France ‡ CNRS, UMR 168, Institut Curie, 26 rue d’Ulm, 75248 Paris Cedex 05, France §Lewis-Sigler Institute for Integrative Genomics, Princeton University, Princeton, NJ 08544,
USA ║Department of Physics, Princeton University, Princeton, NJ 08544, USA **Université Paris Diderot-Paris 7, Matière et Systèmes Complexes CNRS UMR 7057, Paris,
France ║║Université Pierre et Marie Curie, Paris, France ††Departament de Matemàtica Aplicada III, LaCàN, Universitat Politècnica de Catalunya,
08034, Barcelona, Spain.
*Correspondence : [email protected] or [email protected]
Université Paris Diderot-Paris 7
Matière et Systèmes Complexes
CNRS UMR 7057
10 rue Alice Domon et Léonie Duquet
75205 Paris cedex 13
France
ABSTRACT
In a previous work, we have shown that a spatially localized transmembrane pH gradient,
produced by acid micro-injection near the external side of cardiolipin-containing giant
unilamellar vesicles, leads to the formation of tubules that retract after the dissipation of this
gradient. These tubules have morphologies similar to mitochondrial cristae. The tubulation
effect is due to direct phospholipid packing modification in the outer leaflet that is promoted
by protonation of cardiolipin headgroups. Here we compare the case of cardiolipin-containing
giant unilamellar vesicles with that of phosphatidylglycerol-containing giant unilamellar
vesicles. Local acidification also promotes formation of tubules in the latter. However,
compared to cardiolipin-containing giant unilamellar vesicles the tubules are longer, exhibit a
visible pearling and have a much longer lifetime after acid micro-injection is stopped. We
attribute these differences to an additional mechanism that increases monolayer surface
imbalance, namely inward PG flip-flop promoted by the local transmembrane pH-gradient.
Simulations using a fully non-linear membrane model as well as geometrical calculations are
in agreement with this hypothesis. Interestingly, among yeast mutants deficient in cardiolipin
biosynthesis, only the crd1-null mutant, which accumulates phosphatidylglycerol, displays
significant mitochondrial activity. Our work provides a possible explanation of such a
property and further emphasizes the salient role of specific lipids in mitochondrial function.
Khalifat et al. Lipid flip-flop and bilayer tubulation.
2
INTRODUCTION
The shapes of cell membranes as well as their global or local modifications have an essential
role in cell function. The shape of a membrane, i.e. its local or global curvature, is related to
the asymmetry of its composition (transbilayer asymmetry of lipids and proteins) and its
environment (ion gradients, unilateral binding of effector molecules). Many studies have
attempted to mimic such shape changes in lipid bilayers (1-3). Membrane shape/curvature
changes often occur through local or global modifications of the relative area of the two
bilayer leaflets (3-5). Such processes may be associated with perturbations of the lipids per se.
In this regard, two main mechanisms have been documented: (i) direct differential change in
the packing (i.e. the effective molecular area and/or shape) of specific lipid species between
the two monolayers due to e.g. asymmetrical ligand or protein binding, chemical modification
or electrostatic effects (6-12); (ii) asymmetric lipid transbilayer diffusion, either spontaneous
or protein mediated (13-15). In the present study, we describe an example of a local shape
change of a lipid bilayer where there is interplay of these two processes, in the context of a
model membrane system that mimics the mitochondrial inner membrane of a yeast cardiolipin
(CL)-deficient mutant which accumulates phosphatidylglycerol (PG).
The mitochondrial inner membrane (MIM) is a salient case in which bilayer shape and its
modifications are strongly coupled with organelle function. It is the main site for ATP
production in aerobic eukaryotes, associated with a transmembrane electrochemical proton
gradient. This gradient couples an O2-fuelled respiratory chain with an ATP-synthase, as
explained by the chemiosmotic theory. Such processes take place mainly in tubular
invaginations of the MIM, termed cristae (16). Their particular local shape appears to be
strongly coupled with function since respiratory rate and ATP synthesis affect cristae
morphology (17). Depending on the physiological state of the mitochondria, the
mitochondrial matrix shape can be either“condensed”, with thick cristae, or “orthodox”, with
thinner cristae. The origin of the MIM cristae shape as well as of its coupling to mitochondrial
function is the subject of intense research. CL, a particular lipid found almost only in the
MIM, likely plays an important role since abnormalities in its synthesis usually lead to drastic
changes in organization of the MIM, loss of ATP synthesis as well as of the cristae
morphology (18). However, several authors (19-22) have reported that the yeast crd1-null
mutant, which lacks CL synthase and has no detectable CL but accumulates
phosphatidylglycerol (PG), displays normal mitochondrial activity at 30°C in glucose and
non-fermentable carbon sources, although mitochondrial functional defects are apparent under
suboptimal substrate conditions and higher temperature. This suggests that PG can
specifically substitute for some functions of CL in the MIM.
In a previous work, using giant unilamellar vesicles (GUVs) made of phosphatidylcholine
(PC)/phosphatidylethanolamine/CL or PC/CL to model the MIM, we offered some new
insights into the factors that determine the dynamical tubular structures of the mitochondrial
inner membrane cristae (23, 24). We found that when such vesicles are locally submitted to an
external local acidification, by topically generating a higher pH outside of the membrane,
inward tubulations develop. The morphology of these tubules is strongly reminiscent of MIM
cristae. This suggests that cristae formation can be accounted for within a minimal purely
lipidic model membrane under the influence of an electrochemical proton gradient.
Additionally, we have developed a theoretical description of local membrane deformations
due to local pH variations (11, 12, 23-26). The asymmetric pH-induced changes of
protonation of charged headgroups and the resulting changes of the electrostatic interactions
between such headgroups promote asymmetric local modifications of the lipid packing. This
affects both equilibrium lipid density and monolayer local spontaneous curvature, resulting in

Khalifat et al. Lipid flip-flop and bilayer tubulation.
3
a local deformation of the membrane (12, 26). Intermonolayer friction plays an important role
in the relaxation dynamics of these deformations.
In the present study, we further refine this model by focusing on yeast mutants which feature
CL-deficient but PG-enriched membranes. Using PC/PG-GUVs, we find that a local pH-
induced tubulation also occurs but with a different morphology and dynamics. We show that
such behavior can be accounted for in the framework of our model, provided that specific
properties of PG regarding flip-flop are taken into account. These results provide an
explanation of the functionality of the crd1-null yeast mutant.
MATERIALS AND METHODS
Chemicals
Lipids were purchased and used without further purification. Egg yolk L-α-
phosphatidylcholine (PC) from Sigma-Aldrich, heart bovine 1,3-bis(sn-3-phosphatidyl)-sn-
glycerol diphosphatidylglycerol (CL) and L-α-phosphatidylglycerol (PG) from Avanti Polar
lipids. Fluorescent probes 6-dodecanoyl-2-dimethylaminonaphthalene (Laurdan) from
Molecular Probes,HEPES from Interchim and EDTA from Sigma-Aldrich.
Giant Unilamellar Vesicles Preparation
GUVs were made on platinum electrodes in 2ml of buffer A (pH 8, HEPES 0.5 mM, EDTA
0.5mM) in a temperature controlled chamber (T ~ 25 °C) by the electroformation method as
described in (23). The GUVs were used the same day. Electroformation is known to produce
vesicles that are ~90% unilamellar (27, 28). Unilamellarity of studied vesicles was checked by
careful phase-contrast microscopy examination of the junction with the electrode as well as of
long-wavelength thermal membrane fluctuations.
Video Microscopy and Microinjection
The GUVs were observed by phase contrast with a Zeiss Axiovert 200M microscope,
equipped with a charge-coupled device camera (CoolSNAP HQ, Photometrics, Tucson, AZ,
USA). The experiments were computer-controlled using Metamorph software (Molecular
Devices, Downington, PA, USA).
Tapered micropipettes for the local injection of HCl were made from GDC-1 borosilicate
capillaries (Narishige, Tokyo, Japan), pulled on a PC-10 pipette puller (Narishige). For local
injection of the acidic solution of HCl (100 mM, pH 1.6) a microinjection system (Eppendorf
femtojet) was used with capillary of 0.3 μm and injection pressure set at 15–25 hPa.The
positioning of the micropipettes was controlled by a high-graduation micromanipulator
(MWO-202, Narishige) and the initial distance from the GUV membrane was ~10 μm.
Large Unilamellar Vesicle Preparation
Large unilamellar vesicles (LUVs) were prepared in buffer B (HEPES 5 mM, EDTA 0.1 mM,
pH 8), using the extrusion method described in (24). The fluorescent probe Laurdan was
mixed with the lipids in the initial organic solution and was used at low concentrations in
order not to perturb the lipid bilayer structure at 1/200 Laurdan/lipid ratio. The LUVs solution
were kept at 4 °C, and used for measurements the day after.

Khalifat et al. Lipid flip-flop and bilayer tubulation.
4
Laurdan Fluorescence Measurements
Steady-state fluorescence measurements were carried out with a Cary Eclipse
spectrofluorimeter (Varian Instruments, CA) equipped with polarizers and a thermostated
cuvette holder (±0.1 °C). Excitation and emission slits were adjusted to 5 nm. Fluorescence
emission spectra were all recorded at 25 °C. All fluorescence measurements were carried out
at a total lipid concentration of 0.2 mM.
The pH of the LUV samples was gradually lowered by adding aliquots of 10 or 100 mM HCl.
Measurements were made after 5 min of equilibration under agitation. Excitation wavelength
was 355 nm. Shifts in the Laurdan emission spectrum were quantified by calculating the
generalized polarization (GP) defined as GP = (I440 – I490)/(I440 + I490), (29)
RESULTS AND DISCUSSION
Comparison of tubular shape invaginations under local pH modulation in CL- and PG-
containing GUVs.
Our previous studies have shown that a localized change in pH in the vicinity of a GUV can
elicit a local shape transformation of the bilayer, depending on the lipid composition (11, 12,
23-25). Such a pH sensitivity, requires the presence of a lipid species, which undergoes a
change of its degree of protonation and therefore of its overall charge. The mechanism we
have proposed and detailed theoretically is as follows. The local variation of the average
charge leads to a local modification of the mutual repulsion between lipid molecules in the
outer monolayer. This directly affects their packing, by changing both their effective
molecular shape and their equilibrium in-plane area. This promotes a tendency for local shape
change since the outer monolayer of the exposed membrane zone has a new spontaneous
curvature and a new equilibrium molecular density. There is therefore a local mechanical
asymmetry between the two monolayers. A relaxation mechanism is the relative sliding of the
two monolayers that tends to spread the local density mismatch (although not the spontaneous
curvature mismatch) between these monolayers over the whole membrane. However, since
this process is slow, due to intermonolayer friction, a transient shape change occurs to
accommodate the asymmetry between the two monolayers. The exact nature and magnitude
of the shape change depends upon the sign and the strength of the initial mechanical stimulus
caused by the chemical modification and upon other factors (such as the GUV membrane
tension). This is the mechanism that we have previously invoked for the formation of cristae-
like tubulations in CL-containing GUVs.
In the present study, we have compared the effect of a local pH gradient on GUVs with lipid
composition corresponding to that (i) of normal IM membrane and (ii) of the yeast cdr1-null
mutant devoid of CL and accumulating PG. For this purpose, we have used a setup similar to
that of our previous study. Namely, individual GUVs in buffer at pH 8 (similar to the
mitochondrial matrix pH) were locally submitted to an external pH decrease by continuous
acid microinjection in the vicinity of the membrane (distance 10 m) to mimic locally
acidification due to the activity of the mitochondrial respiratory chain. In our previous work
(23), we roughly estimated that such acidification brings the bulk pH near the GUV to a value
of 4-5 by a calculation based on visualizing the acid flux from the micropipette under the
microscope. Here, estimation of the steady-state pH at the membrane surface was made using
a more precise theoretical description of the proton flux, taking into account the actual
micropipette geometry and realistic values for the injection pressure range of our experiments
(see Supporting Material). This calculation yielded a pH value of 4.8±0.4 at the membrane
Khalifat et al. Lipid flip-flop and bilayer tubulation.
5
surface facing the micropipette for a 50 m diameter vesicle and for a 30 s injection. This is
consistent with our earlier estimation. Two lipid compositions PC/CL 90:10 and PC/PG 90:10
(mol/mol) were compared. Below are shown representative data for the two cases.
As already reported previously, in the case of CL-containing GUVs, such local pH decrease
promotes rapid and progressive formation of inward tubular invaginations (Supporting
Material: Fig. S2, movie S1). The morphology of these tubes strongly recalls mitochondrial
cristae (23, 24). When acid microinjection is stopped, the tube retracts (frames from t= 31.8 s
to 71.7 s in Fig. S2). Its retraction time depends upon the size and the membrane tension of
the GUV and remains similar for comparable vesicles (see Fig 2 C). For the relatively large
(diameter ~50 m) and slightly deflated vesicle of Fig. S2, the retraction time is equal to
about 40 s.
When PG is substituted for CL, local acidification also promotes tubulation with similar
growth kinetics (Fig. 1, movie S2). However, two major differences are apparent. First, the
morphology of these tubules is markedly different. On average, these grow longer than with
CL and ultimately exhibit a pearled morphology. Second, after acid injection is switched off
(frames from t=27.3 s to t=203.3 s on Fig. 1), the kinetics of tube retraction is significantly
slower.

Khalifat et al. Lipid flip-flop and bilayer tubulation.
6
FIGURE 1 Local membrane invagination triggered on a GUV composed of PC/PG 90:10
mol/mol by a local pH decrease performed using a micropipette delivering an acidic solution
(100 mM HCl, pH 1.6) in buffer A at pH 8. The acid microinjection is started at t=0 and
ended at t=27.3 s. The corresponding movie is movie S2.
In the case of the vesicle of Fig. 1, which has a similar size and tension than that of Fig. S2,
the time for tube retraction is 170 s, i.e. more than 4 times slower that for CL-vesicles.

Khalifat et al. Lipid flip-flop and bilayer tubulation.
7
FIGURE 2 Comparison of the morphologies of tubes formed in GUVs of composition PC/PG
9:1 mol/mol (A) and PC/CL 9:1 mol/mol (B) upon local microinjection with acid. The images
correspond respectively to t= 23.7 and t=90.2s after injection. (C) Comparison of the kinetics
of tube growth upon local microinjection with acid for GUVs of composition PC/CL 9:1
mol/mol (diamonds) and PC/PG 9:1 mol/mol (triangles). The apparent planar length of tubes
was measured manually on microscopy images using the curvilinear tool of ImageJ. The
microinjection starts at t=0 and ends where indicated by a vertical arrow.
Fig. 2 A and B compare the CL vesicle and PG vesicle tubules of Fig. S2 and 1, emphasizing
their different morphologies. The different dynamical behavior is quantified in Fig 2 C, which
shows the evolution of the planar length of the tubule (i.e. the length as measured on
microscopic images which corresponds to a planar projection of the tubule).
The above data is representative of the behavior of large, slightly deflated, vesicles containing
CL or PG. Local acidification of smaller and/or tenser vesicles formed extremely long, narrow
and entangled tubules that retracted very slowly. A possible contributing effect on shape
changes of the osmotic pressure difference generated by acid injection was ruled out by
submitting GUVs to injection of 100 mM or higher sucrose under similar conditions: no shape
change was observed (not shown).
Khalifat et al. Lipid flip-flop and bilayer tubulation.
8
pH effect on lipid packing in PG- and CL-containing LUVs
To get more insight into the mechanism of the local pH-induced tubulation in PG containing
bilayers, as compared to CL-containing bilayer, we have studied the effect of pH on lipid
packing using the fluorescence of Laurdan incorporated in the membranes of LUVs of
similar lipid composition as the GUVs described above. Besides providing useful information
about the effect of pH and headgroup protonation state on lipid packing, this data allows one
to estimate of the “apparent pKa” of such protonation phenomena. In bilayers containing
charged lipids, and due to the negative surface potential, the H+ concentration in the vicinity
of the membrane is likely to be different than in the bulk. Charged lipids, depending on their
concentration in the membrane modulate the pH range for their own protonation. The extent
of this modulation also depends on ionic strength (30).
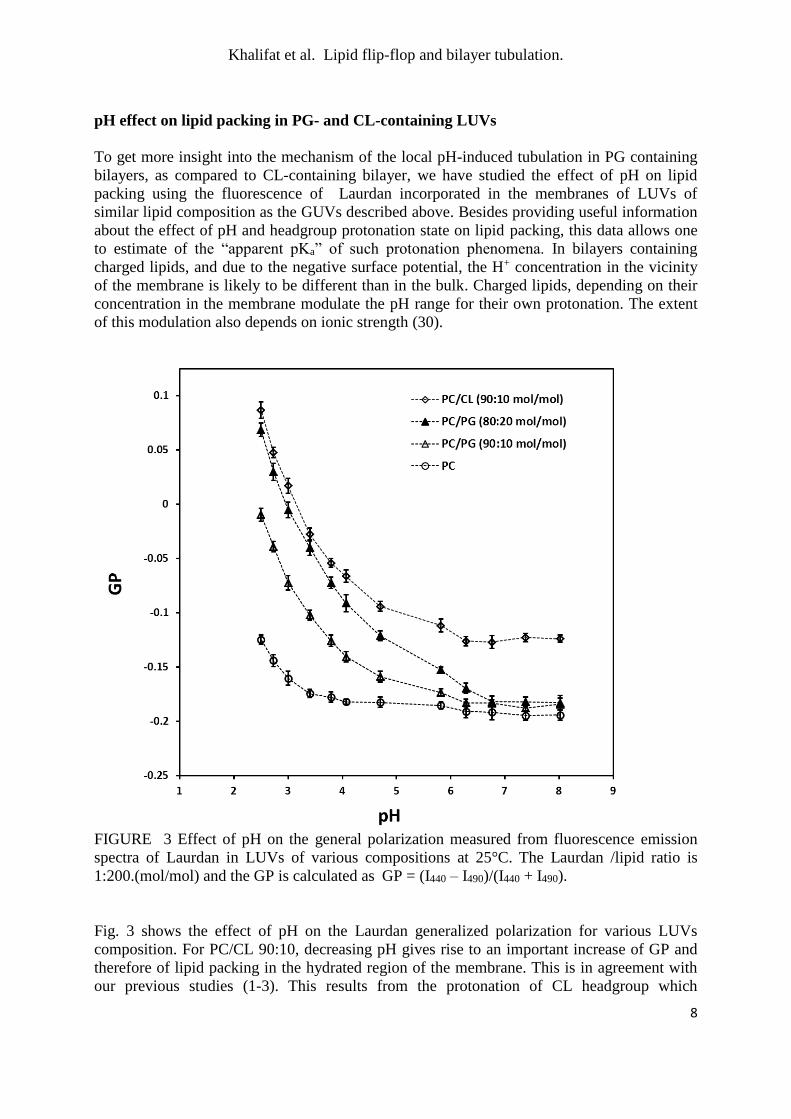
FIGURE 3 Effect of pH on the general polarization measured from fluorescence emission
spectra of Laurdan in LUVs of various compositions at 25°C. The Laurdan /lipid ratio is
1:200.(mol/mol) and the GP is calculated as GP = (I440 – I490)/(I440 + I490).
Fig. 3 shows the effect of pH on the Laurdan generalized polarization for various LUVs
composition. For PC/CL 90:10, decreasing pH gives rise to an important increase of GP and
therefore of lipid packing in the hydrated region of the membrane. This is in agreement with
our previous studies (1-3). This results from the protonation of CL headgroup which

Khalifat et al. Lipid flip-flop and bilayer tubulation.
9
decreases the electrostatic repulsion between CL molecules and therefore changes their
effective molecular shape as well as their molecular surface area. We previously showed that
such effects are the effective driving force for the pH-induced shape transformations found in
CL-containing GUVs (24). The pH effect on CL bilayers occurs in the bulk pH range 6-2.5
suggesting that this is the actual range for the CL headgroup protonation under such
conditions. When PG is substituted for CL in identical proportion (PC/PG 90:10), a rather
similar effect is observed on GP when pH is lowered, although the overall GP values are
higher with CL, due to the well-known ordering effect of the CL backbone (31). The pH
range for the effect is also similar. No such pH-induced packing variation occurs in this range
for the zwitterionic phosphatidylcholine, emphasizing its specificity for charged
phospholipids.
For 10 % PG, the increase in packing occurs between pH 7 and 2.5. This is to be compared
with a reported intrinsic pK value of 2.9 for PG (32). However, when the proportion of PG in
GUVs is doubled to 20%, the low-pH induced increase in GP is shifted by 0.5-1 pH units
towards higher pH. This illustrates the mutual influence of PG molecules on their protonation
behavior, namely, the higher the PG percentage in the membrane, the more its protonation is
anti-cooperatively hindered due to the unfavorable mutual electrostatic repulsion as well as to
the increased membrane charge that attracts H+ towards the surface (30). Thus the
deprotonation of negative lipids in membranes can be strongly shifted or extended to higher
pH.
These data indicate that, for PG-containing GUVs, a shape-changing mechanism similar to
that proposed for CL-containing GUVs (23, 24) is operative. Indeed, at 10% PG, a pH
decrease from 8 to 4.8±0.4, identical to that imposed in the GUV experiments, promotes a
significant increase in packing due to increase in molecular equilibrium density and
monolayer spontaneous curvature. It is therefore likely that such a mechanism contributes to
the tubulation observed for PG-containing GUVs.
Geometrical interpretation of the pearled tube morphology
In spite of this similarity, significant differences are observed with regards to the local shape
change elicited by local acidification between CL and PG containing GUVs. A particularly
salient one is the different morphology of the tubes formed, which, in the case of PG, are
longer and exhibit pearling. As shown from geometrical arguments in our previous work (23),
a tube is a more efficient way of accommodating surface curvature as compared to, e.g. a bud.
This suggests that the longer tube length obtained with PG is due to a higher surface curvature
and therefore a higher lipid density mismatch between the two monolayers. In this section, we
show that further geometrical arguments may explain why a lipid density mismatch may also
lead to an undulated tube. We consider a membrane tube of radius R0 and study whether the
area-difference between its two monolayers increases or decreases when a peristaltic
undulation is established. We choose a sinusoidal undulation that conserves the volume
parameterized in cylindrical coordinates by
zRzr o
2cos1
21)(
21
2
(1)
where is the amplitude of the undulation and its wavelength. We do not assume to be
small. The area-difference between the two monolayers is proportional to the mean-curvature
H of the membrane (4). The latter is given by

Khalifat et al. Lipid flip-flop and bilayer tubulation.
10
23
2
2
)('1)(
)(")()('1)(
zrzr
zrzrzrzH
(2)
Where r’ and r’’ are respectively the first and second z-derivatives of r. For given amplitudes
and wavelength of the undulation, we have numerically calculated the average <H> of the
mean-curvature (and hence the area difference) along the tube axis. As shown in Fig. 4,
roughly around 3R0, the average mean-curvature decreases as the tube undulates, whereas
roughly around 3R0 it increases, the increase being significant if the amplitude is larger
than about 30%.
FIGURE 4: Average mean-curvature <H> of a tube subject to a peristaltic undulation (inset)
normalized by the mean-curvature H0 = 1/2R0 of the tube of radius R0 with the same volume,
as a function of the wavelength of the undulation. The area-difference between the two
monolayers is proportional to the mean-curvature H of the membrane. The relative amplitude
of the undulation is equal to 0.1 (dotted line), 0.3 (dashed line) and 0.5 (plain line). The inset
corresponds to the situation indicated by a red dot.
This shows that imposition of an area difference above a certain threshold can indeed induce
pearling of a tube, as observed experimentally for PG-containing GUVs. Thus both the longer
length and the pearling of the tubes formed in PC/PG-GUVs are due to the occurrence of a
higher pH-induced monolayer mechanical imbalance as compared to CL-containing GUVs.

Khalifat et al. Lipid flip-flop and bilayer tubulation.
11
Hypothesis on the differences of the tubulation processes of PC/CL- and PC/PG-GUVs.
The above data suggest that, although the pH-induced tubulation in CL and PG vesicles share
one common shape change mechanism, a second mechanism is also operative for PC/PG-
GUVs which adds to the surface imbalance, hence the longer tube length and the pearling.
This later mechanism is likely also responsible for the slower tube retraction. Interestingly,
Cullis and collaborators (33, 34) demonstrated that PG can undergo rapid transbilayer
diffusion in LUVs through its neutral form even above its pK. In the presence of a pH
gradient, the formation of the neutral intermediate is more favorable in the monolayer facing
the most acidic solution, so that more PG molecules leave this monolayer towards the other
one than the opposite. Furthermore, after monolayer translocation, neutral PG molecules are
bound to become quickly deprotonated in the new basic environment, making the reverse
motion very unlikely. In short, protonated PG becomes neutral and can easily flip towards the
higher pH leaflet driven by mixing entropy differences, but then by losing its proton in the
new environment the reverse translocation is kinetically blocked. This results in a net
transport of PG towards the monolayer and an asymmetric distribution of PG, with PG
accumulating in the monolayer facing the most basic solution. No similar transbilayer
diffusion is found for CL (33). This difference can be explained by the smaller size of the PG
headgroup compared to the bulky CL headgroup and by that fact that PG can be brought to
neutral form by binding of a single H+ whereas CL requires binding of 2 H+, a much rarer
event.
Considering the well-known relation between phospholipid asymmetric flip-flop and
membrane curvature (13-15), we propose that inward PG flip-flop occurs in the area exposed
to acid in GUV experiments. Since the external surface of this area is more acidic, down to a
pH close to 4, this generates a net inward transport of PG from the outer to the inner
monolayer thereby creating an asymmetric distribution of PG. Such a process leads to a
decrease of the outer monolayer density and an increase in the inner monolayer density and
therefore to an additional density mismatch between the two monolayers and therefore to a
further bilayer imbalance. This adds up to the direct mechanism involving electrostatic
repulsion and modification of equilibrium density mismatch/spontaneous curvature.
Interestingly, global shape changes of PG-containing GUVs upon bulk external pH
acidification have already been reported (14, 35).
An a priori estimate of the relative efficiency of both mechanisms can be obtained as follows.
According to (34), the half-time for PG flip-flop induced by acidification to pH 4 is 12 min at
T=25°C. It can be straightforwardly calculated that, at 10% total PG, this corresponds to a PG
translocation corresponding to a fraction A ~ t.ln2/t1/2= 0.01 of total lipid after 10 s in the
acid-exposed area (10% of the total area) and therefore of 0.001 relative to total outer
monolayer lipid. This corresponds to a relative area change a/a between the two monolayers
of 0.2%. This is similar to what we estimated for the condensation/spontaneous curvature
mechanism in our earlier work (23). Therefore in the case of PG, two mechanisms of similar
magnitude may contribute in synergy to the bilayer imbalance. It should be remarked that the
occurrence of the PG flip-flop mechanism does not decrease the efficiency of the PG
deprotonation/packing mechanism since the depletion of exterior PG due to flip flop is
negligible. Therefore a longer length and pearling of tubules may be expected with PC/PG-
GUVs compared to PC/CL-GUVs where only one mechanism is operative.
The occurrence of an acid-driven inward PG flip-flop for PC/PG-GUVs might also explain
the slower rate of tube retraction after injection is stopped. Indeed, the interruption of acid
injection is followed by dissipation of the local low pH inside the tube, limited by H+

Khalifat et al. Lipid flip-flop and bilayer tubulation.
12
diffusion out of the tube. For PC/CL-GUVs, where protonation-related change in packing is
the sole mechanism, such pH homogenization immediately promotes deprotonation of CL and
relaxation of the membrane deformation (i.e. tube retraction), in order to recover the initial
lipid density and monolayer curvature match between the two monolayers. Relative sliding of
the two monolayers also contributes to relaxation but only minimally since it is slower than
diffusion of the H+ ions (12).
With PG, when injection is stopped, the above-mentioned relaxation mechanism associated
with dissipation of the pH gradient and PG headgroup deprotonation is operative but can only
yield partial tube retraction. Indeed, even when this gradient has collapsed, outward flip-flop
of excess PG, although thermodynamically favorable is kinetically frozen. The rate of
unidirectional flip-flop being proportional to the concentration of neutral PG in the leaflet and
therefore to the H+ concentration (34), the rate of outward flip-flop from the internal leaflet
(pH 8) is much slower (in principle 1000-10000 times) than the rate of the previous inward
flip-flop from the external leaflet (pH ~4-5), so that inside PG is effectively trapped in the
internal leaflet. Therefore, the relaxation of the density asymmetry caused by asymmetric flip-
flop only occurs through slow relaxation mechanisms. Monolayer relative sliding which
delocalizes the residual density mismatch over the whole bilayer is a slow process. An
estimation of the timescale can be obtained in the limit of small deformation as s=Kq2/2bm,
s=0.1/J·m-2 being the monolayer stretching modulus, bm=109J·s·m-1 the inter-monolayer
friction coefficient and q=/2L, the wavenumber of the deformation, with L=30 m, the
length of the tube (25). This corresponds to a timescale of about 30 s.
Lipid lateral diffusion is also able to relax the transbilayer density mismatches related to flip-
flop and may contribute with a similar timescale i.e. L2/Dlip=20 s with a value of the lipid
lateral diffusion coefficient Dlip=5m2/sec. (36).
Numerical simulations of the tubulation process.
We tested this hypothesis with numerical simulations based on a continuum bilayer dynamical
model, similar to that developed in (24) but capable of accessing the fully nonlinear regime
(37). This model describes the bilayer by its midsurface shape and by a lipid density field for
each monolayer. The viscoelastic response is determined by the stretching and curvature
elasticity, and by the inter-monolayer friction and the membrane interfacial shear viscosity.
The state of the bilayer is encoded in the model by the shape of the membrane surface and
by lipid density fields in the outer (+) and inner (-) monolayer, + and - respectively. The
elastic forces derive from the free energy
dSHKF s
2
2
0
2
0
2112
1
(3)
where denotes the total area of the membrane, s is the monolayer stretching modulus as
above, 0 is the equilibrium lipid density, is the bilayer bending modulus, H is the
membrane mean curvature, and any spontaneous curvature is neglected. The dissipative forces
derive from the dissipation potential
dSb
D mtot
ddddvv ::
2
2
(4)

Khalifat et al. Lipid flip-flop and bilayer tubulation.
13
where bm is the inter-monolayer friction coefficient as above, v+ and v- are the tangential
velocity field vectors on each monolayer (37), is the monolayer interfacial viscosity, d+ and
d- are the rate of deformation tensors of each monolayer and “:” denotes the tensor
contraction operator. To close the system, the balance of mass equations for each monolayer
is used
Hvdt
dn2div
v
(5)
where vn is the normal velocity. Since the protrusions are smaller than or comparable to the
characteristic length bm/ Ks (where is the viscosity of water), which is of the order of
a few micrometers, the viscous forces due to the solvent are neglected. The applicability of
such a simplifications are described in detail in our previous work (37, 39). The model is
discretized under the assumption of axisymmetry, using B-Spline basis functions (37).
This model is able to capture the dynamics observed in our experiments since it allows for the
variation of the lipid densities as a function of time and space as well as for the formation of
arbitrary membrane shapes. As discussed in the previous section, the acid injection modifies
the lipid packing by increasing the equilibrium density 0 which places the system out of
equilibrium. Thus the outer monolayer locally requires extra lipid to adopt the new
equilibrium density, which promotes lipid flows on the both monolayers toward/from the
modification area. The outer monolayer lipid flow is dragged by the membrane viscosity, due
to the interfacial flow, and by intermonolayer friction due to the outer monolayer slippage on
the inner monolayer. Simultaneously the new outer monolayer equilibrium density can be
satisfied by the local membrane bending (invagination) which again derives an interfacial
flow, partially slowed down by the membrane viscosity (Fig. 5 A, left) (37, 40). Similarly
flip-flop can generate the same type of dynamics by depleting the outer monolayer and
packing the inner monolayer (Fig. 5 A, right).
We chose as material parameters = 10-19 J, 2s = 0.1 J/m2, bm = 109 J s/m4, and 2 = 5.10-9
J s /m2 [12, 41-44] The GUV was modeled as a deflated prolate vesicle of nominal radius 25
m, similar to the vesicles in the experiments, and reduced volume v = 0.85 (Fig. 5 B). A more detailed simulation of the process reported here would involve the advection/diffusion
of H+ ions in the bulk, their reaction with the outer monolayer, and the subsequent effect on
the bilayer dynamics. To investigate the plausibility of our hypothesis that asymmetric flip-
flop is the major source for the different behavior of PG and CL GUVs, we focus on bilayer
mechanisms, and build on our previous work to treat in a simplified way the diffusion of H+
ions.

Khalifat et al. Lipid flip-flop and bilayer tubulation.
14
FIGURE 5 A. Schematic representation of the lipid density modifications, local shape
changes and lipid flows occurring after acid injection on GUVs in the case of direct density
change (left) and flip-flop (right). See text for details. B. Axially symmetric geometrical
configuration used for simulations of acid-induced tubulation in CL or PG-containing GUVs.
S(x) is the arc length of the generating curve of the modified axisymmetric area. The red arc
represents S0, the standard deviation of the Gaussian function by which the lipid packing
modification is applied.
We describe first the simulation protocol for the CL-containing membrane. The pH-induced
lipid condensation is introduced without explicitly accounting for the local diffusion of H+
ions due to acid injection and the subsequent protonation of lipid headgroups. A full treatment
of this effect in the case of small deformations can be found in (12, 26). Instead, the
equilibrium lipid density 0 in the outer monolayer (+) in a small region of the vesicle S0 was
directly modified. To model such lipid condensation, the equilibrium density is abruptly
increased by a constant amount for the duration of the injection time, i.e. in the interval (0;
Khalifat et al. Lipid flip-flop and bilayer tubulation.
15
tinj). This simplification is justified because the acid-base equilibrium between the lipids and
the injected acid is instantaneous, and the time taken by the pH profile to establish during the
injection is of order 30 ms in our experiments, which is negligible compared to the injection
time as shown in the Supporting Material, and in (26). Afterwards, this lipid density
modification is gradually decreased in a time-scale commensurate to what we observe in
experiments, in order to account for the diffusion of excess H+ after the end of the injection.
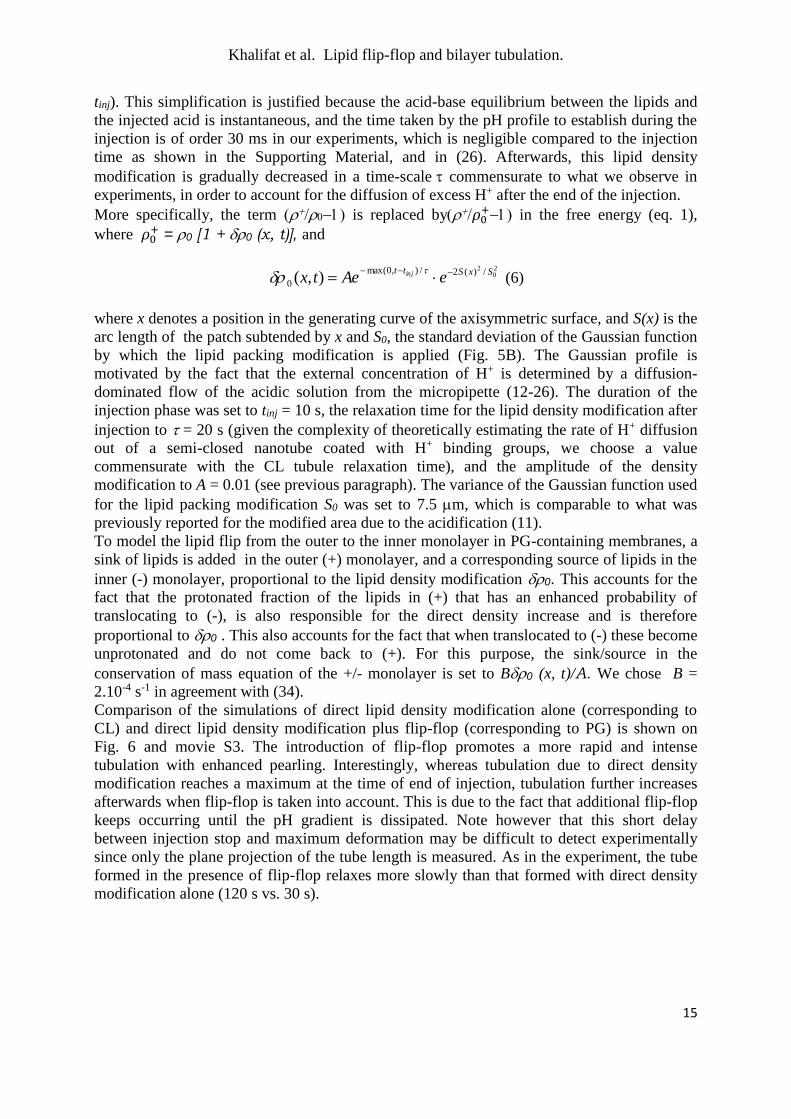
More specifically, the term is replaced by𝜌0+ in the free energy (eq. 1),
where 𝜌0+ = 0 [1 + 0 (x, t)], and
20
2 /)(2/),0max(
0 ),(SxStt
eAetx inj
(6)
where x denotes a position in the generating curve of the axisymmetric surface, and S(x) is the
arc length of the patch subtended by x and S0, the standard deviation of the Gaussian function
by which the lipid packing modification is applied (Fig. 5B). The Gaussian profile is
motivated by the fact that the external concentration of H+ is determined by a diffusion-
dominated flow of the acidic solution from the micropipette (12-26). The duration of the
injection phase was set to tinj = 10 s, the relaxation time for the lipid density modification after
injection to = 20 s (given the complexity of theoretically estimating the rate of H+ diffusion
out of a semi-closed nanotube coated with H+ binding groups, we choose a value
commensurate with the CL tubule relaxation time), and the amplitude of the density
modification to A = 0.01 (see previous paragraph). The variance of the Gaussian function used
for the lipid packing modification S0 was set to 7.5 m, which is comparable to what was
previously reported for the modified area due to the acidification (11).
To model the lipid flip from the outer to the inner monolayer in PG-containing membranes, a
sink of lipids is added in the outer (+) monolayer, and a corresponding source of lipids in the
inner (-) monolayer, proportional to the lipid density modification 0. This accounts for the
fact that the protonated fraction of the lipids in (+) that has an enhanced probability of
translocating to (-), is also responsible for the direct density increase and is therefore
proportional to 0 . This also accounts for the fact that when translocated to (-) these become
unprotonated and do not come back to (+). For this purpose, the sink/source in the
conservation of mass equation of the +/- monolayer is set to B0 (x, t)/A. We chose B =
2.10-4 s-1 in agreement with (34).
Comparison of the simulations of direct lipid density modification alone (corresponding to
CL) and direct lipid density modification plus flip-flop (corresponding to PG) is shown on
Fig. 6 and movie S3. The introduction of flip-flop promotes a more rapid and intense
tubulation with enhanced pearling. Interestingly, whereas tubulation due to direct density
modification reaches a maximum at the time of end of injection, tubulation further increases
afterwards when flip-flop is taken into account. This is due to the fact that additional flip-flop
keeps occurring until the pH gradient is dissipated. Note however that this short delay
between injection stop and maximum deformation may be difficult to detect experimentally
since only the plane projection of the tube length is measured. As in the experiment, the tube
formed in the presence of flip-flop relaxes more slowly than that formed with direct density
modification alone (120 s vs. 30 s).

Khalifat et al. Lipid flip-flop and bilayer tubulation.
16
FIGURE 6 Results of simulation of tube formation after local acid injection on a GUV in the
case of direct density change (corresponding to CL-containing GUVs, 1st and 3rd column) and
in the case of direct density change and flip flop (corresponding to PG-containing GUVs, 2nd
and 4rd column). The color maps represent the difference between the monolayer lipid
densities +--, where red corresponds to A and green to 0. The time values and arrows in red
correspond to the the time period where the acid diffuses and therefore the lipid density
modification exponentially decreases. The corresponding movie is movie S3.

Khalifat et al. Lipid flip-flop and bilayer tubulation.
17
Fig. 7 shows the kinetics of growth and retraction of the tube corresponding to the simulation
shown in Fig. 6. The tube length and kinetics both in the case of a direct equilibrium density
change (corresponding to CL-containing GUVs) and in the case of a direct equilibrium
density change plus flip flop (corresponding to PG-containing GUVs), although not identical
to experiments, occur in similar time frames and with similar relative timescales (factor of 4
in relaxation times).
FIGURE 7 Dynamics of tube length growth derived from simulations and considering either
only a direct equilibrium density change of the outer monolayer (solid line), corresponding to
CL-containing GUVs, or a direct equilibrium density change and transbilayer sink/source flip
flop (dashed line), (corresponding to CL-containing GUVs). The two vertical dotted lines
correspond respectively to the end of the constant local density increase of the outer
monolayer (i.e injection time) and the end of the relaxation of this density increase.
The evolution of dissipation power during the simulated tube growth and retraction was
studied as a function of time (Fig. S3). Dissipation through intermonolayer friction due to
monolayer sliding is the dominant process. However, transient increases in the fraction of
total dissipation that arises from monolayer viscosity occur during the kinetics. As already
pointed at in our previous simulations (37), these correspond to discontinuous events such as
onset of tubulation, initial neck formation, appearance or retraction of pearls and final
disappearance of neck and retraction. Such events are slowed down by the monolayer viscous
drag. This is consistent with our recent theoretical work which describes in detail the coupling
between out of plane membrane shape transformations and lateral monolayer viscous
dissipation (40).

Khalifat et al. Lipid flip-flop and bilayer tubulation.
18
These simulations suggest that not only the more extended and pearled morphology of tubes
formed with PG but also their slower retraction as compared to CL can be accounted for by a
model in which local acidification promotes both direct change in lipid packing and inward
PG flip-flop and in which tube retraction is limited by monolayer sliding and dissipation is
dominated by intermonolayer friction. It is therefore plausible that, upon local exterior
acidification of PC/PG-GUVs, the PG protonation-induced equilibrium density/spontaneous
curvature mechanism and the PG flip-flop mechanism both contribute to the tubulation.
CONCLUSION The present study documents two possible 2 mechanisms involved in pH gradient-induced
shape changes of charged lipid bilayers: (1) direct phospholipid packing (equilibrium density
and spontaneous curvature) modifications; (2) asymmetric flip-flop (leading to bilayer density
imbalance), both promoted by asymmetric protonation changes of lipid headgroups. Whereas
the occurrence of the first mechanism only requires the presence of a protonable charged
phospholipid, the second mechanism requires the occurrence of an uncharged form of this
phospholipid, as well as a moderately sized headgroup. Apart from PG, phosphatidic acid (45)
and phosphatidylinositol are likely candidates. Both mechanism lead to different relaxation
properties, that influence the dynamics of shape changes.
We have shown that a pH gradient applied to a model membrane that mimics the
mitochondrial inner membrane of CL synthase-deficient yeast mutant induces the formation
of tubular structures. Our observation that the presence of PG in membranes does promote the
formation of membrane tubules in the presence of a pH gradient provides an insight into the
mechanism by which PG can partially substitute for CL in mitochondrial function. Indeed in
the cdr1-Null mutant that lacks cardiolipin synthase and accumulates PG, tubules that may
partially substitute to normal cristae may form in the IM, as found in PG-containing GUVs.
This may explain why significant mitochondrial activity is present in this mutant despite the
absence of CL (19-22). Furthermore, the occurrence of a flip-flop mechanism for PG may
explain the particular temperature-sensitivity of mitochondrial function in the cdr1-null
mutant. In ref. (33), it was found that PG flip-flop has an activation energy of 31kcal/mole,
corresponding to a 3-fold increase of flip-flop rate every 7°C. This is likely to affect the
mutant cristae morphology in vivo and therefore mitochondrial function. Therefore, this study
gives further support to our suggestion of an important role of the lipid composition in the IM
structure and function. Additionally, this study contributes to the general understanding of
membrane tubulation, which occurs in processes as diverse as Golgi remodeling (46),
endosome sorting (47) , filopodia (48) and microvilli (49) formation, cell-cell contacts (50)
and intercellular communications (51).
SUPPORTING MATERIAL
Below: Three figures, details of local pH calculation, additional experimental results,
simulation details, Supporting references.
On publisher’s website: 3 videos.
ACKNOWLEDGMENTS
We thank Dr. Galya Staneva (Bulgarian Academy of Science) for performing the sucrose
injection control experiment. M.I.A. and N.K. would like to thank Miriam L. Greenberg (Dept
of Biological Sciences, Wayne State University, Detroit, USA), and, all the participants in the

Khalifat et al. Lipid flip-flop and bilayer tubulation.
19
“Assembly of Mitochondrial Membranes in Health and Disease”, Foundation les Treilles,
2010 (France) for the fruitful discussions.
This work was supported by grants from the CNRS and the Université Paris-Diderot. MA
acknowledges the support of the European Research Council (FP7/2007–2013)/ERC Grant
Agreement no. 240487. AFB acknowledges the support of the Human Frontier Science
Program, as well as partial support by National Science Foundation Grant PHY-0957573 and
National Institutes of Health Grant R01 GM082938.
REFERENCES
1. Farsad K. and P. De Camilli. Mechanisms of membrane deformation. 2003. Curr. Opin.
Cell. Biol. 15:372-381.
2. Graham, T. R. and M. M. Kozlov 2010. Interplay of proteins and lipids in generating
membrane curvature.Curr. Opin. Cell Biol. 22:430-436.
3. Bigay, J, and B. Antonny. Curvature, lipid packing, and electrostatics of membrane
organelles: defining cellular territories in determining specificity. 2012. Dev. Cell. 23:886-
895.
4. Miao L. , U. Seifert, M. Wortis, and H. G. Dobereiner. 1994. Budding Transitions of Fluid-
Bilayer Vesicles: The Effect of Area-Difference Elasticity. Phys. Rev. E49, 5389-5407.
5. Seifert, U. 1997.Configurations of fluid membranes and vesicles. Adv. Phys. 46:13-137.
6. Mavcic, B., B Babnik, A Iglic, M Kanduser, T Slivnik, V Kralj-Iglic. 2004. Shape
transformation of giant phospholipid vesicles at high concentrations of C12E8.
Bioelectrochemistry. 63:183-187.
7. Staneva G., M. Seigneuret, K. Kouma, G. Trugnan, M. I. Angelova. 2005. Detergents
induce raft-like domains budding and fission from giant unilamellar heterogeneous vesicles: a
direct microscopy observation. Chem. Phys. Lipids. 136:55-66.
8. Itoh T. and P. De Camilli. BAR, F-BAR (EFC) and ENTH/ANTH domains in the
regulation of membrane-cytosol interfaces and membrane curvature. Biochim. Biophys. Acta.
2006. 1761:897-912.
9. Heuvingh, J., S. and Bonneau. 2009. Asymmetric oxidation of giant vesicles triggers
curvature-associated shape transition and permeabilization. Biophys J. 97:2904-2912.
10. Tuller G, C Hrastnik, G Achleitner, U Schiefthaler, F Klein, G Daum. 1998. YDL142c
encodes cardiolipin synthase (Cls1p) and is non-essential for aerobic growth of
Saccharomyces cerevisiae. FEBS Lett. 421:15-18.
10. Yu Y. , J. A. Vroman, S.C. Bae, S. Granick. 2010. Vesicle budding induced by a pore-
forming peptide. J Am Chem Soc. 132:195-201.
11. Bitbol, A. F.; J. B Fournier; M. I. Angelova and N. Puff, 2011. Dynamical membrane
curvature instability controlled by intermonolayer friction J. Phys: Condens. Matter. 23:
284102
12. Bitbol, A.-F., N.Puff, Y. Sakuma, M . Imai, J.-B. Fournier and M. I. Angelova, 2012.
Lipid membrane deformation in response to a local pH modification: theory and experiments.
Soft Matter. 8: 6073– 6082
13. Seigneuret, M. and Devaux, P. 1984. ATP-dependent asymmetric distribution of spin-
labeled phospholipids in the erythrocyte membrane: relation to shape changes. Proc. Natl.
Acad. Sci. USA. 81, 3751-3755.
14. Farge, E. and Devaux, P. F. 1992. Shape changes of giant liposomes induced by an
asymmetric transmembrane distribution of phospholipids. Biophys J. 61:347–357.

Khalifat et al. Lipid flip-flop and bilayer tubulation.
20
15. Farge, E. Increased Vesicle Endocytosis Due to an Increase in the Plasma Membrane
Phosphatidylserine Concentration. Biophys. J. 69:2501-2506.
16. Logan, D.C. 2006. The mitochondrial compartment. J. Exp. Bot. 57: 1225–1243.
17. Mannella, C.A. 2006. Structure and dynamics of the mitochondrial inner membrane
cristae. Biochim. Biophys. Acta. 1763: 542–548.
18. Janitor M., M. Obernauerová, S. D. Kohlwein and J. Subík. 1996. The pel1 mutant of
Saccharomyces cerevisiae is deficient in cardiolipin and does not survive the disruption of the
CHO1 gene encoding phosphatidylserine synthase. FEMS Microbiol. Lett. 140:43-47.
19. Jiang F., HS Rizavi, and M. L. Greenberg. 1997. Cardiolipin is not essential for the
growth of Saccharomyces cerevisiae on fermentable or non-fermentable carbon sources. Mol.
Microbiol. 26:481-491.
21. Chang, S. C, P. N. Heacock, C. J. Clancey and W. Dowhan. 1998. The PEL1 gene
(renamed PGS1) encodes the phosphatidylglycero-phosphate synthase of Saccharomyces
cerevisiae. J. Biol. Chem. 273:9829-9836.
22. Jiang, F., M. T. Ryan, M. Schlame, M. Zhao, Z. Gu, M. Klingenberg, N. Pfanner, and M.
L. Greenberg. 2000. Absence of Cardiolipin in the crd1 Null Mutant Results in reased
Mitochondrial Membrane Potential and Reduced Mitochondrial Function. J. Biol. Chem.
275:22387-22394.
23. Khalifat, N., N. Puff, S. Bonneau, J. B. Fournier, and M. I. Angelova. 2008. Membrane
deformation under local pH gradient: mimicking mitochondrial cristae dynamics. Biophys. J.
95:4924-4933.
24. Khalifat, N.; Fournier, J. B.; Angelova, M. I.; Puff, N. 2011. Lipid packing variations
induced by pH in cardiolipin-containing bilayers: the driving force for the cristae-like shape
instability Biochim. Biophys. Acta. 1808, 2724– 2733
25. Fournier, J. B., N. Khalifat, N. Puff and M. I. Angelova. 2009. Chemically triggered
ejection of membrane tubules controlled by intermonolayer friction. Phys Rev Lett.
102:018102.
26. Bitbol, A-F. and J-B. Fournier. 2013. Membrane properties revealed by spatiotemporal
response to a local inhomogeneity. Biochim. Biophys. Acta. 1828:1241-1249.
27. Mathivet, L., S Cribier and P. F. Devaux. 1996. Shape change and physical properties of
giant phospholipid vesicles prepared in the presence of an AC electric field. Biophys J. 70:
1112-1121.
28. Bagatolli L. A., T. Parasassi and E. Gratton 2000. Giant phospholipid vesicles:
comparison among the whole lipid sample characteristics using different preparation methods:
a two photon fluorescence microscopy study. Chem Phys Lipids. 105, 135-47.
29. Parasassi, T., G. De Stasio, G. Ravagnan, R. M. Rusch and E. Gratton. 1991. Quantitation
of lipid phases in phospholipid vesicles by the generalized polarization of Laurdan
fluorescence Biophys. J., 60, 179– 189
30. Ninham B. W. and V. A. Parsegian. 1971. Electrostatic potential between surfaces bearing
ionizable groups in ionic equilibrium with physiologic saline solution. J Theor Biol. 31:405-
428.
31. Lewis R. N. and R.N. McElhaney. 2009. The physicochemical properties of cardiolipin
bilayers and cardiolipin-containing lipid membranes. Biochim. Biophys. Acta. 1788:2069-
2079.
32. Watts, A., K. Harlos, W. Maschke, and D. Marsh. 1978. Control of the structure and
fluidity of phosphatidylglycerol bilayers by pH titration. Biochim. Biophys. Acta 510:63-74.
33. Hope, M. J., T. E. Redelmeier, K. F. Wong, W. Rodrigueza and P. R. Cullis.
Phospholipid asymmetry in large unilamellar vesicles induced by transmembrane pH
gradients. 1989. Biochemistry. 28: 1-4187.

Khalifat et al. Lipid flip-flop and bilayer tubulation.
21
34. Redelmeier, T. E., M. J. Hope and P. R. Cullis. 1990. On the mechanism of transbilayer
transport of phosphatidylglycerol in response to transmembrane pH gradients. Biochemistry.
29:3046-3053.
35. Mui, B. L., Döbereiner, H. G., Madden T. D., Cullis, P. R. 1995. Influence of transbilayer
area asymmetry on the morphology of large unilamellar vesicles. Biophys J. 69:930-941.
36. Almeida, P.F.F. and W.L.C.Vaz. 1995 Lateral Diffusion in Membranes. In Handbook of
Biological Physics, Vol. 1. R. Lipowsky and E. Sackmann editors. Elsevier Science B.V. 306-
357.
37. Rahimi, M. and Arroyo, M., 2012. Shape dynamics, lipid hydrodynamics and the complex
viscoelasticity of bilayer membranes Physical Review E, 86: 011932.
38. Seifert, U. and S. A. Langer. 1993. Viscous Modes of Fluid Bilayer Membranes. Europhys.
Lett. 23, 71-76. 39. Arroyo, M. and A. De Simone. 2009. Relaxation Dynamics of Fluid Membranes. Phys.
Rev. E 79, 031915 (2009)
40. Rahimi,M., A. DeSimone and M. Arroyo. Curved fluid membranes behave laterally as
effective viscoelastic media. 2013. Soft Matter. 9: 11033-11045.
41. Merkel, R., E.Sackmann and E.Evans, 1989. Molecular friction and epitactic coupling
between monolayers in supported bilayers J.Phys.France, 50, 1535 -1555.
42. Rawicz, W., K.C.Olbrich,T. McIntosh, D.Needham and E.Evans. 2000 Effect of chain
length and unsaturation on elasticity of lipid bilayers. Biophys. J. 79, 328-339.
43. T.Pott and P. Méléard. 2002. The dynamics of vesicle thermal fluctuations is controlled by
intermonolayer friction Europhys.Lett. 59:87.
44. Horner, A., S. A. Akimov, and P. Pohl. 2013. Long and Short Lipid Molecules Experience
the Same Interleaflet Drag in Lipid Bilayers. Phys. Rev. Lett. 110: 268101.
45. Eastman, S. J., M. J. Hope and P. R. Cullis. 1991. Transbilayer transport of phosphatidic
acid in response to transmembrane pH gradients. Biochemistry. 30:1740-1745.
46. Ha K. D. , B. A. Clarke, and W. J. Brown. 2012. Regulation of the Golgi complex by
phospholipid remodeling enzymes. Biochim. Biophys. Acta. 1821:1078-1088.
47. Breusegem, S. Y.and M. N. Seaman. 2014. Image-based and biochemical assays to
investigate endosomal protein sorting. Methods Enzymol. 534:155-178.
48. Daniels, D. R. and M. S. Turner. Islands of conformational stability for filopodia. PLoS
One. 208:e59010.
49. Maheshwari A. 2004. Role of cytokines in human intestinal villous development. Clin
Perinatol.;31:143-155.
50. Okochi N., T. Okazaki, H. Hattori 2009. Encouraging effect of cadherin-mediated cell-cell
junctions on transfer printing of micropatterned vascular endothelial cells. Langmuir.
25:6947-6953.
51. Gerdes, H. H. and R. N. Carvalho. 2008. Intercellular transfer mediated by tunneling
nanotubes. Curr Opin Cell Biol. 20: 470-475.

SUPPORTING MATERIALInterplay of packing and flip-flop in local bilayer deformation. How
phosphatidylglycerol could rescue mitochondrial function in acardiolipin-deficient yeast mutant.
Nada Khalifat†‡, Mohammad Rahimi§, Anne-Florence Bitbol§‖, Michel Seigneuret∗∗, Jean-BaptisteFournier∗∗, Nicolas Puff∗∗‖‖, Marino Arroyo††, Miglena I. Angelova∗∗‖‖
†UPMC Univ Paris 06, UMR 168, Institut Curie, 26 rue dUlm, 75248 Paris Cedex 05, France‡CNRS, UMR 168, Institut Curie, 26 rue dUlm, 75248 Paris Cedex 05, France
§Lewis-Sigler Institute for Integrative Genomics, Princeton University, Princeton, NJ 08544, USA‖Department of Physics, Princeton University, Princeton, NJ 08544, USA
∗∗Universite Paris Diderot-Paris 7, Matiere et Systemes Complexes CNRS UMR 7057, Paris, France‖‖Universite Pierre et Marie Curie, Paris, France
††Departament de Matematica Aplicada III, LaCaN, Universitat Politecnica de Catalunya, 08034,Barcelona, Spain
Determination of the pH at the membrane surface
The pH on the GUV membrane during the microinjection of acid solution can be estimated as follows. First, the initial veloc-ity v0 of the acid solution when it just flows out of the micropipette into the fluid that surrounds the GUVs, i.e., the velocityright at the tip of the micropipette, is determined from the hydrodynamics inside the micropipette. This initial velocity v0 iscalculated as a function of the injection pressure, taking into account the geometry of the micropipette. Then, once the acidsolution is out of the micropipette, we show that its dynamics is dominated by diffusion, which enables us to calculate the pHin the fluid that surrounds the GUVs, and hence the pH close to the GUV membrane. The diffusion calculation involves thequantity of acid injected per unit time from the micropipette, which acts as a source for the diffusion process. This quantitycan be determined from v0.
1 Initial velocity v0 of the acid solution
In order to estimate the velocity v0 of the acid solution at the micropipette tip, we study the hydrodynamics in the micropipette.Considering that the diameter of the micropipette varies slowly from the point where the injection pressure is imposed to
the thin tip of the micropipette, we can approximate the shape of the micropipette as a succession of cylinders where the flow isa standard Poiseuille flow. The pressure drop P in each of these cylinders is related to its diameter δ through P ∝ δ 4/`, where` denotes the length of the cylinder (1). Hence, most of the pressure drop occurs in the thinnest region of the micropipette.
Measurements of the internal diameter of the micropipette tip, performed as described in (2), led to a value of 0.3 µm inour experiments. Moreover, direct observation under the microscope shows that the diameter of the micropipette is approxi-mately constant along the first∼ 10 µm closest to the tip, beyond which this diameter increases significantly. Hence, almost allthe pressure drop occurs in this small cylinder region close to the tip of the micropipette. We thus approximate the velocity v0of the acid solution at the micropipette tip by the average velocity of a Poiseuille flow in a cylinder with diameter δ ≈ 0.3 µmand length `≈ 10 µm submitted to a pressure drop P equal to the injection pressure, P≈ 20hPa. It reads
v0 =Pδ 2
32η`, (1)

23
which yields v0 ≈ 0.56mm/s with the above-mentioned values.In order to check the validity of this approximation, the velocity v0 at the tip of the micropipette was also calculated
assuming that the small cylinder considered here is followed by a cone and by another cylinder of larger diameter. The orderof magnitude of the length and diameter of the cone and of the second cylinder were determined from the microscope obser-vation of the micropipette, and the cone was treated as a succession of infinitesimal cylinders. This calculation yields a valueof v0 which is smaller than the above value by less than 4%. Thus, the largest source of error in our estimate of v0 does notarise from this approximation, but from our limited knowledge of the exact geometry of the tip of the micropipette, and inparticular of the effective value of `, which could vary from one micropipette to another. In order to assess the uncertaintycoming from this factor, we used both `= 10 µm and `= 5 µm, and compared the values obtained. The final values of the pHwere only marginally affected (see below).
2 Diffusion of the acid solution
Once the acid solution is out of the pipette, its dynamics is determined by diffusion and by Stokes hydrodynamics. Therelative importance of these two effects is characterized by the Peclet number Pe = vz0/D, where v is the flow velocity,while D is the diffusion coefficient of hydrochloric acid in water, D = 2/(1/DH+ + 1/DCl−) = 3347 µm2/s at infinite dilu-tion and at 20◦C (3), and z0 is a characteristic distance of the flow, which is taken as the distance between the membraneand the micropipette tip, i.e., about 10 µm. Although the actual characteristic length scale over which the velocity varies isin fact smaller (see below), we take this value in order not to risk underestimating the Peclet number. At the very tip ofthe micropipette, where v = v0, Pe ≈ 1.7, which implies that both hydrodynamic flow and diffusion are initially important.However, away from the micropipette, the velocity of the flow decreases, and hence diffusion becomes dominant. To demon-strate this, we first assume the opposite, i.e. that hydrodynamics is dominant over diffusion, thereby overestimating the flowvelocity. In this case, the flow corresponds to a Stokes jet (4, 5). Flow conservation (or, equivalently, more complete Stokesjet dynamics, see (4, 5)) entails that at a distance L from the source, the flow velocity is v ≈ v0δ 2/(16L2). For L = 1 µm,we obtain v≈ 3.2 µm/s, which gives a Peclet number Pe = vz0/D≈ 10−2, in contradiction with the initial assumption. Thisshows that once the acid solution is more than 1 µm away from the micropipette tip, its dynamics is dominated by diffusion.This in line with our previous experimental work (Fig. 6 of Ref. (6)) in which the injection of a fluorescent substance underidentical conditions led to the observation of a quasi-spherical fluorescent “cloud” characteristic of diffusion.
Thus, in order to calculate the pH profile in the fluid that surrounds the GUVs, we can consider that the acid solutionsimply diffuses from the micropipette tip. Given the cylindrical symmetry about the axis of the micropipette, we use polarcoordinates, with origin the projection of the micropipette tip on the membrane. The coordinates of the micropipette tip arethen (r = 0,z0). The concentration C of protons can be obtained by solving the (three-dimensional) diffusion equation
∂tC−D∇2C = Σ . (2)
where Σ is the source term arising from microinjection. For a constant injection flow from the point (r = 0,z0) starting at timet = 0, and stopping at time T , it reads at position (rr,z) and time t
Σ(rr,z, t) = Σ0 δ (r)δ (z− z0) 1[0,T ](t) , (3)
where 11[0,T ] is the indicator function of the interval [0,T ], while Σ0 is a constant, and rr denotes the in-plane radial vector oflength r. Here, we are interested in calculating the pH on the membrane during the injection phase, i.e., for t < T . However,solving the diffusion problem also gives the acid concentration profile after the injection, i.e., during the relaxation of themembrane deformation (see Ref. (6)).
Determination of Σ0. In a volume V which contains the micropipette tip, the amount of acid which appears in the fluid dueto injection during a short time interval dt reads
dt∫
VdrrdzΣ(rr,z, t) = Σ0 dt =
π
4Cintδ
2v0 dt . (4)
where Cint is the acid concentration inside the micropipette, i.e. 100 mM in our experiments. Consequently, we obtain
Σ0 =π
4Cintδ
2v0 . (5)

24 2 DIFFUSION OF THE ACID SOLUTION
Two simple geometries. It is possible to obtain analytical expressions of the proton concentration profile C(r,z, t) in twosimple geometries denoted by (a) and (b), and defined in Fig. S1.
(a) z0� R (b) z0� R
Figure S1: Two simple geometries. Red: micropipette, blue: membrane of the GUV. Denoting by R the radius of the GUV, andby z0 the height of the micropipette tip measured from the membrane, these geometries correspond to the asymptotic limitsz0� R and z0� R.
In geometry (a), i.e., for z0� R, we can consider that the acid diffuses freely in an infinite volume in order to calculate theproton concentration C. Conversely, in geometry (b), i.e., for z0� R, we can consider that the membrane imposes a Neumannboundary condition to C:
∂zC (r,z = 0, t) = 0 . (6)
This boundary condition, corresponding to complete reflection on the membrane, is fully valid in the stationary state, wherethe membrane is at chemical equilibrium with the surrounding solution, so that there are as many protons per time unit thatadsorb onto the membrane (by reacting with a lipid) as protons that desorb from the membrane. In the transient state atthe beginning of the injection, taking this boundary condition amounts to neglecting the excess protons that react with themembrane, which is legitimate given that the membrane is a surface and that the fraction of lipids that react with protons isassumed to remain small. As shown below, the acid concentration on the vesicle can be considered constant during most ofthe injection phase.
Resolution of the diffusion problem. The solution to the diffusion equation Eq. (2) can be written as:
C (r,z, t) =∫ t
0dt ′∫R2
dr′′∫ +∞
0dz′Σ
(r′,z′, t ′
)G(|rr− rr′|,z,z′, t− t ′
)= Σ0
∫ min(t,T )
0dt ′G
(r,z,z0, t− t ′
), (7)
where G is the causal Green function of the diffusion equation which verifies the appropriate boundary conditions.In geometry (a), it is simply the infinite-volume causal Green function of the diffusion equation:
G∞ (r,z,z0, t) =θ(t)
(4π Dt)3/2 exp(− r2 +(z− z0)
2
4Dt
), (8)
where θ is the Heaviside function.In geometry (b), the boundary condition Eq. (6) can be accounted for using the method of images (7), yielding:
G(r,z,z′, t
)= G∞
(r,z,z′, t
)+G∞
(r,z,−z′, t
). (9)
Using Eqs. (7), (8) and (9), it is possible to obtain explicit analytical expressions for C(r,z, t) in both geometries (6, 8).
Steady-state concentration on the GUV membrane. Here, we are interested in calculating the pH imposed on the GUVmembrane during the injection, which lasts T ≈ 30s in our experiments. Since the concentration of protons is determined bydiffusion of the acid solution from the micropipette tip, this concentration can be considered to have reached steady state at

25
the point of coordinates (r,z) if the time t from the beginning of the injection verifies t � (r2 +(z− z0)2)/D. For instance,
on the membrane in front of the micropipette, it corresponds to t� z20/D≈ 30ms, where we have used the above-mentioned
values for z0 and D. Since this threshold is much smaller than the total injection time T , the relevant value of the protonconcentration during the injection is that at steady-state.In the (a) geometry, the steady-state concentration at the membrane surface (i.e., at z = 0) reads
C(a) (r) =Σ0
4π D1√
r2 + z20
, (10)
and in the (b) geometry, it readsC(b) (r) = 2C(a) (r) . (11)
Note that the twofold difference between cases (a) and (b) directly arises from the method of images (7).
3 pH in front of the micropipette during the experiments
Using Eqs. (10) and (11) together with Eqs. (5) and (1), the acid concentration on the membrane during the experiments canbe estimated. We calculate it for the steady state of the injection phase (as explained above), and in front of the micropipette(in r = 0), because it is where the pH is lowest.
In our experiments, the distance between the micropipette tip and the membrane is z0 = 10 µm, and the radius R of theGUV is about 25 µm. Hence, the actual pH is expected to be comprised between those calculated for the limiting geometries(a) and (b). We carried out the calculations in both cases.
Besides, we took into account the uncertainty on the injection pressure (15-25 hPa), as well as on the effective value of `,(i.e. the 5-10 µm length over which the micropipette has its smallest diameter δ = 0.3 µm). Calculating the pH from Eqs. (10)and (11) for all these sets of values, yielded two pH extremes, namely 4.4 and 5.2. Hence, it can be concluded that during themicroinjection, the pH at the GUV membrane surface, in front of the micropipette, is
pH = 4.8±0.4 . (12)
Since this range of values is more that 2 units below the pKa of Hepes, the effect of the buffer can be neglected.

26 3 PH IN FRONT OF THE MICROPIPETTE DURING THE EXPERIMENTS
Additional experimental results
Figure S2: Local membrane invagination triggered on a GUV composed of PC/CL 90:10 mol/mol by a local pH decrease per-formed using a micropipette delivering an acidic solution (100 mM HCl, pH 1.6) in buffer A at pH 8. The acid microinjectionis started at t=0 and ended at t=31.8 s. The corresponding movie is movie S1.

27
Details of simulation results
Figure S3: A. Dynamics of the growth of tube length L derived from simulations and considering either only a direct equilib-rium density change of the outer monolayer (solid line), corresponding to CL-containing GUVs, or both a direct equilibriumdensity change and transbilayer sink/source flip flop (dashed line), corresponding to CL-containing GUVs. The two verticaldotted lines correspond respectively to the end of the constant local density increase of the outer monolayer (i.e. injectiontime) and the end of the relaxation of this density increase.B, C. Dynamics of the fractions of the total dissipated power Dtot arising from intermonolayer friction (Dbm , solid line)and monolayer viscosity dissipation (Dµ , dotted line) in the case of only a direct equilibrium density change of the outermonolayer (B), or of both a direct equilibrium density change and transbilayer sink/source flip flop (C).

28 3 PH IN FRONT OF THE MICROPIPETTE DURING THE EXPERIMENTS
Supporting References
1. Guyon, E., J.-P. Hulin, L. Petit, and C. D. Mitescu, 2001. Physical Hydrodynamics. Oxford University Press.2. Schnorf, M., I. Potrykus, and G. Neuhaus, 1994. Microinjection technique: routine system for characterization of microcapillaries by
bubble pressure measurement. Exp. Cell Res. 210:260–267.3. Cussler, E. L., 2009. Diffusion – Mass transfer in fluid systems. Cambridge University Press.4. Birkhoff, G., and E. H. Zarantonello, 1957. Jets, wakes and cavities. Academic Press.5. Lakshmi, S. V., 1966. Asymmetric creeping flow from an orifice in a plane wall. Appl. Sci. Rev 17:355–358.6. Bitbol, A.-F., N. Puff, Y. Sakuma, M. Imai, J.-B. Fournier, and M. I. Angelova, 2012. Lipid membrane deformation in response to a
local pH modification: theory and experiments. Soft Matter 8:6073–6082.7. Alastuey, A., M. Magro, and P. Pujol, 2008. Physique et outils mathematiques – methodes et exemples. EDP Sciences and CNRS
Editions.8. Bitbol, A.-F., and J.-B. Fournier, 2013. Membrane properties revealed by spatiotemporal response to a local inhomogeneity. Biochim.
Biophys. Acta – Biomembr. 1828:1241–1249.