interplay between musical practices and tuning in the
TRANSCRIPT

1
Interplay between musical practices and tuning in the marimba de chonta music
Jorge E. Useche1, Rafael G. Hurtado
1,* and Federico Demmer
2
Abstract
In the Pacific Coast of Colombia there is a type of marimba called marimba de chonta, which provides the melodic
and harmonic contour for traditional music with characteristic chants and dances. The tunings of this marimba are
based on the voice of female singers and allows musical practices, as a transposition that preserves relative distances
between bars. Here we show that traditional tunings are consistent with isotonic scales, and that they have changed in
the last three decades due to the influence of Western music. Specifically, low octaves have changed into just octaves.
Additionally, consonance properties of this instrument include the occurrence of a broad minimum of dissonance that
is used in the musical practices, while the narrow local peaks of dissonance are avoided. We found that the main
reason for this is the occurrence of uncertainties in the tunings with respect to the mathematical successions of isotonic
scales. We conclude that in this music the emergence of tunings and musical practices cannot be considered as
separate issues. Consonance, timbre, and musical practices are entangled.
Keywords: Consonance; Marimba; Marimba de chonta; Transposition; Tuning.
Introduction
In the Pacific Coast of Colombia and Ecuador there is a marimba with bars made of the timber from a palm
called Chonta (Bactris jauari), and tubular resonators made of a Bambuseae called Guadua (Guadua angustifolia).
This marimba is called marimba de chonta and provides the melodic and harmonic contour for a traditional music of
African descent. “The marimba music, traditional chants and dances from the Colombia South Pacific region and
Esmeraldas Province of Ecuador” were inscribed by UNESCO in the list of Intangible Cultural Heritage of Humanity
(Ministerio de Cultura de Colombia, 2010a, 2010b; Instituto Nacional de Patrimonio Cultural de Ecuador, 2014;
UNESCO, 2015).
Some instrument makers of the marimba de chonta use ancestral techniques for empirically tuning the
instrument, resulting in tunings that do not conform to Western musical scales (Ministerio de Cultura de Colombia,
2010a; Miñana 2010a, 2010b). These tunings and the musical practices associated with this marimba remain largely
unknown, and they are currently at risk of disappearing (Miñana, 2010b; Ministerio de Cultura de Colombia, 2010a).
In the Pacific coast of Colombia, the marimba de chonta with a traditional tuning is called “traditional marimba”.
Traditional marimbas are played by one or two musicians, each using two percussion mallets that, commonly,
simultaneously hit two different bars (Miñana, 2010; Duque, Sanchez & Tascón, 2009; Hernández, 2007; Ramón,
2001). There are reports of the existence of several tunings, each related to the voices of female singers from a
particular territory (Miñana, 2010a, 2010b; Duque, Sanchez & Tascón, 2009); these alternate tunings do not,
necessarily, follow a specific mathematical progression conserving musical intervals. The harmonic structure of this
music can be summarized in geometrical schemes that contain rules to play two bars simultaneously (harmonic
interval) over a base that usually contains seven pitches repeated periodically— in a similar way to the octaves in a
diatonic scale. In the case of seven pitches, there are two possible ways for grouping them: by discarding one bar,
leading to a hexatonic scale; or discarding two bars, producing a pentatonic scale (Duque, Sanchez & Tascón, 2009;
Miñana, 2010a, 2010b). Figure 1 shows the hexatonic and pentatonic scales: white bars are the discarded ones, and
bars identified with grey or black colors can be played simultaneously when they have the same color. The largest
harmonic interval used has six bars between the two sounded bars (Duque, Sanchez & Tascón, 2009). The schemes
shown in Figure 1 can start at any bar, depending on the preference of the female singer, generating a transposition
principle that keeps the same relative geometrical distances without conserving the same musical intervals (Duque,
Sanchez & Tascón, 2009; Tascón, 2008; Miñana, 2010a, 2010b). The melodic motion in this music uses neighboring
bars, usually adjacent ones (Miñana, 2010a), generating soft melodic contours (Patel, 2008).
1 Department of Physics, Universidad Nacional de Colombia. 2 Conservatory of Music, Universidad Nacional de Colombia. * Corresponding author. Electronic Mail: [email protected]

2
Figure 1. Hexatonic (up) and Pentatonic (down) scales generated by an equi-heptatonic traditional marimba. Large bars and small
bars indicate two different groups of seven bars. White bars are not used in each scale. Grey and black bars constitute two
different harmonic families.
One of the most accepted approaches to the understanding of musical tunings and scales is based on the
concept of consonance. For several musical tunings the set of sounds is chosen in such a way as to yield a large
number of consonant combinations when two or more elements are sounded together, as, for example, in the just scale
(Roederer, 2009). The perception of consonance has been formally related with the sensation of pleasantness (Plomp
& Levelt, 1965). Pythagoras posted the existence of this phenomenon when he found that two sounds emitted
simultaneously by vibrating strings of equal tension and density produce a pleasant sensation when the ratio between
their lengths is the same as the ratio between two small natural numbers. His postulate has been fundamental for
parameterizing musical features using physical quantities and for constructing many musical scales, as the just scale
(Rossing, 1990; Roederer, 2009).
Hermann von Helmholtz found that the degree of consonance of pairs of pure tones is related to the beats or
shocks produced by fluctuations in the peak intensity occurring at the frequency difference of the pure tunes
(Helmholtz, 1954). Then, Reinier Plomp and Willem Levelt (1965) reported that the transition range between
consonance and dissonance is related with a critical bandwidth that depends on the frequency difference of the
corresponding pure tones. This approach to consonance is known as tonal or sensory because it is based on the
physical properties of the stimulus, independent of cultural conventions (Schellenberg & Trainor, 1996).
William Sethares (1993) proposed a mathematical function to describe the empirical results obtained by
Plomp and Levelt, and used the frequency spectrum for assigning a level of dissonance (instead of consonance) to the
timbre of a musical instrument. Sethares posted that the best acoustical tuning of a musical instrument must be
inferred from the local minima of dissonance (Sethares, 1993, 1998, 2005). However, in some cases there are musical
practices incompatible with tunings constructed in this way. An example is the just tuning resulting from the harmonic
timbre of instruments as those made of strings and pipes (Sethares, 1993); this tuning does not divide the octave in
equal semitones to produce an equivalent system in all keys (Apel, 1974). The Twelve Tone Equal-Tempered (TTET)
scale solves this problem by shifting the frequency ratios of the Pythagoras rule scarifying the high levels of
consonance of the just tuning (Apel, 1974).
In this manuscript, in order to study the interplay between consonance, tuning, and musical practices, the
Methods section presents the theoretical and experimental procedures to investigate the consonance properties of the
marimba de chonta and the use of harmonic intervals in its music. The Results and Discussion section contains the
musical practices, the tunings of TTET and traditional marimbas de chonta, the consonance properties associated with
the timbre of the musical instrument, and the connection between tuning and musical practices. Conclusions are
presented in the final section.

3
Methods
This section contains the theoretical and experimental procedures used to produce the dissonance level curves
for the marimba de chonta, make the statistical analysis for the musical pieces, and compare the results obtained in
this study with those from a previous one.
Theoretical
Dissonance level of individual complex tones. For the superposition of two pure tones of frequencies and
, with amplitudes and , respectively, Sethares proposed a first model to measure the level of dissonance by
parameterizing the Plomp and Levelt empirical results using a mathematical function given by (Sethares, 1993, 1998)
where , , , , , ,
and .
Vassilakis modified this model by including the dependence of roughness on intensity, amplitude fluctuation
degree, and amplitude fluctuation rate (Vassilakis, 2001; Vassilakis & Kendall, 2010)
(2)
Sethares proposed a new model taking into account that the amplitude of the beating is given by the minimum
of the two amplitudes, and that the loudness of the roughness is proportional to the loudness of the beating (Sethares,
2005)
(3)
where refers to the minimum loudness between the loudnesses produced by the two pure tones with frequencies
and . The loudness can be measured using different models, and is mainly determined by the amplitude. A
simple model to approximate loudness is given by the Stevens law (Marks & Florentine, 2010): for a sinusoidal wave
of amplitude , the loudness (in sones) is approximately (Sethares, 2005)
; ; ; , (4)
where is the sound pressure level and is the standard reference for the in the air. This model does not
include effects such as the Fletcher-Munson curves (Sethares, 2005), and the relation between loudness and amplitude
is independent of the frequency: ( constant) (Lawrence & Florentine, 2010). With this approximation
is found to be proportional to the minimum value between and
. In a normalized scale, the loudness
can be measured using the normalized amplitude , leading to .
For a complex tone with partials, the total dissonance can be calculated by superposing the individual
dissonances for each possible pair of partials, it is
(5)
with for the first model of Sethares (1998) and for the Vassilakis model, and for the second model of
Sethares (2005).
Dissonance level of pairs of complex tones with the same timbre. If we superpose two different complex
tones with the same timbre and with a ratio between their fundamental frequencies of , with , then
the total dissonance of this superposition is given by (Sethares, 1993, 1998)
(1)

4
, (6)
where and correspond to the total dissonance associated with the timbre of each individual complex tone, and
the last term is due to the total dissonance generated by the interaction between the partials of the two complex tones.
Here the amplitudes and the relative distances between the partials in the spectrum are the same, independent of the
fundamental frequency, and this equation can be used to identify the local minima of dissonance by scanning all
possible values of for the pair of fundamental frequencies and . Usually the lowest fundamental frequency is
taken as fixed, and the highest one varies—changing the values of .
In the case of equal amplitudes and for a normalized scale of dissonance, the first Sethares model and the
Vassilakis model give the same results; additionally, if the Stevens law is used in the second Sethares model, then the
three models are equivalent.
Determination of the fundamental frequency for the Miñana study. In order to compare the results from
this study with those from a previous one carried out in 1990 by Carlos Miñana (2010a), including 9 traditional
marimbas made between 1950 and 1986, the fundamental frequency of each bar was obtained for all the marimbas.
Miñana produced a score with the approximate pitches associated with each marimba bar, including their
corresponding increment or decrement in cents with respect to the TTET scale with . The approximate
fundamental frequencies ( ) produced by these marimbas were found from the fundamental frequencies in the
TTET scale ( , and using the relation between the number of cents and the corresponding frequency ratio :
, where refers to a cent ( ) (Roederer, 2009). Supplement 1 contains the score
as presented by Miñana (2010a).
Experimental
In order to obtain evidence about the musical practices related to the traditional marimba, as well as about the
tunings produced by instrument makers, an expedition to the heart of the marimba de chonta territories was carried out
in 2015. The expedition was composed by musicians and researchers from the Conservatory of Music, the Department
of Physics, and the School of Cinema and Media Arts of Universidad Nacional de Colombia. During the expedition
the researchers interviewed instrument makers, female singers, and marimba de chonta interpreters, as well as music
teachers from local schools. Additionally, the team attended several presentations by local musical groups.
Selection of the marimbas. This study includes ten traditional marimbas, each one constructed by a different
recognized instrument maker, and one diatonic marimba de chonta tuned in the TTET. Table 1 shows the instrument
makers and the main features of the selected marimbas. Marimbas 1, 2, 3, 4, 6, 9, and 11 were made between 2014 and
2015. The remaining ones are undated and presumably old instruments; however, these marimbas are currently in use,
and a common practice is to repair these instruments due to their natural fragility and the harsh conditions of use.
Marimba number Maker Place Bars Kind
1 Baudilio Cuama Buenaventura 22 Tempered
2 Baudilio Cuama Buenaventura 16 Traditional
3 Jhon Jairo Cortés Tumaco 24 Traditional
4 Francisco Tenorio Tumaco 24 Traditional
5 Juan E. Sinisterra Tumaco 18 Traditional
6 Silvino Mina Guapi 20 Traditional
7 Dioselino Rodríguez Guapi 17 Traditional
8 Guillermo Ríos Guapi 17 Traditional
9 Genaro Torres Guapi 21 Traditional
10 José Torres Guapi 20 Traditional
11 Francisco Torres Guapi 24 Traditional
Table 1. Description of each marimba recorded for this study, including identification number, instrument maker, place, total
number of bars, and tuning.
5
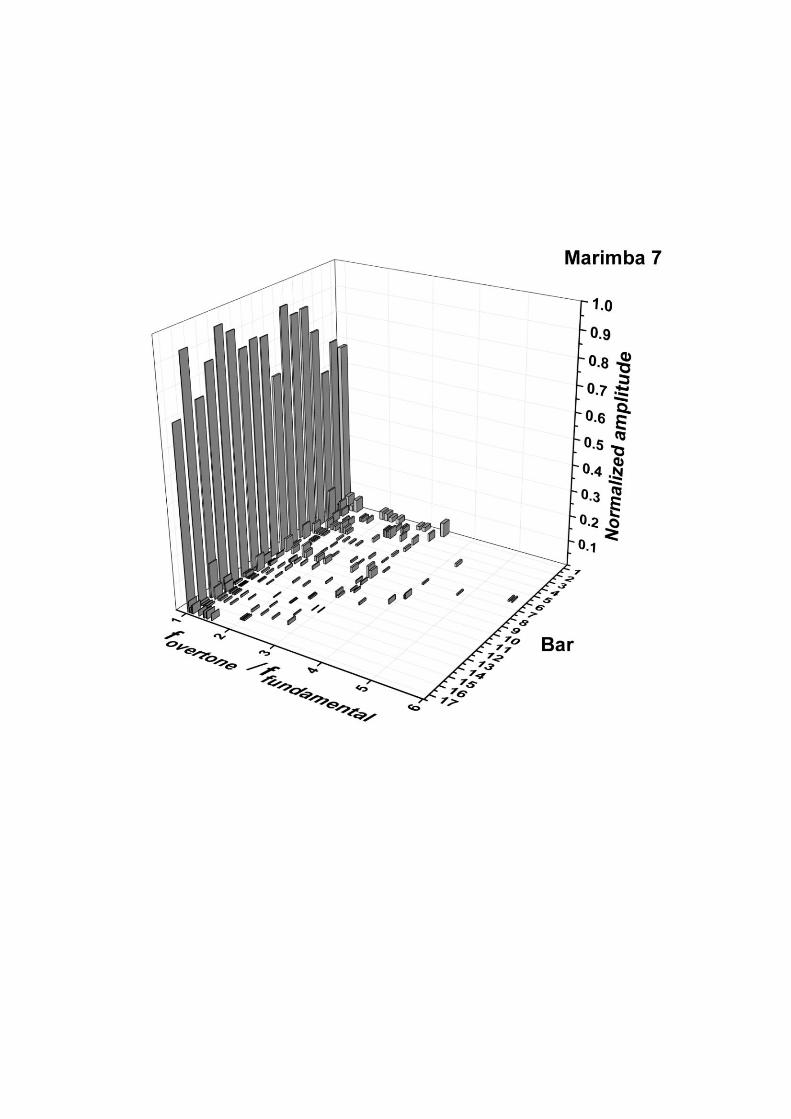
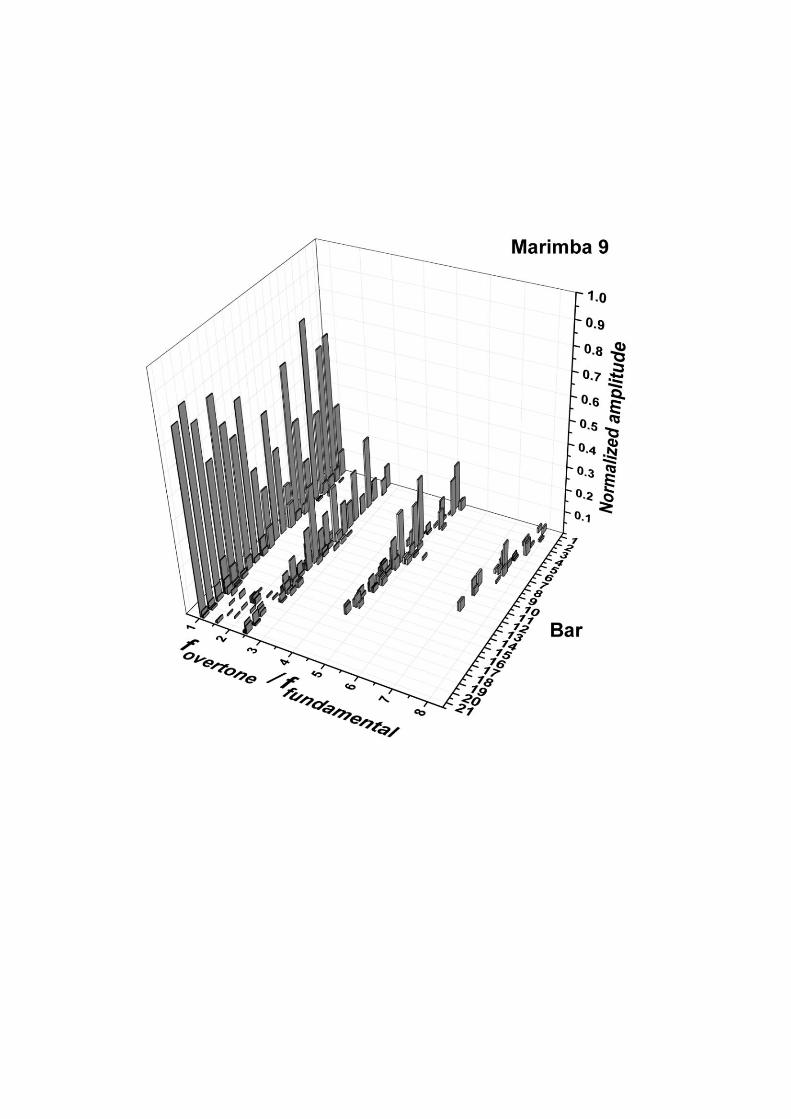
Procedure for the analysis of pitch and timbre. For all marimbas the sound of each bar with its respective
resonator were recorded; in all cases the bars were struck in the geometrical center in agreement with the common
style of traditional musicians. The spectrum was obtained for samples covering the sound between the attack and the
final release. The Fast Fourier Transform over a Hanning window was used for finding the frequencies and amplitudes
of the spectrum of each bar. Then, the peaks corresponding to the fundamental and the first ten overtones with the
largest amplitudes were identified.
For almost every bar, the fundamental frequency corresponds to the peak with the largest amplitude; however,
for the traditional marimbas of the Torres family (numbers 9, 10, and 11), some bars have overtones with larger
amplitudes than that of the fundamental. In the sample of 223 bars, the fundamental frequency was not clearly
identified for only four bars (marked with “*” in Supplement 2); these values were not used in the analysis. For all
bars of each marimba the amplitudes were normalized for the analysis.
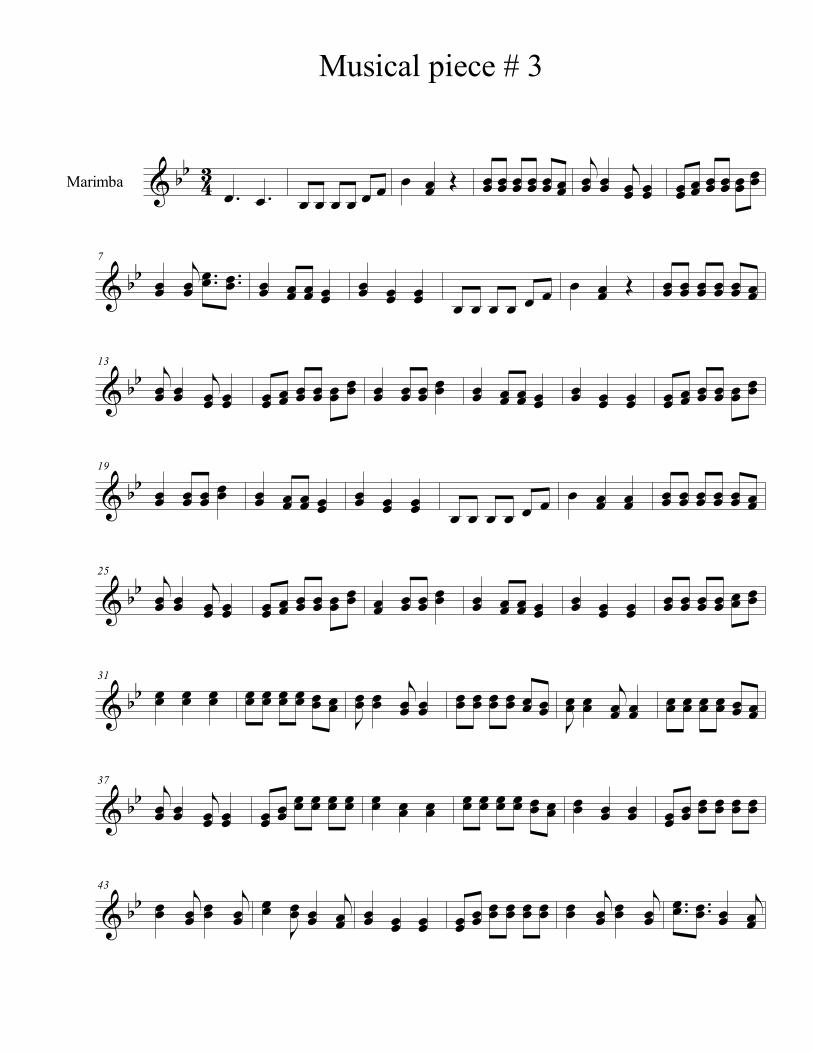
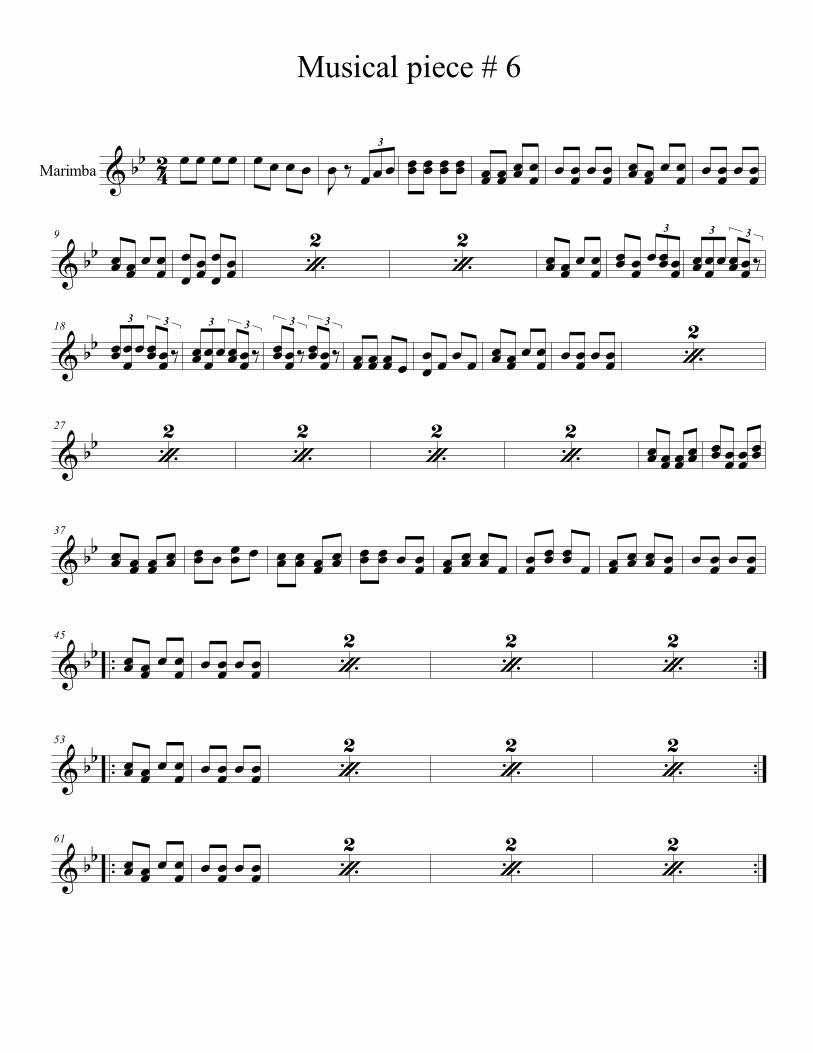
Procedure for the analysis of musical pieces. Seven musical pieces played by recognized traditional
marimba musicians were recorded, with one musician and two mallets for each marimba (a maximum of two pitches
can be sounded simultaneously in each musical piece). Musical scores with the closest transcriptions to the TTET
scale with were generated. Traditional tunings do not follow a TTET system; however, this procedure
allows the identification of the approximate size of harmonic intervals in order to measure their frequency of
occurrence. The musical scores are provided in Supplement 3.
In order to infer the most frequent harmonic intervals in traditional music, the musical scores were used to
measure the probability of occurrence of each interval size. In order to distinguish between brief and lengthy intervals,
a second analysis was carried out taking into account the time duration of each kind of interval, according to its size.
The probability of occurrence was defined as proportional to the sum of the duration of each interval of a given size.
For different intervals with size and occurrences for each size the probability of a specific interval size is
, where
is the sum of the durations of all intervals with size and total time
. If all intervals have the same duration in a musical score, then the probability is equal to
the probability of occurrence.
Results and Discussion
Tunings
The fundamental frequency of each marimba bar coupled to its respective resonator was obtained (Supplement
2). The TTET marimba was found to be tuned in a major diatonic tempered scale over with the traditional reference
(Supplement 2).
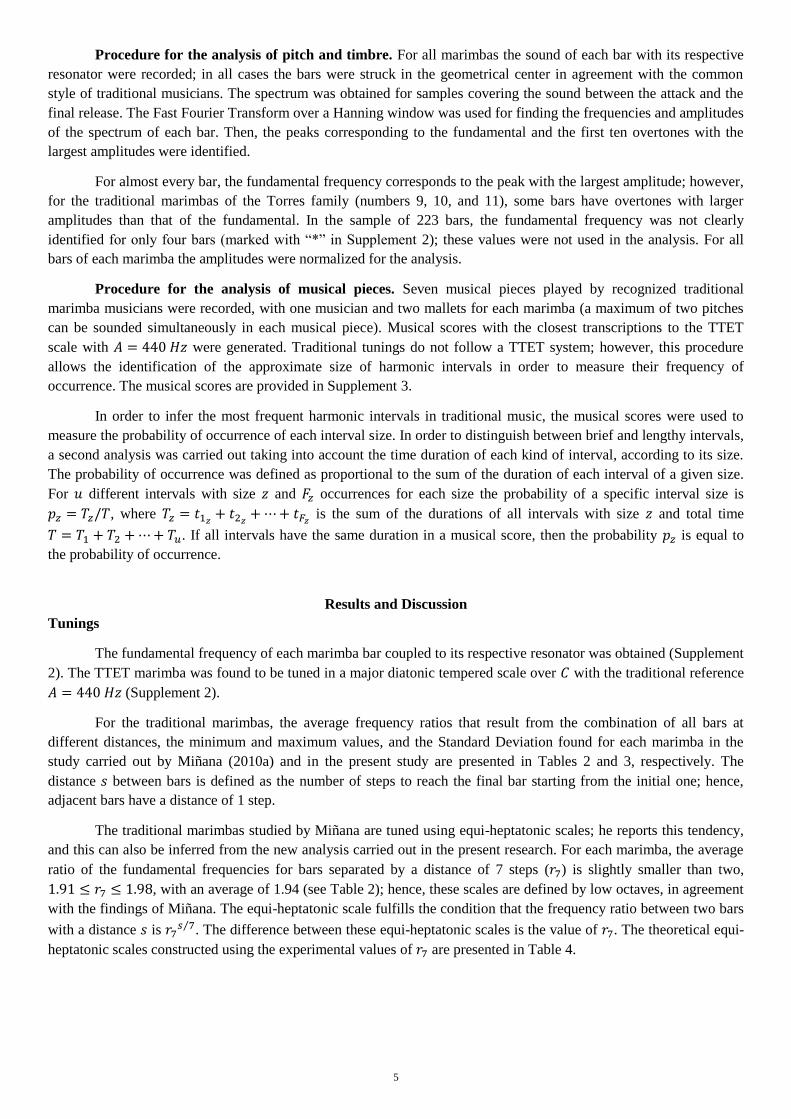
For the traditional marimbas, the average frequency ratios that result from the combination of all bars at
different distances, the minimum and maximum values, and the Standard Deviation found for each marimba in the
study carried out by Miñana (2010a) and in the present study are presented in Tables 2 and 3, respectively. The
distance between bars is defined as the number of steps to reach the final bar starting from the initial one; hence,
adjacent bars have a distance of 1 step.
The traditional marimbas studied by Miñana are tuned using equi-heptatonic scales; he reports this tendency,
and this can also be inferred from the new analysis carried out in the present research. For each marimba, the average
ratio of the fundamental frequencies for bars separated by a distance of 7 steps ( ) is slightly smaller than two,
, with an average of 1.94 (see Table 2); hence, these scales are defined by low octaves, in agreement
with the findings of Miñana. The equi-heptatonic scale fulfills the condition that the frequency ratio between two bars
with a distance is . The difference between these equi-heptatonic scales is the value of . The theoretical equi-
heptatonic scales constructed using the experimental values of are presented in Table 4.

6
Distance Marimba number
(steps) 1 2 3 4 5 6 7 8 9 Avg.*
1
Min 1.04 1.06 1.08 1.08 1.07 1.04 1.07 1.06 1.05 1.06
Max 1.16 1.16 1.14 1.12 1.13 1.12 1.15 1.15 1.17 1.14
Avg. 1.11 1.10 1.10 1.10 1.10 1.09 1.10 1.10 1.09 1.10
σ 0.03 0.03 0.01 0.01 0.01 0.03 0.02 0.02 0.03 0.02
2
Min 1.18 1.19 1.18 1.19 1.14 1.11 1.16 1.15 1.11 1.16
Max 1.30 1.27 1.23 1.23 1.24 1.25 1.25 1.26 1.26 1.26
Avg. 1.22 1.22 1.21 1.21 1.20 1.19 1.21 1.20 1.20 1.21
σ 0.03 0.03 0.02 0.01 0.03 0.04 0.02 0.03 0.03 0.03
3
Min 1.32 1.27 1.29 1.30 1.24 1.18 1.29 1.26 1.22 1.26
Max 1.42 1.41 1.35 1.36 1.36 1.40 1.38 1.37 1.41 1.38
Avg. 1.35 1.34 1.33 1.33 1.32 1.31 1.34 1.32 1.31 1.33
σ 0.03 0.04 0.02 0.01 0.03 0.05 0.03 0.03 0.05 0.03
4
Min 1.41 1.46 1.42 1.43 1.36 1.31 1.41 1.37 1.32 1.39
Max 1.60 1.52 1.51 1.50 1.48 1.52 1.52 1.53 1.56 1.53
Avg. 1.48 1.48 1.46 1.46 1.46 1.44 1.47 1.46 1.44 1.46
σ 0.05 0.02 0.02 0.02 0.03 0.05 0.03 0.04 0.06 0.04
5
Min 1.57 1.57 1.56 1.58 1.53 1.47 1.55 1.53 1.46 1.54
Max 1.71 1.68 1.64 1.64 1.63 1.66 1.68 1.70 1.68 1.67
Avg. 1.63 1.63 1.60 1.61 1.60 1.58 1.62 1.60 1.59 1.61
σ 0.04 0.04 0.03 0.02 0.03 0.05 0.04 0.05 0.07 0.04
6
Min 1.74 1.75 1.72 1.73 1.68 1.64 1.72 1.66 1.61 1.69
Max 1.91 1.87 1.79 1.79 1.80 1.84 1.86 1.84 1.86 1.84
Avg. 1.80 1.80 1.76 1.76 1.76 1.74 1.78 1.75 1.74 1.77
σ 0.05 0.04 0.02 0.02 0.03 0.06 0.04 0.05 0.08 0.04
7
Min 1.89 1.91 1.90 1.90 1.83 1.78 1.87 1.86 1.75 1.85
Max 2.13 2.05 1.97 1.97 1.99 2.01 2.04 1.99 2.05 2.02
Avg. 1.98 1.98 1.93 1.94 1.93 1.91 1.97 1.92 1.92 1.94
σ 0.07 0.05 0.02 0.02 0.04 0.07 0.05 0.04 0.09 0.05
Table 2. Minimum, maximum, average, and Standard Deviation of the frequency ratio for pairs of bars separated by different
distances in the traditional marimbas recorded by Miñana (2010). The numeration for the marimbas presented by Miñana (2010)
is conserved. The symbol “σ” refers to the Standard Deviation. Avg. refers to the average. The average with the symbol “*” refers
to the average of the minimum, the maximum, the average, and σ values for all marimbas.
The traditional marimbas recorded for the present study have three different behaviors (Table 3): 7 marimbas
numbered from 2 up to 8 were found to be equi-heptatonic, with and average of 2.00; marimbas 9
and 10 follow an equi-octatonic scale ( and ); and the marimba number 11 follows an equi-
enneatonic scale with . For this case, , and refer to the average ratios of the fundamental frequencies
for bars separated by a distance of 7, 8 and 9 steps, respectively. The theoretical equi-heptatonic, equi-octatonic and
equi-enneatonic scales constructed using , and are presented in Table 5.
For all the traditional marimbas studied the predicted values presented in Tables 4, 5 have less than 1.00 %
relative error with respect to the empirical values shown in Tables 2, 3.
7
Distance Marimba number
(steps) 2 3 4 5 6 7 8 Avg.*1 9 10 Avg.*2 11
1
Min 1.08 1.06 1.05 1.07 1.02 1.07 1.06 1.06 1.05 0.99 1.02 1.04
Max 1.15 1.17 1.15 1.14 1.15 1.14 1.15 1.15 1.16 1.15 1.16 1.15
Avg. 1.11 1.10 1.10 1.11 1.10 1.10 1.11 1.10 1.09 1.09 1.09 1.08
σ 0.02 0.03 0.02 0.02 0.03 0.02 0.02 0.02 0.03 0.04 0.04 0.03
2
Min 1.19 1.16 1.15 1.19 1.16 1.19 1.15 1.17 1.15 1.15 1.15 1.09
Max 1.28 1.27 1.29 1.28 1.26 1.27 1.26 1.27 1.24 1.27 1.26 1.23
Avg. 1.22 1.22 1.22 1.23 1.21 1.21 1.22 1.22 1.20 1.20 1.20 1.17
σ 0.03 0.03 0.04 0.02 0.03 0.02 0.03 0.03 0.02 0.03 0.03 0.04
3
Min 1.31 1.28 1.28 1.31 1.29 1.28 1.24 1.28 1.25 1.20 1.23 1.17
Max 1.39 1.40 1.40 1.38 1.43 1.39 1.41 1.40 1.40 1.41 1.41 1.32
Avg. 1.35 1.35 1.34 1.35 1.33 1.34 1.34 1.34 1.31 1.31 1.31 1.26
σ 0.02 0.03 0.03 0.02 0.03 0.03 0.05 0.03 0.04 0.05 0.05 0.05
4
Min 1.45 1.41 1.42 1.45 1.42 1.42 1.37 1.42 1.38 1.38 1.38 1.26
Max 1.53 1.54 1.53 1.55 1.52 1.52 1.55 1.53 1.48 1.53 1.51 1.41
Avg. 1.49 1.48 1.49 1.50 1.47 1.47 1.48 1.48 1.43 1.44 1.44 1.36
σ 0.03 0.03 0.04 0.03 0.03 0.03 0.06 0.03 0.04 0.04 0.04 0.03
5
Min 1.57 1.56 1.56 1.61 1.55 1.57 1.51 1.56 1.50 1.48 1.49 1.40
Max 1.70 1.73 1.76 1.72 1.69 1.68 1.72 1.71 1.66 1.70 1.68 1.54
Avg. 1.64 1.64 1.65 1.66 1.62 1.62 1.64 1.64 1.56 1.58 1.57 1.46
σ 0.04 0.04 0.05 0.04 0.05 0.04 0.06 0.04 0.04 0.06 0.05 0.04
6
Min 1.76 1.73 1.74 1.78 1.70 1.73 1.71 1.74 1.64 1.64 1.64 1.51
Max 1.87 1.89 1.93 1.87 1.91 1.90 1.89 1.89 1.77 1.82 1.80 1.69
Avg. 1.82 1.81 1.82 1.84 1.78 1.79 1.81 1.81 1.71 1.73 1.72 1.59
σ 0.04 0.04 0.05 0.02 0.05 0.04 0.06 0.04 0.05 0.05 0.05 0.06
7
Min 1.98 1.92 1.95 1.98 1.92 1.88 1.89 1.93 1.80 1.77 1.79 1.58
Max 2.04 2.08 2.10 2.07 2.05 2.03 2.08 2.06 1.96 2.02 1.99 1.78
Avg. 2.01 2.00 2.00 2.03 1.96 1.97 2.01 2.00 1.87 1.90 1.89 1.71
σ 0.02 0.04 0.05 0.03 0.04 0.05 0.06 0.04 0.05 0.08 0.06 0.06
8
Min --- --- --- --- --- --- --- --- 1.98 1.98 1.98 1.70
Max --- --- --- --- --- --- --- --- 2.14 2.17 2.16 1.95
Avg. --- --- --- --- --- --- --- --- 2.04 2.08 2.06 1.85
σ --- --- --- --- --- --- --- --- 0.06 0.07 0.06 0.06
9
Min --- --- --- --- --- --- --- --- --- --- --- 1.91
Max --- --- --- --- --- --- --- --- --- --- --- 2.10
Avg. --- --- --- --- --- --- --- --- --- --- --- 1.99
σ --- --- --- --- --- --- --- --- --- --- --- 0.06
Table 3. Minimum, maximum, average, and Standard Deviation of the frequency ratio for pairs of bars separated by different
distances in the traditional marimbas recorded for this study. The symbol “σ” refers to the Standard Deviation. “Avg." refers to the
average. “Avg.*1” refers to the average of the minimum, the maximum, the average, and σ values for marimbas 2, 3, 4, 5, 6, 7, and
8. “Avg.*2” refers to the average of the minimum, the maximum, the average, and σ values for marimbas 9, and 10.

8
Distance Marimba number
(steps) 1 2 3 4 5 6 7 8 9 Avg.*
1 1.10 1.10 1.10 1.10 1.10 1.10 1.10 1.10 1.10 1.10 2 1.22 1.22 1.21 1.21 1.21 1.20 1.21 1.20 1.20 1.21
3 1.34 1.34 1.33 1.33 1.33 1.32 1.34 1.32 1.32 1.33
4 1.48 1.48 1.46 1.46 1.46 1.45 1.47 1.45 1.45 1.46
5 1.63 1.63 1.60 1.61 1.60 1.59 1.62 1.59 1.59 1.61
6 1.80 1.80 1.76 1.76 1.76 1.74 1.79 1.75 1.75 1.76
7 1.98 1.98 1.93 1.94 1.93 1.91 1.97 1.92 1.92 1.94
Table 4. Theoretical equi-heptatonic scales for the traditional marimbas recorded by Miñana (2010). “Avg.*” refers to the
theoretical scale constructed for the average of the average value for all traditional marimbas. In all cases, the values predicted by
the theoretical scales have a relative error with respect to the experimental values presented in Table 2.
Distance Marimba number (present study)
(steps) 2 3 4 5 6 7 8 Avg.*1 9 10 Avg.*2 11
1 1.10 1.10 1.10 1.11 1.10 1.10 1.10 1.10 1.09 1.10 1.09 1.08 2 1.22 1.22 1.22 1.22 1.21 1.21 1.22 1.22 1.20 1.20 1.20 1.17
3 1.35 1.35 1.35 1.35 1.33 1.34 1.35 1.35 1.31 1.32 1.31 1.26 4 1.49 1.49 1.49 1.50 1.47 1.47 1.49 1.49 1.43 1.44 1.44 1.36
5 1.65 1.64 1.64 1.66 1.62 1.62 1.65 1.64 1.56 1.58 1.57 1.47
6 1.82 1.81 1.81 1.83 1.78 1.79 1.82 1.81 1.71 1.73 1.72 1.58 7 2.01 2.00 2.00 2.03 1.96 1.97 2.01 2.00 1.87 1.90 1.88 1.71
8 --- --- --- --- --- --- --- --- 2.04 2.08 2.06 1.84 9 --- --- --- --- --- --- --- --- --- --- --- 1.99
Table 5. Theoretical equi-heptatonic, equi-octatonic, and equi-enneatonic scales for the traditional marimbas recorded for this
study. “Avg.*1” refers to the theoretical scale constructed for the average of the average values over the marimbas 2,3,4,5,6,7 and
8. “Avg.*2” refers to the theoretical scale constructed for the average of the averages values of the marimbas 9 and 10. In all cases,
the values predicted by the theoretical scales have a relative error with respect to the experimental values presented in
Table 3.
The three traditional marimbas with equi-octatonic and equi-enneatonic scales were made by three members
of the Torres family, two of these makers also made three of the marimbas studied by Miñana (marimbas 1, 2, 5 in
Table 2) that were found to be equi-heptatonic. In all cases, the standard deviation of the frequency ratios for all the
possible combinations of each distance between bars is smaller than 5.00 %, with respect to the average value (Tables
2, 3). This is presumably due to variations in the voice preferences of female singers in a region or territory. Since in
each territory there are several singers that are accompanied by musicians playing the same traditional marimba, it is
impossible to define only one fundamental frequency as a reference to construct the scale. Hence, the marimbas are
constructed by adjusting the tuning as close as possible to the different vocal preferences (Duque, Sanchez & Tascón,
2009), but approximately preserving an isotonic tuning in order to keep the geometrical distances in a transposition
process.
The results of this section show that traditional tunings have changed with time in the last three decades,
losing the low octaves feature in favor of octaves usually closer to the just interval. This change may be the result of
the influence of Western music, which is characterized by the just octave. It has been argued that the globalization of
Western music, and the commercial value of new genres that combine local rhythms and timbres, have led to a broad
use of TTET marimbas de chonta, modifying the taste of African descendants in the Pacific Coast of Colombia
(Hernández, 2007). Frequently the traditional marimbas are referred to as “badly made marimbas” or “wrongly tuned
marimbas”. The most important cultural event of music from this region, the Petronio Alvarez Festival (Hernández,
2007), promoted the use of TTET marimbas for several years. It was not until 2015 that the festival opened a category
for music played with traditional marimbas. It is a common practice of the Ministry of Culture of Colombia to supply
the music schools with TTET marimbas, where music is taught using the logics of diatonic and chromatic scales with
tones and semitones.

9
Finally, these results also show the use of equi-octatonic and equi-enneatonic scales, and that the equal
distances feature of the scales has been preserved.
Use of harmonic intervals in the musical practices
According to Miñana (2010a), neutral thirds are among the most used harmonic intervals in this traditional
music. Frequency ratios covering the region of the thirds are commonly generated using distances of 2 and 3 steps
between bars (see Tables 2, 3). In order to check the frequency of use of intervals, their probability of occurrence was
obtained for seven performances of traditional marimba pieces by applying the procedure described in the Methods
section. If one of the most used intervals is the neutral third, then minor and major thirds are expected to occur with
high probability in the scores.
Table 6 shows the probability of occurrence of each harmonic interval, and the probability of occurrence
proportional to the total time of duration. Intervals between 3 and 4 semitones are present with high probability in all
pieces. Intervals containing sizes between the fourths and fifths, in most cases generated by pairs of bars separated by
a distance of 3 and 4 steps, are also frequent in some pieces; and those intervals near to the sixths, in most cases
generated by 5 steps, appear less frequently in performances. The region of the seconds, generated by a distance of 1
step, is completely avoided in all musical pieces, and intervals larger than one octave are almost absent. The region of
the sevenths, in most cases generated by a distance of 6 steps, is avoided in all pieces with the exception of one, where
it has a small incidence, and the region of the octaves is used with small probability of occurrence.
The geometrical schemes shown in Figure 1 can be applied for the traditional marimbas with equi-heptatonic
scales, the most common scales found in the present study, and in the studies of Miñana. From these schemes it is
possible to infer that the harmonic intervals with distances of 1 and 6 steps between bars are the least frequent. Figure
2 shows the relation between the total number of different combinations of bars and the distance between them for
marimbas with different sizes, for the cases of the hexatonic and the pentatonic scales. Supplement 4 contains the
exact number of combinations for each scale and marimba size. Notice that adjacent bars and pairs of bars separated
by 6 steps are highly uncommon, this is due to the harmony rules of the geometrical schemes and incidence of the
discarded bars, the so called “bad bars”.
Interval
Probability
Frequency of occurrence Total duration
(semitones) Musical piece Musical piece
1 2 3 4 5 6 7 Avg. 1 2 3 4 5 6 7 Avg.
1 0.00 0.00 0.00 0.00 0.00 0.00 0.00 0.00 0.00 0.00 0.00 0.00 0.00 0.00 0.00 0.00
2 0.00 0.00 0.00 0.00 0.00 0.00 0.00 0.00 0.00 0.00 0.00 0.00 0.00 0.00 0.00 0.00
3 0.24 0.59 0.53 0.13 0.55 0.23 0.55 0.40 0.19 0.60 0.52 0.13 0.56 0.23 0.54 0.39
4 0.08 0.41 0.47 0.12 0.44 0.26 0.37 0.31 0.08 0.40 0.48 0.12 0.43 0.26 0.35 0.30
5 0.23 0.00 0.00 0.30 0.00 0.34 0.07 0.13 0.26 0.00 0.00 0.33 0.00 0.34 0.07 0.14
6 0.00 0.00 0.00 0.01 0.00 0.00 0.02 0.00 0.00 0.00 0.00 0.01 0.00 0.00 0.03 0.01
7 0.07 0.00 0.00 0.17 0.01 0.15 0.00 0.06 0.05 0.00 0.00 0.20 0.00 0.15 0.00 0.06
8 0.21 0.00 0.00 0.03 0.00 0.00 0.00 0.03 0.17 0.00 0.00 0.02 0.00 0.00 0.00 0.03
9 0.13 0.00 0.00 0.02 0.00 0.00 0.00 0.02 0.20 0.00 0.00 0.02 0.00 0.00 0.00 0.03
10 0.00 0.00 0.00 0.15 0.00 0.00 0.00 0.02 0.01 0.00 0.00 0.12 0.00 0.00 0.00 0.02
11 0.00 0.00 0.00 0.00 0.00 0.00 0.00 0.00 0.00 0.00 0.00 0.00 0.00 0.00 0.00 0.00
12 0.05 0.00 0.00 0.07 0.00 0.02 0.00 0.02 0.04 0.00 0.00 0.06 0.00 0.02 0.00 0.02
>12 0.00 0.00 0.00 0.01 0.00 0.00 0.00 0.00 0.00 0.00 0.00 0.01 0.00 0.00 0.00 0.00
Table 6. Probability of occurrence of harmonic intervals as a function of their size in semitones. Avg. refers to the average of the
seven musical pieces. The probability has been taken to be proportional to the frequency of occurrence and to the total time of
duration of each size of harmonic interval.

10
Results of the analysis of the frequency ratios of the traditional marimbas with equi-heptatonic scales are
presented in Tables 2 and 3. These regions correspond to intervals around the seconds (frequency ratios between or
near to the range ) and the sevenths (frequency ratios between or near to the range ).
For the same distance between bars, the marimbas of the Torres family analyzed in the present study have
lower values in the tunings in comparison with the other ones (see Table 3), this feature is more evident for larger
distances than for smaller ones (a natural consequence of the presence of equi-octatonic and equi-enneatonic scales).
For marimbas 9 and 10 (see Table 3), intervals near to the sevenths and the octaves are better generated using 7 and 8
steps, respectively. For marimba 11 (see Table 3), the same intervals are better generated using 8 and 9 steps,
respectively.
Figure 2. Relation between the total number of different combinations of bars and the distance between them, for marimbas of
different sizes (from 14 up to 24 bars). The height of each sequence is proportional to the total number of different combinations
of pairs of bars. Grey regions show the regions with the lowest number of combinations, which correspond to 1 and 6 steps
distances. a) Hexatonic scale. b) Pentatonic scale. In all cases the total number of combinations has been counted beginning with
the first bars shown in Figure 1 for the hexatonic and the pentatonic scales.
Finally, from the statistical analysis as well as from the analysis of the geometrical schemes, it is possible to
infer that regions around the seconds and the sevenths seem to be deliberately avoided in this music. Since octaves
present a small probability of occurrence in the statistical analysis (in average over all the musical pieces, octaves are
2% of all intervals), we infer that the most used region of the traditional marimba music is between the thirds and the
sixths (Table 6). In the equi-heptatonic traditional marimbas of this study, and from the study by Miñana, this region is
generated using bars separated between 2 and 5 steps; from the average values of the minima and maxima of both
studies, this region is approximately between (Tables 2, 3).
Theoretical dissonance level curves
In this subsection the theoretical dissonance curves associated with the sound emitters of the marimba de
chonta are presented.
Isolated bars. In the tuning process, some makers construct the bars before the resonators and test the tuning
within sets of three, four, or five adjacent bars. In order to analyze this procedure, the dissonance curve for an isolated
rectangular bar was obtained theoretically. The range used by the instrument makers to test the tuning include
fundamental frequency ratios up to , which is the maximum value among the average of the maxima found
for successive bars ( steps) in both studies (see Tables 2, 3).
Assuming that the main contributions to the spectrum are from transverse modes of oscillation of a rectangular
bar with free ends, the first five overtones are given by { , , , , }, where is
the fundamental frequency (Fletcher & Rossing, 1998; Kinsler, Frey, Coppens & Sanders, 1999). Figure 3a presents
the dissonance curve for this case inside one octave, taking equal values of the amplitudes for the fundamental and the
overtones in order to appreciate the contributions of all overtones, in agreement with the procedure carried out by
Sethares (1993, 1998, 2005). This curve was reported by Sethares (1993) in order to expose that if the tuning of

11
instruments is carried out according to the consonance properties of their timbre, then bar instruments must be tuned in
a different way than instruments with harmonic timbre, such as strings and pipes.
Local minima of dissonance were found at and , as illustrated in Figure 3a. The minimum
at does not correspond to any average in the experimental tunings (see Tables 2, 3). The minimum at
(close to the just fifth and the TTET fifth) is near the average value for the distance of 4 steps in the case of
the equi-heptatonic marimbas in the present study ( ), and slightly farther from the average for the marimbas
studied by Miñana ( ). The minimum located at is broader than the other minima and covers the region
around the thirds and the fourths ( , grey box in Figure 3a). The minimum at is less dissonant
than the ones found in the same region for the case of a harmonic spectrum (Figure 3a), and it is placed in an
important range of use of harmonic intervals in traditional marimba music (see 3, 4, 5 semitones in Table 6).
Figure 3b shows the differentiation of the dissonance level with respect to the parameter,
, illustrating effects due to the shapes of local minima. In the region of the thirds and the fourths the level of
dissonance for bars changes smoothly when compared to the curve for emitters with harmonic spectrum.
Bars and resonators. In order to include effects due to the tubular resonator located under each bar, it is
modeled as a cylindrical closed pipe having the same fundamental frequency as the bar. Since closed pipes only
produce odd harmonics (Fletcher & Rossing, 1998), the first thirteen overtones for the bar-resonator system used in
the analysis are { , , , , , , , , , ,
, , }.
Figure 3. a) Dissonance level as a function of the ratio of the fundamental frequencies , for a rectangular bar free to
vibrate at both ends, and for the case of a six harmonics spectrum with equal amplitudes. The location of the minima for the
harmonic spectrum corresponds to the ratio of small natural numbers posted by Pythagoras: 2/1=2.00, 3/2=1.50, 4/3=1.33,
5/3=1.67, 5/4=1.25, 6/5=1.20, 7/4=1.75, 7/5=1.40, 7/6=1.17. b) Differentiation of the dissonance level with respect to the
parameter, as a function of the ratio between the fundamental frequencies . In both graphics has been taken as the lowest
fundamental frequency, and the dissonance level scale has been normalized between 0 and 1.
The amplitudes for the partials are assumed to diminish as , where
is the ratio of the frequency of the corresponding overtone to the fundamental ( ), and
is the amplitude for the fundamental. Figure 4 shows the corresponding spectrum.
According to Sethares, the precise value of the amplitude for each overtone can be somewhat arbitrary.
However, these values must reflect the average properties of the samples (Sethares, 2005). In this sense, the
assumption that the amplitudes diminish exponentially is in agreement with the most common tendency of high
overtones having smaller amplitudes than lower ones, and it is in agreement with the average amplitude proportions
between the fundamental and the main modes measured experimentally for a set of traditional marimbas (Figure 7).
This is discussed in more detail in the following section.

12
Figure 4. Spectrum corresponding to a rectangular bar free to vibrate at both ends with a cylindrical tubular resonator. The
amplitude of the first overtone is taken to be 0.16 of the fundamental frequency, and the amplitude decays exponentially for the
remaining successive overtones.
The dissonance curves produced using the three models (Sethares, 1993, 2005; Vassilakis, 2001) are shown in Figure
5. The three models predict a peak of maximum dissonance located in the range , and three minima of low
dissonance at , , and . From the second model of Sethares and from the Vassilakis model, the
surrounding of the peaks , , and are the regions in which small variations in the
parameter produce the largest changes in the dissonance level.
Figure 5. Dissonance level as a function of the ratio of the fundamental frequencies for a rectangular bar free to vibrate
at both ends with a cylindrical tubular resonator. Amplitudes have been assumed to decay in the form presented in Figure 4. The
dissonance level scale has been normalized between 0 and 1. The lowest fundamental frequency is taken to be .
Experimental dissonance level curves
The experimental analysis uses the recordings of the sound produced by each bar coupled with its resonator.
The fundamental and first ten overtones for all marimbas were found; this is shown graphically for all bars of each
marimba in Supplement 5. In most of the studied marimbas the fundamental has the largest amplitude; however, in the
case of the Torres Family (Marimbas 9, 10, and 11 in Supplement 5) some overtones have larger amplitudes than the
fundamental. Figure 6 shows, for each marimba, the average normalized amplitude as a function of the ratio between

13
the corresponding overtone and the fundamental. The amplitude has been averaged over all the bars of a particular
marimba.
Figure 6. Average normalized amplitude for each marimba. The amplitudes have been averaged using a bin width of 0.25 for the
ratio between the frequency of the overtones and the fundamental frequency.
Traditional marimbas 2, 3, 4, 5, 9, 10, and 11 exhibit a common pattern in the spectrum. Specifically, there are
important incidences of overtones around and . The normalized amplitudes obtained
from superposition of the samples from all traditional marimbas are shown in Figure 7; the most important overtones
are located near , , and . The values of these overtones are consistent with those of
the theoretical model of the first and the second transverse modes of a rectangular bar free to vibrate at both ends and
the second mode of a closed pipe. Other modes are absent or have low amplitudes in almost all cases, such as the
unexpected peaks located at that we associate with the first overtone of broken resonators functioning as open
pipes.
The experimental values for the ratios of the heights of the peaks in Figure 7 are ,
, and , where , , , and are the amplitudes of the fundamental, first overtone, second
overtone, and third overtone, respectively. These ratios of the amplitudes are approximately reproduced using the
theoretical model proposed for the fundamental frequency and overtones , , and (see Figure 4).

14
Figure 7. Average value of amplitudes associated with the overtones appearing in the traditional marimbas. Bin width of 0.4 for
the ratio between the frequency of the overtones and the fundamental frequency.
Using overtones , , and as representative values for the most important contributions
found experimentally, and with the values of the normalized amplitudes presented previously, the corresponding
dissonance curves were generated for both the Sethares and Vassilakis models (Figure 8a). The case of equal
amplitudes is also presented; as in the low registers of the marimbas made by the Torres family, the amplitudes of the
overtones are comparable to those of the fundamental (Supplement 5).
Comparing the experimental result (Figure 8a) with the theoretical model for a bar and its tubular resonator
(Figure 5), illustrates that the dissonance curves have similar shapes with a large peak of dissonance, for ,
and two narrow peaks of low dissonance, at and . The most notable differences between the curves
are smoothness, and the presence of a low dissonance narrow peak at in the theoretical model. Figure 8b
shows the differentiation . There are two regions in which small variations in the parameter produce
large changes in the dissonance level . These regions contain the musical intervals around the seconds, for
, and the sevenths, , that are commonly avoided in the traditional marimba music.
The peak located at in the dissonance curve from the theoretical analysis of the bar coupled to the
resonator (Figure 5) is due to the first overtone generated by the vibration of the tubular resonator = . For the most
traditional marimbas this overtone presents insignificant values of amplitude, however for the marimbas 6, 7, and 8,
this overtone contributes significantly (Figure 6). The ratio is very close to the major sixths in the TTET scale
( ); the statistical analysis finds that this interval occurs in only 2-3%, on average, of musical pieces (Table 6),
indicating that the region around this peak is not commonly used in the marimba de chonta music.
The peak located at is due to the overtone . Since the amplitude for this overtone is smaller
than for overtones , and , the dissonance curve changes less abruptly in the region of the octaves,
when compared to those in the region of the sevenths. Perhaps this is the reason the octaves are not suppressed in the
geometrical schemes of Figure 1.
The transposition practice
The transposition of a musical piece involves rewriting a composition in a different key, a practice that is
common when accommodating different voice ranges (Apel, 1974). Since in an equal tempered scale the frequency
ratios are preserved, the dissonance sequence in a transposition process remains almost unchanged conserving similar
tension-relaxation sequences.

15
Figure 8. a) Dissonance level as a function of the ratio of the fundamental frequencies for the most important
components of the experimental spectrum. b) Differentiation of the dissonance level with respect to the fundamental frequency
ratio as a function of the fundamental frequency ratio , for the most important components of the experimental
spectrum. The dissonance level scale has been normalized between 0 and 1. The lowest fundamental frequency has been taken to
be .
In the isotonic scales, the transposition process keeps the same frequency ratios for the same geometrical
distances. In traditional marimbas the average frequency ratios are the ones that follow isotonic scales, with relatively
small deviations with respect to the mean (see Tables 2, 3, 4, 5), suggesting that similar successive dissonance changes
can be preserved if the regions with large changes in dissonance are avoided.
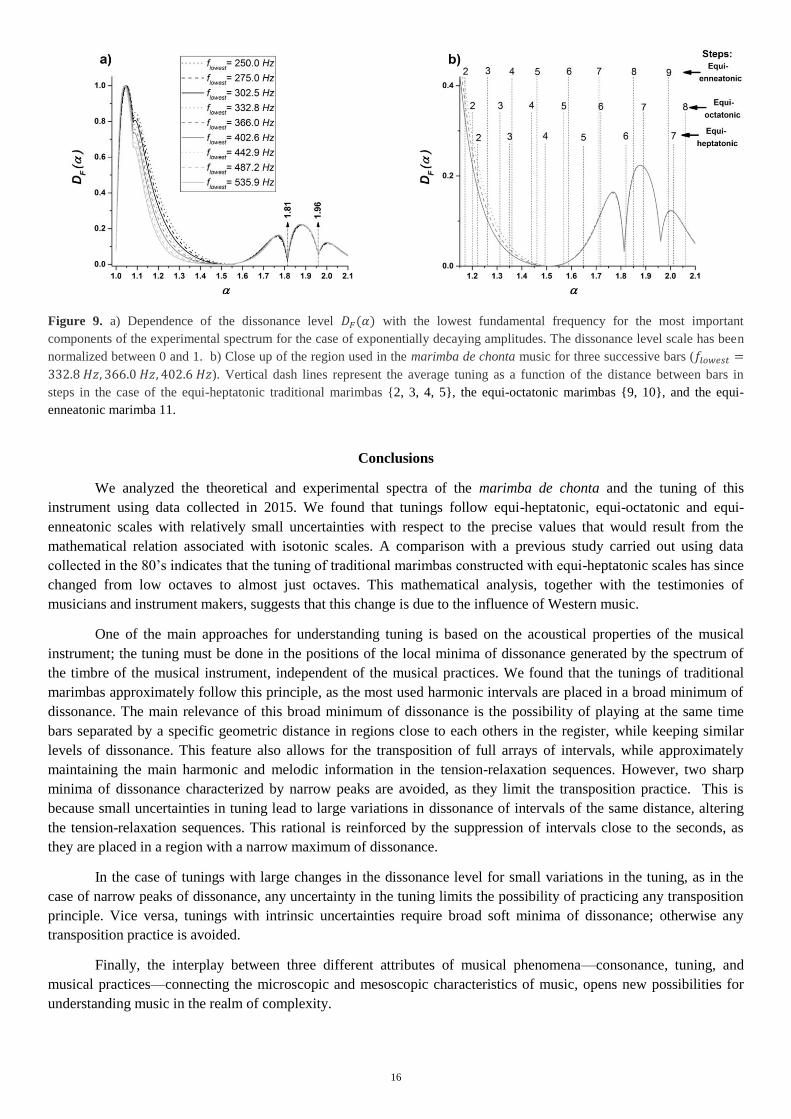
Up to know, the dissonance curves have been constructed over a fixed value for one of the fundamental
frequencies ( ). In general, the form of the dissonance curves is similar for different values of the fixed
fundamental frequency. For example, Figure 9a shows the dissonance curves for different fixed fundamental
frequencies using the second model of Sethares using the spectrum found experimentally. The set of fundamental
frequencies was obtained using the average ratios of the fundamental frequencies found for adjacent bars of the equi-
heptatonic traditional marimbas of the present study. Hence this figure represents the dissonance curves starting from
different bars of the marimba. This figure also shows that the same musical interval played in a lower part of the
register tends to be more dissonant than when played in a higher part, a well-known property of musical intervals
(Plomp & Levelt, 1965; Roederer, 2009).
In the performance of a musical piece on a traditional marimba different simultaneous pairs of bars are hit to
construct successive dissonance levels. Since the melodic motion is produced using bars near to each other (Miñana,
2010a), this practice results in jumps between different dissonance curves near to each other (Figure 9b). In the region
of the dissonance curves of traditional marimbas that excludes the seconds, the sevenths, and the octaves, transitions
or jumps made between near or adjacent dissonance curves lead to small changes in the dissonance sequences. For
example, Figure 9b shows that the most dissonant elements in this music are usually due to intervals with a distance of
2 steps, and the most consonant are usually due to intervals with distances of 4 or 5 steps (in the equi-heptatonic
scale). These features do not change significantly due to jumps between near or adjacent dissonance curves. A
different situation occurs for 6, 7, and 8 step distances in the equi-heptatonic, equi-octatonic, and equi-enneatonic
scales, respectively, in which narrow peaks can lead to changes from consonant to dissonant values for small changes
in , or vice-versa, especially in the region of sevenths.
Regarding the transposition process, the bar used to start the performance of a piece determines the initial
dissonance curve for the sequence of steps. If two dissonance curves are adjacent or close to each other, then the same
sequence of harmonic intervals generated using distances of 2, 3, 4, and 5 steps in the case of the equi-heptatonic
marimbas (2, 3, 4, 5, and 6 for equi-octatonic, 2, 3, 4, 5, 6, and 7 for the equi-enneatonic) will produce similar
sequences of dissonance changes, independently of which of the dissonance curves is the initial one. On the other
hand, avoiding intervals in the regions with large variations in the dissonance level (1, 6, and 7 distance steps for equi-
heptatonic marimbas; 1, 7, and 8 for equi-octatonic; 1,8, and 9 for equi-enneatonic) allows the preservation of
geometrical distances of the sequence of intervals in the transposition process.
16
Figure 9. a) Dependence of the dissonance level with the lowest fundamental frequency for the most important
components of the experimental spectrum for the case of exponentially decaying amplitudes. The dissonance level scale has been
normalized between 0 and 1. b) Close up of the region used in the marimba de chonta music for three successive bars (
). Vertical dash lines represent the average tuning as a function of the distance between bars in
steps in the case of the equi-heptatonic traditional marimbas {2, 3, 4, 5}, the equi-octatonic marimbas {9, 10}, and the equi-
enneatonic marimba 11.
Conclusions
We analyzed the theoretical and experimental spectra of the marimba de chonta and the tuning of this
instrument using data collected in 2015. We found that tunings follow equi-heptatonic, equi-octatonic and equi-
enneatonic scales with relatively small uncertainties with respect to the precise values that would result from the
mathematical relation associated with isotonic scales. A comparison with a previous study carried out using data
collected in the 80’s indicates that the tuning of traditional marimbas constructed with equi-heptatonic scales has since
changed from low octaves to almost just octaves. This mathematical analysis, together with the testimonies of
musicians and instrument makers, suggests that this change is due to the influence of Western music.
One of the main approaches for understanding tuning is based on the acoustical properties of the musical
instrument; the tuning must be done in the positions of the local minima of dissonance generated by the spectrum of
the timbre of the musical instrument, independent of the musical practices. We found that the tunings of traditional
marimbas approximately follow this principle, as the most used harmonic intervals are placed in a broad minimum of
dissonance. The main relevance of this broad minimum of dissonance is the possibility of playing at the same time
bars separated by a specific geometric distance in regions close to each others in the register, while keeping similar
levels of dissonance. This feature also allows for the transposition of full arrays of intervals, while approximately
maintaining the main harmonic and melodic information in the tension-relaxation sequences. However, two sharp
minima of dissonance characterized by narrow peaks are avoided, as they limit the transposition practice. This is
because small uncertainties in tuning lead to large variations in dissonance of intervals of the same distance, altering
the tension-relaxation sequences. This rational is reinforced by the suppression of intervals close to the seconds, as
they are placed in a region with a narrow maximum of dissonance.
In the case of tunings with large changes in the dissonance level for small variations in the tuning, as in the
case of narrow peaks of dissonance, any uncertainty in the tuning limits the possibility of practicing any transposition
principle. Vice versa, tunings with intrinsic uncertainties require broad soft minima of dissonance; otherwise any
transposition practice is avoided.
Finally, the interplay between three different attributes of musical phenomena—consonance, tuning, and
musical practices—connecting the microscopic and mesoscopic characteristics of music, opens new possibilities for
understanding music in the realm of complexity.
17
Acknowledgments
We thank Universidad Nacional de Colombia for funding this study under grant HERMES 19010. We thank Carlos
Miñana, Hector Tascón, Yeiner Orobio and Julián Villegas for their valuable comments and suggestions. We also
thank Roberto García, Maria Angélica Bejarano, Jesús Guevara and Alejandro Pernet for the recording of the marimba
samples. We thank Kevin Pineda for the transcription of musical scores. Finally, we thank the many marimba de
chonta instrument makers, musicians, and singers that we met in the Pacific Coast of Colombia.
References
Apel, W. (1974). Harvard Dictionary of Music (2nd edition). Cambridge, Massachusetts: Harvard
University Press.
Duque, A., Sánchez H. F., & Tascón H. J. (2009). ¡Qué te pasa a vo! Canto de piel, semilla y chonta. Músicas del
pacífico sur. Cartilla de iniciación musical. Bogotá, Colombia: ACODEM.
Fletcher, N. H., & Rossing, T. D. (1998). The physics of musical instruments (2nd edition). New York:
Springer.
Helmhotz, H. (1954). On the Sensation of Tone as a Physiological Basis for the Theory of Music: Translation by A. J.
Ellis. New York: Dover Publications.
Hernández, O. (2007). Marimba de chonta y poscolonialidad musical. Nómadas (Col),(26), 56-69.
Instituto Nacional de Patrimonio Cultural de Ecuador. Inventory Abstract. (2014). Retrieved from:
https://ich.unesco.org/doc/download.php?versionID=31319
Kinsler, L. E., Frey, A. R., Coppens, A. B., & Sanders, J. V. (1999). Fundamentals of Acoustics (4th
edition). New York: Jhon Wiley & Sons, Inc.
Lawrence E., & Florentine M. (2011) Measurement of Loudness, Part 1: Methods, Problems, and Pitfalls. In
Florentine, M., Popper, A. N., & Fay, R. R. (Eds.), Loudness (pp. 17-56). New York: Springer-Verlag.
Ministerio de Cultura de Colombia. (2010a). Plan Especial de Salvaguardia (PES) de las músicas de marimba y los
cantos tradicionales del pacífico sur de Colombia. Retrieved from:
http://www.mincultura.gov.co/prensa/noticias/Documents/Patrimonio/03-
M%C3%BAsicas%20de%20marimba%20y%20cantos%20tradicionales%20del%20Pac%C3%ADfico%20sur
%20de%20Colombia%20-%20PES.pdf
Ministerio de Cultura de Colombia. (2010b). Abstract Inventario del patrimonio cultural inmaterial en que
ha sido incluida la manifestación “Músicas de Marimba y Cantos Tradicionales del Pacífico Sur”.
Retrieved from: https://ich.unesco.org/doc/download.php?versionID=35135
Miñana, C. (2010a). Afinación de las marimbas en la costa Pacífica colombiana: ¿Un ejemplo de la memoria
interválica africana en Colombia? In Ochoa, J, & Melo A. M. (Eds.), Músicas y prácticas sonoras del Pacífico
afrocolombiano (pp. 287-346).
Miñana, C. (2010b). Los problemas de la memoria musical en la conexión África – Colombia: el caso de las marimbas
de la Costa Pacífica colombo-ecuatoriana. In Tello, C. (Ed.), Memorias del Saber hacer: XI Encuentro para la
Promoción y difusión del Patrimonio Inmaterial de Países Iberoamericanos. Santa Cruz de Mopox,
Colombia.
Patel, A. D. Music, Language, and the Brain (2008). New York: Oxford University Press, Inc.
Plomp, R., & Levelt W. J. (1965). Tonal consonance and critical band width. Journal of the Acoustical Society of
America, 38, 548-560, doi:10.1121/1.1909741
Ramón, A. C. (2001). Colombian Folk music in an International Context, (master’s thesis). Iceland Academy of
the Arts, Iceland. Retrieved from:

18
https://skemman.is/bitstream/1946/5914/3/Lokarigerd.pdf
Roederer, J. (2009). The physics and psychophysics of music. An introduction. New York: Springer-
Verlag.
Rossing, T. D. (1990). The science of sound (2nd edition). Reading, Massachusetts: Addison- Wesley.
Schellenberg, E. G., & Trainor, L. J. (1996). Sensory consonance and the perceptual similarity of complex-tone
harmonic intervals: Tests of adult and infant listeners. The Journal of the Acoustical Society of America, 100,
3321-3328, doi:10.1121/1.417355
Sethares, W. A. (1993). Local consonance and the relation between timbre and scales. The Journal of the Acoustical
Society of America, 94(3), 1218-1228, doi:10.1121/1.408175
Sethares, W. A. (1998). Tuning, timbre, spectrum, scale (1st edition). London: Springer-Verlag.
Sethares, W. A. (2005). Tuning, timbre, spectrum, scale (2nd edition). London: Springer-Verlag.
Tascón, H. J. (2008). A marimbiar: “método OIO” para tocar la marimba de chonta. Valle del Cauca, Colombia: N-
Textos.
UNESCO. (2015). Convention for the safeguarding of the intangible cultural heritage. Windhoek,
Namibia. Retrieved from:
https://ich.unesco.org/doc/src/ITH-15-10.COM-10.b+Add_EN.doc
Vassilakis, P. N. (2001). Perceptual and Physical properties of Amplitude Fluctuation and their Musical
Significance, (Doctoral Dissertation, University of California). Retrieved from:
http://www.acousticslab.org/papers/VassilakisP2001Dissertation.pdf
Vassilakis, P. N., & Kendall, R. A. (2010). Psychoacoustic and cognitive aspects of auditory roughness:
definitions, models and applications. Proc. Of SPIE-IS Electronic Imaging: Vol. 7527,
doi:10.1117/12.845457

Supplement 1

&
?
c
cMarimba
·
Ï Ï Ï Ï#
·
Ï# Ï# Ï# Ï
Î Î Ï ÏÏ Ï# Î Î
Ï# Ï Ï Ï
·
Ï Ï î
·
&
?
6 ·
Ï# Ï# Ï# Ï#Ï# Ï# Ï Ï#
·
Ï# Ï Ï Ï#
·
Ï# Ï# î
·
·
Ï# Ï Ï# Ï
·
Ï Ï# Ï Ï
&
?
12 î Ï ÏÏ Ï î
Ï Ï Ï Ïb
·
Ï Ïb Ïb Ï
·
·
Ï Ïb Ï Ï
î Î ÏbÏb Ïb Ïb Î
Ïb Ïb Ïb Ïb
·
&
?
18 Ïb Ïb Ïb Ïn
·
Ïb Ïb Ïn Ï
·
·
Ï Ï Ï Ï
·
Ï Ï# Ï Ï
î Ï ÏbÏb Ï î
Ï Ï Ïb Ïb
·
Marimba de Chonta tunings(Carlos Miñana)
?* +40
+10
-30
-40
+15
+20
+40
+10
+15
+20 +20
+10
-20
+40
+30Marimba 1
Marimba 2
-20
-10 +30
-30
-40
-20 -30
+20
-30
-20
-20
-20
Marimba 3
+5
+45
-10
+50
+10
+10
+50
+30
-10
+30
-20
-30
+25
-30
-10
+25
-20
+50
+30
-30
Marimba 4
-30 +50
+10
-40
+40
-10
+50
+5 -40
+30
-30
-40
-5
-40
+20 -30
+35
-10Marimba 5
+30
-20
+30
-10
-50
-40 -40 +30-30
+40 -40
+20
-30
* In the analysis we have used the pitch A without taking into account the symbol "?"

&
?
24 Ïb Ïb Ïb Ïb
·
Ïb Ïn î
·
·
Ï# Ï Ï Ïb
·
Ïb Ïb Ï ÏbÏb Ï Ïb Ïb
·
Ïb Ïb Ïb Ïn
·
&
?
30 Ïb Ïn î
·
·
Ï Ï# Ï# Ï
·
Ï# Ï# Ï ÏÏ Ï Ï Ï
·
Ï Ï Ï Ï#
·
Ï Ï Ï# Ï
·
&
?
36 Ï Ïb Ï Ï
·
·
Ï# Ï# Ï Ï#Ï# Ï Ï# Ï
·
Ï Ïb Ï Ï
·
Ï Ï Ï Ï
·
Ïb Ïb î
·
&
?
42 ·
Ï# Ï# Ï# Ï
·
Ïb Ï Ïb Ïb
·
Ïb Ïb Ïb ÏbÏb Ïb Ïb Ïn
·
Ï Ïb Ïn Ïb
·
Ïb Ïb Ï Î
·
+30
+40
+20
-70
-30Marimba 6
+30
+30
+40
+10
-10
+30
-10
-30
+20
-30
-30
+20
-10 -10
-20 -20Marimba 7
+20
-30
+10
+35 +30
-35
+25
+35
+45
-10
-20
+35
+5
+10
-10
-35
+25
-25
-45
+10
-10
+20 -20
-10
Marimba 8
-5 +25 -10-15
+30
+15
+35
-15
+20
-35
+5 -30
+15
-20 -15 +20
Marimba 9
+10
-40
+50
+30
+30
-10
+30
+10
-30
+20
+15
-30-30
-25
-5
-35
+30
+40 -40
-50 +40

Supplement 2

Fundamental frequencies produce by each bar with its corresponding resonator.
The uncertainty values correspond to the distance between adjacent frequencies in the FFT analysis assuming that it corresponds to the uncertainty in the peak
location. The mark “*” refers to unconfident values for the fundamental frequencies.
1 131.62 ± 1.19 270.85 ± 1.96 184.70 ± 0.95 167.91 ± 1.55 158.66 ± 1.10 171.93 ± 0.75 190.21 ± 3.59 145.71 ± 1.58 191.01 ± 3.35 130.00 ± 9.35 * 169.39 ± 7.70 *
2 145.93 ± 1.27 305.01 ± 2.52 204.74 ± 0.85 188.53 ± 1.61 170.82 ± 1.09 175.40 ± 1.16 210.60 ± 2.70 167.24 ± 1.61 205.53 ± 2.23 123.35 ± 5.36 143.81 ± 4.11 *
3 165.23 ± 1.09 341.11 ± 1.71 223.41 ± 1.16 209.54 ± 1.64 190.35 ± 1.63 200.89 ± 0.81 226.28 ± 2.76 180.60 ± 1.67 227.84 ± 2.45 128.76 ± 6.78 209.20 ± 7.21 *
4 175.38 ± 1.07 367.60 ± 2.12 251.43 ± 1.30 219.15 ± 2.15 214.15 ± 1.38 221.17 ± 1.14 249.61 ± 3.12 195.12 ± 1.68 247.56 ± 3.26 148.30 ± 6.18 153.34 ± 4.38
5 197.31 ± 1.01 409.85 ± 2.55 282.56 ± 2.05 241.62 ± 2.95 229.48 ± 2.64 250.50 ± 1.06 270.62 ± 2.73 207.33 ± 1.69 272.75 ± 1.98 147.50 ± 3.51 163.50 ± 5.64
6 220.47 ± 0.87 450.50 ± 2.20 309.48 ± 2.36 275.01 ± 1.72 259.31 ± 1.81 267.41 ± 0.96 305.05 ± 3.32 229.89 ± 1.70 287.25 ± 4.29 169.88 ± 3.15 184.31 ± 4.98
7 247.30 ± 0.87 496.49 ± 2.96 334.65 ± 1.95 298.57 ± 2.16 294.34 ± 3.16 292.42 ± 1.40 332.30 ± 2.66 252.85 ± 1.72 313.55 ± 5.50 187.36 ± 2.80 198.21 ± 2.75
8 261.68 ± 0.81 536.73 ± 3.21 367.40 ± 1.90 331.03 ± 3.09 316.90 ± 2.08 334.85 ± 1.50 365.02 ± 4.80 285.65 ± 1.75 349.14 ± 3.49 207.35 ± 1.13 207.13 ± 1.59
9 293.58 ± 1.17 609.06 ± 2.11 413.15 ± 3.36 369.93 ± 3.36 349.58 ± 1.42 360.21 ± 1.31 396.51 ± 2.83 315.69 ± 1.82 379.01 ± 5.83 219.98 ± 1.86 215.10 ± 2.95
10 330.00 ± 0.91 687.68 ± 3.10 451.49 ± 2.57 413.35 ± 2.48 394.01 ± 1.70 387.14 ± 1.18 449.56 ± 2.71 355.90 ± 1.70 409.60 ± 4.82 243.93 ± 1.16 233.14 ± 3.33
11 351.58 ± 1.03 747.17 ± 2.20 500.13 ± 2.10 440.39 ± 2.79 430.19 ± 1.67 438.80 ± 1.31 479.41 ± 3.05 390.45 ± 1.72 462.12 ± 4.32 262.04 ± 1.48 263.92 ± 5.50
12 393.69 ± 1.02 818.48 ± 2.14 542.98 ± 2.64 486.81 ± 4.13 472.91 ± 1.86 481.43 ± 1.23 543.40 ± 3.25 429.08 ± 1.88 495.17 ± 7.99 294.23 ± 1.56 283.19 ± 10.11
13 439.43 ± 0.99 910.90 ± 2.45 634.07 ± 2.59 539.29 ± 2.84 535.00 ± 2.83 518.89 ± 1.47 600.83 ± 2.78 477.37 ± 1.80 539.33 ± 4.86 311.65 ± 3.21 299.34 ± 3.29
14 495.44 ± 0.94 994.77 ± 3.06 672.32 ± 3.14 585.53 ± 3.33 582.64 ± 2.03 580.70 ± 1.66 655.81 ± 3.49 515.07 ± 1.73 603.41 ± 4.08 356.91 ± 1.53 312.88 ± 2.87
15 523.24 ± 1.14 1080.37 ± 2.60 740.70 ± 3.53 644.27 ± 3.64 650.65 ± 2.85 654.80 ± 1.87 719.59 ± 5.00 572.42 ± 1.73 636.04 ± 5.30 381.38 ± 1.94 358.66 ± 3.04
16 588.65 ± 1.20 1240.32 ± 2.38 838.27 ± 3.95 737.47 ± 3.60 702.45 ± 3.07 705.79 ± 2.20 800.23 ± 2.91 648.36 ± 1.79 722.67 ± 6.07 428.30 ± 2.75 378.97 ± 1.81
17 660.86 ± 1.08 896.38 ± 4.55 813.44 ± 3.48 798.79 ± 3.01 783.34 ± 2.12 910.42 ± 3.00 722.11 ± 1.83 755.61 ± 4.66 475.78 ± 2.07 412.29 ± 1.65
18 700.72 ± 0.90 989.25 ± 3.41 876.62 ± 3.97 871.50 ± 4.49 859.39 ± 2.46 874.57 ± 5.95 528.51 ± 2.36 431.40 ± 3.17
19 791.14 ± 0.84 1128.03 ± 4.27 986.17 ± 6.45 928.18 ± 2.37 935.74 ± 4.70 563.27 ± 2.40 481.15 ± 3.39
20 878.25 ± 0.80 1248.11 ± 6.60 1131.23 ± 4.83 1011.77 ± 2.68 1057.87 ± 4.16 608.65 ± 2.32 527.56 ± 3.77
21 985.22 ± 0.99 1342.93 ± 6.19 1224.65 ± 6.45 1121.73 ± 6.34 556.13 ± 4.56
22 1044.23 ± 1.08 1448.71 ± 6.59 1338.57 ± 6.73 609.91 ± 5.08
23 1663.24 ± 8.07 1472.77 ± 8.71 657.09 ± 4.60
24 1767.66 ± 9.16 1643.50 ± 9.67 716.08 ± 4.56
------
------
------
------
------
------
------
------
------
------
------
------
------
------
------
------
------
------
------
------
------
------
------
Bar
Marimba 1 Marimba 2 Marimba 3 Marimba 4
------
------
------
------
------
------
------
------
------
------
Fundamental frequency (Hz )
------ ------
------ ------
Marimba 11Marimba 9 Marimba 10
------
------ ------
Marimba 6 Marimba 7 Marimba 8Marimba 5
------

Supplement 3

Musical piece number Musician 1
Dioselino Rodríguez
2
3
4
5
6 Genaro Torres
7 Francisco Torres

& bb 86Marimba ..úúU ..úú
U
& bb3 Î . ..ÏÏ ..ÏÏ ÏÏ JÏÏ
jÏÏ ÏÏ jÏÏ ÏÏ ÏÏ jÏ ÏÏjÏÏ ÏÏ ÏÏ ÏÏ ä ÏÏ ÏÏ ÏÏ ÏÏ ä ÏÏ ÏÏ ÏÏ ÏÏ ä ÏÏ
& bb10 ÏÏ ÏÏ ÏÏ ä ÏÏ ÏÏ ÏÏ ÏÏ ä ÏÏ .Ï Ï Ï ÏÏ JÏ Ï JÏ
ÏÏ ÏÏ ÏÏ ä ÏÏ ÏÏ ÏÏ ÏÏ ä ÏÏ ÏÏ ÏÏ ÏÏ ä ÏÏ
& bb16 ÏÏ ÏÏ ÏÏ ä ÏÏ ÏÏ ÏÏ ÏÏ ä ÏÏ ÏÏ ÏÏ ÏÏ ä ÏÏ Ç
2Ç2
Ç2
& bb25 ÏÏ ÏÏ ÏÏ ä ÏÏ ÏÏ ÏÏ ÏÏ ä ÏÏ ÏÏ ÏÏ ÏÏ ä ÏÏ ÏÏ ÏÏ ÏÏ ä ÏÏ ÏÏ ÏÏ ÏÏ ä ÏÏ
& bb30 jÏÏ ÏÏ ä Ï Ï jÏ Ï ÏÏ ÏÏ ä ÏÏ
jÏÏ ÏÏjÏÏ ÏÏ ÏÏ ÏÏ ÏÏ ä ÏÏ ÏÏ ÏÏ ÏÏ ä ÏÏ
& bb35 ÏÏ ÏÏ ÏÏ ä ÏÏ ÏÏ ÏÏ ÏÏ ä ÏÏ Ç
2Ç2
Ç2
Ç2
& bb45 ÏÏ ÏÏ ÏÏ ä ÏÏ ÏÏ ÏÏ ÏÏ ä ÏÏ ÏÏ ÏÏ ÏÏ ä ÏÏ ÏÏ ÏÏ ÏÏ ä ÏÏ ÏÏ ÏÏ ÏÏ ä ÏÏ ÏÏ ÏÏ ÏÏ ä ÏÏ ÏÏ ÏÏ ÏÏ ä ÏÏ
& bb52 ÏÏ J
ÏÏ Ï Ï ÏÏ ÏÏ ÏÏ ÏÏ ä ÏÏ ÏÏ ÏÏ ÏÏ ä ÏÏ ÏÏ ÏÏ ÏÏ ä ÏÏ ÏÏ ÏÏ ÏÏ ä ÏÏ ÏÏ ÏÏ ÏÏ ä ÏÏ Ï Ï Ï ä Ï
Musical piece # 1

& bb59 ÏÏ ÏÏ ÏÏ ä ÏÏ ÏÏ ÏÏ ÏÏ ä ÏÏ Ç
2Ç2
Ç2
Ç2
& bb69 ÏÏ ÏÏ ÏÏ ä ÏÏ ÏÏ ÏÏ ÏÏ ä ÏÏ ÏÏ ÏÏ ÏÏ ä ÏÏ ÏÏ ÏÏ ÏÏ ä ÏÏ ÏÏ ÏÏ ÏÏ ä ÏÏ ÏÏ ÏÏ ÏÏ ä ÏÏ ÏÏ ÏÏ ÏÏ ä ÏÏ ÏÏ ÏÏ ÏÏ ä ÏÏ
& bb77 ÏÏ ÏÏ ÏÏ ä ÏÏ ÏÏ ÏÏ ÏÏ ä ÏÏ Ç
2Ç2
Ç2
& bb85 ÏÏ ÏÏ ÏÏ ä ÏÏ ÏÏ ÏÏ ÏÏ ä ÏÏ Ç
2Ç2 ÏÏ ÏÏ ÏÏ ä ÏÏ ÏÏ ÏÏ ÏÏ ä ÏÏ
& bb93 ÏÏ ÏÏ ÏÏ ä ÏÏ ÏÏ ÏÏ ÏÏ ä ÏÏ Ç
2Ç2
Ç2
Ç2
Ç2
& bb105 ÏÏ ÏÏ ÏÏ ä ÏÏ ÏÏ ÏÏ ÏÏ ä ÏÏ ÏÏ ÏÏ ÏÏ ä ÏÏ ÏÏ ÏÏ ÏÏ ä ÏÏ Ç
2 ÏÏ ÏÏ ÏÏ Î . ÏÏ ÏÏ ä Î . ÏÏ ä Î .

& bb 43MarimbaÏÏ ÏÏ Î ÏÏ ÏÏ ÏÏ ÏÏ ÏÏ ÏÏ ÏÏ ÏÏ ÏÏ ÏÏ ÏÏ ÏÏ ÏÏ ÏÏ ÏÏ ÏÏ ÏÏ ÏÏ ÏÏ ÏÏ ÏÏ ÏÏ ÏÏ ÏÏ ÏÏ ÏÏ ÏÏ
& bb7
ÏÏ Ï Ï Ï Ï Î Î ÏÏ ÏÏ ÏÏ ÏÏ ..ÏÏ ..ÏÏ ÏÏ jÏÏ ÏÏ ä ä jÏÏ ÏÏ ÏÏ ÏÏ ÏÏ Î ÏÏ ÏÏ ÏÏ ÏÏ ÏÏ ÏÏ ÏÏ ÏÏ ÏÏ ÏÏ
& bb16 ÏÏ ÏÏ ÏÏ ÏÏ ÏÏ ÏÏ ÏÏ ÏÏ ÏÏ JÏÏ
ÏÏ JÏÏ ÏÏ Î ÏÏ ÏÏ ÏÏ äjÏÏ ÏÏ ÏÏ ÏÏ ÏÏ ÏÏ ÏÏ ÏÏ jÏÏ ÏÏ jÏÏ ÏÏ ÏÏ ÏÏ ÏÏ
& bb24 ÏÏ Î ÏÏ ÏÏ ÏÏ ÏÏ ÏÏ ÏÏ ÏÏ Î ÏÏ ÏÏ ÏÏ ÏÏ ÏÏ ÏÏ ÏÏ ÏÏ ÏÏ ÏÏ ÏÏ ÏÏ ÏÏ ÏÏ ÏÏ ÏÏ ÏÏ ÏÏ ÏÏ ÏÏ ÏÏ ÏÏ ÏÏ
& bb31 ÏÏ ÏÏ ÏÏ ÏÏ ÏÏ ÏÏ ÏÏ Ï Ï Ï Ï ÏÏ ÏÏ ÏÏ ÏÏ ÏÏ ä JÏÏ ÏÏ ÏÏ ÏÏ ÏÏ ÏÏ ÏÏ ÏÏ ÏÏ ÏÏ ÏÏ ä JÏÏ ÏÏ ÏÏ
& bb37 ÏÏ ÏÏ ÏÏ ÏÏ ÏÏ ÏÏ ÏÏ ÏÏ ä JÏÏ ÏÏ
ÏÏ ÏÏ ÏÏ ÏÏ ÏÏ ÏÏ ÏÏ ÏÏ ÏÏ ä JÏÏ ÏÏ ÏÏ ÏÏ ÏÏ ÏÏ ÏÏ ÏÏ ÏÏ ÏÏ ÏÏ Î
& bb43 Î ÏÏ ÏÏ ÏÏ ÏÏ ÏÏ ÏÏ ÏÏ ÏÏ ÏÏ ÏÏ ÏÏ ÏÏ jÏÏ ÏÏ jÏÏ ÏÏ ÏÏ ÏÏ ÏÏ ÏÏ ÏÏ ÏÏ ÏÏ ÏÏ ÏÏ ÏÏ ÏÏ ÏÏ ÏÏ ÏÏ ÏÏ ÏÏ ÏÏ ÏÏ ÏÏ ÏÏ
& bb51 ÏÏ ä ÏÏ JÏÏ ÏÏ ÏÏ ÏÏ ÏÏ ÏÏ ÏÏ ÏÏ ä ÏÏ JÏÏ ÏÏ ÏÏ ÏÏ ÏÏ ÏÏ ÏÏ ÏÏ ÏÏ ÏÏ ÏÏ ÏÏ ÏÏ ÏÏ ÏÏ ÏÏ ÏÏ ÏÏ ÏÏ ÏÏ
rit.
& bb58
ÏÏ ÏÏU Î Ï ÏU Î ÏÏ ÏÏU Î~~~~~~~
Musical piece # 2
& bb 43Marimba .Ï .Ï Ï Ï Ï Ï Ï Ï Ï ÏÏ Î ÏÏ ÏÏ ÏÏ ÏÏ ÏÏ ÏÏjÏÏ ÏÏ jÏÏ ÏÏ ÏÏ ÏÏ ÏÏ ÏÏ ÏÏ ÏÏ
& bb7 ÏÏ jÏÏ ..ÏÏ ..ÏÏ ÏÏ ÏÏ ÏÏ ÏÏ ÏÏ ÏÏ ÏÏ Ï Ï Ï Ï Ï Ï Ï ÏÏ Î ÏÏ ÏÏ ÏÏ ÏÏ ÏÏ ÏÏ
& bb13 jÏÏ ÏÏ jÏÏ ÏÏ ÏÏ ÏÏ ÏÏ ÏÏ ÏÏ ÏÏ ÏÏ ÏÏ ÏÏ ÏÏ ÏÏ ÏÏ ÏÏ ÏÏ ÏÏ ÏÏ ÏÏ ÏÏ ÏÏ ÏÏ ÏÏ ÏÏ ÏÏ
& bb19 ÏÏ ÏÏ ÏÏ ÏÏ ÏÏ ÏÏ ÏÏ ÏÏ ÏÏ ÏÏ ÏÏ Ï Ï Ï Ï Ï Ï Ï ÏÏ ÏÏ ÏÏ ÏÏ ÏÏ ÏÏ ÏÏ ÏÏ
& bb25 jÏÏ ÏÏ jÏÏ ÏÏ ÏÏ ÏÏ ÏÏ ÏÏ ÏÏ ÏÏ ÏÏ ÏÏ ÏÏ ÏÏ ÏÏ ÏÏ ÏÏ ÏÏ ÏÏ ÏÏ ÏÏ ÏÏ ÏÏ ÏÏ ÏÏ ÏÏ ÏÏ
& bb31 ÏÏ ÏÏ ÏÏ ÏÏ ÏÏ ÏÏ ÏÏ ÏÏ ÏÏ JÏÏ ÏÏ
jÏÏ ÏÏ ÏÏ ÏÏ ÏÏ ÏÏ ÏÏ ÏÏ JÏÏ ÏÏjÏÏ ÏÏ ÏÏ ÏÏ ÏÏ ÏÏ ÏÏ ÏÏ
& bb37 jÏÏ ÏÏ jÏÏ ÏÏ ÏÏ ÏÏ ÏÏ ÏÏ ÏÏ ÏÏ ÏÏ ÏÏ ÏÏ ÏÏ ÏÏ ÏÏ ÏÏ ÏÏ ÏÏ ÏÏ ÏÏ ÏÏ ÏÏ ÏÏ ÏÏ ÏÏ ÏÏ ÏÏ
& bb43 ÏÏ jÏÏ ÏÏ jÏÏ ÏÏ JÏÏ ÏÏ
jÏÏ ÏÏ ÏÏ ÏÏ ÏÏ ÏÏ ÏÏ ÏÏ ÏÏ ÏÏ ÏÏjÏÏ ÏÏ jÏÏ ..ÏÏ ..ÏÏ ÏÏ jÏÏ
Musical piece # 3

& bb49 ÏÏ ÏÏ ÏÏ ÏÏ ÏÏ ÏÏ ÏÏ ÏÏ ÏÏ ÏÏ ÏÏ ÏÏ ÏÏ Î
ÏÏ ÏÏ ÏÏ ÏÏ ÏÏ ÏÏ ÏÏ ÏÏ ÏÏ ÏÏ Î Ï Ï Ï Ï Ï Ï
& bb55 ä ÏÏ jÏÏ ÏÏ ÏÏ ÏÏ ÏÏ ÏÏ ä ÏÏ ÏÏ ä Ï Ï Ï Ï Ï ÏÏ ä ÏÏ JÏÏ ÏÏ ÏÏ ÏÏ ÏÏ
jÏÏ ÏÏ
& bb61
Ï Ï ÏÏ ÏÏ ÏÏ ÏÏ ÏÏ ÏÏ ÏÏ ÏÏ ÏÏ ÏÏ ÏÏ ÏÏ ÏÏ ÏÏ ÏÏ Ï Ï Ï Ï Ï Ï Ï ÏÏ Î
& bb67 ÏÏ ÏÏ ÏÏ ÏÏ ÏÏ ÏÏ jÏÏ ÏÏ jÏÏ ÏÏ ÏÏ ÏÏ ÏÏ ÏÏ ÏÏ ÏÏ ÏÏ ÏÏ ÏÏ ÏÏ ÏÏ ÏÏ ÏÏ ÏÏ ÏÏ ÏÏ ÏÏ
U
& bb73 jÏÏ ä ä jÏÏ ÏÏ ÏÏ ÏÏ ÏÏ ÏÏ ÏÏ ÏÏ ÏÏ ÏÏ ÏÏ ÏÏ ÏÏ ä JÏÏ ÏÏ ÏÏ ÏÏ ÏÏ ÏÏ ÏÏ ÏÏ JÏÏ ÏÏ
jÏÏ ÏÏ
& bb79 ÏÏ ÏÏ ÏÏ ÏÏ ÏÏ ÏÏ ÏÏ ä jÏÏ ÏÏ ÏÏ ÏÏ ÏÏ ÏÏ ÏÏ ÏÏ ÏÏ ÏÏ ÏÏ ÏÏ ÏÏ ÏÏ ÏÏ ÏÏ ÏÏ ÏÏ ä
jÏÏ ÏÏ
& bb85
ÏÏ ÏÏ ÏÏ ÏÏ ÏÏ ÏÏ ÏÏ ÏÏ ÏÏ ÏÏ ÏÏ JÏÏ ÏÏjÏÏ ÏÏ ä jÏÏ ÏÏ ÏÏ ÏÏ ÏÏ ÏÏ ÏÏ ÏÏ ÏÏ ÏÏ ÏÏ ÏÏ
& bb91 ÏÏ JÏÏ ÏÏ
jÏÏrit.
ÏÏ Î ÏÏ ÏÏ Î ä JÏÏa tempo ÏÏ ÏÏ ÏÏ ÏÏ ÏÏ ÏÏ ÏÏ Î Î

& bb 86Marimba Î . ..ÏÏ ..ÏÏ ..ÏÏ ..ÏÏ ..ÏÏ ..ÏÏ ..ÏÏ ..ÏÏ ..ÏÏ ÏÏ ÏÏ ÏÏ ÎjÏÏ Ï Ï ä Ï Ï Ï Ï
4
Ï Ï Ï ä Ï Ï Ï ä Ï Ï Ï Ï4
Ï Ï Ï ä Ï
& bb7 Ï Ï ä Ï Ï Ï Ï4
Ï Ï Ï ä Ï ÏÏ ÏÏ ÏÏ ä ÏÏ ÏÏ ÏÏ ÏÏ ä ÏÏ ÏÏ ÏÏ ÏÏ ä ÏÏ ÏÏ ÏÏ ÏÏ ä ÏÏ ÏÏ ÏÏ ÏÏ ä ÏÏ
& bb13 ÏÏ ÏÏ ÏÏ äÏÏ ÏÏ ÏÏ ÏÏ ä ÏÏ Ç
2Ç2
Ç2 ÏÏ ä ÏÏÏÏ4
Ï Ï Ï ä Ï ÏÏäÏÏÏÏ4
ÏÏÏä Ï
& bb23 Ï Ï ä Ï Ï Ï Ï4
Ï Ï Ï ä Ï ÏÏ ÏÏ ÏÏ ä ÏÏ Ï Ï ä Ï Ï Ï Ï4
Ï Ï Ï ä Ï ÏÏ ÏÏ ÏÏ ä ÏÏ ÏÏ ÏÏ Ï ä ÏÏ ÏÏ Ï Ï ä ÏÏ ÏÏ Ï Ï Ï ÏÏ Ï Ï ä Ï
& bb30 ä Ï Ï jÏÏ Ï Ï ä Ï
jÏ Ï jÏ ÏÏ Ï Ï ÏÏ Ï ä ÏÏ ÏÏ ä Ï Ï ÏjÏ ÏJÏ Ï ä ÏÏÏ ÏÏ ÏÏ ä ÏÏ Ï Ï ä Ï Ï Ï Ï
4
Ï Ï Ï ä Ï ÏÏ ÏÏ ÏÏ ä ÏÏ
& bb37 ÏÏ ÏÏ ÏÏ ä ÏÏ ÏÏ ÏÏ ÏÏ ä ÏÏ Ç
2Ç2
Ç2 ÏÏ ä ÏÏÏÏ4
Ï Ï Ï ä Ï ÏÏ ÏÏ ÏÏ ä ÏÏ
& bb47 ÏÏ ÏÏ ÏÏ ä ÏÏ
ÏÏ ÏÏ ÏÏ ä ÏÏ Ç2
Ç2
& bb53 ÏÏ ÏÏ Ï JÏ ÏÏ ÏÏ ÏÏ ÏÏ ä ÏÏ ÏÏ ÏÏ Ï ä ÏÏ ÏÏ ÏÏ Ï ä
jÏÏ ä ÏÏ ÏÏ Ï Ï ÏÏ Ï ÏÏ ÏÏ ä ÏÏ JÏÏÏÏ ÏÏ ÏÏ ÏÏ ÏÏ ä ÏÏ ÏÏ ÏÏ ÏÏ
Musical piece # 4

& bb61 ÏÏ ÏÏ ÏÏ ÏÏ ÏÏ ä ÏÏ ÏÏ ÏÏ ÏÏ ÏÏ ÏÏ ÏÏ ÏÏ ÏÏ ÏÏ ÏÏ ÏÏ JÏÏ ÏÏ JÏÏ ÏÏ ÏÏ ÏÏ ÏÏ ä ÏÏ
& bb67
ÏÏ ÏÏ ÏÏ ä jÏÏ ä ÏÏ ÏÏ ÏÏ äjÏÏ ä ÏÏ ÏÏ ÏÏ ä ÏÏ ÏÏ ÏÏ ÏÏ ä ÏÏ Ç
2Ç2
& bb75
Ç2
Ç2
Ç2 Ï Ï ä Ï Ï Ï Ï4
Ï Ï Ï ä Ï Ï Ï ä Ï Ï Ï Ï4
Ï Ï Ï ä Ï
& bb83 ÏÏ ÏÏ ÏÏ Ï ÏÏ Ï ÏÏ ÏÏ ÏÏ ä ÏÏ ÏÏ ÏÏ Ï Ï ÏÏ Ï ÏÏ ÏÏ Ï ÏÏ Ï Ï ä Ï Ï Ï Ï
4
Ï Ï Ï ä Ï ÏÏ ÏÏ ÏÏ ä ÏÏ
& bb .. .. .. ..89 ÏÏ ÏÏ ÏÏ ä ÏÏ ÏÏ ÏÏ ÏÏ ä ÏÏ Ç
2 ÏÏ ÏÏ ÏÏ ä ÏÏ ÏÏ ÏÏ ÏÏ ä ÏÏ Ç2
& bb .. ..97 ÏÏ ÏÏ ÏÏ ä ÏÏ ÏÏ ÏÏ ÏÏ ä ÏÏ Ç
2 ÏÏ ÏÏ ÏÏ ä ÏÏ ÏÏ ÏÏ ÏÏ ä ÏÏ ÏÏ ÏÏ ÏÏ ä ÏÏ ÏÏ ÏÏ ÏÏ ä ÏÏ
& bb105 ÏÏ ÏÏ ÏÏ ä ÏÏ ÏÏ ÏÏ ÏÏ ä ÏÏ ÏÏ ÏÏ ÏÏ ä ÏÏ ÏÏ ÏÏ ÏÏ ä ÏÏ ÏÏ ÏÏ ÏÏ ä ÏÏ ÏÏ ÏÏ ÏÏ ä ÏÏ
& bb .. ..111 ÏÏ ÏÏ ÏÏ ä ÏÏ ÏÏ ÏÏ ÏÏ ä ÏÏ Ç
2 ÏÏ ÏÏ ÏÏ ä ÏÏ ÏÏ ÏÏ ÏÏ ä ÏÏ Ç2
& bb .. ..119 ÏÏ ÏÏ ÏÏ ä ÏÏ ÏÏ ÏÏ ÏÏ ä ÏÏ ÏÏ ÏÏ ÏÏ ä ÏÏ ÏÏ ÏÏ ÏÏ Î .
ÏÏ ÏÏ ÏÏ ä ÏÏ ÏÏ ÏÏ ÏÏ ÏÏ ÏÏ ä

& bb125 ÏÏ ÏÏ ÏÏ ä ÏÏ ÏÏ ÏÏ ÏÏ ä ÏÏ ÏÏ ÏÏ ÏÏ ä ÏÏ ÏÏ ÏÏ ÏÏ ä ÏÏ ÏÏ ÏÏ ÏÏ ä ÏÏ ÏÏ ÏÏ ÏÏ ä ÏÏ
& bb131 ÏÏ ÏÏ ÏÏ ä ÏÏ ÏÏ ÏÏ ÏÏ ä JÏÏ ä Ç
2Ç2 ÏÏ ÏÏ ÏÏ ä ÏÏ ÏÏ ÏÏ ÏÏ ä ÏÏ
& bb .. .. .. ..139 ÏÏ ÏÏ ÏÏ ä ÏÏ ÏÏ ÏÏ ÏÏ ä ÏÏ Ç
2 ÏÏ ÏÏ ÏÏ ä ÏÏ ÏÏ ÏÏ ÏÏ ä ÏÏ Ç2
& bb .. ..147 ÏÏ ÏÏ ÏÏ ä ÏÏ ÏÏ ÏÏ ÏÏ ä ÏÏ Ç
2 ÏÏ ÏÏ ÏÏ ä ÏÏ ÏÏ ÏÏ ÏÏ ä ÏÏ
& bb153 ÏÏ ÏÏ ÏÏ Ï ÏÏ Ï ÏÏ Ï Ï Î . ÏÏ Ï Ï Ï Î . ..ÏÏ ..ÏÏ Î .

& bb 43Marimba ÏÏ ÏÏ ÏÏ ÏÏ ÏÏ ÏÏ ÏÏ ä ÏÏ ÏÏ ÏÏ ÏÏ ÏÏ ÏÏ ÏÏ ÏÏ ÏÏ ÏÏ ÏÏ ÏÏ ÏÏ ÏÏ ÏÏ ÏÏ ÏÏ
& bb8 ÏÏ ÏÏ ÏÏ Î ÏÏ ÏÏ ä ÏÏ Î Î ÏÏ ÏÏ ÏÏ ÏÏ ÏÏ ÏÏ ÏÏ ÏÏ Î ÏÏ ÏÏ
jÏÏ ÏÏ JÏÏ ÏÏ ÏÏ ÏÏ ÏÏ
& bb15
JÏÏ ÏÏ ÏÏ ä ÏÏ ÏÏ ÏÏÏÏ ÏÏ
3
ä JÏÏ ÏÏ ÏÏ ÏÏÏÏ ÏÏ ÏÏ Î ÏÏ ÏÏ ÏÏ ÏÏ ÏÏ ÏÏ ä JÏÏ ÏÏ ÏÏ ÏÏ ÏÏ ä JÏÏ
& bb22 ÏÏ ÏÏ ä JÏÏ JÏÏ ÏÏU ÏÏU jÏÏ
U ÏÏ ÏÏ ÏÏ ÏÏ3
ÏÏ Î ä JÏÏ ä JÏÏ ÏÏ ÏÏ ÏÏ ÏÏ ÏÏ ÏÏ ÏÏ ÏÏ ÏÏ ÏÏ ÏÏ ÏÏ ÏÏ ÏÏ ÏÏ ÏÏ ÏÏ
& bb29 ÏÏ ÏÏ ÏÏ ÏÏ ÏÏ ÏÏ ÏÏ ÏÏ ÏÏ ÏÏ ÏÏ ÏÏ ÏÏ ÏÏ ÏÏ ÏÏ ÏÏ ÏÏ ÏÏ ÏÏ ÏÏ ÏÏ ÏÏ ÏÏ ÏÏ ÏÏ ä jÏÏ ÏÏ ÏÏ ÏÏ ÏÏ ÏÏ ÏÏ ÏÏ ÏÏ
& bb35 ÏÏ ÏÏ ä JÏÏ ÏÏ ÏÏ ÏÏ ÏÏ ÏÏ ÏÏ ÏÏ ÏÏ ÏÏ ÏÏ ä JÏÏ ÏÏ ÏÏ ÏÏ ÏÏ
ÏÏ ÏÏ ÏÏ ÏÏ ÏÏ ÏÏ ä jÏÏ ÏÏ ÏÏ ÏÏ ÏÏ ä JÏÏ ÏÏ ÏÏ
& bb41 ÏÏ ÏÏ ä JÏÏ ÏÏ
ÏÏ ÏÏ ÏÏ ÏÏ ÏÏ ÏÏ ÏÏ ÏÏ ÏÏ ä JÏÏ ÏÏ ÏÏ ÏÏ ÏÏ ÏÏ ÏÏ ÏÏ ÏÏ ÏÏ ÏÏ ä jÏÏ ÏÏ ÏÏ ÏÏ ÏÏ ÏÏ ÏÏ ÏÏ ÏÏ
& bb47 ÏÏ ÏÏ ä jÏÏ ÏÏ ÏÏ ÏÏ ÏÏU ÏÏ ÏÏ ÏÏ ä JÏÏ ÏÏ ÏÏ Î Î
ÏÏ ÏÏ ÏÏ ÏÏ ÏÏ ÏÏ ÏÏ ÏÏ ÏÏ ÏÏ Î ÏÏ ÏÏ ÏÏ ÏÏ ÏÏ ÏÏ
Musical piece # 5

& bb54 ÏÏ ÏÏ ÏÏ ÏÏ Î ÏÏ ÏÏ ÏÏ ÏÏ ÏÏ ÏÏ ÏÏ ÏÏ ÏÏ ÏÏ ÏÏ ÏÏ ÏÏ ÏÏ ÏÏ ÏÏ ÏÏ
UÎ ä jÏÏ ÏÏ ÏÏ ÏÏ ÏÏ ÏÏ ÏÏ ÏÏ ÏÏ
& bb60 ÏÏ ÏÏ ä JÏÏ ÏÏ ÏÏ ÏÏ ÏÏ ÏÏ ÏÏ ÏÏ ÏÏ ÏÏ ÏÏ ä JÏÏ ÏÏ ÏÏ ÏÏ ÏÏ
ÏÏ ÏÏ ÏÏ ÏÏ ÏÏ ÏÏ ä jÏÏ ÏÏ ÏÏ ÏÏ ÏÏ ä JÏÏ ÏÏ ÏÏ
& bb66 ÏÏ ÏÏ ä JÏÏ ÏÏ
ÏÏ ÏÏ ÏÏ ÏÏ ÏÏ ÏÏ ÏÏ ÏÏ ÏÏ ä JÏÏ ÏÏ ÏÏ ÏÏ ÏÏ ÏÏ ÏÏ ÏÏ ÏÏ ÏÏ ÏÏ ä jÏÏ ÏÏ ÏÏ ÏÏ ÏÏ ÏÏ ÏÏ ÏÏ ÏÏ
& bb72 ÏÏ ÏÏ ä jÏÏ ÏÏ ÏÏ ÏÏ ÏÏU ÏÏ ÏÏ ÏÏ ÏÏ ÏÏ
rit. ÏÏ Î ÏÏÏÏ Î Î
& bb 42MarimbaÏ Ï Ï Ï Ï Ï Ï Ï JÏ ä Ï Ï Ï
3 ÏÏ ÏÏ ÏÏ ÏÏ ÏÏ ÏÏ ÏÏ ÏÏ Ï ÏÏ Ï ÏÏ ÏÏ ÏÏ Ï ÏÏ Ï ÏÏ Ï ÏÏ
& bb9 ÏÏ ÏÏ Ï ÏÏ ÏÏ ÏÏ ÏÏ ÏÏ Ç
2Ç2 ÏÏ ÏÏ Ï ÏÏ ÏÏ ÏÏ Ï ÏÏ ÏÏ
3
ÏÏ ÏÏ Ï ÏÏ ÏÏ ä3 3
& bb18 ÏÏ ÏÏ Ï ÏÏ ÏÏ ä
3 3 ÏÏ ÏÏ Ï ÏÏ ÏÏ ä3 3 ÏÏ ÏÏ ä ÏÏ ÏÏ ä
3 3
ÏÏ ÏÏ ÏÏ Ï ÏÏ Ï Ï Ï ÏÏ ÏÏ Ï ÏÏ Ï ÏÏ Ï ÏÏ Ç2
& bb27
Ç2
Ç2
Ç2
Ç2 ÏÏ ÏÏ ÏÏ ÏÏ ÏÏ ÏÏ ÏÏ ÏÏ
& bb37 ÏÏ ÏÏ ÏÏ ÏÏ ÏÏ Ï ÏÏ Ï ÏÏ ÏÏ ÏÏ ÏÏ ÏÏ ÏÏ Ï ÏÏ ÏÏ ÏÏ ÏÏ Ï ÏÏ ÏÏ ÏÏ Ï ÏÏ ÏÏ ÏÏ ÏÏ Ï ÏÏ Ï ÏÏ
& bb .. ..45 ÏÏ ÏÏ Ï ÏÏ Ï ÏÏ Ï ÏÏ Ç
2Ç2
Ç2
& bb .. ..53 ÏÏ ÏÏ Ï ÏÏ Ï ÏÏ Ï ÏÏ Ç
2Ç2
Ç2
& bb .. ..61 ÏÏ ÏÏ Ï ÏÏ Ï ÏÏ Ï ÏÏ Ç
2Ç2
Ç2
Musical piece # 6

& bb .. ..69 ÏÏ ÏÏ Ï ÏÏ Ï ÏÏ Ï ÏÏ Ç
2Ç2
Ç2
& bb .. ..77 ÏÏ ÏÏ Ï ÏÏ Ï ÏÏ Ï ÏÏ Ç
2Ç2
Ç2
& bb ..85 ÏÏ ÏÏ ÏÏ ÏÏ ÏÏ ÏÏ ÏÏ Ï Ï Ï ÏÏ Ï Ï Ï ÏÏ Ï Ç
2Ç2
& bb ..93
Ç2
Ï Ï ÏÏ Ï Ï Ï ÏÏ Ï Ï Ï ÏÏ Ï Ï ÏÏ Ï ÏÏ Ï Ï JÏÏ ä

& b 44 ..Marimba jÏÏ ÏÏ ÏÏ ÏÏ ÏÏ ÏÏ ÏÏ ÏÏ ÏÏ ÏÏ ÏÏ ÏÏ ÏÏ ÏÏ ÏÏ ÏÏ ÏÏ ÏÏ ÏÏ ÏÏ ÏÏ ÏÏ ÏÏ ÏÏ ÏÏ ä jÏÏ
& b4
ÏÏ ÏÏ ÏÏ ÏÏ ÏÏ ÏÏ ÏÏ ÏÏ ÏÏ ÏÏ ÏÏ ÏÏ ÏÏ ÏÏ ÏÏ ÏÏ ÏÏ ÏÏ ÏÏ ÏÏ ÏÏ ÏÏ ÏÏ ÏÏ ÏÏ ÏÏ ÏÏ ÏÏ úú ÏÏ ÏÏ ÏÏ ÏÏ ÏÏ ÏÏ
& b ..10
ÏÏ Î Î äjÏÏ ÏÏ ÏÏ ÏÏ ÏÏ ÏÏ úú ÏÏ Î Î ä
jÏÏ ÏÏ ÏÏ ÏÏ ÏÏ ÏÏ Î ÏÏ ÏÏ ÏÏ ÏÏ1.
ÏÏ ÏÏ Î ä jÏÏ
& b17 2.
ÏÏ ÏÏ î ÏÏ ÏÏ ÏÏ ÏÏ ÏÏ ÏÏ úú ÏÏ Î ÏÏ ÏÏ ÏÏ ..ÏÏb JÏÏ úú ÏÏ Î ÏÏ ÏÏ ÏÏ ÏÏ ÏÏ ÏÏ úú ÏÏ Î ÏÏ ÏÏ ÏÏ..ÏÏb JÏÏ
& b25 úú Î ä JÏÏ ÏÏ ÏÏ ÏÏ ÏÏ úú ÏÏ Î ÏÏ ÏÏ
ÏÏb ÏÏ úú ÏÏ ÏÏ ÏÏ úú ÏÏ ÏÏ Ï úú ÏÏ ÏÏ ..ÏÏb JÏÏ..ÏÏ jÏÏ úú ÏÏ ÏÏ ÏÏ
& b34 úú ÏÏ ÏÏ ÏÏ úú ÏÏ ÏÏ ..ÏÏb JÏÏ
..ÏÏ jÏÏ úú ÏÏ ä jÏÏ ÏÏ ÏÏ ÏÏ ÏÏ ÏÏ ÏÏ ÏÏ ÏÏ ÏÏ ÏÏ ÏÏ ÏÏ ÏÏ ÏÏ ÏÏ ÏÏ ÏÏ ÏÏ
& b40
ÏÏ ÏÏ ÏÏ ÏÏ ÏÏ ÏÏ ä jÏÏ ÏÏ ÏÏ ÏÏ ÏÏ ÏÏ ÏÏ ÏÏ ÏÏ ÏÏ ÏÏ ÏÏ ÏÏ ÏÏ ÏÏ ÏÏ ÏÏ ÏÏ ÏÏ ÏÏ ÏÏ ÏÏ ÏÏ ÏÏ ÏÏ ÏÏ ÏÏ ÏÏ ÏÏ úú ÏÏ ÏÏ
& b46
ÏÏ ÏÏ ÏÏ ÏÏ ÏÏ Î Î äjÏÏ ÏÏ ÏÏ ÏÏ ÏÏ ÏÏ úú ÏÏ Î Î ä
jÏÏ ÏÏ ÏÏ ÏÏ ÏÏ ÏÏ Î ÏÏ ÏÏ ÏÏ ÏÏ ÏÏ ÏÏ î
Musical piece # 7
Supplement 4
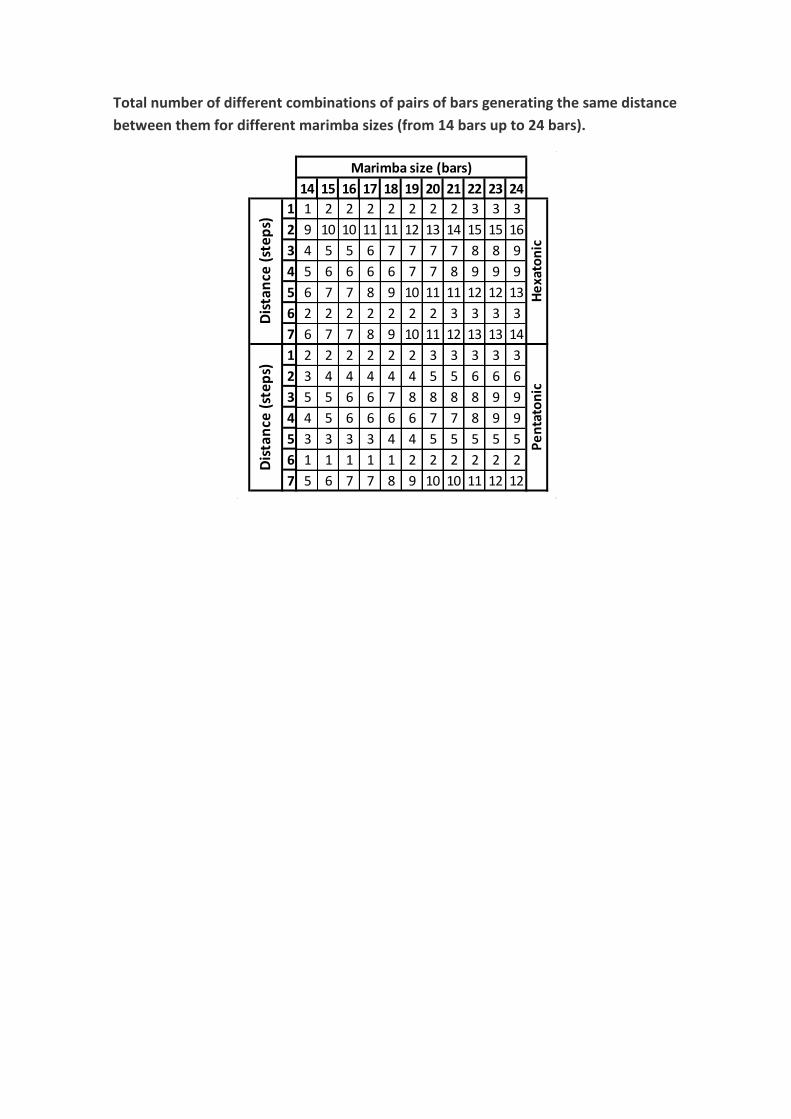
Total number of different combinations of pairs of bars generating the same distance
between them for different marimba sizes (from 14 bars up to 24 bars).
14 15 16 17 18 19 20 21 22 23 24
1 1 2 2 2 2 2 2 2 3 3 3
2 9 10 10 11 11 12 13 14 15 15 16
3 4 5 5 6 7 7 7 7 8 8 9
4 5 6 6 6 6 7 7 8 9 9 9
5 6 7 7 8 9 10 11 11 12 12 13
6 2 2 2 2 2 2 2 3 3 3 3
7 6 7 7 8 9 10 11 12 13 13 14
1 2 2 2 2 2 2 3 3 3 3 3
2 3 4 4 4 4 4 5 5 6 6 6
3 5 5 6 6 7 8 8 8 8 9 9
4 4 5 6 6 6 6 7 7 8 9 9
5 3 3 3 3 4 4 5 5 5 5 5
6 1 1 1 1 1 2 2 2 2 2 2
7 5 6 7 7 8 9 10 10 11 12 12
Marimba size (bars)
Dis
tan
ce (
ste
ps)
Dis
tan
ce (
ste
ps)
He
xato
nic
Pe
nta
ton
ic

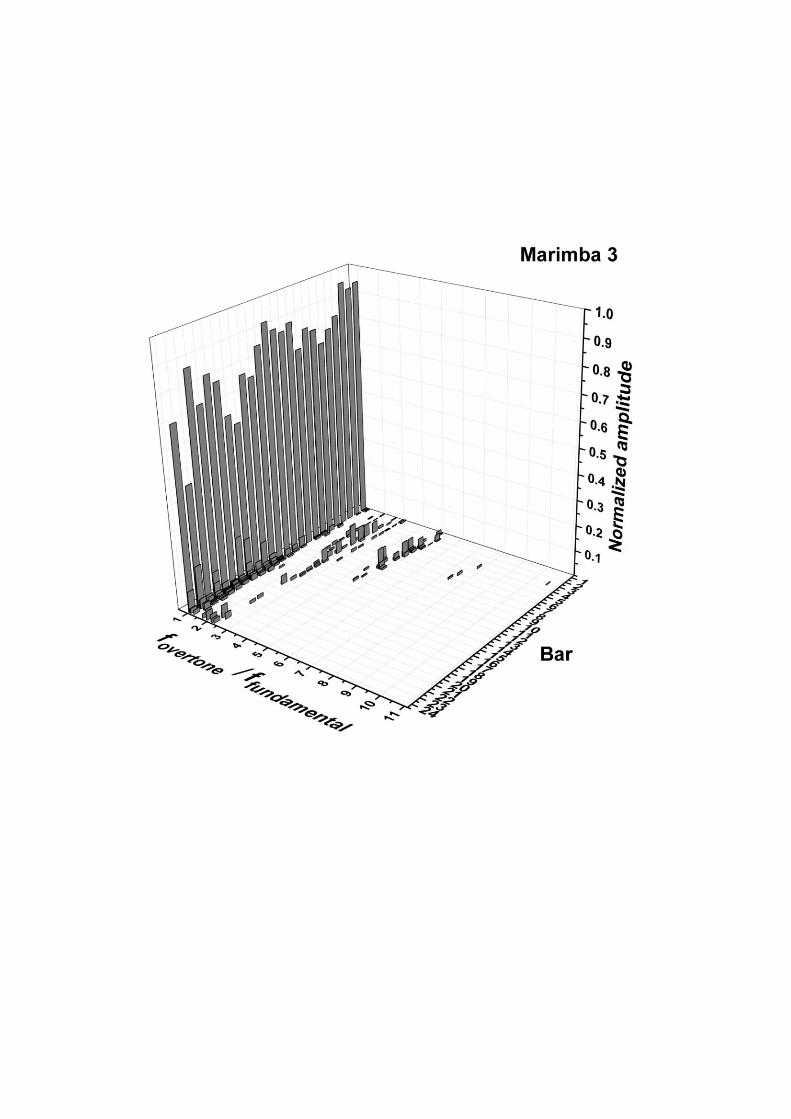
Supplement 5

Normalized amplitude for the first ten overtones produced by each bar with its corresponding resonator. The
first bar of each marimba corresponds to the lowest frequency and the last bar to the highest one.


.