interplay between competition and evolution in invaded and
TRANSCRIPT

University of Montana University of Montana
ScholarWorks at University of Montana ScholarWorks at University of Montana
Graduate Student Theses, Dissertations, & Professional Papers Graduate School
2012
Interplay between competition and evolution in invaded and native Interplay between competition and evolution in invaded and native
plant communities plant communities
Daniel Atwater The University of Montana
Follow this and additional works at: https://scholarworks.umt.edu/etd
Let us know how access to this document benefits you.
Recommended Citation Recommended Citation Atwater, Daniel, "Interplay between competition and evolution in invaded and native plant communities" (2012). Graduate Student Theses, Dissertations, & Professional Papers. 589. https://scholarworks.umt.edu/etd/589
This Dissertation is brought to you for free and open access by the Graduate School at ScholarWorks at University of Montana. It has been accepted for inclusion in Graduate Student Theses, Dissertations, & Professional Papers by an authorized administrator of ScholarWorks at University of Montana. For more information, please contact [email protected].

INTERPLAY BETWEEN COMPETITION AND EVOLUTION IN INVADED AND
NATIVE PLANT COMMUNITIES
BY
DANIEL Z. ATWATER
B. S., UNIVERSITY OF KANSAS, 2004
Dissertation
presented in partial fulfillment of the requirements
for the degree of
Doctor of Philosophy
The University of Montana
Missoula, Montana
May 2012
Approved by:
Perry Brown, Associate Provost for Graduate Education
Graduate School
Ragan M. Callaway, Chair
Division of Biological Sciences
Douglas J. Emlen
Division of Biological Sciences
Lila Fishman
Division of Biological Sciences
Laurie B. Marczak
College of Forestry and Conservation
John L. Maron
Division of Biological Sciences

ii
ABSTRACT
Atwater, Daniel Z., Ph.D., May 2012 Organismal Biology and Ecology
INTERPLAY BETWEEN COMPETITION AND EVOLUTION IN INVADED PLANT COMMUNITIES
Chairperson: Dr. Ragan M. Callaway
The distributions and abundances of organisms are affected by ecological processes, such
as competition, predation, and abiotic stress, and these processes can also produce rapid
evolutionary change in plant communities. Although our understanding of ecological and
evolutionary interactions is growing, so far little is known about how competition among plants
interacts with evolution to shape communities. In my dissertation, I use species invasions to
investigate the evolutionary and ecological consequences of plant interactions and their effects
on plant community assembly.
In my first chapter, I investigated complex ecological interactions between Euphorbia
esula, an invasive plant, and Balsamorrhiza sagittata, a native plant. I found that direct negative
effects of Euphorbia on Balsamorrhiza, due to competition, were greatly reduced by indirect
positive effects. In the second chapter, I investigated whether selection favored competitive
“suppression” or “tolerance” strategies in the native Pseudoroegneria spicata when competing
with the invasive Centaurea stoebe. I found that tolerance had far greater fitness benefits than
suppression. This observation has important consequences for understanding the outcome of
evolution in plant communities. In my third chapter, I investigated the ecological consequences
of intraspecific diversity in Pseudoroegneria. I found that functional diversity within the species
increased ecosystem productivity, and that this pattern was strongest for ecotypes from mesic
environments, suggesting that adaptive variation influences emergent consequences of
intraspecific interactions. Finally, in my fourth chapter I found evidence that selection by
Euphorbia on native and invasive grasses influenced how those grasses responded to other
competitors, herbivory, and changes in resource availability. I also found evidence that this
selection varied among sites in a manner akin to a geographic mosaic. Together, these chapters
demonstrate how plant invasions can inform our understanding of interactions between
ecological and evolutionary processes that affect plant community assembly.

iii
ACKNOWLEDGEMENTS
I am indebted to all of the coworkers, teachers, friends, and family members who carried
me through all of the challenges involved in producing this dissertation. Without you all, this
would not have been possible, and I thank you.
To my committee, I thank you for the feedback and attention that improved my ability to
think as a scientist. I know that you have made my research better and I hope that the benefits of
your guidance are clear in the final draft of this thesis.
To my coworkers, you not only helped me keep my projects in motion, but you also made
them better. Although I thank everybody who worked in the Callaway Lab, I worked most
closely with Carolyn Bauer, Annalisa Ingegno, Becky Fletcher, and Emmanuel Matos-Negrón,
who worked hard in the field and in the lab and who truly made it fun to show up for work every
day. In particular, however, I must thank David Hooper, who worked tirelessly to help me make
my deadlines in the chaotic final weeks before this dissertation was due.
To all of my teachers and former advisors, I learned everything I know about science
from you, and I am grateful. To my Ph. D. advisor, Ray Callaway, I thank you for providing me
with the most fertile possible environment for my research. You were always available when I
needed to discuss my ideas, and you provided me with encouragement and the freedom to follow
my interests and choose my own path through my dissertation. I learned from you about how to
be a scientist, but most importantly you taught me what it means to be a mentor.
Lastly, I dedicate this dissertation to my family and friends, who kept me going when
times were difficult and my confidence, wavered. In particular I thank Nora Lahr, who, in
addition to her friendship and support, helped with my research and applied her considerable
writing skills to improving everything written in this thesis.

iv
PREFACE
Plant competition is one of the best studied ecological interactions, and its effects on the
ecology of natural systems are well understood at almost all levels of organization (Hairston et
al. 1960; Tilman 1982; Grace & Tilman 1990; Weiner 1990). However, with the exception of a
handful of studies demonstrating that invasive plants cause selection on neighboring native
plants (Callaway et al. 2005; Lau 2006; Mealor and Hild 2006; Mealor and Hild 2007; Cipollini
and Hurley 2008; Leger 2008; Ferrero-Serrano et al. 2010; Rowe and Leger 2011; Goergen et al.
2011), little is known about the evolutionary consequences of plant competition (Dayan &
Simberloff 2005; Strauss et al. 2006) or the ecological consequences of rapid evolution in plant
communities. Because rapid evolution may have important ecological consequences (Thompson
1998; Carroll et al. 2007; Fussmann et al. 2007; Kinnison and Hairston 2007), this may be an
important gap in our understanding of the ecological consequences of plant competition (Fig. 1).
In this dissertation, I explore the ecological and evolutionary consequences of plant interactions
from multiple perspectives, in the context of
plant invasions. Exotic plant invasions provide a
useful context for this research because of their
intense effects on the ecology of plant
communities (Braithwaite et al. 1989; Memmott
et al. 2000; Grigulis et al. 2001; Ridenour and
Callaway 2001; Maron and Marler 2008a;
Hejda et al. 2009; Vilá et al. 2011) and native
plant demography (Gordon 1998; Maron and
Marler 2008b, Atwater et al. 2011), and because
FIG. 1: Both ecological and evolutionary
processes influence interactions between
plants and the environment. In this
dissertation I test multiple links between
ecology, evolution, and environment in
plant communities, and their influence on
community and ecosystem processes.

v
plant invasions may lead to strong evolutionary forces (Strauss et al. 2006).
In Chapter 1 of this dissertation, I present novel evidence that direct negative effects of
invasive Euphorbia esula (leafy spurge) on native Balsamorhiza sagittata (arrowleaf balsamroot)
are reduced roughly 75% due to indirect interactions with native plants and herbivores (Atwater
et al. 2011). While I do not explicitly discuss these results in the context of evolution, they
suggest that indirect interactions with invasive plants are an important and complex component
of the overall interaction between native and invasive plants. The evolutionary consequences of
such interactions for plant communities may also be complex.
In Chapter 2, I use computational models to simulate invasion of Pseudoroegneria
spicata (bluebunch wheatgrass, a native bunchgrass) populations by Centaurea stoebe (spotted
knapweed, an invasive forb). Contrary to current theoretical predictions (Miller and Werner
1987; Aarssen 1989; Goldberg 1990), my results indicate that tolerance ability – i.e. the ability to
endure competition from Centaurea – is a far more important component of fitness than ability
to competitively suppress Centaurea. This occurs because the benefits of neighbor suppression
are shared among all members of a community, while the benefits of tolerance are exclusive to
each individual. Thus, I propose that competition is less like a boxing match, in which both
suppression and tolerance determine success (Aarssen 1989; Goldberg 1990), and more like a
demolition derby, in which tolerating competition is paramount. These results have important
and wide ranging implications for the ecological and evolutionary consequences of plant
competition. One intriguing possibility is that coevolution between plants could counteract
competitive exclusion and stabilize plant communities.
In Chapter 3, I use ecotypes from throughout the native range of Pseudoroegneria spicata
to demonstrate that Pseudoroegneria populations with greater ecotypic richness have greater

vi
yield than populations with low ecotypic richness. I also find that this richness-dependent
“overyielding” is strongest in ecotypes adapted to more mesic climates. Although species
richness is known to influence productivity (Hooper et al. 2005; Balvanera et al. 2006; Cardinale
et al. 2007), the effects of intraspecific diversity on species richness are poorly understood (but
see Crutsinger et al. 2006, 2008, Cook-Patton et al. 2011). This is only the second study to show
that the relationship between intraspecific diversity and productivity is driven by complementary
interactions and not sampling effects (sensu Loreau and Hector 2001), and it is the first study to
show that local adaptation predictably influences diversity-productivity relationships. This
finding is important both because it suggests that species have a tremendous capacity to evolve
cryptic but ecologically relevant functional diversity and because it suggests that local adaptation
can predictably affect emergent properties of ecosystems.
In Chapter 4, I investigate selection caused by Euphorbia esula on Pseudoroegneria
spicata, Poa secunda (two native bunchgrasses), and Bromus japonicus (an exotic annual grass).
I find support for the hypothesis that invasive plants cause selection on native plants (Callaway
et al. 2005; Lau 2006; Mealor and Hild 2006), and I also show evidence that invaders cause
selection on other invasive species. Furthermore, I provide novel evidence that selection by
invasive plants influences how species compete with other native species, respond to abiotic
stress, and tolerate simulated herbivory. My results do not indicate that these “extended”
consequences of selection follow patterns predicted by ecological theory (Grime 1977, Herms
and Mattson 1992), however. These findings have implications for understanding the
evolutionary consequences of plant invasion and the nature of eco-evolutionary feedbacks in
plant communities.

vii
Taken together, my dissertation chapters provide important insights into the ecology and
evolution of plant interactions, particularly in the context of plant invasion. They illustrate
multiple links between ecological and evolutionary processes in plant communities, and suggest
ways in which these links could influence the distribution and abundance of plant species, and
the structuring of plant communities. Lastly, my dissertation highlights the importance of spatial
heterogeneity and fine-scale local adaptation and illustrates ways that local adaptation can
predictably influence community structure and ecosystem processes.
Note to Readers: I have formatted these chapters for submission to various journals. For this
reason, formatting of text, references, and section titles vary somewhat throughout this thesis.
LITERATURE CITED
Aarssen L. W. 1989. Competitive ability and species coexistence: A “plant’s eye” view. Oikos
56:386-401.
Atwater, D. Z., C. M. Bauer and R. M. Callaway. 2011. Indirect positive effects ameliorate
strong negative effects of Euphorbia esula on a native plant. Plant Ecology 212:1655-
1662.
Braithwaite, R. W., W. M. Lonsdale and J. A. Estbergs. 1989. Alien vegetation and native biota
in tropical Australia: The spread and impact of Mimosa pigra. Biological Conservation
48:189-201.
Callaway, R. M., W. M. Ridenour, T. Laboski, T. Weir and J. M. Vivanco JM. 2005. Natural
selection for resistance to the allelopathic effects of invasive plants. Journal of Ecology
93:576-583.

viii
Carroll, S. P., A. P. Hendry, D. N. Reznick, C. W. Fox. 2007. Evolution on ecological time-
scales. Functional Ecology 21:387-393.
Cipollini, D., and K. A. Hurley. 2008. Variation in resistance of experienced and naïve seedlings
of jewelweed (Impatiens capensis) to invasive garlic mustard (Alliaraia petiolata). Ohio
Journal of Science 108:47-49.
Cook-Patton S. C., S. H. McArt, A. L. Parachnowitch, J. S. Thaler, A. A. Agrawal. 2011. A
direct comparison of the consequences of plant genotypic and species diversity on
communities and ecosystem function. Ecology 92:915-923.
Crutsinger G. M., M. D. Collins, J. A. Fordyce, Z. Gompert, C. C. Nice, et al. 2006. Plant
genotypic diversity predicts community structure and governs an ecosystem process.
Science 313:966-968.
Crutsinger G. M., L. Souza, N. J. Sanders. 2008. Intraspecific diversity and dominant genotypes
resist plant invasions. Ecology Letters 11:16-23.
Dayan T., D. Simberloff. 2005. Ecological and community-wide character displacement: The
next generation. Ecology Letters 8:875-894.
Ferrero-Serrano A, A. Hild and B. Mealor. 2010. Can invasive species enhance competitive
ability and restoration potential in native grass populations? Restoration Ecology 19:545-
551.
Fussmann G. F., M. Loreau, P. A. Abrams. 2007. Eco-evolutionary dynamics of communities
and ecosystems. Functional Ecology 21:465-477.
Goergen, E. M., E. A. Leger and E. K. Espeland. 2011. Native perennial grasses show
evolutionary response to Bromus tectorum (cheatgrass) invasion. PLoS ONE 6:e18145.

ix
Goldberg D. E. 1990. Components of resource competition in plant communities. Pages 27-49 in
J. B. Grace, and D. Tilman, ed. Perspectives on Plant Competition. Blackburn Press,
Caldwell, NJ.
Grace J. B., D. Tilman, Eds. 1990. Perspectives on Plant Competition. Blackburn Press, USA.
Grigulis, K., A. W. Sheppard, J. E. Ash and R. H. Groves. 2001. The comparative demography
of the pasture weed Echium plantagineum between its native and invaded ranges. Journal
of Applied Ecology 38:281-290.
Grime, J. P. 1977. Evidence for the existence of three primary strategies in plants and its
relevance for ecological and evolutionary theory. American Naturalist 111:1169-1194.
Hairston N. G., F. E. Smith, L. B. Slobodkin. 1960. Community structure, population control,
and competition. American Naturalist 94:421-425.
Heijda M., P. Pyšek and V. Jarošík. 2009. Impact of invasive plants on the species richness,
diversity and composition of invaded communities. Journal of Ecology 97:393-403.
Herms, D. A. and W. J. Mattson. 1992. The dilemma of plants: to grow or defend. The Quarterly
Review of Biology 67:283-335.
Kinnison M. T., N. G. Hairston Jr. 2007. Eco-evolutionary conservation biology: Contemporary
evolution and the dynamics of persistence. Functional Ecology 21:444-454.
Lau, J.A. 2006. Evolutionary responses of native plants to novel community members. Evolution
60:56-63.
Leger, E. A. 2008. The adaptive value of remnant native plants in invaded communities: an
example from the great basin. Ecological Applications 18:1226-1235.
Loreau M., A. Hector. 2001. Partitioning selection and complementarity in biodiversity
experiments. Nature 412:72-76.

x
Maron J. L. and M. Marler. 2008a. Effects of native species diversity and resource additions on
invader impact. American Naturalist 172:S18-S33.
Maron J. L. and M. Marler. 2008b. Field-based competitive impacts between invaders and
natives at varying resource supply. Journal of Ecology 96:1187-1197.
Mealor BA and Hild AL. 2006. Potential selection in native grass populations by exotic invasion.
Molecular Ecology 15:2291-2300.
Mealor, B. A. and A. L. Hild. 2007. Post-invasion evolution of native plant populations: a test of
biological resilience. Oikos 116:1493-1500.
Memmott, J., S. V. Simon, Q. Paynter, A. W. Sheppard and P Syrett. 2000. The invertebrate
fauna on broom, Cystus scoparius, in two native and two exotic habitats. Acta Oecologia
21:213-222.
Miller T. E., and Werner P. A. 1987. Competitive effects and responses between plant species in
a first-year old-field community. Ecology 68:1201-1210.
Ridenour, W. M. and R. M. Callaway. 2001. The relative importance of allelopathy in
interference: the effects of an invasive weed on a native bunchgrass. Oecologia 126:444-
450.
Rowe, C. L. J. and E. A. Leger. 2011. Competitive seedlings and inherited traits: a test of rapid
evolution of Elymus multisetus (big squirreltail) in response to cheatgrass invasion.
Evolutionary Applications 4:485-498.
Strauss S. Y., J. A. Lau, S. P. Carroll. 2006. Evolutionary responses of native to introduced
species: What do introductions tell us about natural communities? Ecology Letters 9:357-
374.
Thompson J. N. 1998. Rapid evolution as an ecological process. TREE. 13:329-332.
xi
Thompson J. N. 2005. The Geographic Mosaic of Coevolution. University of Chicago, USA.
Tilman D. 1982. Resource Competition and Community Structure. Princeton UP, USA.
Vilá, M., J. L. Espinar, M. Hejda, P. E. Hulme, V. Jaršík, J. L. Maron, J. Pergl, U. Schaffner, Y.
Sun and P. Pyšek. 2011. Ecological impacts of invasive alien plants: a meta-analysis of
their effects on species, communities and ecosystems. Ecology Letters 14:702-708.
Weiner J. 1990. Asymmetric competition in plant populations. TREE 5:360-364.

xii
TABLE OF CONTENTS
ABSTRACT
ACKNOWLEDGEMENTS
PREFACE
TABLE OF CONTENTS
LIST OF TABLES
LIST OF FIGURES
CHAPTER 1: INDIRECT POSITIVE EFFECTS AMELIORATE STRONG
NEGATIVE EFFECTS OF EUPHORBIA ESULA ON A NATIVE PLANT
ABSTRACT
INTRODUCTION
MATERIALS AND METHODS
RESULTS
DISCUSSION
ACKNOWLEDGEMENTS
REFERENCES
TABLES
FIGURES
ii
iii
iv
xii
xv
xviii
1
1
2
4
7
8
11
11
16
18

xiii
CHAPTER 2: IS COMPETITION AMONG PLANTS MORE LIKE A BOXING
MATCH OR A DEMOLITION DERBY?
ABSTRACT
INTRODUCTION
METHODS
RESULTS
DISCUSSION
ACKNOWLEDGEMENTS
LITERATURE CITED
TABLES
FIGURES
CHAPTER 3: ECOTYPIC DIVERSITY OF A DOMINANT GRASSLAND SPECIES
INCREASES DIVERSITY THROUGH COMPLEMENTARITY
ABSTRACT
MAIN TEXT
REFERENCES AND NOTES
ACKNOWLEDGEMENTS
FIGURES
TABLES
SUPPLEMENTARY MATERIALS AND METHODS
SUPPLEMENTARY FIGURES
SUPPLEMENTARY TABLES
20
20
21
26
33
37
43
43
50
In text
52
52
52
57
61
62
64
64
69
70

xiv
CHAPTER 4: EXTENDED ECOLOGICAL CONSEQUENCES OF INVADER-
DRIVEN SELECTION
ABSTRACT
INTRODUCTION
METHODS
RESULTS
DISCUSSION
ACKNOWLEDGEMENTS
LITERATURE CITED
TABLES
FIGURES
73
73
74
76
80
82
86
86
91
94

xv
LIST OF TABLES
CHAPTER 1
TABLE 1 (P. 16): Effect of E. esula on B. sagittata size and herbivory. Data (mean +/- s.d.) are
only shown for flowering B. sagittata plants. P-values for differences in trait means, with
respect to E. esula presence, were calculated using T-tests (n = 357). These P-values are
provided for general information only, as the path analysis presented elsewhere in this
manuscript provides a more rigorous test of the effects of E. esula on B. sagittata.
TABLE 2 (P. 16): Direct and indirect effects of E. esula on B. sagitatta size (SPCA). Standardized
coefficients are shown with un-standardized coefficients in parentheses.
CHAPTER 2
TABLE 1 (P. 50): Competitive ranks of ecotypes in the single-ecotype and multi-ecotype models.
Competitive ranks of P. spicata ecotypes from the single-ecotype models “Rank Single”
and multi-ecotype models “Rank Multi” are shown, along with the RII values for each
ecotype. Data are sorted in terms of single-ecotype model rank.
TABLE 2 (P. 51): Results of linear regressions of ecotype competitive rank against tolerance and
suppression. Regressions were performed on both the single-ecotype (Single) and multi-
ecotype (Multi) models, using RIIs gathered both from 23 natural ecotypes (Empirical)
and from 289 simulated ecotypes (Simulated). For each model, the determination
coefficient (R2), sample size (n), and p value (p) are shown. The separate individual

xvi
contribution of both tolerance and suppression traits on rank for each regression is
indicated by the standardized regression coefficient of that trait (β), percent of total
explained variance accounted for by that trait (% Exp), and p value (p).
CHAPTER 3
TABLE 1 (P. 64): Results of linear models of total overyielding, complementarity, and selection
effect (g/m2) against main effects and interaction effects of ecotypic richness and
fungicide treatment.
TABLE S1 (P. 70): Results of a linear model of natural log-transformed per-plant yield against
ecotypic richness, fungicide treatment, and ecotypic identity.
TABLE S2 (P. 71): Ecotype locality data, including latitude and longitude, location of nearest
COOP station, average July maximum temperature, number of days per year over 32.2
°C, spring precipitation, summer precipitation, yearly total precipitation, heating degree
days below 65 °F (HDD), cooling degree days above 55 °F (CDD), and climate factor
scores (CPCA1 and CPCA2). Precise coordinates of the locality for Ecotype 4 (Goldar)
are unknown, but the collection is known to be from Asotic County, WA, USA.
Common garden conditions are also shown for both years of the study (Garden 2010 and
Garden 2011).
TABLE S3 (P. 72): Results of principal components analysis for climate variables.

xvii
TABLE S4 (P. 72): Results of linear models of total overyielding, complementarity, and selection
effect (g/m2) against main effects and interaction effects of ecotypic richness and
fungicide treatment, using data only for the six ecotypes with known monoculture yield
(compare to Table 1).
CHAPTER 4
TABLE 1 (P. 91): Site data. An “X” indicates whether the specified site was used for that year of
study.
TABLE 2 (P. 91): Experimental design. An “X” indicates whether the specified treatment was
performed for that species.
TABLE 3 (P. 92): Results of ANOVA for 2008 experiment
TABLE 4 (P. 93): Results of ANOVA for 2010 experiment.
TABLE 5 (P. 93): Results of PCA for performance of Bromus japonicus in different treatments in
2010.

xviii
LIST OF FIGURES
PREFACE
FIGURE 1 (P. iv): Both ecological and evolutionary processes influence interactions between
plants and the environment. In this dissertation I test multiple links between ecology,
evolution, and environment in plant communities, and their influence on community and
ecosystem processes.
CHAPTER 1
FIGURE 1 (P. 18): Path analysis diagram. Arrows indicate effects of effect variables on response
variables from effect → response variable. The size of the arrow indicates the strength of
the effect. Standardized path coefficients are shown on each arrow, with unstandardized
coefficients in parentheses. All paths are significant (p < 0.05) except ‘Proximity to L.
sericeus’ → DPCA (dotted line). Direct random effects of site were also modeled for each
endogenous variable (paths not shown).
FIGURE 2 (P. 19): Frequency distribution of Balsamorhiza size PCA score. The upper panel
shows the frequency distribution for immature plants, and the lower panel shows the
distribution for flowering plants. Color indicates whether plant was located outside
(solid grey) or inside (stippled) of a Euphorbia patch. The distributions are similar,
except that very small, young plants (one or two leaves) are conspicuously absent from
Euphorbia patches.

xix
CHAPTER 2
FIGURE 1 (P. 22): The boxing match and demolition derby models of plant competition. Panel
1A depicts a “boxing match” between two competitors. In our models P. spicata is
considered to be the focal plant, and C. stoebe the antagonist, and the left and right
arrows indicate tolerance and suppression ability of P. spicata, respectively. The focal
plant can reduce the suppression it experiences from the antagonist either indirectly, by
suppressing it and thereby weakening its effects (Panel 1B), or directly by tolerating its
effects (Panel 1C). When two or more focal plants compete with an antagonist, in the
“demolition derby” scenario, suppression ability does not provide an exclusive
advantage because the advantages of reduced competition with the antagonist are shared
by both focal plants (Panel 1D). However the benefits of tolerance are not shared; if
focal plants vary in their tolerance ability, the more tolerant plant will experience
reduced competition from the antagonist and will have an advantage (grey arrow)
whenever it is present (Panel 1E).
FIGURE 2 (P. 24): A demolition derby. The winner is the last car that can still move. Offensive
drivers indirectly benefit all other competitors every time they damage or eliminate an
opponent. Because damaging opponents helps other cars on the track the soundest
strategy is to “sandbag” – i.e. to completely avoid contact with other cars. This is true
even if there are no risks to offensive driving. Because it is counter to the spirit of the
sport and unfair to more aggressive competitors, in demolition derbies – unlike plant
communities – sandbagging is not allowed.

xx
FIGURE 3 (P. 34): Tolerance and suppression abilities of the 23 ecotypes of P. spicata. Number
indicates the ID number assigned to each ecotype. The size of the circle corresponds to
the competitive rank of each ecotype in the single-ecotype simulations, with better
competitors having larger circles (see Table 1 for values). Line style indicates whether
that ecotype competitively excluded C. stoebe (dashed), coexisted with C. stoebe (solid),
or went extinct (dotted).
FIGURE 4 (P. 35): Outcome of the simulations involving 289 artificial ecotypes. Panel 4A shows
the outcome of the single-ecotype models and Panel 4B shows the outcome of the multi-
ecotype models. Color indicates the competitive rank of the ecotype with the indicated
combination of tolerance and suppression ability. Blue (upper left) indicates higher rank
and red (lower right) indicates lower rank. Panel 4A is divided into three regions by
black lines. Region 1 indicates ecotypes that could competitively exclude C. stoebe,
Region 2 indicates ecotypes that could coexist with C. stoebe, and Region 3 indicates
ecotypes that were driven extinct. These same regions are superimposed over Panel 4B.
On each graph the approximate parameter space occupied by the real ecotypes is pictured
as a box with a dotted white line. Also on Panel 4B are marks indicating the position of
five of the actual ecotypes (4: circle, 8 and 22: square, 6 and 7: triangle). These are the
survivors of the 23-, 22-, and 20-ecotype models, respectively. Although these succeeded
primarily due to their competitive response ability, the final outcome for C. stoebe is
determined by whether at least one survivor was able to competitively exclude C. stoebe
in the single-ecotype model (i.e. it whether it falls in Region 1 or 2).

xxi
FIGURE 5 (P. 36): Change in abundance of each ecotype over time in the multi-ecotype models.
The outcomes of the 23-ecotype (Panel 5A), 22-ecotype (Panel 5B), and 20-ecotype
(Panel 5C) models are shown. Each line indicates the abundance of the corresponding
ecotype as time passed in our models. The bolded, black line indicates C. stoebe
abundance. Surviving P. spicata ecotypes are labeled on each figure.
CHAPTER 3
FIGURE 1 (P. 62): Effect of ecotypic richness on total plot yield (A: R2 = 0.129, p = 0.031), and on
total overyielding (B: solid), complementarity (B: dashed), and selection effects (C:
stippled)
FIGURE 2 (P. 63): Relationship between ecotype home climate and relative yield. The climate
factor score CPCA1 is shown on the x-axis. Greater values indicate cooler, moister
conditions. Relative yield represents the difference in performance of each ecotype
relative to its monoculture yield.
FIGURE S1 (P. 69): Map of collection locations for the ecotypes used in this study.
CHAPTER 4
FIGURE 1 (P. 94): Effect of treatment and invasion status on total biomass and RMR of P. secunda (A,B),
and B. japonicus (C,D) in 2008. Color indicates whether the parent plants were inside (grey) or
outside (white) of E. esula patches. Error bars show standard error. Significant differences in
mean performance between inside and outside plants in each treatment are indicated by * (p <
0.050) or (*) (p < 0.100). ANOVA terms with p < 0.100 are displayed above each graph.

1
CHAPTER 1
INDIRECT POSITIVE EFFECTS AMELIORATE STRONG NEGATIVE EFFECTS OF
EUPHORBIA ESULA ON A NATIVE PLANT.
Abstract: Invasive plant species can have strong direct negative effects on native plants.
Depending on the nature of interactions among competitors and consumers within a community,
strong indirect interactions may either augment or offset direct effects. We used path analysis to
estimate the relative importance of direct and indirect effects of Euphorbia esula, an unpalatable
invasive plant, on Balsamorhiza sagittata, a native forb, through ‘shared defense’ and by
suppression of native competitors. Our results indicate that E. esula had strong direct negative
effects on B. sagittata, but also that its net effect was reduced by 75% due to indirect positive
effects. This reduction was due in equal parts to lessened competition from other native plants
eliminated from E. esula stands and to lower levels of herbivory inside E. esula stands,
apparently caused by indirect defense of B. sagittata by E. esula. To our knowledge, this is the
first evidence that invaders may indirectly reduce herbivory on native plants, a phenomenon that
may commonly occur with unpalatable invaders. Furthermore, our results highlight the potential
complexity of interactions between native and invasive plants.
Key words: associational resistance, indirect interactions, leafy spurge, plant invasion, path
analysis, shared defense
2
INTRODUCTION
Invaders often dominate communities in their introduced ranges, causing losses in native
species abundance and diversity (Braithwaite et al. 1989; Memmott et al. 2000; Grigulis et al.
2001) and reducing growth and reproduction of surviving native species. Direct, negative
interactions between native and invasive plants are recognized as important drivers of these
community changes (Levine et al. 2002; Hierro and Callaway 2003; Maron and Marler 2008).
However, indirect interactions between native and invasive plants may also play an important
and potentially complex role in the ecology of an invaded community, particularly because
indirect interactions with invasive plants may have strong inhibitory and facilitative effects.
Indirect interactions can have substantial effects on the organization of uninvaded plant
communities (Miller 1987; Levine 1999; Callaway 2007), but have only recently attracted the
attention of researchers studying plant invasions. Indirect interactions between native and
invasive plants can be mediated by native plants (Saccone et al. 2010), soil microbes (Callaway
et al. 2003; Klironomos 2002; Inderjit et al. 2007) or by pollinators (Munoz and Cavieres 2008),
but perhaps most importantly by herbivores (Parker et al. 2006; White et al. 2006; Meiners 2007;
Orrock et al. 2008; Pearson and Callaway 2008). Because herbivores can have such powerful
indirect effects on community composition in uninvaded systems, understanding their indirect
effects in invaded systems is also likely to be important. To our knowledge previous studies on
the indirect effects of native herbivores in plant invasions have focused on their role as causes of
invader success, but two other potential positive indirect interactions between native and invasive
plants are “shared defense” and “associational resistance.” Defenses are considered to be
“shared” when a palatable beneficiary is protected by a nearby unpalatable species. The positive
effect of growing with many other species that limit herbivory by other mechanisms, such as

3
visual or olfactory masking, is called “associational resistance” (Tahvanainen and Root 1972,
Atsatt and O’Dowd 1976, Feeny 1976, Callaway 2007).
Shared defense and associational resistance may be important processes in some plant
invasions. Although some exotic plant species evolve lower levels of defense when released
from herbivore pressure (Siemann and Rogers 2003), other invasive plant species decrease
investment in defense against specialist herbivores but increase investment in defense against
generalists (Müller-Schärer et al. 2004; Joshi and Vrieling 2005), or increase overall investment
in defense (Ridenour et al. 2008). Also, some plants may possess defensive compounds that are
novel to generalist herbivores in the introduced range and thus experience lower rates of
herbivory (Callaway and Ridenour 2004; Branson and Sword 2008; Jogesh et al. 2008; Tallamy
et al., in press; but see Lind and Parker 2010). Regardless of the underlying mechanisms,
herbivores avoid some invasive species, resulting in dramatically lower rates of herbivory on
exotic plants than native plants in some systems (Cappuccino and Carpenter 2005; Cappucino
and Arnason 2006). If invasive plant species are avoided by native herbivores in the invaded
range, palatable native plant species may benefit indirectly by growing closely to these invaders.
This might also happen any time an invasive species forms a dense thicket that obscures plants
from visual herbivores. In such a case invaders might release native plants from predation by
visual but not olfactory herbivores (as in Hambäck et al. 2003).
Euphorbia esula (leafy spurge) is one of North America’s most problematic invasive
plants due to its competitive ability and vigorous vegetative habit, but also to its toxicity and
unpalatability to grazers (Dittberner et al. 1983; Cyr and Bewley 1989; Trammell and Butler
1995). Euphorbia esula reduces native diversity in many community types (Belcher and Wilson
1989); nonetheless, some native species persist during the early stages of E. esula invasion. We

4
observed that the North American native Balsamorhiza sagittata (arrowleaf balsamroot)
maintains substantial populations in low to moderate density E. esula stands. Balsamorhiza
sagittata is a large, dominant, native forb whose shoots, flowers and seeds are commonly eaten
by native generalist herbivores such as pronghorn, bighorn sheep, mule deer and deer mice
(Wikeem and Pitt 1979, 1991; Burell 1982; USDA 1988). Seeds of B. sagittata are also
consumed by specialist insects (Amsberry and Maron 2006) that live in the seed head
(capitulum) and feed as larvae.
We hypothesized that B. sagittata growing within E. esula patches would experience
strong direct negative effects from E. esula, but that E. esula would also have indirect effects in
the form of shared defense due to its unpalatability, as well as through reduction in the density of
native competitors. We used a path analysis to estimate the relative strength of these effects
using observational data.
MATERIALS AND METHODS
We chose five sites in montane grasslands around the Missoula Valley in Western
Montana, and at each of the five sites we established a 10 m x 10 m plot in both an E. esula
invaded area and in a nearby uninvaded area. The uninvaded plot was always within 20 m of the
E. esula plot and did not differ noticeably in elevation, slope, or aspect. We chose sites where
the general plant community resembled the remnants in the E. esula patch. All of these sites
were historically used for cattle grazing, but had been set aside for conservation and were only
experiencing natural grazing by the time E. esula invasion occurred. Intense E. esula invasion
occurred relatively recently in the Missoula Valley and we estimate that dense patches became
common only within the past 15 years. Euphorbia esula is clonal and expands vegetatively from
5
the center of the colony. We located plots within several meters of the edge of active expansion
fronts, thus our plots were probably situated where E. esula had been present for only a few
years. We also chose plots that contained relatively uniform, but moderate densities of E. esula.
Our sites were located at the Cox Property (46°50’12’’N;113°57’59’’W, elev. 1265 m,
slope 13º, aspect S), the Rocky Mountain Elk Foundation reserve (46°56’17’’N;114°01’01’’W,
1130 m, 21º, W), Waterworks Hill (46°52’53’’N;113°59’08’’W, 1090 m, 18º, ENE), the North
Hills (46°53’34’’N;113°58’45’’W, 1085 m, 16º, E), and Mt. Jumbo (46°51’55’’;113°58’03’’,
1030 m, 39º, SSW). All sites had grassland plant communities dominated by B. sagittata,
Pseudoroegneria spicata (bluebunch wheatgrass), Bromus tectorum (cheatgrass) and Bromus
japonicus (Japanese brome).
From 27 June, 2008 through 7 July, 2008, we measured 1041 individual B. sagittata
plants at the five sites. We counted each B. sagittata individual within our plots and measured
canopy height, the longest diameter of the leafy canopy (plant width), number of leaves, number
of flower heads, number of damaged leaves, and gave each plant a subjective leaf damage rating
based on a scale from 0-10. We also measured the distance to the nearest B. sagittata neighbor,
distance to nearest Lupinus sericeus (if within 2 m), and distance to nearest Pseudoroegneria
spicata (if within 2 m). Lupinus sericeus and P. spicata are prominent native plants that,
together with B. sagittata, covered a majority of the landscape at the study sites (D. Atwater,
pers. obs.). We also recorded the presence of any other plant species within a 50 cm radius of
the target plant. Local E. esula density was measured as the number of living stems within a 1 m
x 1 m square centered on each B. sagittata plant.
We collected one capitulum, or seed head, from each flowering B. sagittata plant (total
n= 357) and dissected it to look for signs of herbivory. Capitula were scored positively for

6
herbivory if they contained an intact seed herbivore, boring holes, or frass (insect excreta)
produced by insect seed predators. We performed a chi-squared test of homogeneity to
determine whether herbivory was contingent on the presence of E. esula.
To generate integrative variables for B. sagittata performance we performed a principal
components analysis (PCA) on plant height, plant width, and number of leaves to create a single
score for plant size (SPCA). These variables were log-transformed to improve normality and
because herbivory is hypothesized to affect plant performance on a logarithmic scale (Rees and
Brown 1992, Hambäck & Beckerman 2003). Likewise, we performed a PCA to generate a
single, integrative variable for plant damage (DPCA) because neither the proportion of leaves
damaged per plant nor the subjective damage rating alone was a satisfactory indicator of overall
leaf damage. Factors were generated using a correlation matrix. We used a variance explained
criterion (retain enough factors to explain 70% of variance) to determine whether the data
reduction was appropriate and how many factors to retain. For both SPCA and DPCA this resulted
in a single factor being retained for further analysis. This analysis and all other analyses reported
here were performed with SPSS (SPSS, Inc., 2008-2010), unless otherwise indicated.
To determine the importance of direct and indirect effects, we conducted a path analysis
(model illustrated in Fig. 1). For this analysis, we used only data from flowering plants because
young, non-flowering plants were almost entirely absent inside of E. esula patches and would
have caused inappropriate reduction in our estimate of plant size outside of E. esula patches (Fig.
2). In the analysis, we modeled the effects of E. esula density on the performance of B. sagittata
(SPCA), allowing it to have both a direct effect and indirect effects via changes in leaf herbivory
(DPCA) and proximity of the target B. sagittata to other native plants (-1 * nearest-neighbor
distance). In our initial model, we allowed proximity of neighbors to have an effect on herbivory

7
but removed these effects from the final model because they did not contribute significantly to
the model. We used logical inference rather than model comparison to construct the final model,
and we used random site effects for each of the endogenous variables.
In our path analysis, we conducted a series of multiple linear regressions of effect
variables against response variables. The arrows in the diagram represent effect paths from one
variable to another (effect variable → response variable). The path coefficients on the diagram
are regression coefficients (β). A large value for the path coefficient indicates that changes in the
effect variable cause large changes in the response variable. To estimate the indirect effect of A
on C via B (A → B → C), we take the product of the path coefficients of A on B and of B on C
(A → B * B → C). The total effect of A on C is the sum of all direct and indirect effects of A on
C. For example, the indirect effect of E. esula density on B. sagittata size via herbivory is the
product of the path coefficient from E. esula to herbivory and from herbivory to size. To
calculate the total effect of E. esula on size, we added the coefficient of the direct path from E.
esula to size to the products of the coefficients along each of the indirect paths.
RESULTS
One factor (SPCA) was extracted from the PCA for plant size and 85.5% of variance in the
initial variables was explained by that single factor. Component loadings were: leaves = 0.903,
height = 0.885, and width = 0.935; plants with high SPCA scores were wider, taller, and had more
leaves than plants with low SPCA scores. We also extracted one factor from the PCA for leaf
damage, and 72. 7% of variance in the initial variables was explained by that factor. Component
loadings were: subjective damage = 0.853 and proportion of leaves damaged = 0.853; plants with

8
higher DPCA scores had higher subjective damage ratings and more leaves damaged than plants
with lower scores.
Relatively few small, immature plants were present inside of E. esula patches, therefore
we only considered data from flowering adult plants in further analysis (Fig. 2). Among mature
plants, those inside E. esula patches were smaller but also experienced about a 25% reduction in
herbivory compared to mature plants outside of E. esula patches (Table 1).
The path analysis (Fig. 1) suggested that B. sagittata adult size was negatively affected
by the degree of leaf herbivory (β = -0.175, p = 0.001), proximity to neighboring P. spicata (β =
-0.174, p = 0.002) and conspecific B. sagittata plants (β = -0.104, p = 0.004), and importantly, E.
esula density (β = -0.168, p = 0.002). However, because E. esula density also had strong direct
negative effects on leaf herbivory (β = -0.291, p < 0.001), and on proximity to P. spicata (β = -
0.266, p < 0.001) and conspecific B. sagittata plants (β = -0.145, p = 0.004), the indirect effects
of E. esula density on B. sagittata size were positive. As a result, the overall negative effect of
E. esula on B. sagittata size was reduced by ≈75% (from -0.145 to -0.036). Our model indicated
that indirect effects caused by changes in herbivory and in proximity to other competitors
contributed equally to the 75% amelioration of direct effects caused by E. esula (Table 2). Plants
in E. esula patches did not have reduced seed herbivory (Χ2 = 0.106, d.f. = 1, n = 1041, p =
0.744).
DISCUSSION
In this study we estimated the relative strengths of direct and indirect effects of invasive
Euphorbia esula on Montana native Balsamorhiza sagitatta plants. We hypothesized that
negative effects of association with E. esula would be reduced via protection from herbivores

9
and through reduction in the density of native competitors. To estimate the importance of these
effects, we used observational data to perform a path analysis to quantify the interactions
between these plant species. Our model required the following assumptions: 1) E. esula density
affected native plant abundance, 2) E. esula density influenced herbivory on natives and not the
opposite, and 3) herbivory negatively influenced the size of natives and not the opposite.
Our model indicated that strong indirect benefits of association with E. esula reduced the
cost of association with E. esula by about 75%. Roughly half of the indirect positive effect was
due to relief from competition with native plants inside of E. esula patches, and half was due to
reduced herbivory inside of E. esula patches, probably because native ungulates avoided grazing
in E. esula patches. Although the positive effects we observed were strong, we do not believe
that they will ultimately allow B. sagittata to persist within E. esula patches, as the overall effect
of E. esula on B. sagittata was still negative despite the strength of the indirect positive effects.
Instead, our results suggest that, for the adult plants that survived initial E. esula invasion,
the indirect effects of E. esula provided substantial benefits and may allow them to persist for
longer than might be expected if only direct costs of association with E. esula were measured.
This may be a common feature of many species invasions; such indirect benefits could occur any
time an invader was less palatable than neighbors, any time an invader reduced the abundance of
native competitors, or any time an invader obscured native plants from herbivores.
According to our model, half of the indirect benefits of association with E. esula resulted
from reduced competition from native plants. Because invasive plants often reduce the
abundance of native competitors, remaining native plants may experience relief even while
experiencing intense competition from the invader. These indirect interactions are important to
acknowledge because native plants species may respond differently to invasive species, and may

10
have different competitive effects on other natives. For example, two of the three species we
identified as native competitors in this experiment appeared to have similar negative effects on
the performance of target B. sagittata plants. In contrast, the nitrogen fixing Lupinus sericeus
trended towards a weak positive effect. Therefore, the overall cost of association with E. esula
could be expected to differ depending on the initial abundance of L. sericeus, and depending on
the degree to which these three species were affected by E. esula.
Our model also indicated that E. esula indirectly facilitated B. sagittata due to reduced
rates of leaf – but not seed – herbivory on plants inside of E. esula patches. Because it is
hypothesized that invasive plants often evolve increased defense against generalist herbivores
(Müller-Schärer et al. 2004; Joshi and Vrieling 2005), and that native generalists sometimes
cannot tolerate the chemical defenses of novel species, associational resistance could be an
important but overlooked aspect of the interactions between many native and invasive plants.
To properly test for causal relationships among the variables we measured, experimental
manipulation of native plant competition, herbivory, and E. esula density over multiple seasons
is necessary. However, in this study path analysis allowed us to explore interactions between B.
sagittata size, herbivory, native plant abundance, and E. esula density using purely observational
data. Such analyses may prove powerful in systems where logistical constraints or conservation
concerns prohibit experimental manipulation. Our results indicated that indirect interactions
among native and invasive plants can be strong, and can be an important component of the net
effects of invasive plants. A complete understanding of the ecology of species invasions, and
prediction of how native plants will respond to invasion, may therefore require consideration of
the strong indirect effects that invaders can have on native species.

11
ACKNOWLEDGEMENTS
This work was partially funded by the Howard Hughes Medical Institute and the NSF Graduate
Research Fellowship Program. The authors would also like to thank Bert Lindler and the Rocky
Mountain Elk Foundation, Morgan Valliant and the City of Missoula Parks and Recreation
Department, and Joy Sherry for use of their lands for our research. RMC thanks the NSF for
funding.
REFERENCES
Amsberry LK, Maron JL (2006) Effects of herbivore identity on plant fecundity. Plant Ecol
187:39-48
Atsatt PR, O’Dowd DJ (1976) Plant defense guilds. Science 193:24-29
Belcher JW, Wilson SD (1989) Leafy spurge and the species composition of a mixed-grass
prairie. J Range Manag 42:172-175
Braithwaite RW, Lonsdale WM, Estbergs JA (1989) Alien vegetation and native biota in tropical
Australia: The spread and impact of Mimosa pigra. Biol Conserv 48:189-201
Branson DH, Sword GA (2008) Grasshopper herbivory affects native plant diversity and
abundance in a grassland dominated by the exotic grass Agropyron cristatum. Rest Ecol
17:89-96
Burell GC (1982) Winter diets of mule deer in relation to bitterbrush abundance. J Range Manag
35:505-510
Callaway RM, Mahall BE, Wicks C, Pankey J, Zabinski C (2003) Soil fungi and the effects of an
invasive forb on grasses: Neighbor identity matters. Ecology 84:129-135

12
Callaway RM, Ridenour WM (2004) Novel weapons: Invasive success and the evolution of
increased competitive ability. Front Ecol Env 2:436-443
Callaway RM (2007) Positive Interactions and Interdependence in Plant Communities. Springer,
NY
Cappuccino N, Carpenter D (2005) Invasive exotic plants suffer less herbivory than non-invasive
exotic plants. Biol Lett 1:435-438
Cappuccino N, Arnason JT (2006) Novel chemistry of invasive exotic plants. Biol Letts 2:189-
193
Cyr DR, Bewley JD (1989) Carbon and nitrogen reserves of leafy spurge (Euphorbia esula) roots
as related to overwintering strategy. Physiol Plant 77:67-72
Dittberner PL, Olson MR (1983) The plant information network (PIN) data base: Colorado,
Montana, North Dakota, Utah, and Wyoming. FWS/OBS-83/86. Washington, DC: U.S.
Department of the Interior, Fish and Wildlife Service
Feeny P (1976) Plant apparency and chemical defense. Rec Adv Phytochem 10:1-40
Grigulis KA, Sheppard W, Ash JE, Groves RH (2001) The comparative demography of the
pasture weed Echium plantagineum between its native and invaded ranges. J App Ecol
38:281–290
Hambäck PA, Pettersson J, Ericson L (2003) Are associational refuges species-specific? Funct
Ecol 17:87-93
Hierro JL, Callaway RM (2003) Allelopathy and exotic plant invasion. Plant and Soil 256:29-39
Inderjit, Callaway RM, Vivanco JM (2007) Can plant biochemistry contribute to understanding
of invasion ecology? Trends in Plant Sci 11:574-580

13
Jogesh T, Carpenter D, Cappuccino N (2008) Herbivory on invasive exotic plants and their non-
invasive relatives. Biol Invasions 10:797-804
Joshi J, Vrieling K (2005) The enemy release and EICA hypothesis revisited: Incorporating the
fundamental difference between specialist and generalist herbivores. Ecol Lett 8:704-714
Hambäck PA, Beckerman AP (2003) Herbivory and plant resource competition: A review of two
interacting interactions. Oikos 101:26-37
Klironomos J N (2002) Feedback with soil biota contributes to plant rarity and invasiveness in
communities. Nature 410:651-652
Levine JM (1999) Indirect facilitation: Evidence and predictions from a riparian community.
Ecology 80:1762-1769
Levine J M, Vilà M, D’Antionio CM, Dukes JS, Grigulis K, Lavorel S (2002) Mechanisms
underlying the impacts of exotic plant invasions. Proc Royal Soc Biol Sci 270:775-881
Lind EM, Parker JD (2010) Novel weapons testing: are invasive plants more chemically
defended than native plants? PLoS ONE doi:10.1371/journal.pone.0010429
Maron J L, Marler M (2008) Field-based competitive impacts between invaders and natives at
varying resource supply. J Ecol 96:1187-1197
Meiners SJ (2007) Apparent competition: an impact of exotic shrub invasion on tree
regeneration. Biol Invasions 9:849-855
Memmott J, Simon SV, Paynter Q, Sheppard AW, Syrett P (2000) The invertebrate fauna on
broom, Cystus scoparius, in two native and two exotic habitats. Acta Oecologia 21:213–
222
Miller TE (1987) Effects of emergence time on survival and growth in an early old-field
community. Oecologia 72:272-278

14
Müller-Schärer H, Schaffner U, Steinger T (2004) Evolution in invasive plants: Implications for
biological control. TREE 19:418-422
Munoz A A, Cavieres LA (2008) The presence of a showy invasive plant disrupts pollinator
service and reproductive output in native alpine species only at high densities. J Ecol
96:459-467
Orrock JL, Witter MS, Reichman OJ (2008) Apparent competition with an exotic plant reduces
native plant establishment. Ecology 89:1168-1174
Parker JD, Burkepile DE, Hay ME (2006) Opposing effects of native and exotic herbivores on
plant invasions. Science 311:1459-1461
Pearson DE, Callaway RM (2008) Herbicide reveals weed biocontrol insects reduce native plant
recruitment through second-order apparent competition. Ecol App 18:1489-1500
Rees M, Brown VK (1992) Interactions between invertebrate herbivores and plant competition. J
Ecol 80:353-360
Ridenour WM, Vivanco JM, Feng Y, Horiuchi J, Callaway RM (2008) No evidence for
tradeoffs: Centaurea plants from America are better competitors and defenders than
plants from the native range. Ecol Monogr 78:369-386
Saccone P, Pagés J, Girel J, Brun J, Michalet R (2010) Acer negundo invasion along a
successional gradient: early direct facilitation by native pioneers and late indirect
facilitation by conspecifics. New Phytologist 187:831-842
Siemann E, Rogers WE (2003) Reduced resistance of invasive varieties of the alien tree Sapium
sebiferum to a generalist herbivore. Oecologia 135:451-457

15
Tahvanainen JO, Root RB (1972) The influence of vegetational diversity of the population
ecology of a specialized herbivore, Phyllotreta cruciferaea (Coleoptra: Chrysomelidae).
Oecologia 10:321-346
Tallamy DW, Ballard M, D’Amico V. In press. Can alien plants support generalist insect
herbivores? Biol Invasions 00:000-000
Trammell MA, Butler JL (1995) Effects of exotic plants on native ungulate use of habitat. J
Wildlife Manag 59:808-816
U.S. Department of Agriculture, Forest Service (1988) Range plant handbook. 2nd ed. Dover
Publications Inc. Mineola, NY
White EM, Wilson JC, Clarke AR (2006) Biotic indirect effects: a neglected concept in invasion
biology. Diversity and Distributions 12:443-455
Wikeem BM, Pitt MD (1979) Interpreting diet preference of California bighorn sheep on native
rangeland in south-central BC. Rangelands 1:200-202
Wikeem BM, Pitt MD (1991) Grazing effects and range trend assessment on California bighorn
sheep range. J Range Manag 44:466-470

16
TABLE 1: Effect of E. esula on B. sagittata size and herbivory. Data (mean +/- s.d.) are only
shown for flowering B. sagittata plants. P-values for differences in trait means, with respect to
E. esula presence, were calculated using T-tests (n = 357). These P-values are provided for
general information only, as the path analysis presented elsewhere in this manuscript provides a
more rigorous test of the effects of E. esula on B. sagittata.
Outside E. esula Inside E. esula P-value
Num. leaves per plant 21.96 (+/- 12.33) 22.09 (+/- 11.75) 0.690
Num. flowers per plant 9.92 (+/- 11.41) 7.76 (+/- 7.09) 0.029
Canopy height (cm) 41.7 (+/- 11.56) 39.06 (+/- 10.43) 0.034
Canopy width (cm) 70.75 (+/- 16.1) 70.11 (+/- 14.35) 0.862
Plant Size (SPCA) 0.96 (+/- 0.42) 0.93 (+/- 0.39) 0.408
Num. damaged leaves 8.01 (+/- 4.25) 6.04 (+/- 3.6) <0.001
Prop. leaves damaged (%) 41.31 (+/- 19.00) 30.32 (+/- 16.54) <0.001
Subj. damage rating 2.42 (+/- 1.07) 1.63 (+/- 0.72) <0.001
Leaf Damage (DPCA) -0.06 (+/- 0.71) -0.64 (+/- 0.55) <0.001
Dist. to nearest P. spicata (cm) 64.2 (+/- 59.21) 98.68 (+/- 72.89) <0.001
Dist. to nearest L. sericeus (cm) 103.18 (+/- 80.56) 139.91 (+/- 75.68) <0.001
Dist. to nearest conspecific (cm) 53.35 (+/- 27.49) 58.8 (+/- 31.69) 0.087
TABLE 2: Direct and indirect effects of E. esula on B. sagitatta size (SPCA). Standardized
coefficients are shown with un-standardized coefficients in parentheses.
Direct effect -0.145 (-0.004)
+ Total indirect effect 0.109 (0.003)
(Indirect effect via plant community) 0.057 (0.002)
(Indirect effect via herbivory) 0.051 (0.001)
= Total effect -0.036 (-0.001)

17
FIG. 1. Path analysis diagram. Arrows indicate effects of effect variables on response variables
from effect → response variable. The size of the arrow indicates the strength of the effect.
Standardized path coefficients are shown on each arrow, with unstandardized coefficients in
parentheses. All paths are significant (p < 0.05) except ‘Proximity to L. sericeus’ → DPCA
(dotted line). Direct random effects of site were also modeled for each endogenous variable
(paths not shown).
FIG 2. Frequency distribution of Balsamorhiza size PCA score. The upper panel shows the
frequency distribution for immature plants, and the lower panel shows the distribution for
flowering plants. Color indicates whether plant was located outside (solid grey) or inside
(stippled) of a Euphorbia patch. The distributions are similar, except that very small, young
plants (one or two leaves) are conspicuously absent from Euphorbia patches.

18
FIG. 1
Closeness to P.
spicata
Closeness to
L. sericeus
Closeness to
other B.
sagittata
-0.145 (-0.004)
Leaf damage
(DPCA)
E. esula
densityB. sagittata
size (SPCA)

19
FIG. 2
Size frequency distribution of B. sagitatta
0 1 2 3-1-2
0
10
20
30
40
50
60
0
10
20
30
40
50
60F
req
ue
ncy
Imm
atu
reF
low
erin
g
Outside of E. esula patch
Inside of E. esula patch
B. sagittata Size (SPCA) largersmaller

20
CHAPTER 2
IS COMPETITION AMONG PLANTS MORE LIKE A BOXING MATCH OR A
DEMOLITION DERBY?
Abstract: We used simulation models informed by experimental competition trials to ask
whether tolerance of the competitive effects of an invader or the ability to competitively suppress
an invader is more important for the survival of native plant ecotypes following exotic invasion.
We calculated tolerance and suppression abilities of 23 ecotypes of the native grass
Pseudoroegneria spicata competing against the invasive forb Centaurea stoebe, and modeled C.
stoebe invasion into P. spicata populations varying in ecotypic diversity. The ability to tolerate
competition from C. stoebe was far more important for the success of P. spicata than the ability
to suppress C. stoebe. This is because the benefits of suppressing the invader were shared with
other P. spicata ecotypes, whereas the benefits of tolerance were exclusive to individual
ecotypes. Thus competition in communities may be more analogous to a demolition derby than a
boxing match, in which plants benefit much more by enduring damage than by causing it,
because the benefits of damaging an opponent are shared. This finding has implications for our
interpretation of competitive hierarchies formed using pair-wise competition trials and for our
understanding of selective forces caused by competition, the structuring of plant communities,
the coexistence of plant species, and the outcome of invasions.
Key Words: boxing match, competitive effect, competitive response, demolition derby,
suppression, tolerance

21
INTRODUCTION
Ecologists generally evaluate the competitive ability of plant species in terms of the overall
outcome of competition, measured as the size, survival, or fitness of a target individual growing
with neighbors versus without neighbors. But there are two distinct components of competitive
ability that influence this overall outcome – the suppression of neighbors and the tolerance to the
competitive effects of neighbors (Fig. 1A). A species’ or genotype’s competitive ability in a
given situation has been thought to be the product of how good it is at a particular combination
of suppression and tolerance (Miller & Werner 1987; Aarssen 1989; Goldberg 1990). From this
perspective, competition is analogous to a boxing match in which success is determined both by
knocking down one’s opponent and by not being knocked down (Aarssen 1989). We do not
know what specific traits influence the ability to tolerate or suppress neighbors (but see Goldberg
and Landa 1991, Goldberg 1996; Olesen et al. 2004; Cahill et al. 2005; Wang et al. 2010), but
because these two components of competition are often not correlated (Peart 1989; Goldberg and
Landa 1991; Keddy et al. 1994; Cahill et al. 2005; Fraser and Miletti 2008; Wang et al. 2010; but
see Wilson and Keddy 1986; Goldberg and Fleetwood 1987; Miller and Werner 1987; Gurevitch
et al. 1990; Novoplansky & Goldberg 2001; Thomsen et al. 2006), competitive tolerance and
suppression are thought to be determined by partially independent underlying traits (Goldberg
and Landa 1991; Goldberg 1996; Wang et al. 2010). If tolerance and suppression are
independent they may respond differently to selective forces and may have independent
ecological consequences. Explicitly recognizing and testing this two-part conceptual model of
competition therefore has substantial value for understanding the ecological and evolutionary
consequences of competition.

22
FIG. 1: The boxing match and demolition derby models of plant competition. Panel 1A depicts a
“boxing match” between two competitors. In our models P. spicata is considered to be the focal
plant, and C. stoebe the antagonist, and the left and right arrows indicate tolerance and
suppression ability of P. spicata, respectively. The focal plant can reduce the suppression it
experiences from the antagonist either indirectly, by suppressing it and thereby weakening its
effects (Panel 1B), or directly by tolerating its effects (Panel 1C). When two or more focal
plants compete with an antagonist, in the “demolition derby” scenario, suppression ability does
not provide an exclusive advantage because the advantages of reduced competition with the
antagonist are shared by both focal plants (Panel 1D). However the benefits of tolerance are not
shared; if focal plants vary in their tolerance ability, the more tolerant plant will experience
reduced competition from the antagonist and will have an advantage (grey arrow) whenever it is
present (Panel 1E).

23
For similarly sized species competing in a “boxing match” scenario, the current paradigm
is that tolerance and suppression either are equal in relative importance or suppression is more
important, depending upon which resources are limiting and whether competitors are similarly
sized (Goldberg 1990). This is because suppression is thought to have important indirect
benefits via the exclusion of competitors. However, we propose that this paradigm may be likely
to hold only in the context of pair-wise competition; i.e. just two individuals or genotypes
competing rather than many at the same time. In multi-individual or multispecies communities
we hypothesize that the benefits of having a greater ability to suppress other species will be low.
For just two competing individuals, the boxing match model applies because each
individual competitor is the sole beneficiary of both suppressing and tolerating its competitor. If
a focal plant suppresses its competitor, it will also experience reduced competition from its
weakened competitor (Fig. 1B). Alternatively, it can achieve the same result by simply being
more tolerant of its competitor’s effects (Fig. 1C). But in complex communities consisting of
more than two individuals (or genotypes), the suppression of a competitor will benefit all other
individuals that interact with that competitor (Fig. 1D). Importantly these “undeserving”
beneficiaries (those that are poor suppressors but gain from the suppression done by others) still
have competitive effects on other species in the system, including the plants that have indirectly
benefitted them. Thus, strong suppressors might not only have to share the benefits of their
suppression but they might even sabotage themselves by indirectly making some of their
opponents stronger. In contrast, tolerating a competitor will only benefit the individual
experiencing competition (Fig. 1E). Thus we predict that in complex communities the species or
genotypes that demonstrate disproportionally high abilities to tolerate competition will survive
invasion or the presence of strong competitors in general, and become more abundant over time

24
than those that demonstrate disproportionally high abilities to competitively suppress their
neighbors. If so, the multiplayer chaos of a demolition derby may provide a better analogy than
a boxing match for competition in plant communities. In a demolition derby, the benefits of
dealing damage are limited by strong indirect benefits to other competitors, while the benefits of
enduring or avoiding damage are not (Fig. 2). As a result, in a demolition derby the best strategy
is simply to avoid collisions, and this is true even if there is no inherent cost to offensive driving.
Because driving in such a way is counter to the spirit of the sport, in demolition derbies
excessively defensive driving is called “sandbagging” and is outlawed. Plants, however, have no
such restriction.
FIG. 2: A demolition derby. The winner is the last car that can still move. Offensive drivers
indirectly benefit all other competitors every time they damage or eliminate an opponent.
Because damaging opponents helps other cars on the track the soundest strategy is to “sandbag”
– i.e. to completely avoid contact with other cars. This is true even if there are no risks to
offensive driving. Because it is counter to the spirit of the sport and unfair to more aggressive
competitors, in demolition derbies – unlike plant communities – sandbagging is not allowed.
25
Although competitive suppression and tolerance, considered separately, have each been
shown to affect species abundances in the field (e.g. Grubb 1982; Roush and Radosevich 1985;
Mitchley and Grubb 1986; Keddy 1990; Howard 2001; Howard & Goldberg 2001), to our
knowledge, only a few studies have explicitly compared the relative ecological importance of
tolerance versus suppression. Miller and Warner (1987) found that suppression and tolerance
abilities were tightly correlated among five old-field species, which produced a strong
competitive hierarchy that predicted the abundances of species in the field. But because
suppression and tolerance were tightly correlated they could not tease apart the relative
contribution of each competitive strategy. MacDougall and Turkington (2004) found that
competitive tolerance and not suppression in competition trials predicted the relative abundance
of two exotic invaders in the field. In a complex model intended to analyze tradeoffs for
selection on herbivore defense versus competitive ability in Solidago altissima, Uriarte et al.
(2002) found that selection favored only competitive tolerance traits, and not suppression traits,
in populations experiencing intraspecific competition. More recently Willis et al. (2010) showed
that both competitive suppression and tolerance abilities had important effects on the fitness of
Arabidopsis thaliana competitors in two-genotype populations.
Here we link competitive suppression and tolerance abilities to potential field
performance through simulation models informed by experimental competition trials between 23
different ecotypes of the native grass Pseudoroegneria spicata (Pursh) Á. Löve (bluebunch
wheatgrass) and the North American invader Centaurea stoebe L. ssp. micranthos (Gugler)
Hayek (spotted knapweed). We used the results of these trials to construct single-ecotype
models in which we simulated invasion of populations containing single ecotypes of P. spicata,
and multi-ecotype models in which we invaded mixed populations of P. spicata consisting of

26
multiple ecotypes. We performed our study in the context of exotic invasion because
competition is often thought to play an important role in invasions in general (Vila and Weiner
2004) and for C. stoebe specifically (Maron and Marler 2008; Callaway et al. 2011). We tested
the hypotheses that 1) in single ecotype models, the “boxing match” scenario will play out and
suppression and tolerance will have similar effects on the ability of ecotypes to survive and resist
invasion, and 2) in the multiple ecotype models, the “demolition derby” scenario will play out,
and tolerance will be a more important determinant of abundance than suppression.
METHODS
Pseudoroegneria spicata is a large and long-lived cool-season, drought-tolerant
bunchgrass and a dominant member of native grasslands throughout the western United States.
Centaurea stoebe is an invasive short-lived perennial that is native to Eurasia and has become
highly invasive in the USA since its introduction at the beginning of the 20th
century (Roché and
Talbott 1986). These two species are often found together in the grasslands of the Mountain
West (Watson and Renney 1974; Strang et al. 1979; Chicoine et al. 1985; Ridenour and
Callaway 2001), but C. stoebe can also form mono-dominant stands that exclude many natives
and that strikingly alter rangeland and grassland habitat throughout the Northern Great Plains
and Intermountain West (Harris and Cranston 1979; Maddox 1979; Tyser and Key 1988;
Ridenour and Callaway 2001). The competitive ability of C. stoebe has been attributed to many
factors, including its ability to capitalize on disturbance (Tyser and Key 1988), strong
competition in general or for resources (Herron et al. 2001; Ridenour and Callaway 2001; Maron
and Marler 2008; Callaway et al. 2011; Aschehoug et al. 2012), allelopathy (Ridenour and

27
Callaway 2001; He et al. 2009), and release from inhibition by herbivores and soil biota (Story et
al. 2006; Callaway et al. 2004; Ridenour et al. 2008; Schaffner et al. 2011).
We acquired seeds of 23 Pseudoroegneria spicata ecotypes from the Plant Germplasm
Introduction and Testing Research Station in Pullman, WA, USA. These seeds were from true-
bred lines collected from various populations in nine states throughout the USA and in British
Columbia. Centaurea stoebe seeds were field-collected from a single site near Missoula, MT,
USA to minimize variation in C. stoebe competitive ability. We germinated seeds of each P.
spicata ecotype in 500 mL pots containing a 50/50 mix of sand and native soil from
intermountain grassland near Missoula. After four weeks we thinned seedlings to one per pot,
and added seeds of C. stoebe to half of the pots for each ecotype. The remaining half of the P.
spicata plants were grown without competition. We also planted C. stoebe alone. Growing each
species both alone and in competition allowed us to calculate the average tolerance of each P.
spicata ecotype to C. stoebe and the average suppression of C. stoebe by each P. spicata ecotype.
We measured tolerance and suppression ability using the relative interaction intensity
(RII) index (Armas et al. 2003), which is calculated as follows:
RII = [biomass in competition – biomass grown alone] / [biomass in competition +
biomass grown alone]
Values of this metric can range from 1 to -1. A negative value indicates a negative
competitive interaction and a positive value indicates facilitation. The RII for P. spicata
represents the cost of competition with C. stoebe for P. spicata. It can be interpreted either as
the tolerance of P. spicata to competition with C. stoebe, or as the suppression ability of C.
28
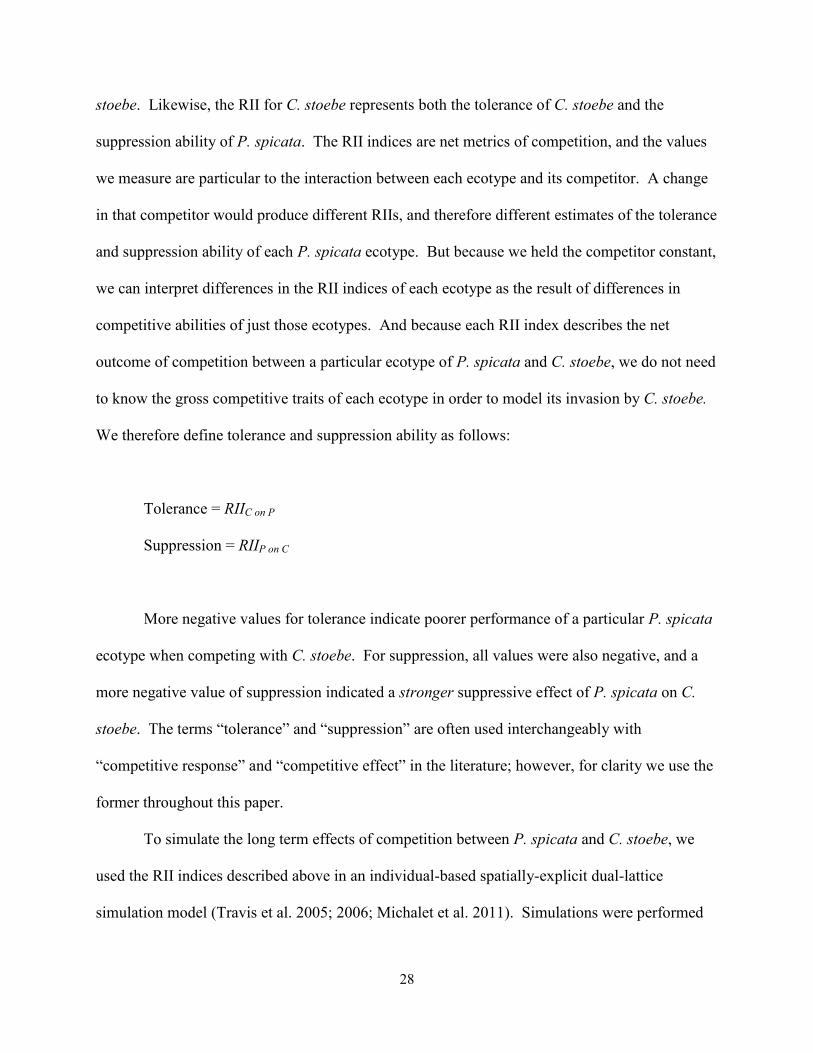
stoebe. Likewise, the RII for C. stoebe represents both the tolerance of C. stoebe and the
suppression ability of P. spicata. The RII indices are net metrics of competition, and the values
we measure are particular to the interaction between each ecotype and its competitor. A change
in that competitor would produce different RIIs, and therefore different estimates of the tolerance
and suppression ability of each P. spicata ecotype. But because we held the competitor constant,
we can interpret differences in the RII indices of each ecotype as the result of differences in
competitive abilities of just those ecotypes. And because each RII index describes the net
outcome of competition between a particular ecotype of P. spicata and C. stoebe, we do not need
to know the gross competitive traits of each ecotype in order to model its invasion by C. stoebe.
We therefore define tolerance and suppression ability as follows:
Tolerance = RIIC on P
Suppression = RIIP on C
More negative values for tolerance indicate poorer performance of a particular P. spicata
ecotype when competing with C. stoebe. For suppression, all values were also negative, and a
more negative value of suppression indicated a stronger suppressive effect of P. spicata on C.
stoebe. The terms “tolerance” and “suppression” are often used interchangeably with
“competitive response” and “competitive effect” in the literature; however, for clarity we use the
former throughout this paper.
To simulate the long term effects of competition between P. spicata and C. stoebe, we
used the RII indices described above in an individual-based spatially-explicit dual-lattice
simulation model (Travis et al. 2005; 2006; Michalet et al. 2011). Simulations were performed

29
in NetLogo (Wilensky 1999), a multi-agent modelling language particularly well suited for
modelling complex systems that develop over time. In this model, C. stoebe and P. spicata
occupied two overlapping two-dimensional lattices of equal sizes (100 × 100 cells). Each cell on
the lattice could be occupied by no more than one individual of the appropriate species. Only
directly overlapping P. spicata and C. stoebe plants interacted in our model; there were no direct
interactions among adjacent cells in a lattice, although within each lattice all plants competed
neutrally for space during reproduction. We assumed that instantaneous survival rate of P.
spicata increased linearly with increased tolerance ability of P. spicata (less negative RIIC on P)
and that survival of C. stoebe decreased linearly with increased suppression ability of P. spicata
(decreased RIIP on C). Therefore, the instantaneous survival rate of each ecotype of P. spicata was
modeled as:
SP= SPmax + RIIC on P when it overlaps with C. stoebe
SP= SPmax when it overlaps with empty cell
where SP is the maximum survival rate of P. spicata (between 0 and 1) and where we assumed
SPmax was the same for all P. spicata ecotypes. The instantaneous survival rate of C. stoebe was
modeled as:
SC= SCmax + RIIP on C when it overlaps with P. spicata genotype i
SC= SCmax when it overlaps with empty cell

30
where SCmax is the maximum survival rate of C. stoebe. These equations result in a linear
decrease in instantaneous survival probability with increased competitor suppression. Linear
survival functions were used for parsimony but we experimented with other functions and found
that they did not qualitatively affect model outcomes. Thus, tolerance ability directly improved
survival in a linear fashion, and suppression indirectly improved survival by reducing the
survival probability of the competitor species in a linear fashion (Fig. 1A).
We used asynchronous updating in the model in the following way: First a single
individual of C. stoebe or P. spicata was selected at random. Next, we determined whether the
individual survived. If the individual survived it was allowed to reproduce and disperse
propagules. Each time step was made up of NC + NP of such updates, where NC and NP refer to
the number of all individuals of C. stoebe and all individuals of P. spicata, respectively. During
reproduction, each individual produced propagules with competitive traits that were identical to
those of that individual. To simplify our assumptions, all individuals of each species produced
propagules at the same reproductive rate, r (rC for C. stoebe and rP for P. spicata). This rate was
independent of the age of each plant or whether it had a competitor. Propagules from each
species were dispersed sequentially to cells that were randomly selected within that species’ own
lattice. The propagules were only allowed to establish in empty cells and the one arriving first
occupied the cell. Thus, there was competition among individuals within the same lattice for
recruitment into empty cells. We used a “wraparound” (torus) approach to avoid edge effects
(Yamamura et al. 2004). Parameters used in the final, reported simulations were: rC = 1, rP = 1,
SCmax = 0.8, SPmax = 0.8. The robustness of the model was tested with many different
combinations of parameters and results were qualitatively the same as for the combinations
reported here (data not shown).

31
We used these models to simulate the invasion of both single-ecotype and multi-ecotype
populations of P. spicata by C. stoebe. In the single-ecotype simulations we separately invaded
lattices composed of individual populations of each of the 23 P. spicata ecotypes with C. stoebe.
Since the RIIs we used were averages for each ecotype, in the single ecotype models all P.
spicata plants were identical. In the multi-ecotype models, we pooled all or some combination
(see below) of the 23 separate ecotypes into a single, genetically diverse population containing
each ecotype in equal abundance. Per-capita reproduction was assumed to be the same for each
population of P. spicata.
All simulations were run for 10000 time steps in order to allow the system to reach
equilibrium. All measurements were determined as the mean values of 100 independent
replicate runs for each time step. Since the initial population sizes of invaders are likely to be
small at the beginning of invasions, all simulations were started with 100 individuals of C. stoebe
(1% of maximum population size). The P. spicata lattice was initially saturated, and in the
models containing multiple genotypes, all genotypes started with equal abundance. All
individuals of C. stoebe and P. spicata were randomly dispersed across their own lattices.
In the single-ecotype models, we calculated the competitive rank of P. spicata ecotypes
by ranking those ecotypes that stably coexisted with C. stoebe according to their equilibrium
abundance. Ecotypes that caused extinction of C. stoebe were ranked first, in order of the speed
at which they drove C. stoebe extinct. Ecotypes that failed to persist were ranked last, and in
order of the speed at which they went extinct. In the multi-ecotype models, when 23 P. spicata
ecotypes were assembled into a single community, only one ecotype usually survived invasion.
We assigned this ecotype a rank of “one” and then assembled the remaining 22 ecotypes into a
community and again simulated the invasion of that community, now lacking the one ecotype

32
that survived in the previous simulation. The surviving ecotype in the second simulations was
given a rank of “two” and was excluded from a subsequent simulation intended to identify the
third-ranked ecotype. This process continued until only one ecotype remained, and that ecotype
was given rank “23.”
To assess the relative importance of tolerance and suppression for the performance of P.
spicata we used multiple linear regressions with tolerance and suppression ability as predictors
of competitive rank in both the single- and multi-ecotype models. We calculated the individual
contribution of both tolerance and suppression to variance explained in the regression as:
% Variance explained by tolerance = βtrrt / R2
% Variance explained by suppression = βsrrs / R2
Where βt and βs are the standardized regression coefficients for tolerance and suppression in the
regression of rank against tolerance and suppression, with R2 being the coefficient of
determination of that regression, and where rrt and rrs are the Pearson correlations between rank
and tolerance or suppression.
The generality of our results from the empirically informed models was tested with
theoretical models simulating 289 ecotypes with different combinations of competitive
suppression and tolerance abilities and modelling the outcome of C. stoebe invasion on these
artificial communities. These ecotypes represent a wider range of combinations of tolerance and
suppression abilities, in which we set a minimum value of 0 and a maximum value of 0.8, with
an interval of 0.05 between possible values of effect and response. Thus, there were 17 regularly
spaced values of effect and response with 289 unique combinations. For the simulated ecotypes,

33
models were constructed identically to the models used for the real ecotypes, and the same
procedures were used to determine competitive ranks.
RESULTS
The ability to tolerate competition from C. stoebe and the ability to suppress C. stoebe
varied substantially among the 23 ecotypes of P. spicata. RIIs for suppression ranged from -0.54
to -0.17 and RIIs for tolerance ranged from -0.54 to -0.14, and suppression and tolerance were
not correlated (r = -0.281, p = 0.195, n = 23, Table 1, Fig. 3). The values for tolerance and
suppression for the two species had similar distributions; C. stoebe and P. spicata were roughly
equivalent competitors in measured conditions and our results were not skewed by one species
being a vastly superior competitor than the other.
In the single-ecotype models based on the 23 natural P. spicata ecotypes, three ecotypes
(2, 4, and 7) competitively excluded C. stoebe, and four ecotypes (5, 11, 12, and 19) did not
survive invasion. The remaining 16 ecotypes coexisted stably with C. stoebe in the models but
varied substantially in final abundance. Competitive hierarchies of P. spicata ecotypes (Table 1)
were determined both by the tolerance and suppression abilities of P. spicata in single-ecotype
models (Fig. 3, Fig. 4A). Linear regression analyses indicated that ability to tolerate competition
accounted for 74% of the explained variance in final rank of natural P. spicata ecotypes, whereas
ability to suppress C. stoebe contributed 26% to the variance in final rank of P. spicata. In the
single-ecotype models based on 289 simulated ecotypes, 52% of the explained variance in rank
was determined by tolerance and 48% by suppression (Table 2). This discrepancy occurred
because the relative importance of tolerance versus suppression was not uniform throughout the
parameter space. In some regions of parameter space tolerance played more of a role in

34
FIG. 3: Tolerance and suppression abilities of the 23 ecotypes of P. spicata. Number indicates
the ID number assigned to each ecotype. The size of the circle corresponds to the competitive
rank of each ecotype in the single-ecotype simulations, with better competitors having larger
circles (see Table 1 for values). Line style indicates whether that ecotype competitively
excluded C. stoebe (dashed), coexisted with C. stoebe (solid), or went extinct (dotted).
determining fitness and in others suppression played a stronger role. The natural ecotypes
happened to occupy a part of the parameter space where tolerance was more important (Fig. 4A).
The simulated ecotypes, however, were evenly distributed across the entire possible parameter
space. When the entire parameter space was considered, tolerance and suppression played an
equal role in determining competitive rank. Therefore, in the broadest consideration, tolerance
and suppression were roughly equal in determining rank in the single-ecotype models.
The performance of P. spicata ecotypes in single-ecotype models was a poor predictor of
their success in the multi-ecotype models (Table 1). When all 23 P. spicata ecotypes were
mixed together for the complete multi-ecotype model, only one ecotype survived (ecotype 4),
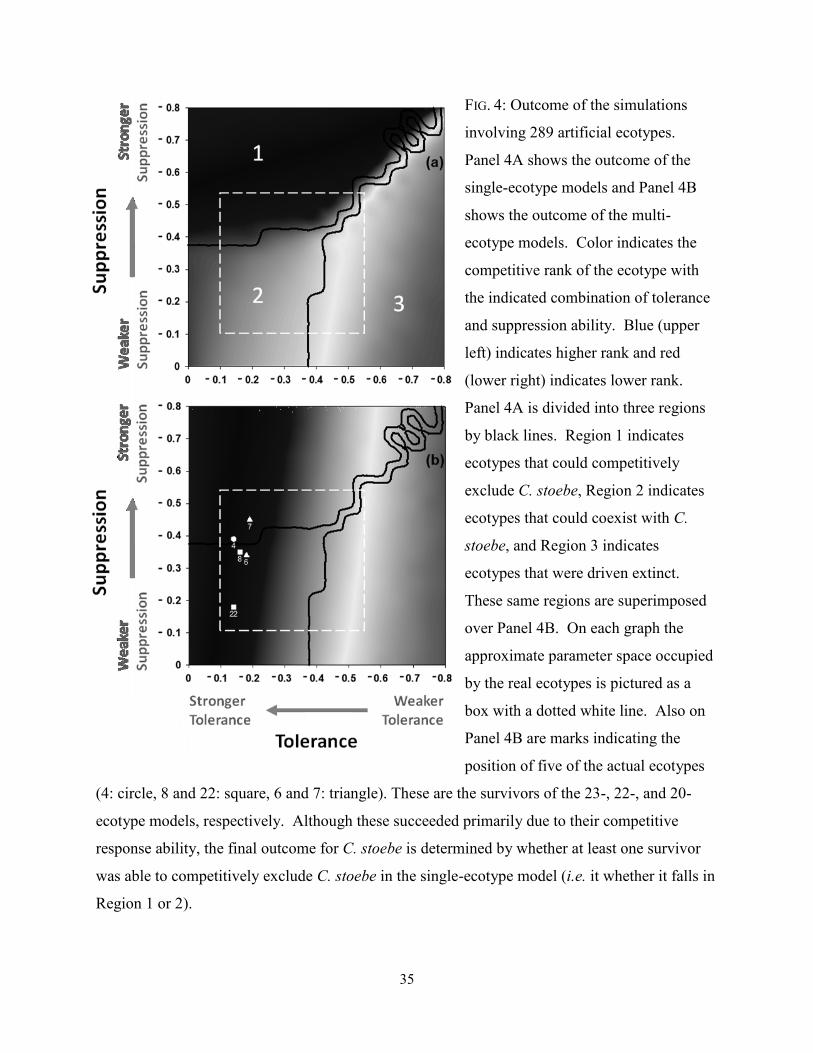
35
FIG. 4: Outcome of the simulations
involving 289 artificial ecotypes.
Panel 4A shows the outcome of the
single-ecotype models and Panel 4B
shows the outcome of the multi-
ecotype models. Color indicates the
competitive rank of the ecotype with
the indicated combination of tolerance
and suppression ability. Blue (upper
left) indicates higher rank and red
(lower right) indicates lower rank.
Panel 4A is divided into three regions
by black lines. Region 1 indicates
ecotypes that could competitively
exclude C. stoebe, Region 2 indicates
ecotypes that could coexist with C.
stoebe, and Region 3 indicates
ecotypes that were driven extinct.
These same regions are superimposed
over Panel 4B. On each graph the
approximate parameter space occupied
by the real ecotypes is pictured as a
box with a dotted white line. Also on
Panel 4B are marks indicating the
position of five of the actual ecotypes
(4: circle, 8 and 22: square, 6 and 7: triangle). These are the survivors of the 23-, 22-, and 20-
ecotype models, respectively. Although these succeeded primarily due to their competitive
response ability, the final outcome for C. stoebe is determined by whether at least one survivor
was able to competitively exclude C. stoebe in the single-ecotype model (i.e. it whether it falls in
Region 1 or 2).
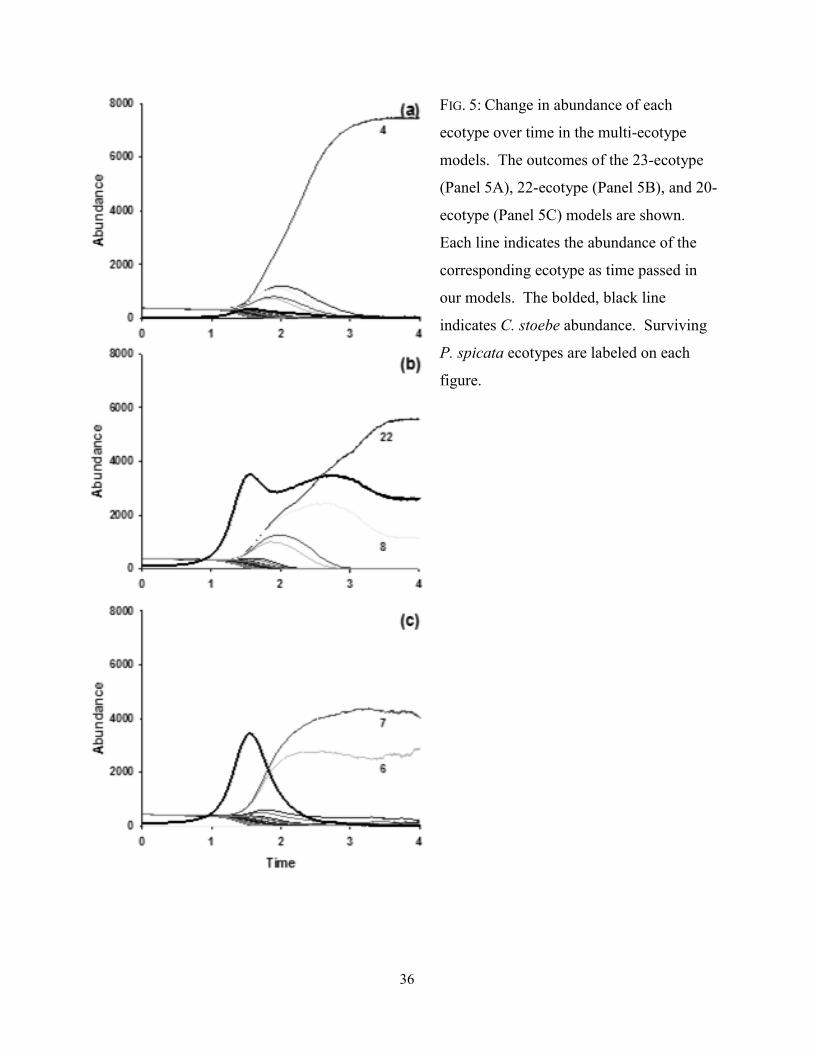
36
FIG. 5: Change in abundance of each
ecotype over time in the multi-ecotype
models. The outcomes of the 23-ecotype
(Panel 5A), 22-ecotype (Panel 5B), and 20-
ecotype (Panel 5C) models are shown.
Each line indicates the abundance of the
corresponding ecotype as time passed in
our models. The bolded, black line
indicates C. stoebe abundance. Surviving
P. spicata ecotypes are labeled on each
figure.

37
and the 18 ecotypes that coexisted with C. stoebe in the single-ecotype models went extinct (Fig.
5A). In fact, two P. spicata ecotypes that went extinct in the 23-ecotype model competitively
excluded C. stoebe in the single ecotype models (ecotypes 2 and 7). After all P. spicata ecotypes
other than ecotype 4 were eliminated from the model, C. stoebe also went extinct. To determine
whether one of these ecotypes would rise to dominance if ecotype 4 was absent, we ran a 22-
ecotype model with ecotype 4 excluded. In this model, ecotypes 8 and 22 persisted but ecotypes
2 and 7 again were eliminated. Furthermore, C. stoebe persisted at a high final abundance in this
22-ecotype model (Fig. 5B). Finally, we removed ecotypes 4, 8 and 22 from our simulation. In
this 20-ecotype model, C. stoebe went extinct and ecotypes 6 and 7 became dominant (Fig. 5C).
Ecotypes went extinct from the multi-ecotype models roughly in order of their ability to
tolerate competition from C. stoebe. Thus, rank in the multi-ecotype models was mostly, but not
entirely, determined by tolerance ability (Table 1). Ninety three percent of the explained
variance in overall competitive rank of natural ecotypes was determined by tolerance, with just
7% determined by the ability to suppress C. stoebe (Table 2). Results of the models using 289
simulated ecotypes were similar, with tolerance ability accounting for 99% of the explained
variance in competitive rank (Table 2, Fig. 4B).
DISCUSSION
In this study we observed a surprisingly large degree of natural variation in the ability of native
P. spicata ecotypes from different parts of their natural North American range to competitively
suppress C. stoebe and to tolerate its competitive effects. Moreover, suppression ability and
tolerance ability were not correlated for P. spicata, suggesting that natural populations of this
species have strikingly different abilities to respond to or to attenuate invasion by C. stoebe.

38
To determine whether tolerance or suppression ability is more important for how native
P. spicata ecotypes might respond to invasion, we used individual-based simulation models.
Specifically, we used two types of models: single-ecotype models, in which each ecotype
competed one-on-one with C. stoebe, and multi-ecotype models in which the ecotypes all
interacted with C. stoebe at the same time. As predicted, in the single-ecotype models tolerance
and suppression played approximately equal roles in establishing competitive hierarchies (Table
2, Fig. 4A). This result is important because it shows that, despite the fact that the fitness
benefits of tolerance were direct and the benefits of suppression were indirect, overall benefits of
both strategies had the opportunity to be equivalent in these models. Suppression was important
in the single-ecotype models for two reasons: First, P. spicata plants with better suppression
ability were able to more quickly remove their competitor from the overlapping cell in the C.
stoebe lattice. Second, suppression of C. stoebe by the entire P. spicata population enabled P.
spicata to control C. stoebe abundance, thereby generating a feedback process that reduced the
strength of competition from C. stoebe globally.
Despite tolerance and suppression being equally important in determining competitive
rank in the single-ecotype models (in which each ecotype competed alone with C. stoebe), in the
multi-ecotype models, in which multiple coexisting ecotypes competed with C. stoebe, tolerance
eclipsed suppression for establishing competitive hierarchies and for determining the relative
abundance of the different ecotypes (Tables 1 and 2, Fig. 4B). The reasons for this are illustrated
in Figure 1. When multiple ecotypes (or genotypes) compete with a single competitor, the
benefits of suppression are shared (Fig. 1D) but the benefits of tolerance are not (Fig. 1E). In the
simplified case presented in Figure 1, the benefits of suppression are shared completely between
the strong and weak suppressor. In such a scenario suppression of neighbors would not confer

39
any fitness advantage at all. In our simulations, however, suppression provided a small benefit
because strong suppressors gained a transient exclusive (i.e. un-shared) benefit from clearing
their overlapping cell of C. stoebe. But since strong suppressors were constantly inundated with
C. stoebe propagules, even after successfully outcompeting their neighbors, this exclusive benefit
of suppression was temporary and roughly 100 times less important than tolerance in our
theoretical models (Table 2). This finding is surprising because it suggests that even though
neighbor competition caused a many-fold reduction in the survival probability of individual
plants in our models, there was virtually no fitness benefit of neighbor exclusion, which is
consistent with Uriarte et al. (2002).
The exclusive benefits of suppression were weak in our models because individuals were
not able to engineer a favorable environment either for themselves or for their offspring by
suppressing their neighbors. However, is it possible that under different conditions suppression
has stronger benefits than we observed in this study? We can hypothesize about how our model
assumptions influenced our results by considering the degree to which benefits of suppression
are shared versus exclusive under different conditions. For example, we assumed that dispersal
was global, so our model lacked spatial structure. In our models, the exclusive advantage of
strong suppressors was their ability to temporarily remove C. stoebe from an overlapping cell.
So if dispersal was limited, strong suppressors could more strongly engineer their local
environment by removing C. stoebe over a larger area, and therefore potentially enjoy a longer-
lasting exclusive benefit of suppression. But still, any P. spicata propagule entering the cleared
area, regardless of its competitive strength, would benefit from the absence of C. stoebe.
Moreover, strong suppressors would have the same difficulty in controlling the global abundance
of C. stoebe as they do in our models, because weak competitors would form patches that would

40
act as refuges and propagule sources for C. stoebe. As a result, suppression might not actually
improve the average fitness of a genotype over an entire landscape. Thus we predict that
dispersal limitation should not strongly affect the importance of tolerance versus suppression.
Uriarte et al. (2002) obtained a very similar result to the one reported here, using a model that
had strong dispersal limitation, but that differed from our model in many other ways. For
example, Uriarte et al. modeled direct competition between adjacent plants, while we restricted
direct competition only between exactly overlapping intraspecific competitors. And in their
model, competitive interactions reciprocally affected plant size, which in turn affected
reproductive rate, while we did not model plant size at all. The fact that two independent models
with very different structure reached the same result increases our confidence in our theoretical
model (Fig. 1D & E) and its assumptions. Nonetheless, more research is needed to determine
whether and under what conditions neighbor suppression conveys a fitness advantage in nature.
Our results suggest that competition in a community may not be played out as a
conglomeration of pair-wise boxing matches in which species or genotypes attain success in
equal measure by suppressing and by tolerating their neighbors. Instead, our results suggest that
competition in plant communities more closely resembles the multiplayer chaos of a demolition
derby, where damaging an opponent helps everyone else on the track to the same degree.
Because sandbaggers – the drivers who intentionally avoid causing damage to other cars – also
benefit from the destruction caused by offensive drivers, the benefits of such offensive driving
are unfairly shared in a demolition derby. If there is no personal advantage to damaging your
opponents, there is no reason to risk your car by doing so. In the same way, in plant
communities, tolerating competition appears to be of paramount importance, and even successful

41
elimination of neighbors by competitive suppression has very limited benefits, even if those
neighbors are strong suppressors themselves.
This theoretical model of plant competition has important implications for our
understanding of the ecology of plant systems, and for our interpretation of data derived from
pair-wise competition trials or competition trials involving two populations consisting of only
one genotype each. This is because pair-wise competition may unrealistically favor strong
suppressors – particularly if the general competitive interaction is relatively strong (Fig. 4A) –
and thus poorly predict competitive outcome in more diverse natural conditions in which
suppression plays a lessened role in determining fitness. Thus competitive hierarchies
established using pair-wise competition trials may be misleading even when not confounded by
other factors such as herbivory or environmental heterogeneity.
The “demolition derby” model of plant competition also has particular importance for
understanding selective pressures imposed by invasive species as they re-shape native plant
communities. For example, if invaders select for native genotypes with superior ability to
tolerate competition (see Aarssen 1983; Strauss et al. 2006; Lau 2008; Thorpe et al. 2011), and if
these traits are heritable, invasions may lead to evolutionary increases in the competitive
tolerance of native plant species and shifts in the composition of the plant communities in ways
related to these traits. Eventually, this could lead to a more stable coexistence of native and
invasive species and attenuated invasion intensity over time. Evolutionary responses of native
plants have been hypothesized to weaken invasion over time (Simberloff and Gibbons 2004;
Callaway et al 2005; Lau 2008), but understanding the relative importance of competitive
tolerance and its potential fitness benefits sheds new light how this process may occur.
Extending this argument, we also propose that coevolution between competing plants in general

42
might attenuate the strength of competitive interactions over time. However, plants certainly
express traits that strongly suppress neighbors, and this can correspond with variation in
abundance among species in the field (e.g. Grubb 1982; Roush and Radosevich 1985; Mitchley
and Grubb 1986; Keddy 1990).
How can we reconcile the co-existence of both strong suppression ability and strong
tolerance in natural communities with our demolition derby model of competition? We propose
that selection for many traits associated with increased suppression ability, particularly those
related to size and resource uptake, may be incidental and not directly related to suppression
ability per se, but instead is related to other inherent advantages of such traits. For example,
plants with wide canopies might suppress their neighbors by shading them. However, the
selective forces that promote canopy width might relate only to the direct benefits of increased
light uptake – counter-intuitively, suppression of neighbors might be an ancillary consequence of
these traits that is not beneficial in any context, even if it improves survival by excluding
neighboring competitors. In sum our results suggest that a demolition derby model of plant
competition, with its surprising prediction that suppression strategies provide few advantages in
multi-species plant communities, has important implications for the design of studies
investigating the importance of competitive hierarchies, our understanding of the selective forces
that competing plants experience and how ecological conditions alter those forces, and our
knowledge of how competitive interactions between plants affect the distribution and abundance
of plants in nature.

43
ACKNOWLEDGEMENTS
DZA thanks the NSF Graduate Research Fellowship Program for funding. We are grateful for
funding from the U.S. National Science Foundation DEB 0614406 to RMC. We thank the Plant
Germplasm Introduction and Testing Research Station in Pullman, WA, for supplying
Pseudoroegneria seeds.
LITERATURE CITED
Aarssen L. W. 1983. Ecological combining ability and competitive combining ability in plants:
Toward a general evolutionary theory of coexistence in systems of competition.
American Naturalist 122:707-731.
Aarssen L. W. 1989. Competitive ability and species coexistence: A “plant’s eye” view. Oikos
56:386-401.
Armas C., Ordiales R., and Pugnaire F. I. 2004. Measuring plant interactions: A new
comparative index. Ecology 85:2682-2686.
Aschehoug, E.T., Metlen, K.L., Callaway, R.M. and Newcombe, G. 2012. Fungal endophytes
directly increase the competitive effects of an invasive forb. Ecology 93:3-8.
Cahill J. F., Kembel S. W., and Gustafson D. J. 2005. Differential genetic influences on
competitive effect and response in Arabidopsis thaliana. Journal of Ecology 93:958-967.
Callaway R. M., Ridenour W. M., Laboski T., Weir T., and Vivanco J. M. 2005. Natural
selection for resistance to the allelopathic effects of invasive plants. Journal of Ecology
93:5-15.

44
Callaway R. M., Thelen G., Barth S., Ramsey P. W., and Gannon J.E. 2004. Soil fungi alter
interactions between the invader Centaurea maculosa and North American natives.
Ecology 85:1062-1071.
Callaway R. M., Waller L. P., Diaconu A., Pal R., Collins A. R., Müller-Schärer H., and Maron
J. L. 2011. Escape from competition: Neighbors reduce Centaurea stoebe performance at
home but not away. Ecology 92:2208-2213.
Chicoine T. K., Fay P. K., and Nielsen G. A. 1985. Predicting weed migration from soil and
climate maps. Weed Science 41:57-61.
Fraser L. H., and Miletti T. E. 2008. Effect of minor water depth treatments on competitive effect
and response of eight wetland plants. Plant Ecology 195:33-43.
Goldberg D. E. 1990. Components of resource competition in plant communities. Pages 27-49 in
J. B. Grace, and D. Tilman, ed. Perspectives on Plant Competition. Blackburn Press,
Caldwell, NJ.
Goldberg, D. E. 1996. Competitive ability: Definitions, contingency and correlated traits.
Philosophical Transactions of the Royal Society of London: Biology 351:1377-1385.
Goldberg D. E., and Fleetwood L. 1987. Competitive effect and response in four annual plants.
Journal of Ecology 75:1131-1143.
Goldberg D. E., and Landa K. 1991. Competitive effect and response: Hierarchies and correlated
traits in the early stages of competition. Journal of Ecology 79:1013-1030.
Grubb P. J. 1982. Control of relative abundance in roadside Arrhenatheretum: Results of a long-
term garden experiment. Journal of Ecology 70:845-861.

45
Gurevitch J., Wilson P., Stone J. L., Teese P., and Stoutenburgh R. J. 1990. Competition among
old-field perennials at different levels of soil fertility and available space. Journal of
Ecology 78:727-744.
He W., Feng Y., Ridenour W. M., Thelen G. C., Pollock J. L., Diaconu A., and Callaway R. M.
2009. Novel weapons and invasion: Biogeographic differences in the competitive effects
of Centaurea maculosa and its root exudate (±)-catechin. Oecologia 159:803-815.
Harris P., and Cranston R. 1979. An economic evaluation of control methods for diffuse and
spotted knapweed in Western Canada. Canadian Journal of Plant Science 59:375-382.
Herron G. J., Sheley R. L., Maxwell B. D., and Jacobsen J. S. 2001. Influence of nutrient
availability on the interaction between spotted knapweed and bluebunch wheatgrass.
Restoration Ecology 9:326-331.
Howard T. G. 2001. The relationship of total and per-gram rankings in competitive effect to the
natural abundance of herbaceous perennials. Journal of Ecology 89:110-117.
Howard T. G., and Goldberg D. E. 2001. Competitive response hierarchies for germination,
growth, and survival and their influence on abundance. 83:979-990.
Keddy P. A. 1990. Competitive hierarchies and centrifugal organization in plant communities.
Pages 266-290 in J. B. Grace, and D. Tilman, ed. Perspectives on Plant Competition.
Blackburn Press, Caldwell, NJ.
Keddy P. A., Twolan-Strutt L., and Wisheu I. C. 1994. Competitive effect and response rankings
in 20 wetland plants: Are they consistent across three environments? Journal of Ecology
82:635-643.
Lau J. A. 2008. Beyond the ecological: Biological invasions alter natural selection on a native
plant. Ecology 89:1023-1031.

46
MacDougal A. S., and Turkington R. 2004. Relative importance of suppression-based and
tolerance-based competition in an invaded oak savanna. Journal of Ecology 92:422-434.
Maddox D. M. 1979. The knapweeds: Their economics and biological control in the Western
States, U.S.A. Rangelands 1:139-141.
Maron, J. L., and Marler M. 2008. Field-based competitive impacts between invaders and
natives at varying resource supply. Journal of Ecology 96:1187-1197.
Michalet, R., Xiao S., Touzard B., Smith D. S., Cavieres L. A., Callaway R. M., and Whitham T.
G. 2011. Phenotypic variation in nurse traits and community feedbacks define an alpine
community. Ecology Letters 14:433-443.
Miller T. E., and Werner P. A. 1987. Competitive effects and responses between plant species in
a first-year old-field community. Ecology 68:1201-1210.
Mitchley J., and Grubb P. J. 1986. Control of relative abundance of perennials in chalk grassland
in Southern England: I. Constancy of rank order and results of pot- and field-
experiments on the role of interference. Journal of Ecology 74:1139-1166.
Novoplansky A., and Goldberg D. E. 2001. Effects of water pulsing on individual performance
and competitive hierarchies in plants. Journal of Vegetation Science 12:199-208.
Olesen J. E., Hansen P. K., Berntsen J., and Christensen S. 2004. Simulation of above-ground
suppression of competing species and competition tolerance in winter wheat varieties.
Field Crops Research 89:263-280.
Peart D. R. 1989. Species interactions in a successional grassland. II. Colonization of vegetated
sites. Journal of Ecology 77:252-266.
Ridenour W. M., and Callaway R. M. 2001. The relative importance of allelopathy in
interference: The effects of an invasive weed on a native bunchgrass. Oecologia 126:444-
47
450.
Ridenour W. M., Vivanco J. M, Feng Y., Horiuchi J. ,and Callaway R. M. 2008. No evidence for
tradeoffs: Centaurea plants from America are better competitors and defenders than
plants from the native range. Ecological Monographs 78:369-386.
Roché B. F. Jr., and Talbott C. J. 1986. The collection history of Centaureas found in
Washington State. Agricultural Research Center of Washington State University,
Research Bulletin XB 0978.
Roush M. L., and Radosevich S. R. 1985. Relationships between growth and competitiveness of
four annual weeds. Journal of Applied Ecology 22:895-905.
Schaffner U., Ridenour W. M., Wolf V.C., Bassett T., Müller C., Müller-Schärer H., Sutherland
S., Lortie C. J., and Callaway R. M. 2011. Plant invasions, generalist herbivores, and
novel defense weapons. Ecology 92:829-835.
Siemens D. H., Garner S. H., Mitchell-Olds T., and Callaway R. M. 2002. Cost of defense in the
context of plant competition: Brassica rapa may grow and defend. Ecology 83:505-517.
Simberloff D., and Gibbons L. 2004. Now you see them, now you don’t – population crashes of
established introduced species. Biological Invasions 6:161-172.
Story J. M, Callan, N. W., Corn, J. G., and White, L. J. 2006. Decline of spotted knapweed
density at two sites in western Montana with large populations of the introduced root
weevil, Cyphocleonus achates (Fahraeus). Biological Control 38: 227-232.
Strang R. M, Lindsay K. M., and Price R. S. 1979. Knapweeds: British Columbia’s undesirable
aliens. Rangelands 1:141-143.
Strauss S. Y., Lau J. A., and Carroll S. P. 2006. Evolutionary responses of natives to introduced
species: What do introductions tell us about natural communities? Ecology Letters 9:357-

48
374.
Thomsen M. A., Corbin J. D., and D’Antonio C. M. 2006. The effect of soil nitrogen on
competition between native and exotic perennial grasses from northern coastal California.
Plant Ecology 186:23-35.
Thorpe A. S., Aschehoug E. T., Atwater D. Z., and Callaway R. M. 2011. Interactions among
plants and evolution. Journal of Ecology 99:729-740.
Travis, J. M. J., Brooker R. W., Clark E. J, and Dytham C. 2006. The distribution of positive and
negative species interactions across environmental gradients on a dual-lattice model.
Journal of Theoretical Biology 241:896-902.
Travis, J.M. J., Brooker R. W., and Dytham C. 2005. The interplay of positive and negative
species interactions across an environmental gradient: insights from an individual-based
simulation model. Biology Letters 1:5-8.
Tyser R. W., and Key C. H. 1988. Spotted knapweed in natural area fescue grasslands: An
ecological assessment. Northwest Science 62:151-160.
Uriarte M., Canham C. D., and Root R. B. 2002. A model of simultaneous evolution of
competitive ability and herbivore resistance in a perennial plant. Ecology 83: 2649-2663.
Vilá, M., and Weiner J. 2004. Are invasive plant species better competitors than native plant
species? - evidence from pair-wise experiments. Oikos 105:229-238.
Wang P., Stieglitz T., Zhou D. W., and Cahill J. F. Jr. 2010. Are competitive effect and response
two sides of the same coin, or fundamentally different? Functional Ecology 24:196-207.
Wardle D. A., Nilsson M., Gallet C., and Zackrisson O. 1998. An ecosystem-level perspective of
allelopathy. Biological Reviews 73:305-319.
Watson A. K., and Renney A. J. 1974. The biology of Canadian weeds, Centaurea diffusa and C.

49
maculosa. Canadian Journal of Plant Science 54:687-701.
Wilensky, U. 1999. NetLogo.http://ccl.northwestern.edu/netlogo/. Center for Connected
Learning and Computer-Based Modeling, Northwestern University, Evanston, IL.
Willis C. G., Brock M. T., and Weinig C. 2010. Genetic variation in tolerance of competition and
neighbour suppression in Arabidopsis thaliana. Journal of Evolutionary Biology
23:1412-1424.
Wilson S. D., and Keddy P. A. 1986. Species competitive ability and position along a natural
stress disturbance gradient. Ecology 67:1236-1242.
Yamamura, N., Higashi M., Behera N., and Wakano J. Y. 2004. Evolution of mutualism through
spatial effects. Journal of Theoretical Biology 226:421-428.

50
TABLES
TABLE 1: Competitive ranks of ecotypes in the single-ecotype and multi-ecotype models.
Pop.
Rank
Single
Rank
Multi
RII P. spicata
(Tolerance)
RII C. stoebe
(Suppression)
2 1 6 -0.255 -0.536
7 2 4 -0.187 -0.453
4 3 1 -0.142 -0.392
8 4 2 -0.162 -0.346
6 5 5 -0.179 -0.343
14 6 9 -0.272 -0.370
22 7 3 -0.144 -0.183
1 8 7 -0.230 -0.291
9 9 8 -0.248 -0.270
18 10 11 -0.284 -0.310
23 11 10 -0.260 -0.268
21 12 17 -0.331 -0.349
16 13 12 -0.274 -0.239
13 14 16 -0.304 -0.276
15 15 15 -0.300 -0.254
17 16 13 -0.292 -0.219
20 17 14 -0.289 -0.175
3 18 18 -0.334 -0.224
10 19 19 -0.364 -0.257
5 20 20 -0.424 -0.378
11 21 21 -0.433 -0.248
19 22 22 -0.484 -0.218
12 23 23 -0.540 -0.344
Competitive ranks of P. spicata ecotypes from the single-ecotype models “Rank Single” and
multi-ecotype models “Rank Multi” are shown, along with the RII values for each ecotype. Data
are sorted in terms of single-ecotype model rank.

51
TABLE 2: Results of linear regressions of ecotype competitive rank against tolerance and
suppression.
Tolerance Suppression
Type of model R2 n p β
%
Exp p β
%
Exp p
Single Empirical 0.952 23
<
0.001 -0.803 74.2% < 0.001 0.429 25.8% < 0.001
Simulated 0.861 289
<
0.001 0.666 51.6% < 0.001 -0.646 48.4% < 0.001
Multi Empirical 0.936 23
<
0.001 -0.915 92.8% < 0.001 0.19 7.2% 0.004
Simulated 0.997 289
<
0.001 0.993 98.9% < 0.001 -0.106 1.1% < 0.001
Regressions were performed on both the single-ecotype (Single) and multi-ecotype (Multi)
models, using RIIs gathered both from 23 natural ecotypes (Empirical) and from 289 simulated
ecotypes (Simulated). For each model, the determination coefficient (R2), sample size (n), and p
value (p) are shown. The separate individual contribution of both tolerance and suppression
traits on rank for each regression is indicated by the standardized regression coefficient of that
trait (β), percent of total explained variance accounted for by that trait (% Exp), and p value (p).

52
CHAPTER 3
ECOTYPIC DIVERSITY OF A DOMINANT GRASSLAND SPECIES INCREASES
PRODUCTIVITY THROUGH COMPLEMENTARITY
Abstract: Plant diversity enhances ecosystem processes, including productivity, but these effects
have been studied almost exclusively at the taxonomic scale of species. Here we find that
intraspecific diversity within one of North America’s most widespread and dominant grassland
species, Pseudoroegneria spicata, increases net annual productivity to a degree similar to that
reported for different species. Importantly, this effect of ecotypic diversity is shown to be due to
complementarity, or diversity per se, and not to the sampling of larger, stronger competitors in
diverse assemblages. These results suggest that functional diversity within a species can be very
high, and that cryptic biological diversity below the species level has the potential to strongly
affect the functioning of ecological systems.
One Sentence Summary: Increasing ecotype richness causes a 40% increase in productivity
through complementary, indicating very high functional diversity within a species.
MAIN TEXT
Concern over the ecological consequences of anthropogenic species loss has led to the discovery
of profound effects of species richness on ecosystem function (Tilman et al. 1996, Knops et al.
53
1999, Hooper et al. 2005, Balvanera et al. 2006). One common finding is that species and
functional group richness increases the productivity of plant communities, with diverse
communities yielding on average 70% more than monocultures (Cardinale et al. 2007). Studies
of diversity-dependent overyielding have focused almost exclusively on diversity among species
(Hooper et al. 2005, Balvanera et al. 2006) or functional groups (Díaz and Cabido 2001), as these
are considered to define the key operational units in ecosystems (McGill et al. 2006).
However, a great deal of Earth’s biological diversity also resides within species, and
intraspecific diversity can strongly influence ecological processes (Hughes et al. 2008). We
now know that functional diversity within a single plant population can be very high (Garnier et
al. 2004, Albert et al. 2010a). Species also vary across their local and regional distributions, with
many natural populations consisting of locally adapted “ecotypes” (Clausen et al. 1941, Cordell
et al. 1998, Albert et al. 2010b).
The effects of intraspecific diversity on productivity previously have been explored for
two species; Festuca ovina and Solidago altissima. For F. ovina, genotypic richness does not
influence productivity (Fridley and Grime 2010), but for S. altissima, genotypic richness
increases productivity to the same extent as interspecific diversity influences productivity
(Crutsinger et al. 2006, 2008). However, it is not known whether this diversity-productivity
relationship for S. altissima is due to ecological complementarity among ecotypes (Hector 1998),
or to the selection effect – an increased probability of high-diversity populations containing
larger, stronger competitors (Aarssen 1997, Huston 1997, Loreau 1998, Wardle 2001). Thus a
crucial question remains; can intraspecific diversity, per se, affect ecosystem function (Loreau
and Hector 2001)?

54
Here we find that experimentally constructed assemblages containing diverse ecotypic
variants of Pseudoroegneria spicata (bluebunch wheatgrass), a widely distributed and dominant
species in western North America, are substantially more productive than synthetic assemblages
composed of low ecotypic diversity (Figure 1A). Importantly, these effects are almost
exclusively due to diversity per se, caused by functional complementarity among ecotypes
(Table 1, Figure 1B).
Pseudoroegneria spicata ecotypes used in this study were collected from 12 sites
spanning their North American distribution, and were grown at four levels of ecotypic richness
(1-, 3-, 8-, and 12-ecotypes). We estimated overyielding for each plot and partitioned the
contributions of selection and complementarity effects after Loreau and Hector (2001). The 8-
and 12-ecotype plots were 20-25% more productive than the monocultures, and were 40% more
productive than 3-ecotype plots, which underyielded by 20% compared to the monocultures.
Individual ecotypes varied in their responses to overall ecotypic diversity; some overyielded at
high richness and others had constant yield at all levels of richness (Table S1). Overyielding at
high diversity was due to positive complementarity effects, which were five times stronger than
selection effects, and opposite in sign (Fig. 1B). This result is consistent with many other studies
investigating overyielding produced by species diversity (Cardinale et al. 2007).
Complementary effects result from many processes, but resource partitioning is the most
commonly cited cause of complementary overielding (Tilman et al. 2001, Mulder et al. 2001,
Ruijven and Berendse 2005, Cardinale et al. 2007, Fargione et al. 2007). Because negative
correlations between available nitrogen and species richness have been taken as evidence for
resource partitioning (Tilman et al. 2001) we measured plant -available nitrate and ammonium in
each plot. We did not find that nitrogen concentrations varied with ecotypic richness or plot

55
productivity. Instead, plots that overyielded produced more biomass than expected for a given
soil concentration of available nitrogen, meaning that P. spicata assemblages that were rich in
ecotypes used soil resources more efficiently than single-ecotype plots. Increased nutrient use
efficiency is also important in systems with complementary overyielding driven by species
richness (Ruijven and Berendse 2005, Fargione et al. 2007).
Soil fungal pathogens have also been shown to determine species diversity – productivity
relationships (Maron et al 2011, Schnitzer et al. 2011). Therefore we applied fungicide to half of
our plots throughout the experiment. We did not find significant effects of fungicide on yield,
complementarity, or selection effects (Table 1). In light of the strong effect of fungi on the
relationship between species richness and productivity in other Montana grassland species grown
the same experimental area (Maron et al. 2011), this result raises the possibility that fungi might
function as broad generalist consumers among ecotypes, but as specialists among species
(Schnitzer et al. 2011). However, it is also possible that our treatment was simply not efficacious
or that P. spicata is less susceptible to fungi than the species used by Maron et al.
In contrast to complementarity effects, which increased with diversity, weak but
statistically significant selection effects decreased with diversity (Fig. 1B, Table 1). Selection
effects were positive in the 3-ecotype plots, but negative in the 12-ecotype plots, suggesting that
when diversity was low, large ecotypes had a competitive advantage in a manner consistent with
theory (Weiner 1990). However, in more diverse plots, the competitive advantage of large
ecotypes waned and the relative competitive ability of smaller ecotypes improved. This novel
evidence of intraspecific diversity leading to more “equitable” intraspecific competitive
interactions (Fridley and Grime 2010) parallels the effects of increasing species richness on
competition among species (Cardinale et al. 2007). It not clear how ecotypic diversity might

56
even the playing field among otherwise asymmetrical competitors, but our results suggest that
genotypic diversity may result in unusual indirect interactions among competing ecotypes.
We focused on among-population rather than within-population diversity in order to
capture as much functional diversity as possible, and to relate performance differences among
ecotypes to differences in their local climate. We observed that at all levels of plot diversity,
ecotypes from cooler, wetter environments overyielded more than ecotypes from hotter, drier
environments (Fig. 2, R2 = 0.020, p = 0.023), and that the ability of home climate to predict
changes in complementarity effect increased when variance caused by diversity and monoculture
yield was removed (R2 = 0.026, p = 0.009). Thus, overyielding of mesic ecotypes occurred
despite, and not because of, the fact that mesic ecotypes tended to have higher monoculture
yields than xeric ecotypes. This is consistent with the theory that diversity-productivity
relationships should be stronger for species adapted to more productive environments (Fridley &
Grime 2010, but see Mulder et al. 2001).
Our use of ecotypes from a wide geographic range demonstrates that throughout its range
P. spicata has undergone tremendous yet cryptic functional diversification. In fact, the
importance of within-species functional diversity of the selected ecotypes matches that of
functional variation among species from similar habitats (Maron and Marler 2007, Maron et al.
2011). It is unknown whether such differentiation is likely to occur within a single population,
but other studies have found important functional variation within populations of P. spicata
(Ridenour et al. 2008), as well as other species (Crutsinger 2006, Crutsinger 2008, Albert et al.
2010a). Nevertheless we caution that our results should not be interpreted as direct evidence of
the importance of within-population functional diversity.

57
In sum, our results demonstrate strong overyielding caused by complementary
interactions among ecotypes, substantial functional variation within a species, and that
intraspecific diversity per se has important and independent effects on ecosystem processes.
Expanding our knowledge of how ecotypic variation can affect ecosystem functioning may be
crucial for predicting the effects of anthropogenic species losses and gains (Wardle et al. 2011)
and for improving our understanding of how assemblages of organisms function in nature
(Hughes et al. 2008, Brooker et al. 2009, Cianciaruso et al. 2009).
REFERENCES AND NOTES
D. Tilman, D. Wedin, J. Knops, Productivity and sustainability influenced by biodiversity in
grassland ecosystems. Nature 379, 718-720 (1996).
J. M. H. Knops, D. Tilman, N. M. Haddad, S. Naeem, C. E. Mitchell, et al., Effects of plant
species richness on invasions dynamics, disease outbreaks, insect abundances, and
diversity. Ecol. Lett. 2, 286–293 (1999).
D. U. Hooper, F. S. Chapin III, J. J. Ewel, A. Hector, P. Inchausti, et al., Effects of biodiversity
on ecosystem functioning: a consensus of current knowledge and needs for future
research. Ecol.Monogr. 75, 3–35 (2005).
P. Balvanera, A. B. Pfisterer, N. Buchmann, J. He, T. Nakashizuka, D. Raffaelli, et al.,
Quantifying the evidence for biodiversity effects on ecosystem functioning and services.
Ecol. Lett. 9, 1146-1156 (2006).
B. J. Cardinale, J. P. Wright, M. W. Cadotte, I. T. Carroll, A. Hector, et al., Impacts of plant
diversity on biomass production increase through time because of species
complementarity. Proc. Natl. Acad. Sci., U.S.A. 104 18123-18128 (2007).

58
S. Díaz, M. Cabido, Vive la différence: Plant functional diversity matters to ecosystem
processes. TREE 16, 646-655 (2001).
B. J. McGill, B. J. Enquist, E. Weiher, M. Westoby, Rebuilding community ecology from
functional traits. TREE 21, 178-185 (2006).
A. R. Hughes, B. D. Inouye, M. T. J. Johnson, N. Underwood, M. Vellend, Ecological
consequences of genetic diversity. Ecol. Lett. 11, 609-623.
E. Garnier, J. Cortez, G. Billès, M. Navas, C. Roumet, et al., Plant functional markers capture
ecosystem properties during secondary succession. Ecology 85, 2630-2637.
C. H. Albert, W. Thuiller, N. G. Yoccoz, R. Douzet, S. Aubert, et al., A multi-trail approach
reveals the structure of intra- vs. interspecific variability in plant traits. Funct. Ecol. 24,
1192-1201 (2010).
J. Clausen, D. D. Keck, W. M. Hiesey, Regional differentiation in plant species. Am. Nat.
75,231-250 (1941).
S. Cordell, G. Goldstein, D. Mueller-Dombois, D. Webb, P. M. Vitousek, Physiological and
morphological variation in Metrosideros polymorpha, a dominant Hawaiian tree species,
along an altitudinal gradient: The role of phenotypic plasticity. Oecologia 113, 188-196
(1998).
C. H. Albert, W. Thuiller, N. G. Yoccoz, A. Soudant, F. Boucher, et al., Intraspecific functional
variability: Extent, structure and sources of variation. J. Ecol. 98, 604–613 (2010).
J. D. Fridley, J. P. Grime, Community and ecosystem effects of intraspecific genetic diversity in
grassland microcosms of varying species diversity. Ecology 91, 2272-2283 (2010).

59
G. M. Crutsinger, M. D. Collins, J. A. Fordyce, Z. Gompert, C. C. Nice, et al., Plant genotypic
diversity predicts community structure and governs an ecosystem process. Science 313,
966-968 (2006).
G. M. Crutsinger, L. Souza, N. J. Sanders, Intraspecific diversity and dominant genotypes resist
plant invasions. Ecol. Lett. 11, 16-23 (2008).
A. Hector, The effect of diversity on productivity: Detecting the role of species complementarity.
Oikos 82, 597-599 (1998).
L. W. Aarssen, High productivity in grassland ecosystems: Effected by species diversity or
productive species? Oikos 80, 193-184 (1997).
M. A. Huston, Hidden treatments in ecological experiments: Re-evaluating the ecosystem
function of biodiversity. Oecologia 110, 449-460 (1997).
M. Loreau, Separating sampling and other effects in biodiversity experiments. Oikos 82, 600-602
(1998).
D. A. Wardle, Experimental demonstration that plant diversity reduces invasibility – evidence of
a biological mechanism or a consequence of sampling effect? Oikos 95, 161-170 (2001).
M. Loreau, A. Hector, Partitioning selection and complementarity in biodiversity experiments.
Nature 412, 72-76 (2001).
D. Tilman, P. B. Reich, J. Knops, D. Wedin, T. Mielke, et al., Diversity and productivity in a
long-term grassland experiment. Science 294, 843–845 (2001).
C. P. H. Mulder, D. D. Uliassi, D. F. Doak, Physical stress and diversity-productivity
relationships: The role of positive interactions. Proc. Natl. Acad. Sci., U.S.A. 98, 6704-
6708 (2001).

60
J. van Ruijven, F. Berendse, Diversity-productivity relationships: Initial effects, long-term
patterns, and underlying mechanisms. Proc, Natl. Acad. Sci., U.S.A. 102, 695-700 (2005).
J. Fargione, D. Tilman, R. Dybzinski, J. HilleRisLambers, C. Clark, et al., From seelction to
complementarity: Shifts in the causes of biodiversity-productivity relationships in a long-
term biodiversity experiment. Proc. R. Soc. Lond. Ser. B 274, 871-876 (2007).
J. L. Maron, M. Marler, J. N. Klironomos, C. C. Cleveland, Soil fungal pathogens and the
relationship between plant diversity and productivity. Ecol. Lett. 14, 36-41 (2011).
S. A. Schnitzer, J. N. Klironomos., J. HilleRisLambers, L. L. Kinkel, P. B. Reich, et al., Soil
microbes drive the classic plant diversity-productivity pattern. Ecology 92, 296-303
(2011).
J. Weiner, Asymmetric competition in plant populations. TREE 5, 360-364.
J. L. Maron, M. Marler, Native plant diversity resists invasion at both low and high resource
levels. Ecology 88, 2651-2661.
W. M. Ridenour, J. M. Vivanco, Y. Feng, J. Horiuchi, R. M. Callaway, No evidence for
tradeoffs: Centaurea plants from America are better competitors and defenders than
plants from the native range. Ecol. Monogr. 78, 369-386.
D. A. Wardle, R. D. Bardgett, R. M. Callaway, Wm. H. Van der Putten. Terrestrial ecosystem
responses to species gains and losses. Science 332, 1273-1277.
R. W. Brooker, R. M. Callaway, L. A. Cavieres, Z. Kividze, C. J. Lortie, et al., Don’t diss
integration: A comment on Ricklef’s disintegrating communities. Am. Nat. 174, 919-927
( 2009).
M. V. Cianciaruso, M. A. Batalha, K. J. Gaston, O. L. Petchey, Including intraspecific variability
in functional diversity. Ecology 90, 81–89 (2009).

61
ACKNOWLEDGEMENTS
We thank E. Lahr for her help in the field and in writing this manuscript, D. Hooper, R. Fletcher,
E. Matos-Negrón, and M. Luce for their invaluable help in the field and lab. This research was
funded by the National Science Foundation Graduate Research Fellowship Program.

62
FIG. 1. Effect of ecotypic richness on total plot yield (A: R2 = 0.129, p = 0.031), and on total
overyielding (B: solid), complementarity (B: dashed), and selection effects (C: stippled).
888888888888
Eff
ect
on
yie
ld (
g/m
2)
-300
-200
-100
0
100
200
300
400
500
Ecotypes per plot
3 128 1212333 1283 12128 1288333 833 88 123 8 12121288 1283
Plo
t yie
ld (
g)
0
100
200
300
400
500
Selection Complementarity
Net over or underyielding
3 12
Complementarity effect
Selection effect

63
FIG. 2. Relationship between ecotype home climate and relative yield. The climate factor score
CPCA1 is shown on the x-axis. Greater values indicate cooler, moister conditions. Relative
yield represents the difference in performance of each ecotype relative to its monoculture yield.
Symbols correspond to plots containing 3- (closed circles), 8- (open circles), and 12-ecotypes
(open squares).
REGR factor score 1
-1.5 -1.0 -0.5 0.0 0.5 1.0 1.5 2.0
dR
Y a
dju
ste
d
-0.3
-0.2
-0.1
0.0
0.1
0.2
3 ecotypes
8 ecotypes
12 ecotypes
xeric mesic
over
yielding
under
yielding

64
TABLE 1. Total Overyielding Complementarity Effect Selection Effect
Term df MS F p MS F p MS F P
Intercept 1 107769 4.596 0.040 186029 6.626 0.015 10616 3.956 0.055
Richness 1 203850 8.693 0.006 318975 11.361 0.002 12833 4.782 0.036
Fungicide 1 9205 0.393 0.535 17252 0.614 0.439 1253 0.467 0.499
Rich. ×
Fung. 1 5338 0.228 0.637 19204 0.684 0.414 4291 1.599 0.215
Error 32 23451 28077 2684
Total 36
Results of linear models of total overyielding, complementarity, and selection effect (g/m2)
against main effects and interaction effects of ecotypic richness and fungicide treatment.
SUPPLEMENTARY MATERIALS AND METHODS
We used ecotypes collected from 12 sites throughout the North American range of P.
spicata (Figure S1). Seeds were field collected or acquired from true-bred lines collected and
managed by the USDA Plant Germplasm Introduction and Testing Research Station in Pullman,
WA, USA. The one exception was the purchase from a commercial vendor of seeds of a high-
yielding wild-selected cultivar from southeastern Washington, “Goldar.” We determined
latitude-longitude coordinates for each seed source and identified the nearest National Weather
Service Cooperative Observer Program (COOP) climate station with similar topography to the
source locality. Using information provided by the Western Regional Climate Center
(http://www.wrcc.dri.edu), we collected data on average July maximum temperature; number of
days over 90 °F per year; total spring, summer, and yearly precipitation; heating degree days

65
below 65 °F; and cooling degree days above 55 °F. All data were averages over the entire
operation time of each station. Climate data were reduced into two factors using a principle
components analysis (Table S2). Scores were not rotated and were extracted using a correlation
method. Two scores were extracted according to the Kaiser criterion (retain factors with
Eigenvalues > 1) but only the first factor (CPCA1) was used for analysis because the meaning of
the second component axis was difficult to interpret. Increased values for CPCA1 corresponded
to wetter, cooler conditions (Table S3).
Seeds from each ecotype were planted into conical starter pots and grown for two months
in a greenhouse at the University of Montana. Transplants were placed into 96 cm × 64 cm
common garden plots located at Fort Missoula, Missoula, MT, USA, early in the spring of 2010.
Each plot contained 24 plants set in rows 16 cm apart. Adjacent plots were separated by 50 cm
of bare ground. We planted plots at four levels of ecotypic richness (1, 3, 8, and 12 ecotypes per
plot). Ecotypes were randomly selected for each 3- and 8-ecotype plot and planting position was
randomized. We treated half of these plots with fungicide consisting of 1 g * m-2
of Cleary 3336
WP (active ingredient: thiophanate-methyl, a systematic broad-spectrum fungicide) and 117.3 μl
Ridomil Gold EC (active ingredient: metalzxyl, a soil drench preventative fungicide). Fungicide
was applied as a soil drench from a pressurized sprayer. Fungicide treatment followed Maron et
al. (2011), and fungicide was applied to plots after they had been wetted by rainfall or watering.
Each fungicide-treated plot was sprayed in the spring during initial leaf flush and again in
midsummer, in both years of the study.
For the 3-, 8-, and 12-ecotype plots, there were six replicates of the control and six of the
fungicide treatment. These replicates were paired such that each fungicide treated plot
corresponded to a matching control plot with the same ecotypic makeup. Because of poor

66
germination rates and problems with seed availability, we did not have enough seeds to plant
monoculture plots for each ecotype, and we could not establish six replicates for any single
ecotype. We planted monoculture plots for six of the twelve ecotypes, and had 1-2 replicates for
each of these in the control and in the fungicide treatments.
Plants were grown for two full seasons (in 2010 and 2011). In the first season we
watered as necessary to reduce transplant stress. In the second season, however, plots only
received natural precipitation. We estimate that common garden conditions in 2011, when most
growth occurred, represented a climate intermediate in conditions relative the climatic ranges of
the ecotypes, but slightly more mesic than average (estimated factor score = 0.403, Table S2).
In the fall of 2011 we harvested, dried, and weighed the aboveground biomass from each
plot. Immediately after harvest three soil cores were taken from each plot at a depth of 8 cm, and
pooled. Cores were sieved to 2 mm and extracted overnight in 2 M KCl buffer to remove free
nitrate and ammonium. Samples were analyzed for ammonium and nitrate concentration
colorimetrically at the University of Montana Soil Biogeochemistry Lab. We obtained wet and
dry mass of the soil to determine water content and calculate nitrogen concentrations on a dry
weight basis.
We estimated diversity-dependent overyielding and partitioned the influences of selection
and complementarity effects on net overyielding, after Loreau and Hector (2001). This method
required us to measure monoculture yields for all ecotypes. For reasons described above, we
only measured monoculture yields for 6 of the 12 the ecotypes used in this study. To address
this limitation we followed two different approaches. In the first approach, we restricted initial
analyses to the six ecotypes for which we had monoculture yields. In the second approach, we
estimated monoculture yields for 11 ecotypes using projected linear estimates of yield as a

67
function of richness. Briefly, we calculated least-squares best fit lines of yield against richness
using data from the 3-, 8-, and 12-ecotype plots for each ecotype. We then extrapolated an
estimate of the yield at richness = 1 for each ecotype other than ecotype 5, which we did not
attempt to estimate monoculture yield for because it was not present in any 3-ecotype plots.
Because all six ecotypes that were grown in monoculture under-yielded in the 3-ecotype
treatment, this approach consistently underestimated their monoculture yields for those six
ecotypes. To account for this, we adjusted our extrapolated estimate so that the average
projected yield for these six ecotypes matched their average actual yield. We applied this
correction to all ecotypes by adding 70 g to the monoculture yield estimate for each ecotype.
This approach was conservative, because it had the effect of making positive complementarity
and selection effects harder to detect. Both approaches yielded quantitatively and qualitatively
similar results. Results based on estimated monoculture yield are reported in the manuscript, and
results of analyses restricted to ecotypes with measured monoculture yields are presented in the
supplementary materials (Table S4).
In order to determine whether ecotypes responded consistently to increased richness, we
used a general linear model with natural log-transformed average ecotype biomass in a plot as a
response variable, ecotypic richness as a covariate, fungicide treatment as a fixed factor, and
ecotype identity as a random factor (Table S1). All two-way interaction terms were also
included. We also used general linear models to estimate the effects of ecotypic richness and
treatment on total overyielding, complementarity effect, and selection effect. Ecotypic richness
was used as a covariate, and fungicide treatment was used as a fixed factor. An interaction term
between richness and treatment was also included. We ran models both using estimates based on
projected monoculture yields for 11 ecotypes (Table 1) and on actual monoculture yields for 6

68
ecotypes (Table S4). To determine how richness, climate, and monoculture yield affected
overyielding, we used a general linear model with relative overyielding (ΔRY) as a response
variable, and richness, CPCA1, and estimated monoculture yield as covariates. For replicates we
used mean ecotype yield in each plot (n = 254). To evaluate how soil nitrogen correlated with
overyielding, we used Pearson correlations. Select correlations between complementarity effect,
ecotypic richness, and N-normalized plant yield were evaluated (Fig. 3). We define N-
normalized plant yield as total plot yield divided by soil available nitrogen.

69
SUPPLEMENTARY FIGURES
FIG. S1
10
86
9
35 11
12
1
4
7
2
Map of collection locations for the ecotypes used in this study.
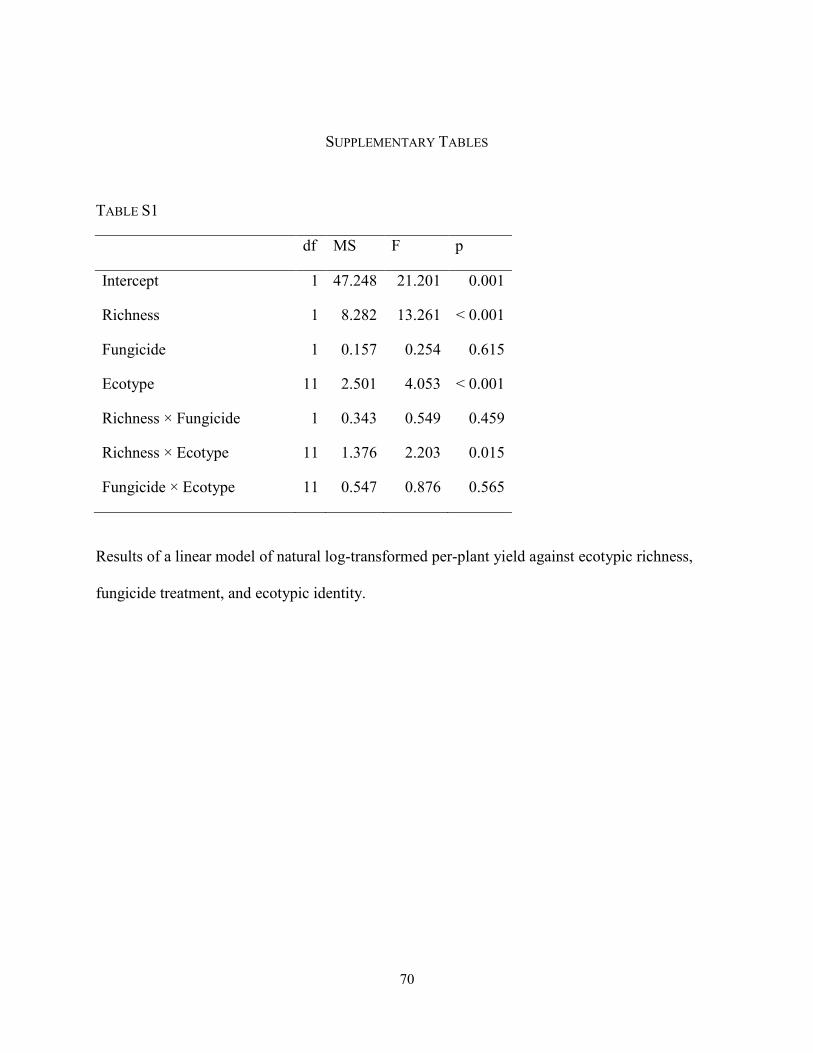
70
SUPPLEMENTARY TABLES
TABLE S1
df MS F p
Intercept 1 47.248 21.201 0.001
Richness 1 8.282 13.261 < 0.001
Fungicide 1 0.157 0.254 0.615
Ecotype 11 2.501 4.053 < 0.001
Richness × Fungicide 1 0.343 0.549 0.459
Richness × Ecotype 11 1.376 2.203 0.015
Fungicide × Ecotype 11 0.547 0.876 0.565
Results of a linear model of natural log-transformed per-plant yield against ecotypic richness,
fungicide treatment, and ecotypic identity.

71
TABLE S2
Ecotype Lat Long Weather Station
July
Max.
(°C)
Days
over
32.2 °C
Spring
Precip
Summer
Precip
Total
Precip HDD CDD
CPCA
1
CPCA
2
1 39.05 -108.70 Colorado NM 051772 33.4 51.2 74 71 282 5671 2516 -1.227 0.536
2 46.51 -114.08 Stephensville 247894 29.6 20.7 79 86 316 7508 975 0.329 -1.016
3 43.67 -118.98 Burns 351176 29.6 21.0 66 41 294 7140 1200 -0.111 -1.138
4 Anatone 2S 450184 26.9 9.2 148 92 547 7506 870 1.535 0.878
5 44.35 -117.27 Huntington 354098 34.5 62.7 76 40 311 5631 2514 -1.553 0.707
6 46.60 -117.17 Pullman Exp Stn 456784 27.9 13.4 129 60 505 6614 1263 0.829 0.953
7 46.87 -113.95 Missoula 2 NE 245735 28.6 19.5 126 120 433 7443 1128 0.999 0.367
8 46.63 -118.20 Little Goose Dam 454702 32.6 46.5 65 40 289 4825 2309 -1.340 0.585
9 44.40 -118.95 Canyon City 351352 30.9 34.5 125 54 394 5810 1472 -0.096 0.959
10 47.48 -111.53 Great Falls Airpo 243751 28.6 18.7 124 136 379 7685 1277 0.973 0.089
11 43.64 -113.40 Arco 3 SW 100375 30.2 19.1 66 58 241 8426 1082 0.066 -1.979
12 40.00 -116.12
Pine Valley Baily Ranch
266242 32.6 48.0 98 43 272 7564 944 -0.403 -0.940
Garden
2010 Missoula Airport 84 14 84 95 363 7565 1108 0.998 -0.007
Garden
2011 Missoula Airport 85 26 98 150 418 7342 1084 0.403 -0.614
Ecotype locality data, including latitude and longitude, location of nearest COOP station, average July maximum temperature, number
of days per year over 32.2 °C, spring precipitation, summer precipitation, yearly total precipitation, heating degree days below 65 °F
(HDD), cooling degree days above 55 °F (CDD), and climate factor scores (CPCA1 and CPCA2). Precise coordinates of the locality
for Ecotype 4 (Goldar) are unknown, but the collection is known to be from Asotic County, WA, USA. Common garden conditions
are also shown for both years of the study (Garden 2010 and Garden 2011).

72
TABLE S3
CPCA1 CPCA2
Average July Max. Temp. -0.961 -0.003
Yearly Days Over 32.2 °C -0.918 0.176
Spring Precipitation 0.764 0.549
Summer Precipitation 0.694 0.131
Yearly Precipitation 0.731 0.639
Heating Degree Days (65 °F) 0.698 -0.652
Cooling Degree Days (55 °F) -0.825 0.441
Eigenvalue / Final Loading 4.531 1.377
% Variance Explained 65% 20%
Results of principal components analysis for climate variables.
TABLE S4
Total Overyielding Complementarity Effect Selection Effect
Term df MS F p MS F p MS F p
Intercept 1 88207 2.362 0.135 153960 2.887 0.100 9096 0.697 0.410
Richness 1 174949 4.684 0.039 263161 4.934 0.034 8972 0.688 0.413
Fungicide 1 13382 0.358 0.554 13813 0.259 0.615 3 0.000 0.987
Rich. ×
Fung. 1 8079 0.216 0.645 22231 0.417 0.523 3507 0.269 0.608
Error 32 37349 53332 13044
Total 36
Results of linear models of total overyielding, complementarity, and selection effect (g/m2)
against main effects and interaction effects of ecotypic richness and fungicide treatment, using
data only for the six ecotypes with known monoculture yield (compare to Table 1).

73
CHAPTER 4
EXTENDED ECOLOGICAL CONSEQUENCES OF INVADER-DRIVEN SELECTION
Abstract: Invasive plant species can drastically decrease the abundances of native plant species
and in the process act as an ecological filter that selects for the survival of individuals that
compete better with the invader. However, increased competitive ability in general is thought to
incur costs or tradeoffs in performance in other situations, such as the ability to tolerate stress or
defend against herbivores. Thus selection for the ability to compete with an invader may have
“extended consequences” for other ecological traits. However, to my knowledge no studies have
explored the extended consequences of invader-driven selection. I compared the performance of
offspring of two native plant species and one exotic species collected from outside patches of the
invasive forb Euphorbia esula to that of offspring from individuals collected inside Euphorbia
patches. Individuals of the exotic annual Bromus japonicus inside Euphorbia patches allocated
more resources to roots compared to individuals outside Euphorbia patches over a wide range of
treatments. For the native perennial bunchgrass Poa secunda, the offspring of individuals
growing inside Euphorbia patches showed lower plasticity in root allocation than those collected
from outside Euphorbia patches. For the native perennial bunchgrass Pseudoroegneria spicata,
we found no evidence that survivors of Euphorbia invasion differed in a heritable manner from
populations that had not experienced invasion. Provided that Euphorbia was the agent of
selection that produced these differences, and that they are not due to some other process such as
selection by another agent or maternal effects, these results suggest that selection caused by an

74
invader may have consequences for how native populations decimated by invasions respond in
specific ways to the invader, but also to other aspects of their biotic and abiotic environment.
Key Words: competition, drought, ecological-evolutionary feedback, geographic mosaic,
herbivory, invasion, leafy spurge, natural selection, resources, traits
INTRODUCTION
Exotic plant species often cause severe local losses in native species abundance and
diversity (Ridenour and Callaway 2001; Braithwaite et al. 1989; Memmott et al. 2000; Grigulis
et al. 2001; Maron and Marler 2008a; Hejda et al. 2009; Vilá et al. 2011) and reduced growth
and reproduction of native survivors (Gordon 1998; Maron and Marler 2008b, Atwater et al.
2011). Correspondingly, there is broad evidence that mortality caused by invasive plants acts as
a filter to select for increased competitive ability in the surviving individuals in native plant
populations (Callaway et al. 2005, Lau 2006, Mealor and Hild 2007, Cipollini and Hurley 2008,
Leger 2008, Ferrero-Serrano et al. 2010, Rowe and Leger 2011, Goergen et al. 2011). However,
only two studies have also investigated whether such disproportionate survival affects native
plants in ways other than how they compete with the invader. Lau (2006) found that Medicago
sativa selected for individuals of the native Lotus wrangelianus that were more susceptible to a
non-native herbivore. Ferrero-Serrano et al. (2010) found that Hesperostipa comata and Stipa
airoides individuals that survived Acroptilon repens invasion were better competitors against a
different invasive species than those that did not experience invasion, but they did not measure
the whether these plants were also better competitors against Acroptilon. These studies raise the

75
intriguing possibility that invader-imposed selection may affect aspects of the ecology of natives
other than the ability to compete with the invader.
Ecological theory also provides a strong context for why selection for increased
competitive ability might have extended consequences for the native genotypes that survive
invasion. The ability of plants to compete with their neighbors is thought to be constrained by
fundamental ‘‘compromises between the conflicting selection pressures resulting from particular
combinations of competition, stress, and disturbance’’ (Grime 1977). In other words, being a
strong competitor may reduce a species’ ability to colonize new ground, tolerate abiotic stress
(Grime 1977), or to defend itself against herbivores (Herms and Mattson 1992). Furthermore,
for reasons that are poorly understood, in some cases species appear to specialize in competition
against certain species or genotypes at the expense of their ability to compete against other
species or genotypes (Taylor and Aarssen 1990, Fridley et al. 2007). For these reasons, selection
for greater competitive ability in a native species might affect how that species interacts with
other native or invasive competitors, responds to herbivory, and responds to variation in its
abiotic environment. I refer to these ramifications of invader-imposed selection on natives as
“extended consequences” of selection by invaders.
Here I compare the performance between offspring of grasses growing inside and outside
of patches of the high-impact invader, Euphorbia esula L. (leafy spurge) and investigate whether
offspring of adults that have survived Euphorbia invasion differ in their ability to 1) compete
with Euphorbia; 2) compete with a native grass, Festuca idahoensis; 3) tolerate drought; 4)
respond to fertilization; and 5) tolerate clipping. I chose these treatments because they represent
a variety of conditions theorized to involve tradeoffs with competitive ability. I used two native
grasses, Pseudoroegneria spicata (Pursh) A. Löve (bluebunch wheatgrass) and Poa secunda J.

76
Presl. (Sandberg’s bluegrass), and one exotic grass, Bromus japonicus Thunb. (Japanese brome),
as focal species. If the offspring of individuals that survive invasion differ in traits other than the
ability to compete with Euphorbia, and in the context of alternative interpretations discussed
below, then selection by Euphorbia may have broad consequences for the ecology and evolution
of other species.
METHODS
Study Species: Euphorbia esula is a clonal forb native to Eurasia, but highly invasive in the
Northern Great Plains and Intermountain West. Through shading, root competition, nutrient
sequestration, allelopathy, toxicity to native grazers, and a vigorous vegetative reproductive
habit, Euphorbia is a strong invader sensu Ortega and Pearson (2005) and an exceptionally
aggressive competitor (Dittberner et al. 1983; Cyr and Bewley 1989; Trammell and Butler 1995)
that reduces native diversity in many different community types (Belcher and Wilson 1989).
Euphorbia forms clonal patches with discrete boundaries, owing to a primarily vegetative
reproductive habit (Best et al. 1980).
I tested the differences between grasses that survived Euphorbia invasion and grasses
from uninvaded communities for three species: two native grasses (Pseudoroegneria spicata and
Poa secunda) and one exotic grass (Bromus japonicus). Pseudoroegneria is a large, long-lived,
dominant native perennial bunchgrass that reproduces sexually and is common throughout the
semi-arid grasslands of the Western United States where it is a valuable rangeland species. It
persists at low abundance in mono-dominant Euphorbia stands (Atwater et al. 2011). Poa
secunda is a small native bunchgrass common in the prairies of western Montana that can
reproduce sexually but that is facultatively apomictic (Kellogg 1987). It persists within

77
Euphorbia patches and can flower and set seed even in dense patches (D.Z. Atwater, pers. obs.).
Bromus japonicus is a small exotic annual grass that grows in interstitial spaces in bunchgrass
communities and also grows relatively well within Euphorbia stands (D. Z. Atwater, pers. obs.).
Bromus is almost exclusively self-fertile with very high homozygosity (Oja and Jaaska 1998).
One experimental treatment was competition with Festuca idahoensis. Festuca is a small but
very common and widespread native cool-season bunchgrass that co-occurs with
Pseudoroegneria at my study sites and throughout the intermountain grasslands of Montana
(Atwater et al. 2011).
Experimental Design: I collected seeds of the three target species from inside and outside of
Euphorbia patches at 7 sites in the Missoula Valley in Western Montana (Table 1). No site had a
recent history of herbicide use or grazing (M. Valliant, B. Lindler, G. Thelen, pers. comm.).
Although other invasive exotic plants were present at all of the study sites, we selected patches
with minimal colonization of exotics other than Euphorbia esula and Bromus japonicus. Seeds
were collected in 2008 and 2010 and were used in experiments designed to compare the abilities
of progeny to compete with Euphorbia and respond to other experimental conditions.
In 2008 I collected seeds of Pseudoroegneria, Poa, and Bromus from five sites (Table 1).
Each site was 1-5 km from the nearest other site. At each site I identified a large (approximately
0.25 ha) patch of Euphorbia and haphazardly collected seeds from 25 individuals of each species
inside and > 25 plants of each species immediately outside of each Euphorbia patch. Seeds of
each species from each environment were pooled separately for each site. I applied five
treatments to seedlings of these species, but each species did not receive all treatments (Table 2).
These treatments were the control, competition with Euphorbia, competition with Festuca,

78
drought, and clipping. Seeds were planted in 550 mL pots containing a 50/50 mix of sand and
locally collected native soil and thinned to one seedling per plot three weeks after planting. In
the control treatment, individuals of each species were grown alone (n = 7-11 for each habitat-
treatment-species combination). I administered the drought treatment by watering once per week,
instead of three times per week as in the other treatments. This allowed the upper portion of the
soil to dry to the touch between watering events. For the Festuca competition treatment, I
planted Festuca seeds in each pot. Three weeks later, I thinned them to one seedling and then
added seeds of the target plants. For the Euphorbia competition experiment, rhizomes from a
Euphorbia stand, different from the stands from which seeds were collected, were collected from
a site several kilometers from any sites where seed was collected. These rhizomes were cut into
3-4 cm pieces and transplanted these into pots where they vegetatively produced shoots. Four
weeks after planting rhizomes I added seeds of Pseudoroegneria, Poa, and Bromus. In the
treatment designed to mimic tolerance to herbivory (Newingham et al. 2005), after thinning to
one individual per plot, all leaf tissue above 1 cm was clipped with scissors immediately after
thinning, and one month later leaf tissue was removed again in the same manner. After four
months I harvested all plants, dried roots and shoots separately at 60oC, and weighed them.
In 2010, I used all of the 2008 sites and also sampled at two new sites (Table 1). I collected
seeds for Pseudoroegneria as in 2008, but I did not collect seeds of Poa in 2010. For Bromus I
collected entire adult plants at the same time I collected their seeds, and weighed shoot and seed
mass. I controlled for genotype by assigning full siblings to each treatment. Because Bromus is
almost entirely self-pollinated and has high homozygosity (Oja and Jaaska 1998), full siblings of
Bromus are genetically nearly identical to their parents. Seedlings grown from this field-
collected seed of both Bromus and Pseudoroegneria collected in 2010 were subjected to five

79
treatments (each treatment, n = 10): control, competition with Euphorbia, fertilization,
competition with Festuca, and clipping. In this experiment Festuca seeds were planted at the
same time as Pseudoroegneria and Bromus. For the fertilizer treatment, each pot received 0.136
g of MiracleGro in a 100 mL solution immediately after thinning.
Data Analysis: I used a variance partitioning approach to investigate whether invasion status (i.e.
seeds collected inside our outside of Euphorbia patches) had significant effects on performance,
and to identify whether the extended consequences of selection by Euphorbia were consistent
across treatments. A significant main effect of invasion status was interpreted as evidence for
selection by Euphorbia. A significant invasion status × treatment interaction indicated that
selection by Euphorbia affected plants differently in different treatments. For all data, I used
ANOVA with site as a random factor, and invasion status (inside or outside of Euphorbia patch),
and treatment as fixed factors. I modeled the main effects for each factor, plus all second order
interactions. Because the full factorial models contained a large number of interaction terms,
which can cause problems of over-fitting, I decided a priori to use a stepwise removal approach
to arrive at each final, reported model. Briefly, I began with a full factorial model containing all
main effects and possible second order terms. Next, the second-order factor with the lowest P-
value was removed. When all second order factors were P ≤ 0.100, no more factors were
removed. Main effects were retained even if they were not significant. Such an approach does
not always arrive at the best-fitting model, but it is an efficient way to pare poorly fitting terms
(Kadane & Lazar 2004, Whittingham et al. 2006). Because I controlled for Bromus genotype in
2010, the 2010 data for Bromus could have been analyzed using treatment as a within-subject
factor. However, due to low seed availability, only about half of the families produced

80
successfully germinated Bromus seedlings in all treatments. Because this halved my sample size
when treatment was modeled as a within-subject factor, I chose not to model treatment as a
within-subject factor, instead treating it as a typical fixed factor. This enabled me to use all of
my data despite missing variables.
To determine whether genetic constraints influenced how individual Bromus genotypes
responded to different treatments, I used a principal components analysis of performance traits
for Bromus siblings growing in each treatment. I used a “varimax” rotation to identify
orthogonal factors and performed the analysis on correlation matrices. The Kaiser criterion
(retaining factors with initial Eigenvalues > 1) was used for factor selection. Missing values
were filled with within-treatment means. If responses to different treatments cluster into the
same component factors, it suggests the presence of underlying genetic correlations that
simultaneously influence the performance of Bromus in multiple treatments. Thus this analysis
allowed investigation of correlations in performance among treatments and whether these
correlations had a genetic basis. This analysis was available only for Bromus because Bromus
was the only species for which I subjected siblings to each treatment. Because Bromus did not
differ in performance with respect to invasion status in 2010, I decided post hoc to include all
Bromus irrespective of invasion status in the PCA model. I performed this and all other analyses
using the PASW Statistics version 18.0.0 GradPack (SPSS, IBM Software, July 30, 2009).
RESULTS
In 2008, two species (Poa secunda and Bromus japonicus) performed differently
depending upon whether they were collected inside or outside of patches of Euphorbia esula.
More specifically, in 2008, Poa plants produced from seed collected from Euphorbia patches

81
showed treatment-specific changes in root mass in comparison to conspecifics collected outside
Euphorbia patches. In the control and drought treatments, Poa from inside Euphorbia patches
had a greater root mass ratio (RMR), but in competition with Euphorbia they had a lower RMR.
Thus there was no main effect of Euphorbia invasion status on Poa RMR (p = 0.353), but there
was a significant treatment × invasion status interaction (p = 0.027, Table 3). Conversely, for
Bromus in 2008, there was a significant main effect of invasion status on RMR (p = 0.042) and a
strong trend for root mass (p = 0.062), but no significant interaction between treatment and
invasion status (Table 3). In other words, Bromus from inside of Euphorbia patches
demonstrated increased root investment in the control, drought, Euphorbia competition, Festuca
competition, and artificial herbivory treatments, compared to Bromus produced from uninvaded
communities. For both Bromus and Poa in 2008, the performance of greenhouse-reared
seedlings also differed depending upon which site seeds were collected from (significant site or
site x treatment interaction, Table 3). I was unable to analyze Pseudoroegneria in 2008 due to
low sample sizes caused by poor germination, and in 2010, I found no differences in the
performance of either Pseudoroegneria or Bromus seedlings depending upon whether they were
collected inside or outside of Euphorbia patches despite adequate germination rates for both
species (Table 4), although performance again varied significantly among sites (p < 0.050).
Principal Components Analysis (PCA) on Bromus performance data collected in 2010
produced five factors that met my retention criterion (Eigenvalues > 1), an outcome supported by
a scree plot of the Eigenvalues. Once rotated, all factors contributed between 17.3% and 19.4%
to the total variance explained by the analysis, and together they explained 92.6% of the variance
present in the initial ten variables. In the rotated factor solution, root and shoot masses of
Bromus in each treatment loaded strongly into a single factor score representing primarily that

82
treatment and with virtually no loading into other scores (Table 5). Thus, performance in any
given treatment was almost completely independent of performance in other treatments. In
other words, genotypes with large roots in a given treatment also produced large shoots in that
treatment, but performance in that treatment did not correlate with performance in any other
treatment.
DISCUSSION
My results indicated that heritable changes in the performance of the offspring of a native
species and an exotic invasive species have occurred during Euphorbia invasion. Such changes
have been typically interpreted as evidence of selection caused by invasive plants (see Callaway
et al. 2005, Lau 2006, Mealor and Hild 2007, Cipollini and Hurley 2008, Leger 2008, Ferrero-
Serrano et al. 2010, Rowe and Leger 2011, Goergen et al. 2011), particularly when the offspring
of plants in invaded communities compete better with the invader than those from uninvaded
communities. However, selection by invasive plants is not the only process that could result in
these differences in performance. For example, pre-existing micro-site conditions may have
constrained the distribution of the invader and simultaneously caused selection in Bromus and
Poa. This concern is common to most, if not all, studies that have investigated selection caused
by invasive plants (Callaway et al. 2005, Lau 2006, Mealor and Hild 2006, Mealor and Hild
2007, Cipollini and Hurley 2008, Leger 2008, Ferrero-Serrano et al. 2010, Rowe and Leger
2011, Goergen et al. 2011), because all of these studies have used naturally, rather than
experimentally, invaded communities. Importantly, Euphorbia reproduces vegetatively creating
very distinct patch boundaries and all Euphorbia patches in the study area have been present for
less than 20 years. Furthermore, all un-invaded native communities sampled in 2008 were

83
colonized by Euphorbia by 2010, confirming that Euphorbia was not limited by micro-site
conditions at these study sites. This makes it less likely that micro-site variation confounded the
selective effects of Euphorbia.
If the differences between conspecific individuals reported here are caused by Euphorbia
and not microsite conditions, these differences may still not be due to selective mortality on
certain genotypes, but instead to maternal effects. For example, poor conditions in dense
Euphorbia patches may result in reduced maternal investment in seed production, resulting in
smaller seeds being produced by plants in Euphorbia patches. Although we did not observe
differences in seed mass for the progeny of Poa and Bromus collected inside and outside
Euphorbia patches in 2008 (T-test; t4 = 0.457, P = 0.672; t4 = 0.631, P = 0.563), when selection
was observed, epigenetic and transgeneration inheritance can occur in ways that are not reflected
in seed mass and that we could not measure in this study. Such effects can involve transmission
of cytoplasmic genetic information, differential partitioning of endosperm resources, and
environmental effects that alter seed morphology and energy storage, and even DNA and
chromosome modification by either parent plant (Roach and Wulff 1987, Rapp and Wendel
2005).
I hypothesized that Euphorbia would select for increased competitive ability in the
offspring of individual native and exotic grasses that survived invasion, and that extended
consequences of selection by Euphorbia would reflect tradeoffs between competitive ability,
response to abiotic stress, and tolerance to herbivores (see Grime 1977, Herms and Mattson
1992), indicated by a significant interaction between treatment and invasion status (i.e. whether
the seedling came from a Euphorbia-invaded community or not). For example, selection might
favor competitive performance against Euphorbia but also lead to a decline in tolerance to

84
drought or herbivory. For Poa, there was a significant treatment × invasion status interaction for
root mass ratio, although not one that was consistent with the hypothesized predictions.
Specifically, in the competition and drought treatments, seedlings from Euphorbia-invaded
patches had lower root mass ratio than those from un-invaded communities, but root allocation
did not vary in the Euphorbia competition treatments (Fig. 1B). As a result, root investment for
Poa that survived invasion was much more uniform across treatments than root investment for
Poa from uninvaded communities. One possible explanation for this pattern is that Euphorbia
selected for variants of Poa with lower plastic responses to drought and competition.
For Bromus, on the other hand, invasion status was only important as a main effect,
meaning that selection by Euphorbia had similar effects across all of the different treatments I
applied. Thus, my results suggest the possibility that selection by Euphorbia has extended
consequences, in the sense that it affects how plants respond to different experimental treatments
(Fig. 1D). However, the performance of Poa and Bromus in these experiments did not clearly
indicate that the hypothesized ecological or physiological tradeoffs mediate these responses.
Tradeoff theory concerning competitive ability is based on the notion that genetic and
physiological constraints prevent a single species or genotype from outperforming all other
species in a community under all conditions. In addition to influencing mean performance in
different conditions, such constraints should also result in covariance in the performance of
species or genotypes grown under different conditions. For example, if underlying genetic or
physiological constraints prevent plants from competing well with Euphorbia and also
responding well to clipping, this would cause negative covariance in performance in the clipping
and Euphorbia competition treatments. Selection caused by a competitor would therefore be
expected to increase competitive ability but a concomitant decrease in tolerance of herbivory. In

85
this context the PCA analysis I conducted on the performance of Bromus siblings collected in
2010 indicated almost total independence in the expression of traits among treatments. In other
words, families that performed well in a given treatment were no more or no less likely to
perform well in any other treatment. Thus in the common greenhouse conditions in this study,
the performance of families across the treatments used in this study was not inherently
constrained by performance tradeoffs among the various environments that were tested. Also,
the PCA results suggest that selection for increased performance in the Euphorbia competition
treatment should not affect performance in the other treatments. However, in 2008 Bromus that
survived Euphorbia invasion showed increased root growth in all treatments. If the genetic
structure of the Bromus population was similar in 2008 and 2010, I would have expected to see
changes in root allocation only in the Euphorbia competition treatment. This result suggests
either 1) that greenhouse did not effectively mimic natural conditions, or 2) that in nature
Euphorbia causes selection on multiple independent traits that not directly related to competitive
ability. This could occur, for example, if Euphorbia simultaneously competes with associated
plants, influences herbivore attacks (Atwater et al. 2011), and changes their edaphic
environment. Thus, “extended” evolutionary consequences of invasion might not be influenced
by tradeoffs at all, but instead respond to a complex suite of environmental changes created by
an invader that can affect multiple independent traits. It is important to note that this
interpretation is based on a PCA analysis performed only on Bromus plants collected in 2010
when I did not detect evidence of selection caused by Euphorbia, and thus should be considered
with caution.
In sum, found evidence for a response to selection by Euphorbia esula for two species.
To my knowledge, this is the first evidence that an exotic invasive plant species has selected for
86
increased competitive ability in another invasive species. These results also demonstrate limited
extended consequences, including how native and invasive species may respond to competition
with other native species, to herbivory, and to altered resource availability. These results suggest
that the evolutionary consequences of plant invasions could have subtle and complex effects on
the ecology of native plants, beyond simply affecting their ability to compete with the invader
causing selection. Moreover, these “extended” consequences of invasion may not necessarily
follow classic tradeoffs such as the CSR tradeoffs (Grime 1977) or “grow or defend” tradeoffs
(Herms and Mattson 1992). Instead, invader-driven selection appears to affect both native and
invasive plants in complex and unintuitive ways. Understanding the extended consequences of
selection may therefore be crucial for our understanding of the long term consequences of plant
invasions, and of the evolutionary consequences of plant interactions in general
ACKNOWLEDGEMENTS
This research was funded by an NSF Graduate Research Fellowship awarded to DZA. DZA
would also like to thank Carolyn Bauer for her help in the field and with research design and in
particular David Hooper for his invaluable contributions to this work.
LITERATURE CITED
Atwater, D. Z., C. M. Bauer and R. M. Callaway. 2011. Indirect positive effects ameliorate
strong negative effects of Euphorbia esula on a native plant. Plant Ecology 212:1655-
1662.
Belcher, J. W. and S. D. Wilson. 1989. Leafy spurge and the species composition of a mixed-
grass prairie. Journal of Range Management 42:172-175.

87
Best K.F., G. G. Bowes, A. G. Thomas and M. G. Maw. 1980. The biology of Canadian weeds
.39. Euphorbia esula L. Canadian Journal of Plant Science 60:651-663.
Braithwaite, R. W., W. M. Lonsdale and J. A. Estbergs. 1989. Alien vegetation and native biota
in tropical Australia: The spread and impact of Mimosa pigra. Biological Conservation
48:189-201.
Callaway, R. M., W. M. Ridenour, T. Laboski, T. Weir and J. M. Vivanco JM. 2005. Natural
selection for resistance to the allelopathic effects of invasive plants. Journal of Ecology
93:576-583.
Cipollini, D., and K. A. Hurley. 2008. Variation in resistance of experienced and naïve seedlings
of jewelweed (Impatiens capensis) to invasive garlic mustard (Alliaraia petiolata). Ohio
Journal of Science 108:47-49.
Cyr, D. R. and J. D. Bewley. 1989. Carbon and nitrogen reserves of leafy spurge (Euphorbia
esula) roots as related to overwintering strategy. 77:67-72.
Dittberner, P. L. and M. R. Olson MR. 1983. The plant information network (PIN) data base:
Colorado, Montana, North Dakota, Utah, and Wyoming. FWS/OBS-83/86. Washington,
DC: U.S. Department of the Interior, Fish and Wildlife Service. pp. 786.
Ferrero-Serrano A, A. Hild and B. Mealor. 2010. Can invasive species enhance competitive
ability and restoration potential in native grass populations? Restoration Ecology 19:545-
551.
Fridley, J. D., J. P. Grime and M. Bilton M. 2007. Genetic identity of interspecific neighbours
mediates plant responses to competition and environmental variation in a species-rich
grassland. Journal of Ecology 95:908-915.

88
Goergen, E. M., E. A. Leger and E. K. Espeland. 2011. Native perennial grasses show
evolutionary response to Bromus tectorum (cheatgrass) invasion. PLoS ONE 6:e18145.
Gordon, D. 1998. Effects of invasive, non-indigenous plant species on ecosystem processes:
Lessons from Florida. Ecological Applications 8:975-989.
Grigulis, K., A. W. Sheppard, J. E. Ash and R. H. Groves. 2001. The comparative demography
of the pasture weed Echium plantagineum between its native and invaded ranges. Journal
of Applied Ecology 38:281-290.
Grime, J. P. 1977. Evidence for the existence of three primary strategies in plants and its
relevance for ecological and evolutionary theory. American Naturalist 111:1169-1194.
Heijda M., P. Pyšek and V. Jarošík. 2009. Impact of invasive plants on the species richness,
diversity and composition of invaded communities. Journal of Ecology 97:393-403.
Herms, D. A. and W. J. Mattson. 1992. The dilemma of plants: to grow or defend. The Quarterly
Review of Biology 67:283-335.
Kadane J. B. and N. A. Lazar. 2004. Methods and criteria for model selection. Journal of the
American Statistical Association 99:279-290.
Kellogg E. A. 1987. Apomixis in the Poa secunda complex. American Journal of Botany
74:1431-1437.
Lau, J.A. 2006. Evolutionary responses of native plants to novel community members. Evolution
60:56-63.
Leger, E. A. 2008. The adaptive value of remnant native plants in invaded communities: an
example from the great basin. Ecological Applications 18:1226-1235.
Maron J. L. and M. Marler. 2008a. Effects of native species diversity and resource additions on
invader impact. American Naturalist 172:S18-S33.

89
Maron J. L. and M. Marler. 2008b. Field-based competitive impacts between invaders and
natives at varying resource supply. Journal of Ecology 96:1187-1197.
Mealor BA and Hild AL. 2006. Potential selection in native grass populations by exotic invasion.
Molecular Ecology 15:2291-2300.
Mealor, B. A. and A. L. Hild. 2007. Post-invasion evolution of native plant populations: a test of
biological resilience. Oikos 116:1493-1500.
Memmott, J., S. V. Simon, Q. Paynter, A. W. Sheppard and P Syrett. 2000. The invertebrate
fauna on broom, Cystus scoparius, in two native and two exotic habitats. Acta Oecologia
21:213-222.
Newingham, B. A., G. Boquien, P. Choler and R. M. Callaway. 2005. Effects of Festuca
paniculata on the compensatory growth response of Centaurea uniflora in the French
Alps. Plant Ecology 176:237-244.
Oja T. and V. Jaaska. 1998. Allozyme diversity and phylogenetic relationships among diploid
annual bromes (Bromus, Poaceae). Annales Botanici Fennici 35:123-130.
Ortega, Y. K., and D. E. Pearson. 2005. Weak vs. strong invaders of natural plant communities:
assessing invasibility and impact. Ecological Applications 15:651-661.
Rapp R. A. and F. Wendel. 2005. Epigenetics and plant evolution. New Phytologist 168:81-91.
Ridenour, W. M. and R. M. Callaway. 2001. The relative importance of allelopathy in
interference: the effects of an invasive weed on a native bunchgrass. Oecologia 126:444-
450.
Roach D. A. and R. D. Wulff. 1987. Maternal effects in plants. Annual Review of Ecology and
Systematics 18:209-235.

90
Rowe, C. L. J. and E. A. Leger. 2011. Competitive seedlings and inherited traits: a test of rapid
evolution of Elymus multisetus (big squirreltail) in response to cheatgrass invasion.
Evolutionary Applications 4:485-498.
Taylor D. R. and Aarssen L. W. 1990. Complex competitive relationships among genotypes of
three perennial grasses: implications for species coexistence. American Naturalist
136:305-327.
Trammell, M.A. and J. L. Butler. 1995. Effects of exotic plants on native ungulate use of habitat.
Journal of Wildlife Management 59:808-816.
Vilá, M., J. L. Espinar, M. Hejda, P. E. Hulme, V. Jaršík, J. L. Maron, J. Pergl, U. Schaffner, Y.
Sun and P. Pyšek. 2011. Ecological impacts of invasive alien plants: a meta-analysis of
their effects on species, communities and ecosystems. Ecology Letters 14:702-708.
Whittingham M. J., P. A. Stephens, R. B. Bradbury, R. P. Freckleton. 2006. Why do we still use
stepwise modeling in ecology and behavior? Journal of Animal Ecology 75:1182-1189.

91
TABLE 1: Site data
2010 Elevation
(m)
Site 2008 P. spicata B. japonicus Latitude Longitude Slope Aspect
1 X X X 46°53'16.37" 113°59'44.83" 1029 24% 230°
2 X X 46°53'34.32" 113°58'45.18" 1209 25% 70°
3 X X X 46°52'53.91" 113°59'10.08" 1083 37% 80°
4 X X X 46°51'59.40" 113°58'23.07" 1005 50% 200°
5 X X 46°56'14.33" 114°00'58.38" 1157 40% 280°
6 X X 46°53'36.25" 113°56'43.73" 1217 11% 290°
7 X X 46°50'23.96" 113°58'19.61" 1284 21% 180°
An “X” indicates whether the specified site was used for that year of study.
TABLE 2: Experimental design
Species Control
Competition:
Euphorbia
Competition:
Festuca Clipping Drought Fertilizer Sites
Control
for
Genotype Sampling Design
B. japonicus X X X X X 5 no broad
P. spicata X X X 5 no broad
P. secunda X X X 5 no broad
B. japonicus X X X X X 5 yes 1 pair of 1 m2 plots
P. spicata X X X X X 7 no broad
An “X” indicates whether the specified treatment was performed for that species.

92
TABLE 3: Results of ANOVA for 2008 experiment
Shoot Mass Root Mass Total Mass Root Mass Ratio
df F P df F P df F P df F P
P. secunda Invaded 1 1.316 0.253 1 0.035 0.851 1 0.500 0.514 1 1.068 0.353
Treatment 2 5.694 0.004 2 1.775 0.173 2 2.523 0.084 2 3.692 0.027
Site 4 1.924 0.110 4 5.161 0.001 4 1.257 0.415 4 6.305 0.051
Invaded × Treat. removed removed 2 2.050 0.091 2 3.711 0.027
Invaded × Site removed removed removed 4 2.414 0.052
Treatment × Site removed removed removed removed
Error 142 142 138 136
B. japonicus Invaded 1 0.002 0.966 1 3.501 0.062 1 1.240 0.266 1 4.151 0.042
Treatment 4 63.657 < 0.001 4 101.786 < 0.001 4 80.221 < 0.001 4 9.225 < 0.001
Site 4 4.797 0.037 4 2.111 0.079 4 4.576 0.011 4 2.862 0.023
Invaded × Treat. removed removed removed removed
Invaded × Site 4 2.033 0.089 removed removed removed
Treatment × Site 16 1.882 0.021 removed removed removed
Error 367 387 367 367

93
TABLE 4: Results of ANOVA for 2010 experiment
Shoot Mass Root Mass Total Mass RMR
df F P F P F P F P
P. spicata Invaded 1 0.011 0.917 1.108 0.293 0.325 0.569 1.295 0.257
Treatment 4 45.064 < 0.001 45.152 < 0.001 50.421 < 0.001 1.565 0.185
Site 6 2.102 0.053 2.508 0.022 2.491 0.023 1.062 0.387
Error 279
B. japonicus
Invaded 1 0.003 0.954 0.821 0.366 0.289 0.591 2.208 0.138
Treatment 4 236.789 < 0.001 259.44 < 0.001 279.614 < 0.001 23.373 < 0.001
Site 4 0.402 0.807 1.105 0.354 0.677 0.608 2.487 0.044
Error 319
TABLE 5: Results of PCA for performance of Bromus japonicus in different treatments in 2010
Component
Treatment Variable Communality 1 2 3 4 5
Control Shoot Mass 0.939 -0.003 -0.055 0.954 0.093 0.129
Root Mass 0.944 0.078 0.028 0.968 0.021 0.005
Fertilized Shoot Mass 0.897 -0.007 -0.004 0.067 0.944 -0.021
Root Mass 0.891 0.068 -0.001 0.041 0.933 -0.117
Euphorbia competition Shoot Mass 0.960 0.112 0.971 0.025 0.001 0.058
Root Mass 0.961 0.069 0.977 -0.049 -0.006 0.002
Festuca competition Shoot Mass 0.956 0.968 0.087 0.010 0.055 0.098
Root Mass 0.947 0.943 0.105 0.070 0.011 0.202
Clipping Shoot Mass 0.892 0.033 0.074 0.093 -0.070 0.934
Root Mass 0.872 0.298 -0.019 0.038 -0.076 0.880
Initial Eigenvalue 2.689 2.046 1.884 1.538 1.102
Rotated Contribution 19.4% 19.3% 18.7% 17.9% 17.3%
Total Contribution 19.4% 38.7% 57.4% 75.3% 92.6%

94
FIGURE 1. Effect of treatment and invasion status on total biomass and RMR of P. secunda (A,B), and B.
japonicus (C,D) in 2008. Color indicates whether the parent plants were inside (grey) or outside (white)
of E. esula patches. Error bars show standard error. Significant differences in mean performance
between inside and outside plants in each treatment are indicated by * (p < 0.050) or (*) (p < 0.100).
ANOVA terms with p < 0.100 are displayed above each graph.