interplanetary mission design handbook - nasa · laura m. burke, robert d. falck, and melissa l....
TRANSCRIPT

Laura M. Burke, Robert D. Falck, and Melissa L. McGuireGlenn Research Center, Cleveland, Ohio
Interplanetary Mission Design Handbook:Earth-to-Mars Mission Opportunities 2026 to 2045
NASA/TM—2010-216764
October 2010
https://ntrs.nasa.gov/search.jsp?R=20100037210 2018-06-06T05:28:29+00:00Z

NASA STI Program . . . in Profi le
Since its founding, NASA has been dedicated to the advancement of aeronautics and space science. The NASA Scientifi c and Technical Information (STI) program plays a key part in helping NASA maintain this important role.
The NASA STI Program operates under the auspices of the Agency Chief Information Offi cer. It collects, organizes, provides for archiving, and disseminates NASA’s STI. The NASA STI program provides access to the NASA Aeronautics and Space Database and its public interface, the NASA Technical Reports Server, thus providing one of the largest collections of aeronautical and space science STI in the world. Results are published in both non-NASA channels and by NASA in the NASA STI Report Series, which includes the following report types: • TECHNICAL PUBLICATION. Reports of
completed research or a major signifi cant phase of research that present the results of NASA programs and include extensive data or theoretical analysis. Includes compilations of signifi cant scientifi c and technical data and information deemed to be of continuing reference value. NASA counterpart of peer-reviewed formal professional papers but has less stringent limitations on manuscript length and extent of graphic presentations.
• TECHNICAL MEMORANDUM. Scientifi c
and technical fi ndings that are preliminary or of specialized interest, e.g., quick release reports, working papers, and bibliographies that contain minimal annotation. Does not contain extensive analysis.
• CONTRACTOR REPORT. Scientifi c and
technical fi ndings by NASA-sponsored contractors and grantees.
• CONFERENCE PUBLICATION. Collected papers from scientifi c and technical conferences, symposia, seminars, or other meetings sponsored or cosponsored by NASA.
• SPECIAL PUBLICATION. Scientifi c,
technical, or historical information from NASA programs, projects, and missions, often concerned with subjects having substantial public interest.
• TECHNICAL TRANSLATION. English-
language translations of foreign scientifi c and technical material pertinent to NASA’s mission.
Specialized services also include creating custom thesauri, building customized databases, organizing and publishing research results.
For more information about the NASA STI program, see the following:
• Access the NASA STI program home page at http://www.sti.nasa.gov
• E-mail your question via the Internet to help@
sti.nasa.gov • Fax your question to the NASA STI Help Desk
at 443–757–5803 • Telephone the NASA STI Help Desk at 443–757–5802 • Write to:
NASA Center for AeroSpace Information (CASI) 7115 Standard Drive Hanover, MD 21076–1320

Laura M. Burke, Robert D. Falck, and Melissa L. McGuireGlenn Research Center, Cleveland, Ohio
Interplanetary Mission Design Handbook:Earth-to-Mars Mission Opportunities 2026 to 2045
NASA/TM—2010-216764
October 2010
National Aeronautics andSpace Administration
Glenn Research CenterCleveland, Ohio 44135

Available from
NASA Center for Aerospace Information7115 Standard DriveHanover, MD 21076–1320
National Technical Information Service5301 Shawnee Road
Alexandria, VA 22312
Available electronically at http://gltrs.grc.nasa.gov
Level of Review: This material has been technically reviewed by technical management.
This report is a formal draft or working paper, intended to solicit comments and
ideas from a technical peer group.

NASA/TM—2010-216764 i
Contents Introduction ................................................................................................................................................... 1 Nomenclature ................................................................................................................................................ 1 Trajectory Characteristics ............................................................................................................................. 2
Ballistic Trajectories ............................................................................................................................... 4 Transfer Trajectories Using Deep Space Maneuvers ............................................................................. 7 Launch/Injection Geometry .................................................................................................................... 8 Launch Azimuth ..................................................................................................................................... 8
Description of Trajectory Characteristics ..................................................................................................... 8 Mission Opportunities ................................................................................................................................... 9 Assumptions ................................................................................................................................................ 11 Mission Design Data Contour Plots ............................................................................................................ 12
Earth to Mars Mission Opportunities 2026 to 2045 ............................................................................. 12 Earth to Mars—2026 Opportunity ................................................................................................. 12 Earth to Mars—2028 Opportunity ................................................................................................. 19 Earth to Mars—2031 Opportunity ................................................................................................. 26 Earth to Mars—2033 Opportunity ................................................................................................. 33 Earth to Mars—2035 Opportunity ................................................................................................. 40 Earth to Mars—2037 Opportunity ................................................................................................. 47 Earth to Mars—2039 Opportunity ................................................................................................. 54 Earth to Mars—2041 Opportunity ................................................................................................. 61 Earth to Mars—2043 Opportunity ................................................................................................. 68 Earth to Mars—2045 Opportunity ................................................................................................. 75
Appendix A.—Verification of Midas Results ............................................................................................. 82 Verification Contour Plots for 2005 Opportunity................................................................................. 83
References ................................................................................................................................................... 85
List of Tables Table 1.—Data for optimal missions: 2026 to 2045 ................................................................................... 10 Table 2.—Earth to Mars—2026 Opportunity—Energy Minima ................................................................ 12 Table 3.—Earth to Mars—2028 Opportunity—Energy Minima ................................................................ 19 Table 4.—Earth to Mars—2031 Opportunity—Energy Minima ................................................................ 26 Table 5.—Earth to Mars—2033 Opportunity—Energy Minima ................................................................ 33 Table 6.—Earth to Mars—2035 Opportunity—Energy Minima ................................................................ 40 Table 7.—Earth to Mars—2037 Opportunity—Energy Minima ................................................................ 47 Table 8.—Earth to Mars—2039 Opportunity—Energy Minima ................................................................ 54 Table 9.—Earth to Mars—2041 Opportunity—Energy Minima ................................................................ 61 Table 10.—Earth to Mars—2043 Opportunity—Energy Minima .............................................................. 68 Table 11.—Earth to Mars—2045 Opportunity—Energy Minima .............................................................. 75 Table 12.—Energy minima for 2005 opportunity calculated by MIDAS................................................... 82 Table 13.—Energy minima for 2005 opportunity data from Reference 6 .................................................. 82
List of Figures Figure 1.—Minimum departure energies for Earth to Mars Ballistic Missions: 1990 to 2045. ................... 3 Figure 2.—Lambert Theorem Geometry. ..................................................................................................... 4 Figure 3.—Mission space in departure/arrival date coordinates. .................................................................. 5 Figure 4.—Target planet orbital plane geometry forcing a polar inclination for a 180° transfer. ................ 6 Figure 5.—Mission space with nodal transfer. ............................................................................................. 6

NASA/TM—2010-216764 ii
Figure 6.—Orbit geometry for nodal transfer. .............................................................................................. 7 Figure 7.—Type I optimal ballistic mission departure energies. .................................................................. 9 Figure 8.—Type II optimal ballistic mission departure energies. ............................................................... 10

NASA/TM—2010-216764 1
Interplanetary Mission Design Handbook: Earth-to-Mars Mission Opportunities 2026 to 2045
Laura M. Burke, Robert D. Falck, and Melissa L. McGuire
National Aeronautics and Space Administration Glenn Research Center Cleveland, Ohio 44135
Introduction The purpose of this Mission Design Handbook is to provide trajectory designers and mission planners
with graphical information about Earth to Mars trajectory opportunities for the years of 2026 through 2045. The trajectory data used to create the following opportunity contour plots was generated using MIDAS, a patched conic interplanetary trajectory optimization program that is able to optimize the times of specified trajectory events and other trajectory parameters (Ref. 1). The contour plots themselves were generated using the data visualization capabilities of MATLAB (The Mathworks, Inc.). The plots, displayed on a departure date/arrival date mission space, show departure energy, right ascension and declination of the launch asymptote, and target planet hyperbolic arrival excess speed, V∞, for each launch opportunity.
Trajectory contour plots are particularly important in the beginning stages of mission design as valuable tools that display the interplanetary flight path characteristics for a particular launch opportunity to Mars. The use of these contour plots is an important first step for determining initial optimal launch opportunities for interplanetary missions. They also serve as good approximations for directional values of the launch asymptote vector, target planet (Mars) arrival excess velocities, and total mission flight time. These plots allow a mission designer to determine the basic requirements for an Earth to Mars transfer vehicle as well as a preliminary estimate of the required propellant load.
Provided in this study are two sets of contour plots for each launch opportunity. The first set of plots shows Earth to Mars ballistic trajectories without the addition of any deep space maneuvers. The second set of plots shows Earth to Mars transfer trajectories with the addition of deep space maneuvers, which further optimize the determined trajectories. Providing two sets of plots for each opportunity allows mission planners the ability to compare and contrast different mission architectures.
Nomenclature C3 Earth departure energy (km2/sec2), equal to the square of the departure hyperbolic excess
velocity
2000Jd launch date in terms of full integer days elapsed since Jan. 1, 2000 1d 12h UT (JD = 2451545)
DVMT total magnitude of the sum of the deep space maneuvers (km/sec)
DATEGHA Greenwich hour angle at 0 h GMT of any date, assumes equator is J2000 (deg)
h altitude (km)
TOF time of flight (days)
Lt time of launch (h, GMT, i.e., mean solar time)
V spacecraft velocity of Mars flyby (km/sec) V∞ hyperbolic excess velocity (km/sec)

NASA/TM—2010-216764 2
∞α right ascension of the launch asymptote (deg)
Lα right ascension of the launch site (deg)
V∆ delta velocity (km/sec)
∞δ declination of the launch asymptote (deg)
γ Vernal Equinox
Lλ east longitude of launch site (deg)
Mµ GM, gravitational parameter of Mars, 42,828.3 km3/sec2
Lφ geocentric latitude of the launch site (deg)
Mr radius of Mars, 3,397 km
∞Σ launch azimuth (deg)
EARTHω inertial rotation rate of Earth, 15.041067179 deg/h of mean solar time
Eω angular velocity of Earth, srad710994.1 −×
Mω angular velocity of Mars, srad71006.1 −×
Sτ synodic period (days)
Trajectory Characteristics For the purpose of minimizing the required transfer energy, Earth departure and Mars arrival should
occur when the two planets are in conjunction. Conjunction class missions, or Hohmann transfer missions, occur when the Earth at launch and Mars at arrival are essentially on opposite sides of the sun.
The trajectories calculated with MIDAS were specified to be Venus flyby trajectories. A flyby arrival event was chosen because no weight is placed on the arrival ∆V thereby reducing the trajectory’s total ∆V. A propulsive capture arrival event was not chosen because it requires a large ∆V maneuver near the arrival planet and thereby obscures the Earth relative performance requirements.
Using the hyperbolic excess speed, V∞, the gravitational parameter µM, and radius rM, and the spacecraft’s altitude h of flyby, the velocity of a Mars flyby trajectory is given by:
22∞+
+µ
= Vhr
VM
M
(1)
Optimal launch dates for minimum departure energy conjunction class missions reoccur every synodic period. The synodic period is the time required for any phase angle to repeat, which for Mars with respect to the Earth is 779.935 Earth days (approximately 2.14 years), and can be confirmed using the following equation (Ref. 2):
MES ω−ω
π=τ
2
(2)
where ωE and ωM are the rotational rates of the Earth and Mars about the Sun.

NASA/TM—2010-216764 3
Due to the fact that Earth and Mars orbits are neither exactly circular nor coplanar, the trajectory characteristics of each opportunity are not always the same. One opportunity may require less departure energy and have a lower Mars arrival V∞ than another opportunity. However, Earth and Mars nearly return to their original relative heliocentric positions every 7 to 8 synodic periods, or every 15 to 17 years (Ref. 3). Figure 1 shows the repeating cycle of minimum (either Type I or Type II) departure energy values for Earth to Mars ballistic opportunities 1990 to 2045. Type I trajectories are characterized as having shorter trip times and Type II trajectories are characterized as having longer trip times usually with a lower required ∆V than Type I trajectories. Type I and Type II trajectories have heliocentric travel angles less than and greater than 180° respectively and are discussed in more detail in the Ballistic Trajectories section of the handbook.
Each pair of departure/arrival dates defines a unique Earth to Mars transfer trajectory. For the purposes of these particular contour plots, each date pair is associated with an array of specific values for departure energy, right ascension and declination of the launch asymptote, and Mars arrival V∞. The resulting contours for each specified parameter are plotted in an Earth departure/Mars arrival mission space with a departure date coverage span of 160 days and an arrival date coverage span of 400 days. Since numerous events can cause a mission to launch at a date other than optimal, the plots include departure energies up to 50 km2/sec2. Departure energies above 50 km2/sec2 were considered to be generally not of interest because of the large propulsive maneuvers they require. A 160-day span for departure date was used because it sufficiently covered the range of desired departure energies. The 400-day coverage span for Mars arrival dates was used in order to display time-of-flight times ranging from 100 to 450 days.
Figure 1.—Minimum departure energies for Earth to Mars Ballistic Missions: 1990 to 2045.
14.4
11.7
9.58.9
8.47.9
8.8
15.5
12.8
10.3
9.0 8.8
8.0 7.7
13.213.8
11.2
9.1 8.98.2
7.8
10.2
14.8
12.2
9.8
9.08.6
0
2
4
6
8
10
12
14
16
18
1990
1992
1994
1996
1998
2000
2002
2005
2007
2009
2011
2014
2016
2018
2020
2022
2024
2026
2028
2031
2033
2035
2037
2039
2041
2043
2045
C3
(km
2/s
ec2)
Year
Minimum Departure Energies: 1990-2045

NASA/TM—2010-216764 4
Figure 2.—Lambert Theorem Geometry.
Ballistic Trajectories
MIDAS uses Lambert’s Theorem to calculate Earth to Mars ballistic transfer trajectories in which two-body conic motion and a central force field are assumed. Lambert’s Theorem defines the following relationship (Ref. 4): the transfer time of a body moving between two points on a conic trajectory is a function only of the sum of the distances of the two points from the origin of force, the linear distance between the points, and the semi-major axis of the conic (Figure 2). A ballistic mission to Mars can be sufficiently represented by a two-body formation, thus, making this type of mission suitable to be analyzed using Lambert’s method.
In most interplanetary missions, R1 and R2 are known, and the distance between them, C, can be related to the heliocentric transfer angle, θ, by the law of cosines (Ref. 4):
θ−+= cos2 212
22
12 RRRRC (3)
A more detailed description of Lambert’s Theorem, including Lambert’s equations and discussions of elliptical, hyperbolic, and parabolic trajectories, is available in Reference 4.
The ballistic contour plots of departure energy reveal a unique mission space consisting of two distinguishable trajectory areas (Figure 3). The two trajectory areas are defined as Type I and Type II trajectories. A Type I trajectory is achieved if a spacecraft travels less than a 180° true anomaly (less than halfway around the sun); a Type II trajectory is achieved if a spacecraft travels more than a 180° but less than a 360° true anomaly (between one half and one revolution around the sun) (Ref. 3). Type I trajectories have shorter trip times and lower error sensitivity which often makes them desirable for interplanetary trajectories (Ref. 5). Due to the longer distance traveled, Type II trajectories have longer trip times and usually require a lower ∆V than Type I trajectories.

NASA/TM—2010-216764 5
Figure 3.—Mission space in departure/arrival date coordinates.
It should be noted that there are two minimum energy areas within the ballistic plots, one of which is
associated with a Type I transfer and the other with a Type II transfer (Ref. 3). The values of the energy minima for each opportunity are summarized in the Mission Opportunities section of this handbook.
A notable ridge passes diagonally from the lower left to the upper right of the mission space separating the Type I and Type II trajectories. This dramatic rise is attributed to near-180° transfer angle trajectories. The cause of this phenomenon is that, for a ballistic 180° trajectory, the Sun and both trajectory end points must lie in the plane of the transfer orbit, and the endpoints must lie in the orbital plane of the departure planet along a common diameter in the ecliptic. If the nodal lines of the target planet and the transfer orbit are not aligned, any slight inclination by the target planet to cause a vertical out of plane displacement forces a polar inclination for a 180° transfer in order to recover (Ref. 6). The presence of an arrival position error (Figure 4), caused by inclination of the target planet’s orbit, at the Mars arrival location opposite the Earth departure location signifies that a polar trajectory must be used in order to reach the target planet at that point. Increasing the inclination, i, of the trajectory plane to anything less than 90° will not reach the target planet. Figure 4 describes the geometry of the transfer orbit, arrival planet orbit, and departure planet orbit that forces a polar 180° transfer. The dotted red lines show the transfer orbit’s progression as the inclination of the orbit is increased to 90° in order to arrive at to the target planet in this current geometry. Near-180° transfer trajectories require larger departure energies than orbits with less inclination because they are not able to take advantage of the energy provided by Earth’s orbital velocity. Hence, the Earth to Mars Transfer vehicle becomes responsible for obtaining the necessary orbital velocity.
An exception to the polar inclination 180° transfer trajectories that occur in all ballistic missions is a nodal transfer (Figure 5). Nodal transfer opportunities are identified by a single node (highlighted in red in Figure 5) which connects the Type I and Type II trajectory peaks. A nodal transfer occurs when Earth departure takes place at the node where the orbit of the target planet (Mars) intersects the Earth’s orbit,

NASA/TM—2010-216764 6
and arrival occurs at the opposite such node (Figure 6). In these cases, the transfer trajectory plane can lie in Earth’s orbital plane, which requires less departure energy (Ref. 6). While the trajectory is still swept out 180° from Earth departure to Mars arrival, the trajectory is such that it provides an opportunity for a low departure energy transfer instead of trajectories with unattainable departure energy levels.
Figure 4.—Target planet orbital plane geometry forcing a polar inclination for a 180° transfer.
Figure 5.—Mission space with nodal transfer.

NASA/TM—2010-216764 7
Figure 6.—Orbit geometry for nodal transfer.
While nodal transfers present a low departure energy advantage, they represent single-time-point
missions with extraordinarily high error sensitivity, which is generally undesirable in current missions. A nodal transfer opportunity is not present in all opportunity cases, as demonstrated by the large ridge in Figure 3.
Transfer Trajectories Using Deep Space Maneuvers
The addition of deep space maneuvers changes the architecture of a trajectory and may well reduce the overall cost of the mission by potentially minimizing the necessary total initial mass of a launch vehicle or the total ∆V of a mission (Ref. 7). Departure energies and arrival excess speeds are significantly reduced along the ridge in Figure 3 with the addition of deep space maneuvers.
MIDAS determines where to perform a deep space maneuver by using calculus of variations and primer vector theory. If MIDAS determines that a deep space maneuver reduced ∆V, it places that maneuver at or near a node. This burn is often called a “broken plane” maneuver. The goal of performing broken plane maneuvers is to avoid high ecliptic inclination of the trajectory by performing a plane change maneuver, such that it would correct the path of the spacecraft toward the target planet’s out-of-ecliptic position. The affects of performing this type of maneuver can be observed in the plots of departure energy for missions with added deep space maneuvers by observing the lack of a ridge of high departure energies separating Type I and Type II trajectories.
Optimal trajectories for the launch opportunities with deep space maneuvers are not listed because in order to determine the minima ∆V case, the Earth departure ∆V must be combined with the total ∆V of the deep space maneuvers. A contour plot of Earth departure ∆V is not provided because Earth departure ∆V is dependent on initial departure orbit. However, Earth departure ∆V can be computed from the plot of departure energy and then combined with the magnitudes of the deep space maneuvers to reveal the minimum ∆V trajectory.
The contour plots of trajectories that utilize deep space maneuvers are of importance for determining Earth to Mars transfer vehicle requirements and launch asymptote specifications as well as verifying that a particularly low value for the total ∆V does not correspond to an unusually high departure energy.
NASA/TM—2010-216764 8
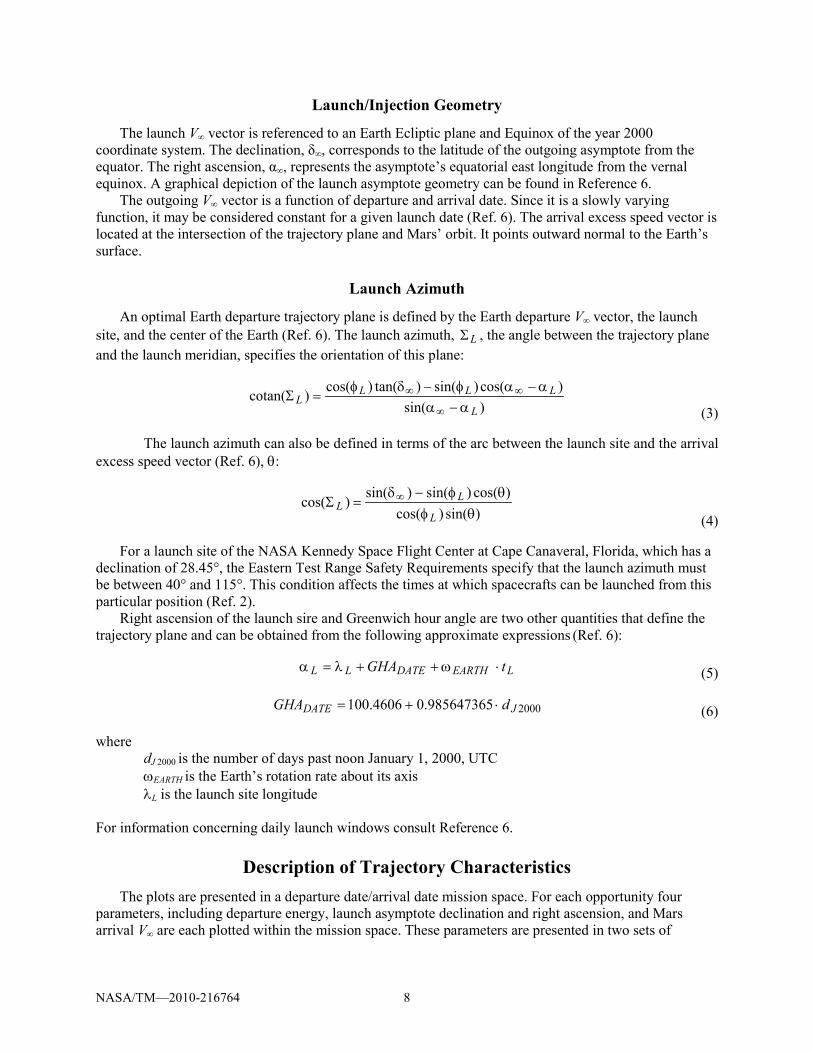
Launch/Injection Geometry
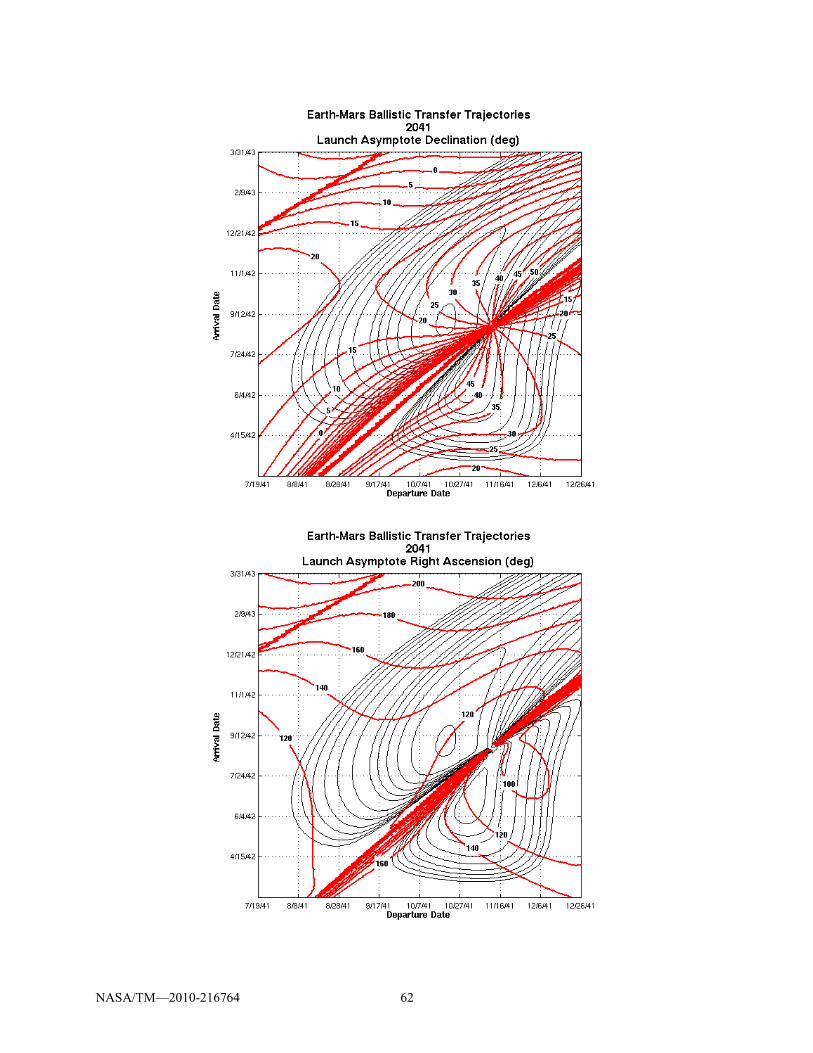
The launch V∞ vector is referenced to an Earth Ecliptic plane and Equinox of the year 2000 coordinate system. The declination, δ∞, corresponds to the latitude of the outgoing asymptote from the equator. The right ascension, α∞, represents the asymptote’s equatorial east longitude from the vernal equinox. A graphical depiction of the launch asymptote geometry can be found in Reference 6.
The outgoing V∞ vector is a function of departure and arrival date. Since it is a slowly varying function, it may be considered constant for a given launch date (Ref. 6). The arrival excess speed vector is located at the intersection of the trajectory plane and Mars’ orbit. It points outward normal to the Earth’s surface.
Launch Azimuth
An optimal Earth departure trajectory plane is defined by the Earth departure V∞ vector, the launch site, and the center of the Earth (Ref. 6). The launch azimuth, LΣ , the angle between the trajectory plane and the launch meridian, specifies the orientation of this plane:
)sin()cos()sin()tan()cos()cotan(
L
LLLL α−α
α−αφ−δφ=Σ
∞
∞∞
(3)
The launch azimuth can also be defined in terms of the arc between the launch site and the arrival excess speed vector (Ref. 6), θ:
)sin()cos()cos()sin()sin()cos(
θφθφ−δ
=Σ ∞
L
LL
(4)
For a launch site of the NASA Kennedy Space Flight Center at Cape Canaveral, Florida, which has a declination of 28.45°, the Eastern Test Range Safety Requirements specify that the launch azimuth must be between 40° and 115°. This condition affects the times at which spacecrafts can be launched from this particular position (Ref. 2).
Right ascension of the launch sire and Greenwich hour angle are two other quantities that define the trajectory plane and can be obtained from the following approximate expressions (Ref. 6):
LEARTHDATELL tGHA ⋅ω++λ=α (5)
2000985647365.04606.100 JDATE dGHA ⋅+= (6)
where dJ 2000 is the number of days past noon January 1, 2000, UTC ωEARTH is the Earth’s rotation rate about its axis λL is the launch site longitude For information concerning daily launch windows consult Reference 6.
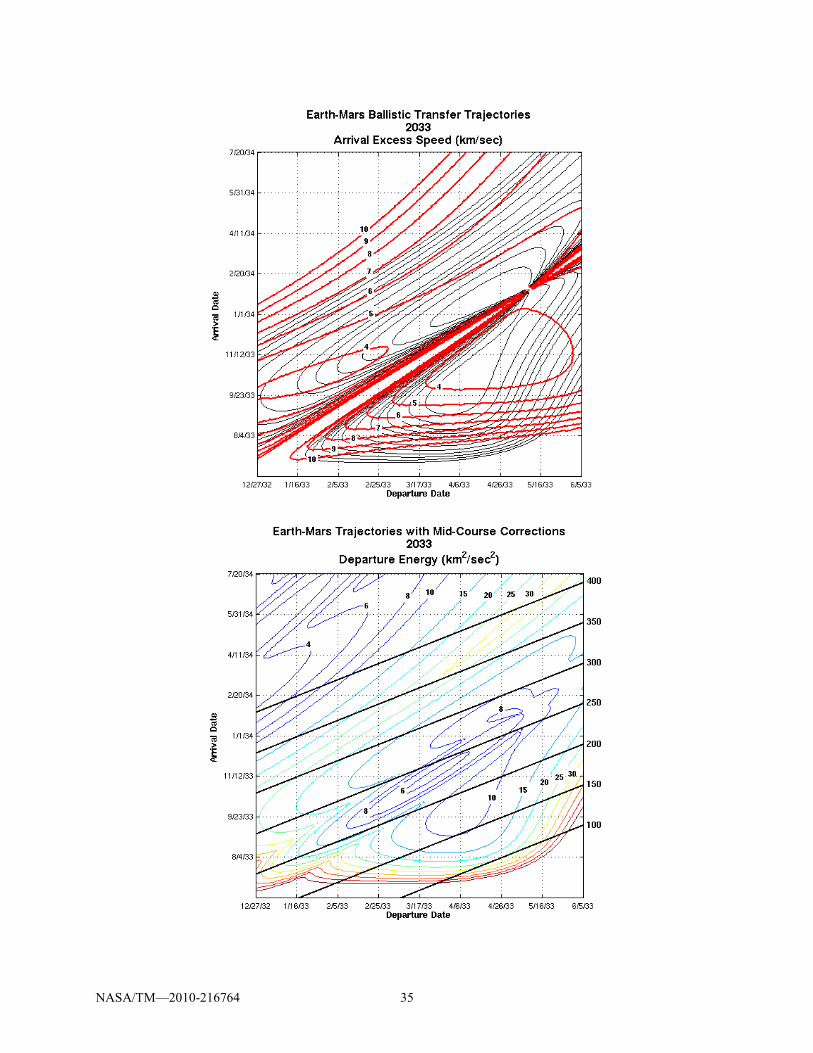
Description of Trajectory Characteristics The plots are presented in a departure date/arrival date mission space. For each opportunity four
parameters, including departure energy, launch asymptote declination and right ascension, and Mars arrival V∞ are each plotted within the mission space. These parameters are presented in two sets of
NASA/TM—2010-216764 9
contour plots, one without a performed deep space maneuver to minimize the departure energy, the ballistic trajectories, and another with a performed deep space maneuver.
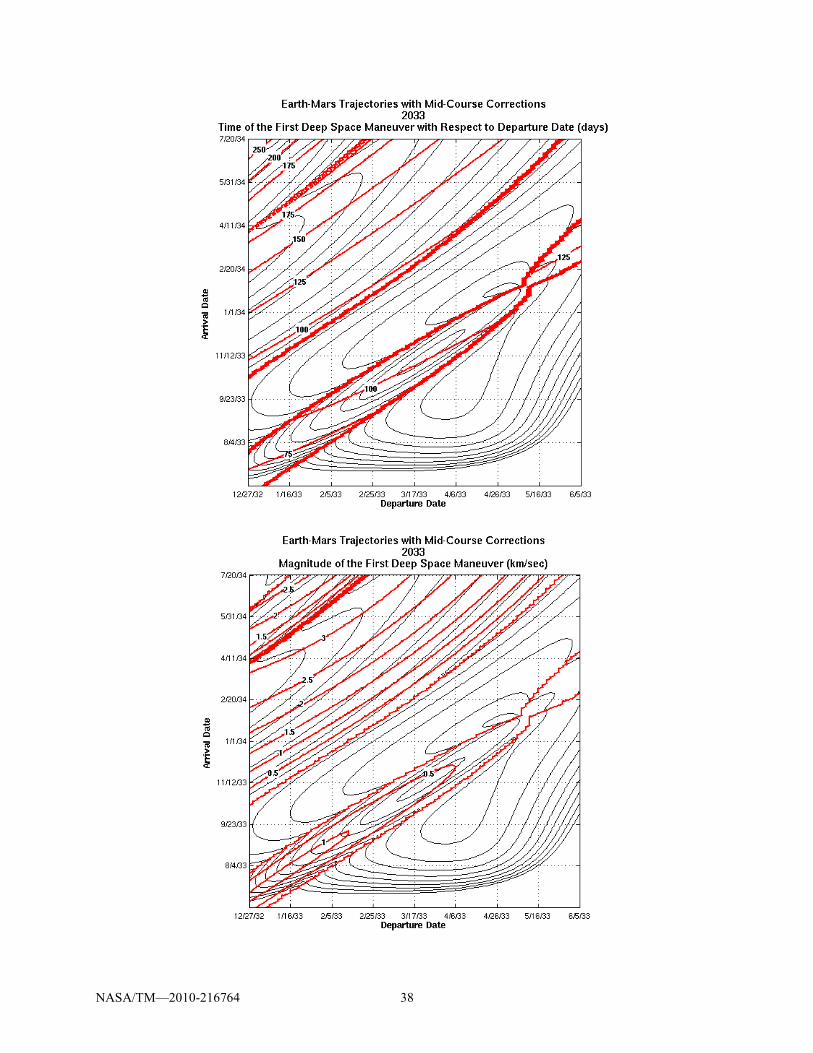
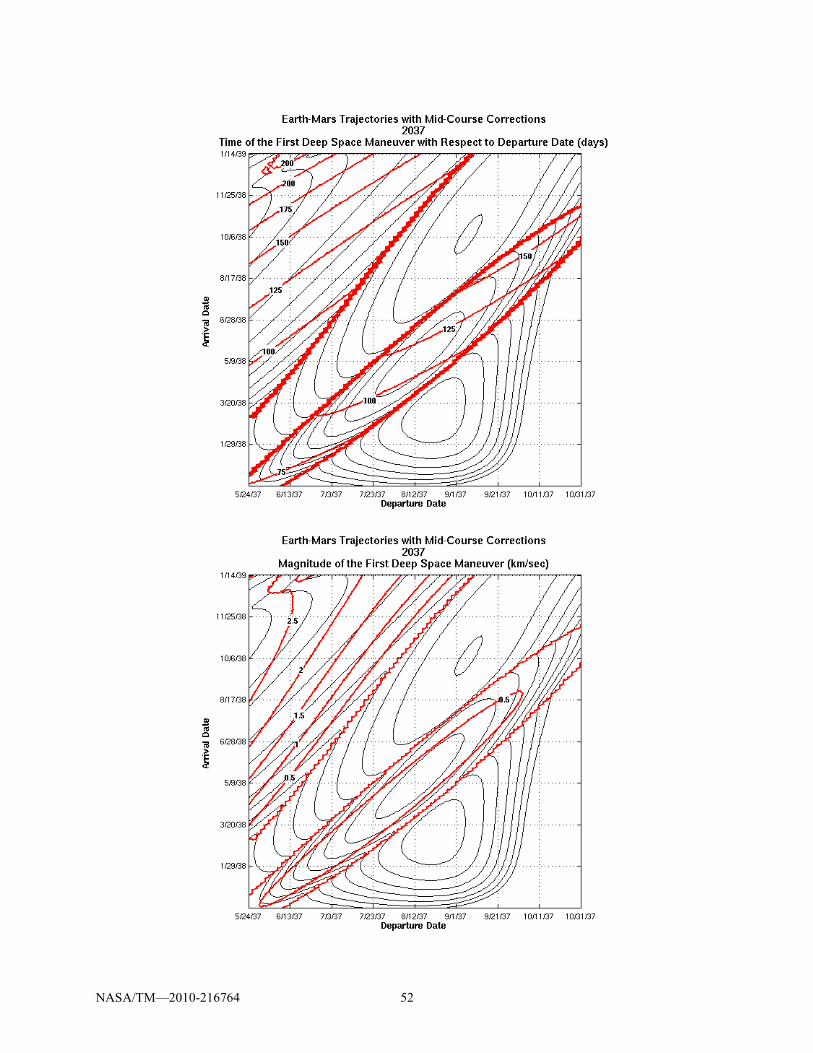
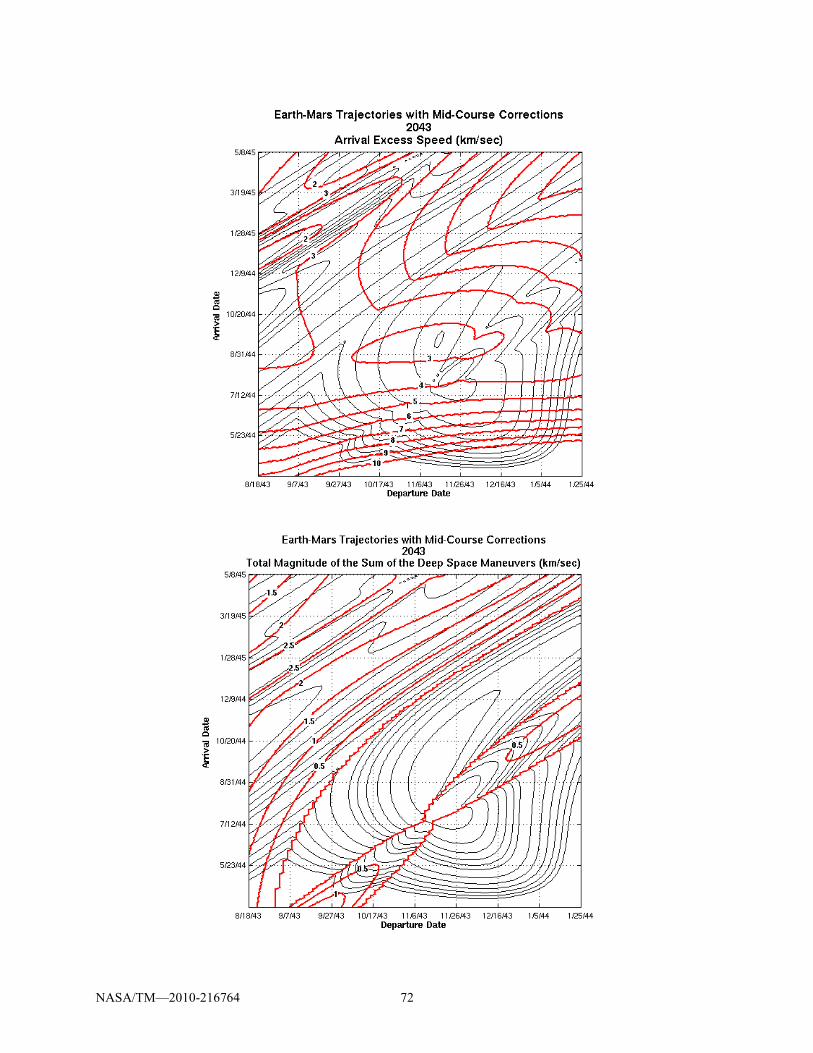
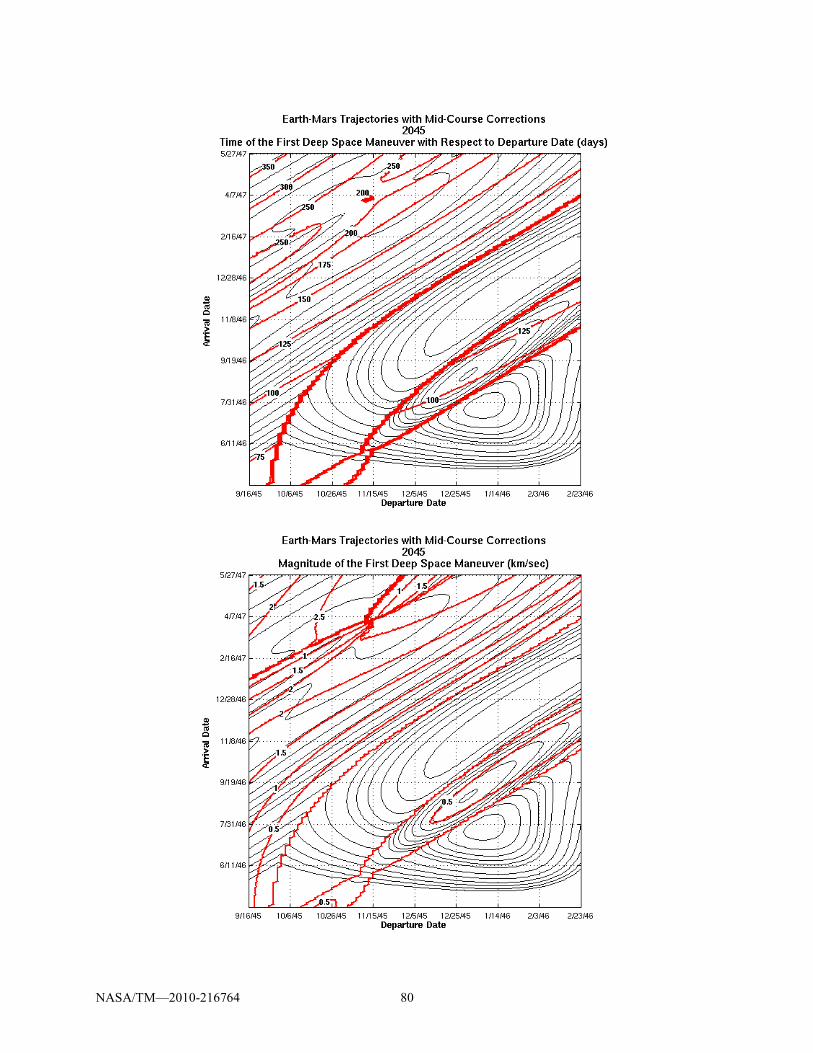
For the deep space maneuver option missions, a contour plot of the total magnitude of the deep space maneuvers as well as contour plots of the time and magnitude of each individual deep space maneuver is included in addition to the contour plots of the four parameters plotted for the ballistic missions. Included values of the total magnitude range from 0.0 to 5 km/sec. A value of zero signifies that no deep space maneuvers were performed. As such, some trajectories that lie outside of the outermost contour (0.0 km/sec) are not subject to any deep space maneuvers.
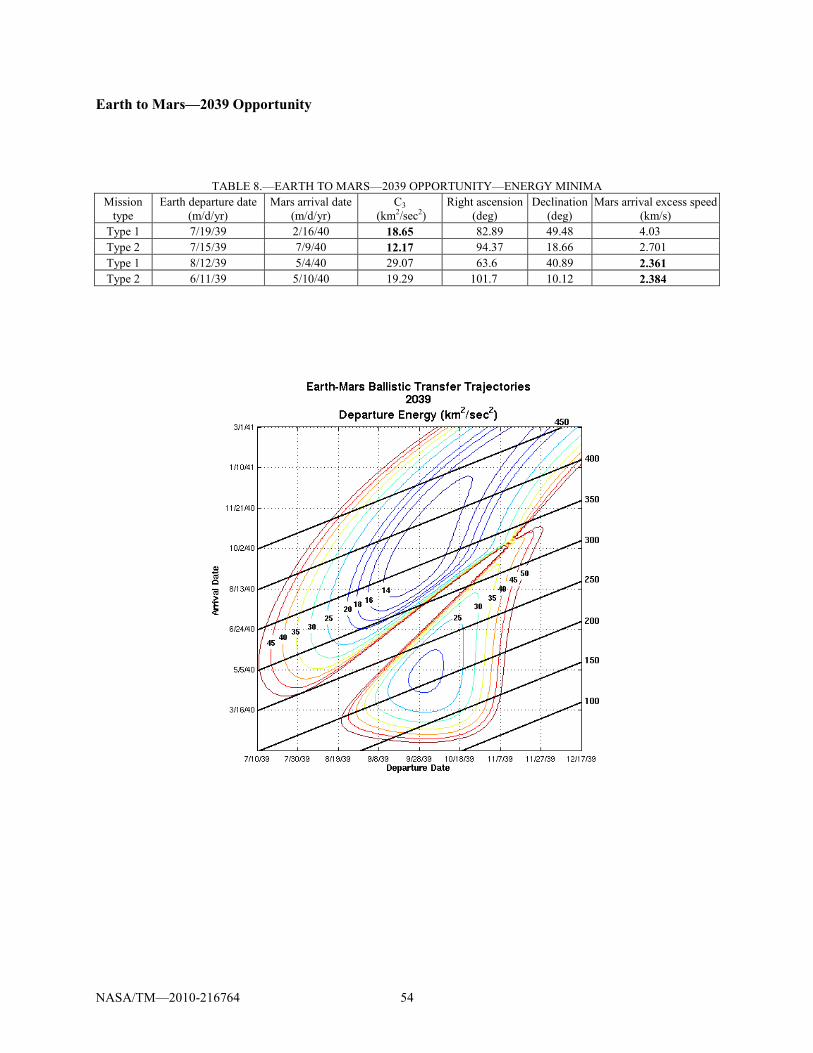
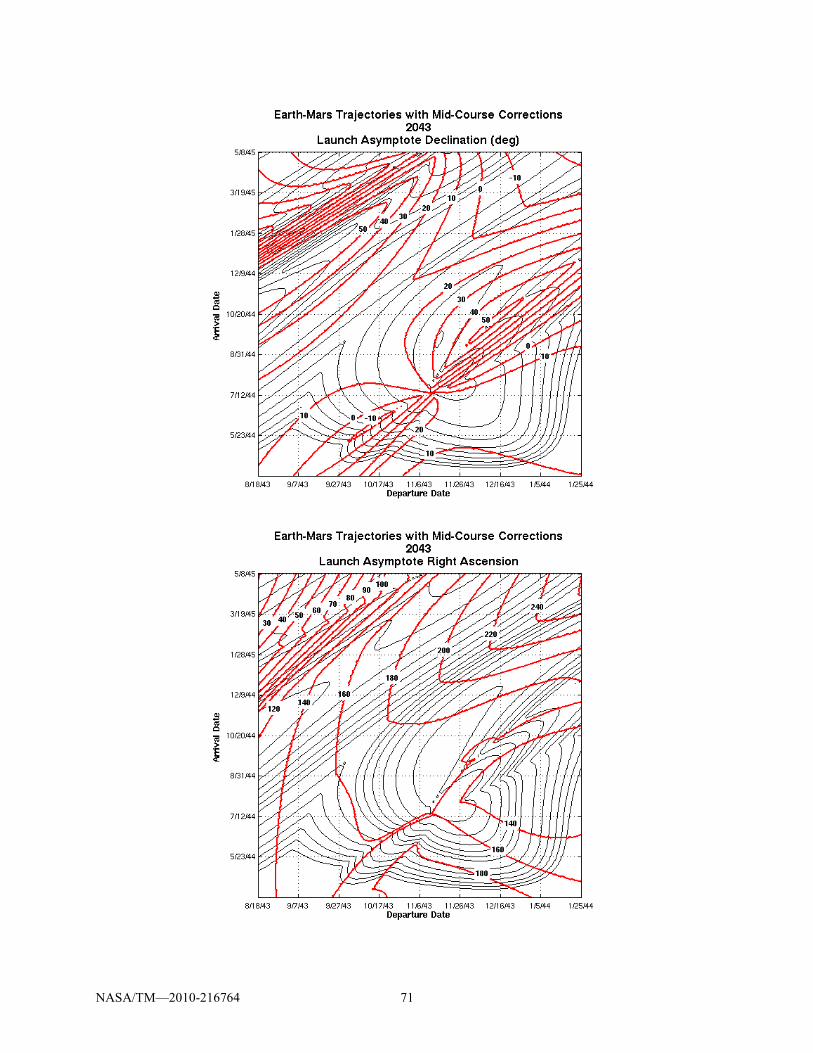
Only the contour plots of the departure energy include diagonal time-of-flight lines. The time-of-flight lines occur in 50-day increments. The contour plots of right ascension and declination of the launch asymptote as well as the plots of Mars arrival V∞ are superimposed on plots of the corresponding departure energy for reference purposes. The contour lines of the parameters are labeled with their values.
A table summarizing the optimal energy trajectories for both Type I and Type II ballistic missions is given at the beginning of each opportunity’s set of contour plots. This summary table provides the optimal mission characteristic values for both minimum departure energy and minimum Mars arrival V∞. Each row in the table defines a particular optimized mission. The trajectory characteristic optimized for that mission is in bold type.
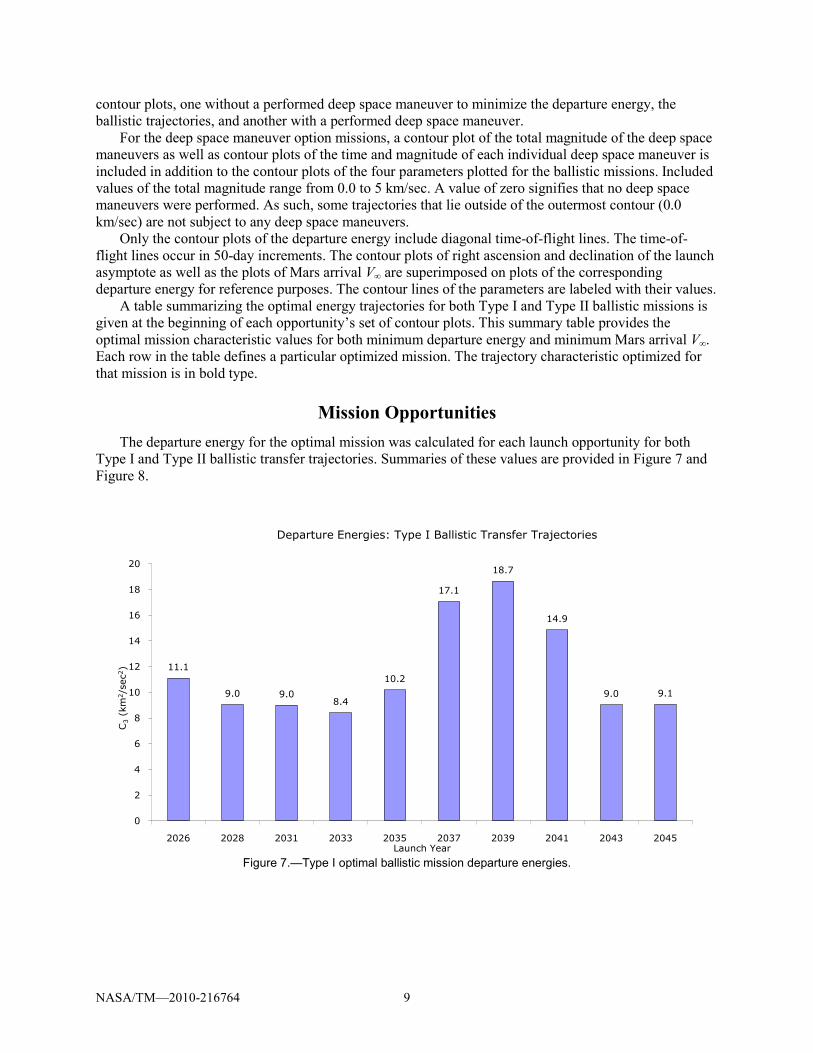
Mission Opportunities The departure energy for the optimal mission was calculated for each launch opportunity for both
Type I and Type II ballistic transfer trajectories. Summaries of these values are provided in Figure 7 and Figure 8.
Figure 7.—Type I optimal ballistic mission departure energies.
11.1
9.0 9.08.4
10.2
17.1
18.7
14.9
9.0 9.1
0
2
4
6
8
10
12
14
16
18
20
2026 2028 2031 2033 2035 2037 2039 2041 2043 2045
C3
(km
2/s
ec2)
Launch Year
Departure Energies: Type I Ballistic Transfer Trajectories
NASA/TM—2010-216764 10
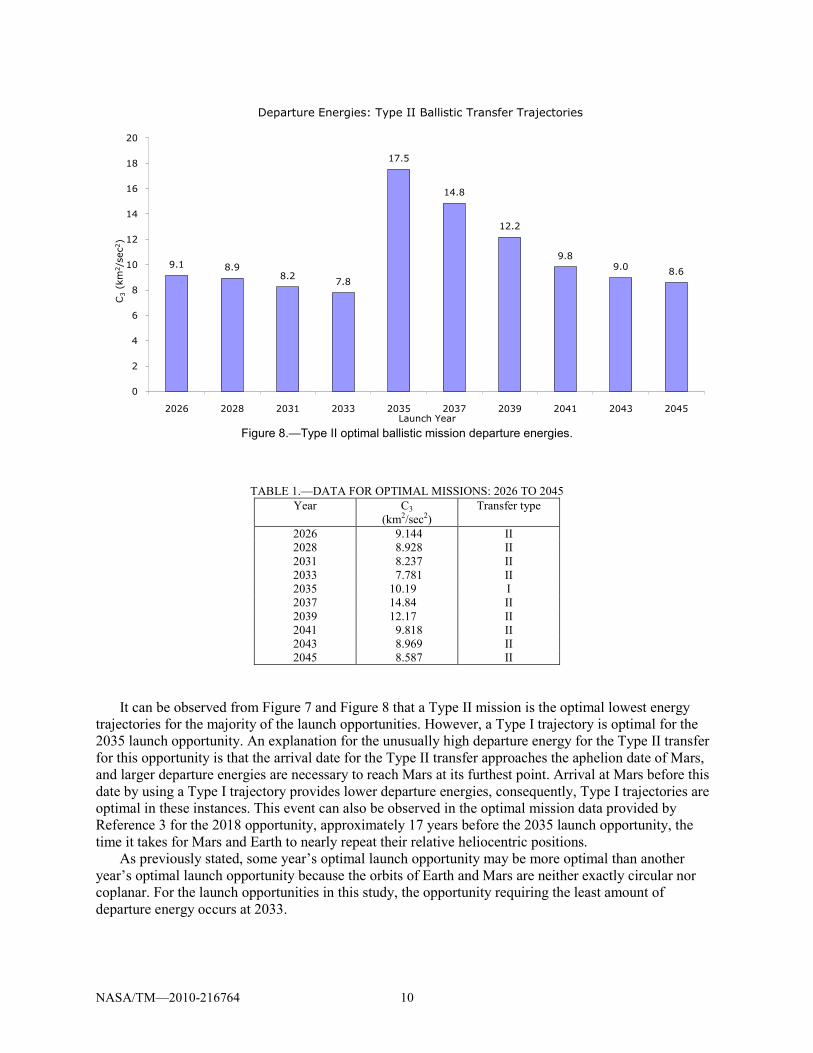
Figure 8.—Type II optimal ballistic mission departure energies.
TABLE 1.—DATA FOR OPTIMAL MISSIONS: 2026 TO 2045 Year C3
(km2/sec2) Transfer type
2026 9.144 II 2028 8.928 II 2031 8.237 II 2033 7.781 II 2035 10.19 I 2037 14.84 II 2039 12.17 II 2041 9.818 II 2043 8.969 II 2045 8.587 II
It can be observed from Figure 7 and Figure 8 that a Type II mission is the optimal lowest energy
trajectories for the majority of the launch opportunities. However, a Type I trajectory is optimal for the 2035 launch opportunity. An explanation for the unusually high departure energy for the Type II transfer for this opportunity is that the arrival date for the Type II transfer approaches the aphelion date of Mars, and larger departure energies are necessary to reach Mars at its furthest point. Arrival at Mars before this date by using a Type I trajectory provides lower departure energies, consequently, Type I trajectories are optimal in these instances. This event can also be observed in the optimal mission data provided by Reference 3 for the 2018 opportunity, approximately 17 years before the 2035 launch opportunity, the time it takes for Mars and Earth to nearly repeat their relative heliocentric positions.
As previously stated, some year’s optimal launch opportunity may be more optimal than another year’s optimal launch opportunity because the orbits of Earth and Mars are neither exactly circular nor coplanar. For the launch opportunities in this study, the opportunity requiring the least amount of departure energy occurs at 2033.
9.1 8.98.2
7.8
17.5
14.8
12.2
9.89.0 8.6
0
2
4
6
8
10
12
14
16
18
20
2026 2028 2031 2033 2035 2037 2039 2041 2043 2045
C3
(km
2/s
ec2)
Launch Year
Departure Energies: Type II Ballistic Transfer Trajectories

NASA/TM—2010-216764 11
Assumptions The optimization code in MIDAS is defaulted to minimize total weighted mission ∆V therefore only
conjunction class missions were considered in this study. Departure energy, declination and right ascension of the launch asymptote, and Mars arrival V∞ are
assumed to be the same for flyby and capture trajectories when no deep space maneuvers are introduced into the mission. The rationalization for this is that the same arrival position is always targeted in a ballistic trajectory because there is no additional directional control over the spacecraft once it departs Earth. Hence, the V∞ vector will be the same regardless of the arrival event, and consequently the right ascension and declination of the V∞ vector remain the same. For missions in which deep space maneuvers are included, specifying a flyby trajectory over a capture trajectory does have consequences on the mission characteristics. The values of departure energy, declination and right ascension of the departure asymptote, and Mars arrival V∞ are all affected by changing the arrival event. The differences in the trajectory parameters caused by specifying either a flyby or capture arrival event are the result of optimizing the deep space maneuver to reduce the overall mission ∆V. In trying to minimize Mars arrival ∆V for a capture arrival event, MIDAS calculates the optimal trajectory with a deep space maneuver in order to reach Mars with the optimal conditions for capture. Since Mars arrival ∆V is now being accounted for by the deep space maneuver, the original outgoing V∞ direction is changed to place the deep space maneuver in the optimal location at the optimal time, which may be drastically different than the placement of the outgoing V∞ vector when a flyby arrival event is specified.
The Earth to Mars flight paths without added deep space maneuvers are ballistic trajectories, meaning, after the initial injection burn the spacecraft coasts the remainder of the trip to Mars. The Earth to Mars flight paths with added deep space maneuvers are, however, not ballistic. These trajectories rely on mid-course impulsive burns to optimize various trajectory characteristics en route to Mars. For missions in which maneuvers were added, no more than two were actually performed. MIDAS is capable of adding up to eight deep space maneuvers into a trajectory, however, using just two usually accomplishes the desired departure energy reduction without over complicating mission trajectories.
For all contour plots, the spacecraft departs from a 407 km circular parking orbit. Inclination was not independently set for this study, as MIDAS has a parking orbit inclination default value of 90°. The default value of 90° was used because there is no plane change required, and therefore no ∆V required, in order to depart from a lesser inclination.
In order to generate a range of data for each parameter, a parameter search was performed in MIDAS in which the departure and arrival dates were varied over a set range in two-day increments. MIDAS calculates the values of the specified trajectory characteristics only to a precision of two decimal places. In some instances, this complicates the task of determining exactly which date is optimal for launch because two or more dates may result in having the same departure energy due to MIDAS rounding.

NASA/TM—2010-216764 12
Mission Design Data Contour Plots Earth to Mars Mission Opportunities 2026 to 2045
Earth to Mars—2026 Opportunity
TABLE 2.—EARTH TO MARS—2026 OPPORTUNITY—ENERGY MINIMA
Mission type
Earth departure date (m/d/yr)
Mars arrival date (m/d/yr)
C3 (km2/sec2)
Right ascension (deg)
Declination (deg)
Mars arrival excess speed (km/s)
Type 1 11/14/26 8/9/27 11.11 120 28.28 2.915 Type 2 10/31/26 8/19/27 9.144 130.7 23.16 2.729 Type 1 11/14/26 8/9/27 11.11 120 28.28 2.915 Type 2 11/6/26 9/8/27 9.646 130 32.8 2.565

NASA/TM—2010-216764 13
5

NASA/TM—2010-216764 14

NASA/TM—2010-216764 15

NASA/TM—2010-216764 16

NASA/TM—2010-216764 17

NASA/TM—2010-216764 18

NASA/TM—2010-216764 19
Earth to Mars—2028 Opportunity
TABLE 3.—EARTH TO MARS—2028 OPPORTUNITY—ENERGY MINIMA
Mission type
Earth departure date (m/d/yr)
Mars arrival date (m/d/yr)
C3 (km2/sec2)
Right ascension (deg)
Declination (deg)
Mars arrival excess speed (km/s)
Type 1 12/10/28 7/20/29 9.048 158.9 1.581 4.892 Type 2 12/2/28 10/16/29 8.928 185.1 29.34 3.261 Type 1 1/17/29 9/2/29 24.12 140.9 1.581 3.593 Type 2 11/20/28 9/18/29 9.315 182.8 25.51 2.966

NASA/TM—2010-216764 20

NASA/TM—2010-216764 21

NASA/TM—2010-216764 22

NASA/TM—2010-216764 23

NASA/TM—2010-216764 24

NASA/TM—2010-216764 25

NASA/TM—2010-216764 26
Earth to Mars—2031 Opportunity
TABLE 4.—EARTH TO MARS—2031 OPPORTUNITY—ENERGY MINIMA
Mission type
Earth departure date (m/d/yr)
Mars arrival date (m/d/yr)
C3 (km2/sec2)
Right ascension (deg)
Declination (deg)
Mars arrival excess speed (km/s)
Type 1 1/28/31 8/6/31 9.00 193.8 –34.2 5.541 Type 2 2/23/31 1/9/32 8.237 252.9 1.015 5.53 Type 1 3/1/31 9/27/31 17.89 177.7 –25.3 3.777 Type 2 12/13/30 9/25/31 12.48 225.9 8.543 3.445

NASA/TM—2010-216764 27

NASA/TM—2010-216764 28

NASA/TM—2010-216764 29

NASA/TM—2010-216764 30

NASA/TM—2010-216764 31

NASA/TM—2010-216764 32

NASA/TM—2010-216764 33
Earth to Mars—2033 Opportunity
TABLE 5.—EARTH TO MARS—2033 OPPORTUNITY—ENERGY MINIMA
Mission type
Earth departure date (m/d/yr)
Mars arrival date (m/d/yr)
C3 (km2/sec2)
Right ascension (deg)
Declination (deg)
Mars arrival excess speed (km/s)
Type 1 4/6/33 10/1/33 8.412 271 –54.9 3.956 Type 2 4/28/33 1/27/34 7.781 311.4 –11.2 4.377 Type 1 4/20/33 11/6/33 9.266 267.1 –53.2 3.311 Type 2 1/26/33 10/17/33 17.78 278.3 –2.53 3.831

NASA/TM—2010-216764 34
NASA/TM—2010-216764 35

NASA/TM—2010-216764 36

NASA/TM—2010-216764 37
NASA/TM—2010-216764 38

NASA/TM—2010-216764 39

NASA/TM—2010-216764 40
Earth to Mars—2035 Opportunity
TABLE 6.—EARTH TO MARS—2035 OPPORTUNITY—ENERGY MINIMA
Mission type
Earth departure date (m/d/yr)
Mars arrival date (m/d/yr)
C3 (km2/sec2)
Right ascension (deg)
Declination (deg)
Mars arrival excess speed (km/s)
Type 1 4/21/35 11/3/35 10.19 0.5033 6.135 2.692 Type 2 6/12/35 7/28/36 17.52 54.360 2.953 4.063 Type 1 5/7/35 11/23/35 11.80 351.300 6.892 2.600 Type 2 3/12/35 11/7/35 19.33 17.900 –13.50 2.697

NASA/TM—2010-216764 41

NASA/TM—2010-216764 42

NASA/TM—2010-216764 43

NASA/TM—2010-216764 44

NASA/TM—2010-216764 45

NASA/TM—2010-216764 46

NASA/TM—2010-216764 47
Earth to Mars—2037 Opportunity
TABLE 7.—EARTH TO MARS—2037 OPPORTUNITY—ENERGY MINIMA
Mission type
Earth departure date (m/d/yr)
Mars arrival date (m/d/yr)
C3 (km2/sec2)
Right ascension (deg)
Declination (deg)
Mars arrival excess speed (km/s)
Type 1 6/2/37 12/17/37 17.07 43.45 39.79 3.344 Type 2 6/18/37 7/19/38 14.84 74.97 13.59 3.356 Type 1 6/30/37 2/19/38 28.33 26.54 32.34 2.334 Type 2 4/13/37 2/7/38 31.13 66.88 1.891 2.422

NASA/TM—2010-216764 48

NASA/TM—2010-216764 49

NASA/TM—2010-216764 50

NASA/TM—2010-216764 51
NASA/TM—2010-216764 52

NASA/TM—2010-216764 53
NASA/TM—2010-216764 54
Earth to Mars—2039 Opportunity
TABLE 8.—EARTH TO MARS—2039 OPPORTUNITY—ENERGY MINIMA
Mission type
Earth departure date (m/d/yr)
Mars arrival date (m/d/yr)
C3 (km2/sec2)
Right ascension (deg)
Declination (deg)
Mars arrival excess speed (km/s)
Type 1 7/19/39 2/16/40 18.65 82.89 49.48 4.03 Type 2 7/15/39 7/9/40 12.17 94.37 18.66 2.701 Type 1 8/12/39 5/4/40 29.07 63.6 40.89 2.361 Type 2 6/11/39 5/10/40 19.29 101.7 10.12 2.384

NASA/TM—2010-216764 55

NASA/TM—2010-216764 56

NASA/TM—2010-216764 57

NASA/TM—2010-216764 58

NASA/TM—2010-216764 59

NASA/TM—2010-216764 60

NASA/TM—2010-216764 61
Earth to Mars—2041 Opportunity
TABLE 9.—EARTH TO MARS—2041 OPPORTUNITY—ENERGY MINIMA
Mission type
Earth departure date (m/d/yr)
Mars arrival date (m/d/yr)
C3 (km2/sec2)
Right ascension (deg)
Declination (deg)
Mars arrival excess speed (km/s)
Type 1 10/31/41 6/20/42 14.86 119.6 46.18 4.016 Type 2 10/19/41 8/31/42 9.818 119.9 21.71 2.49 Type 1 11/12/41 8/31/42 15.84 104.2 39.59 2.489 Type 2 10/21/41 9/4/42 9.819 119.1 23.5 2.483
NASA/TM—2010-216764 62

NASA/TM—2010-216764 63

NASA/TM—2010-216764 64

NASA/TM—2010-216764 65

NASA/TM—2010-216764 66

NASA/TM—2010-216764 67

NASA/TM—2010-216764 68
Earth to Mars—2043 Opportunity
TABLE 10.—EARTH TO MARS—2043 OPPORTUNITY—ENERGY MINIMA
Mission type
Earth departure date (m/d/yr)
Mars arrival date (m/d/yr)
C3 (km2/sec2)
Right ascension (deg)
Declination (deg)
Mars arrival excess speed (km/s)
Type 1 11/23/43 7/20/44 9.032 149.10 6.097 4.263 Type 2 11/15/43 9/16/44 8.969 163.80 31.18 2.793 Type 1 12/31/43 8/29/44 22.88 163.80 31.18 3.386 Type 2 11/13/43 9/14/44 9.006 164.30 29.53 2.793

NASA/TM—2010-216764 69

NASA/TM—2010-216764 70
NASA/TM—2010-216764 71
NASA/TM—2010-216764 72

NASA/TM—2010-216764 73

NASA/TM—2010-216764 74

NASA/TM—2010-216764 75
Earth to Mars—2045 Opportunity
TABLE 11.—EARTH TO MARS—2045 OPPORTUNITY—ENERGY MINIMA
Mission type
Earth departure date (m/d/yr)
Mars arrival date (m/d/yr)
C3 (km2/sec2)
Right ascension (deg)
Declination (deg)
Mars arrival excess speed (km/s)
Type 1 1/8/46 7/27/46 9.061 178.80 –22.00 5.512 Type 2 1/22/46 12/18/46 8.587 227.60 11.17 5.119 Type 1 2/11/46 9/17/46 20.71 161.50 –14.4 3.767 Type 2 12/3/45 9/21/46 10.84 209.60 15.49 3.256

NASA/TM—2010-216764 76

NASA/TM—2010-216764 77

NASA/TM—2010-216764 78

NASA/TM—2010-216764 79
NASA/TM—2010-216764 80

NASA/TM—2010-216764 81

NASA/TM—2010-216764 82
Appendix A.—Verification of Midas Results The MIDAS generated trajectory data with no performed deep space maneuver was validated
by making a comparison between the contour plots generated by MIDAS and those published in References 3 and 6 for the year 2005. Contour plots of departure energy, launch asymptote declination, launch asymptote right ascension, and arrival excess velocity compared favorably to those in Reference 6. Reference 3 did not contain a contour plot for the launch asymptote right ascension.
The data generated by MIDAS for the 2005 Opportunity was compared to the 2005 optimum energy data provided by Reference 6. Given that the MIDAS values only have accuracy out to one hundredth of a unit, and the values provided by Reference 6 have an accuracy of one thousandth of a unit, there are potential rounding differences between the two values. The departure dates and arrival dates fall within one or two days of each other. However, because the discrepancies are small, the values are effectively equivalent. Table 12 summarizes the energy minima data for the 2005 opportunity generated by MIDAS. Table 13 summarizes the energy minima data for the 2005 opportunity provided by Reference 6.
TABLE 12.—ENERGY MINIMA FOR 2005 OPPORTUNITY CALCULATED BY MIDAS
Mission type Earth departure date (m/d/yr)
Mars arrival date (m/d/yr)
C3 (km2/sec2)
Mars arrival excess speed (km/s)
Type 1 8/10/05 2/20/06 15.89 3.219 Type 2 9/1/05 10/4/06 15.45 3.459 Type 1 9/7/05 4/19/06 25.45 2.361 Type 2 6/21/05 4/3/06 31.44 2.466
TABLE 13.—ENERGY MINIMA FOR 2005 OPPORTUNITY DATA FROM REFERENCE 6 Mission type Earth departure date
(m/d/yr) Mars arrival date
(m/d/yr) C3
(km2/sec2) Mars arrival excess speed
(km/s) Type 1 8/10/05 2/22/06 15.883 ------- Type 2 9/2/05 10/8/06 15.445 ------- Type 1 9/8/05 4/20/06 ------- 2.3602 Type 2 6/21/05 4/4/06 ------- 2.4668

NASA/TM—2010-216764 83
Verification Contour Plots for 2005 Opportunity

NASA/TM—2010-216764 84

NASA/TM—2010-216764 85
References 1. Sauer, Carl: Preliminary Draft of Users Guide to MIDAS, March 1991. 2. Bate, R.R.; Mueller, D.D.; White, J.E.: Fundamentals of Astrodynamics, Dover Publications, Inc.,
New York, 1971. 3. George, L.E. and Kos, L.D.: Interplanetary Mission Design Handbook: Earth to Mars Mission
Opportunities and Mars to Earth Return Opportunities 2009-2024, NASA/TM-1998-208533, July 1998.
4. Clarke, V.C.: A Summary of the Characteristics of Ballistic Interplanetary Trajectories, 1962-1977, JPL Publication 32-209, January 1962.
5. Jordan, J.F.: The Application of Lambert’s Theorem to the Solution of Interplanetary Transfer Problems, JPL Publication 32-521, February 1964.
6. Segeyevsky, A.B.; Snyder, G.C.; Cuniff, R.A.: Interplanetary Mission Design Handbook, Volume 1, Part 2. Earth to Mars Ballistic Mission Opportunities, 1990-2005, JPL Publication 82-43, September 1983.
7. Navagh, J.: Optimizing Interplanetary Trajectories With Deep Space Maneuvers, M.S. Thesis, The George Washington University, Washington D.C., Langley Research Center, Contractor Report 4546, 1993.

REPORT DOCUMENTATION PAGE Form Approved
OMB No. 0704-0188 The public reporting burden for this collection of information is estimated to average 1 hour per response, including the time for reviewing instructions, searching existing data sources, gathering and maintaining the data needed, and completing and reviewing the collection of information. Send comments regarding this burden estimate or any other aspect of this collection of information, including suggestions for reducing this burden, to Department of Defense, Washington Headquarters Services, Directorate for Information Operations and Reports (0704-0188), 1215 Jefferson Davis Highway, Suite 1204, Arlington, VA 22202-4302. Respondents should be aware that notwithstanding any other provision of law, no person shall be subject to any penalty for failing to comply with a collection of information if it does not display a currently valid OMB control number. PLEASE DO NOT RETURN YOUR FORM TO THE ABOVE ADDRESS.
1. REPORT DATE (DD-MM-YYYY) 01-10-2010
2. REPORT TYPE Technical Memorandum
3. DATES COVERED (From - To)
4. TITLE AND SUBTITLE Interplanetary Mission Design Handbook: Earth-to-Mars Mission Opportunities 2026 to 2045
5a. CONTRACT NUMBER
5b. GRANT NUMBER
5c. PROGRAM ELEMENT NUMBER
6. AUTHOR(S) Burke, Laura, M.; Falck, Robert, D.; McGuire, Melissa, L.
5d. PROJECT NUMBER
5e. TASK NUMBER
5f. WORK UNIT NUMBER WBS 22-973-40-06; 22-800-90-A9
7. PERFORMING ORGANIZATION NAME(S) AND ADDRESS(ES) National Aeronautics and Space Administration John H. Glenn Research Center at Lewis Field Cleveland, Ohio 44135-3191
8. PERFORMING ORGANIZATION REPORT NUMBER E-17208
9. SPONSORING/MONITORING AGENCY NAME(S) AND ADDRESS(ES) National Aeronautics and Space Administration Washington, DC 20546-0001
10. SPONSORING/MONITOR'S ACRONYM(S) NASA
11. SPONSORING/MONITORING REPORT NUMBER NASA/TM-2010-216764
12. DISTRIBUTION/AVAILABILITY STATEMENT Unclassified-Unlimited Subject Categories: 12, 13, 16, 64, and 91 Available electronically at http://gltrs.grc.nasa.gov This publication is available from the NASA Center for AeroSpace Information, 443-757-5802
13. SUPPLEMENTARY NOTES
14. ABSTRACT The purpose of this Mission Design Handbook is to provide trajectory designers and mission planners with graphical information about Earth to Mars ballistic trajectory opportunities for the years of 2026 through 2045. The plots, displayed on a departure date/arrival date mission space, show departure energy, right ascension and declination of the launch asymptote, and target planet hyperbolic arrival excess speed, V∞, for each launch opportunity. Provided in this study are two sets of contour plots for each launch opportunity. The first set of plots shows Earth to Mars ballistic trajectories without the addition of any deep space maneuvers. The second set of plots shows Earth to Mars transfer trajectories with the addition of deep space maneuvers, which further optimize the determined trajectories. The accompanying texts explains the trajectory characteristics, transfers using deep space maneuvers, mission assumptions and a summary of the minimum departure energy for each opportunity. 15. SUBJECT TERMS Trajectories; Launching; Contours; Mission planning; Asymptotes; Targets; Deep space; Handbooks; Conics; Interplanetary trajectories; Trajectory optimization 16. SECURITY CLASSIFICATION OF: 17. LIMITATION OF
ABSTRACT UU
18. NUMBER OF PAGES
93
19a. NAME OF RESPONSIBLE PERSON STI Help Desk (email:[email protected])
a. REPORT U
b. ABSTRACT U
c. THIS PAGE U
19b. TELEPHONE NUMBER (include area code) 443-757-5802
Standard Form 298 (Rev. 8-98)Prescribed by ANSI Std. Z39-18

