internet web servers: workload characterization and ...javed/dl/papers/web/p631-arlitt.pdf ·...
TRANSCRIPT
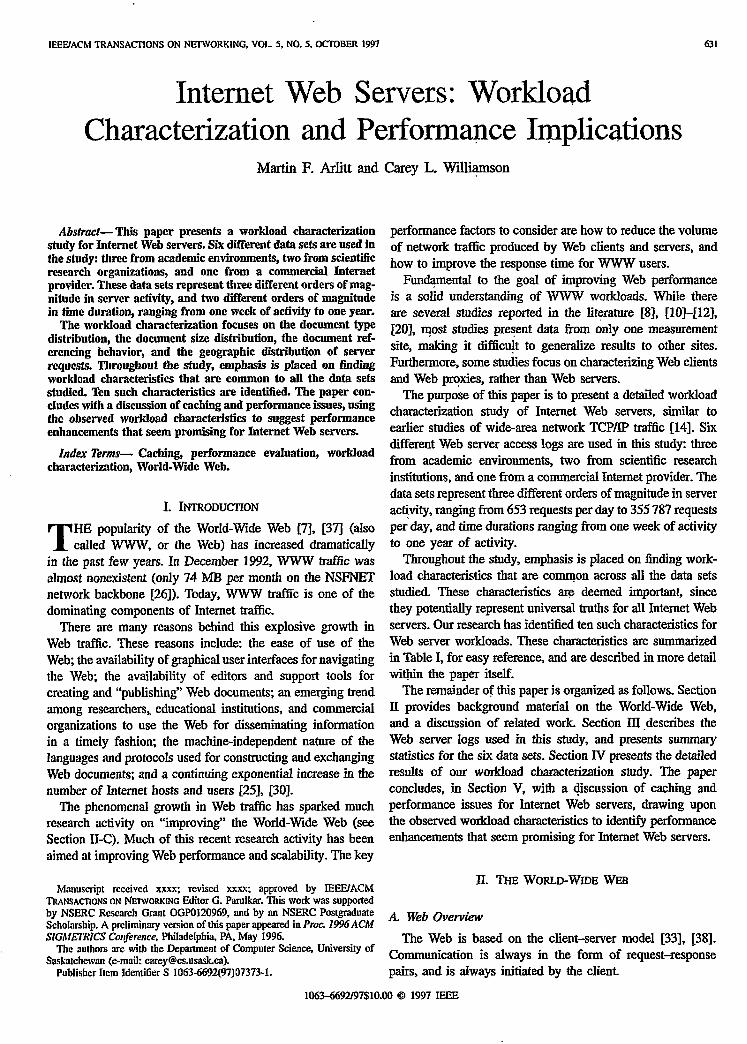
IEEE/ACM TRANSACTIONS ON NETWORKING. VOL. 5, NO. 5. OCTOBER 1997 631
Internet Web Servers: Workload Characterization and Performance Implications
Martin F. Arlitt and Carey L. Wfizpnson
Abslrucf-This paper presents a workload characterization study for Internet Web servers. Six diRerent data sets are used in the study: three From academic environments, two from scientific research organizations, and one from a commercial Internet provider. These data sets represent three different orders of mag- nitude in server activity, and two different orders of magnitude in time duration, ranging from one week of activity to one year.
The workload characterization focuses on the document type distribution, the document size distribution, the document ref- erencing behavior, and the geographic distribution of server requests. Throughout the study, emphasis is placed on tinding workload characteristics that are common to all the data sets studied. Ten such characteristics are identifted. The paper con- cludes with a discussion of caching and performance issues, using the observed workload characteristics to suggest performance enhancements that seem promising for Internet Web servers.
Index Terms- Caching, performance evaluation, workload characterization, World-Wide Web.
I. INTRODUCTION
T HE popuhuity of the World-Wide Web [7], [37] (also called WWW, or the Web) has increased dramatically
in the past few years. In December 1992, WWW traffic was almost nonexistent (only 74 MB per month on the NSFNET network backbone [26]). Today, WWW traflic is one of the dominating components of Internet traffic.
There are many reasons behind this explosive growth in Web traffic. These reasons include: the ease of use of the Web; the availability of graphical user interfaces for navigating the Web; the availability of editors and support tools for creating and “publishing” Web documents; an emerging trend among researchers, educational institutions, and commercial organizations to use the Web for disseminating information in a timely fashion; the machine-independent nature of the languages and protocols used for constructing and exchanging Web documents; and a continuing exponential increase in the number of Internet hosts and users 1251, [30].
The phenomenal growth in Web traftic has sparked much research activity on “improving” the World-Wide Web (see Section II-C). Much of this recent research activity has been aimed at improving Web performance and scalability. The key
Manuscript received xxxx; revised xxxx; approved by IEEUACM TRANSACTIONS ON NEWORKING Editor G. Pandkar. This work was supported by NSERC Research Grant OGPOl20969, and by an NSERC Postgraduate Scholarship. A preliminary version of this paper appeared in Pmt. 1996ACM SlGhfETRKS Cortference, Philadelphia, PA, May 1996.
The authors are with the Department of Computer Science, University of Saskatchewan (e-mail: [email protected]).
Publisher Item Identifier S 1063-6692(97)07373-l.
performance factors to consider are how to reduce the volume of network traffic produced by Web clients and servers, and how to improve the response time for WWW users.
Fundamental to the goal of improving Web performance is a solid understanding of Www workloads. While there are several studies reported in the literature [8], [10]+2], [20], most studies present data from only one measurement site, making it difficult to generalize results to other sites. Furthermore, some studies focus on characterizing Web clients and Web proxies, rather than Web servers.
The purpose of this paper is to present a detailed workload characterization study of Internet Web servers, similar to earlier studies of wide-area network TCPAP traffic [14]. Six different Web server access logs are used in this study: three from academic environments, two from scientific research institutions, and one from a commercial Internet provider. The data sets represent three different orders of magnitude in server activity, ranging from 653 requests per day to 355 787 requests per’day, and time durations ranging from one week of activity to one year of activity.
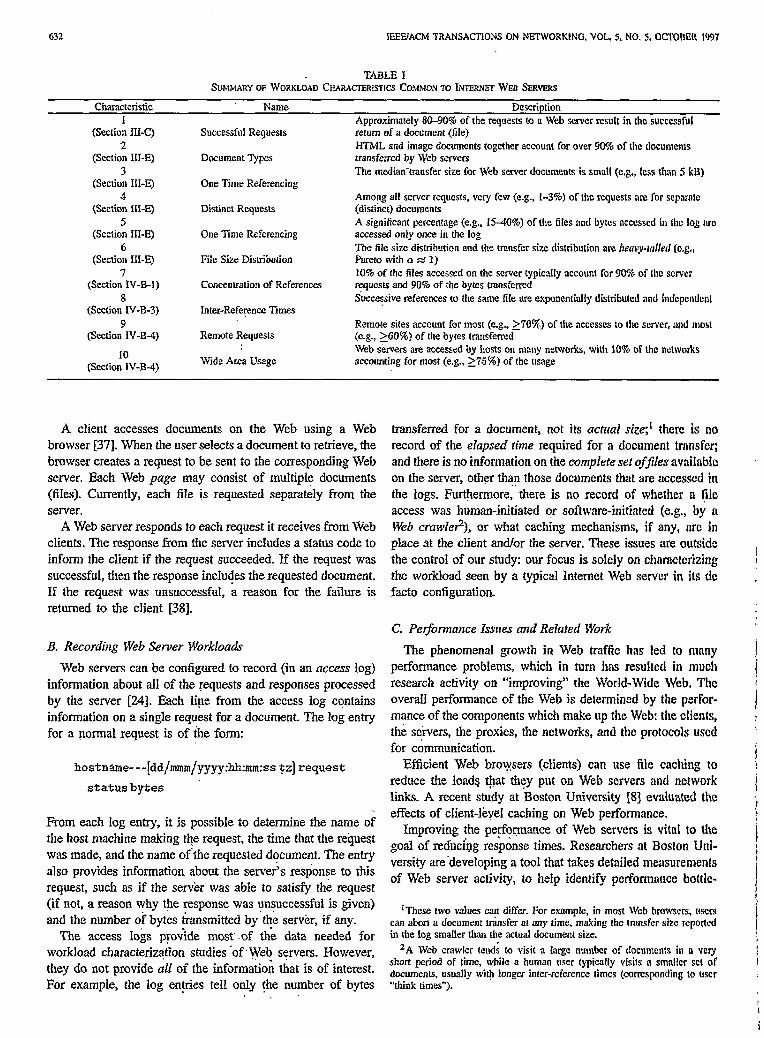
Throughout the study, emphasis is placed on finding work- load characteristics that are cormnon across all the data sets studied. These characteristics are deemed important, since they potentially represent universal truths for all Internet Web servers. Our research has identified ten such characteristics for Web server workloads. These characteristics are summarized in Table I, for easy reference, and are described in more detail within the paper itself.
The remainder of this paper is organized as follows. Section II provides background material on the World-Wide Web, aud a discussion of related work Section III -describes the Web server logs used in this study, and presents summary statistics for the six data sets. Section IV presents the detailed results of our workload characterization study. The paper conchrdes, in Section V, with a @scussion of caching and performance issues for Internet Web servers, drawing upon the observed workload characteristics to identify performance enhancements that seem promising for Internet Web servers.
Il. THE WORLD-WIDE WEB
A. Web Overview
The Web is based on the client-server model [33], [38]. Communication is always in the form of request-response pairs, and is always initiated by the client.
1063-6692/97.$10.00 0 1997 IEEE
632 IEEE’ACM TRANSACHONS ON NETVJORKING, VOL. 5. NO. 5. OCTOBER 1997
TABLE I Suhihudw OF WORKLOAD CHARACTERISTICS COMMON TO INTERNET WEB SERVERS
CharactetisGc 1
(Section 111-C) 2
(Section III-E) 3
(Section III-E)
(Sectioi III-E) 5
(Section III-E) 6
(Section III-E) 7
(Section IV-B-I) S
(Section IV-B-3) 9
(Section IV-B-4)
IO (Section IV-B-4)
Name
SuccessfuI Requests
Document Types
One Time Referencing
Distinct Requests
One Time Referencing
File Size Distribution
Concentration of References
Inter-Reference Times _ .
Remote Requests
Wide Area Usage
Description Approximately SO-90% of the requests to a Web server result in the successful return of a document (tile) HTML and image documents together account for over 90% of the documents transferred by veb servers The median-transfer size for Web server documents is small (cg., less than 5 kB)
Among at1 server requests, very few (e.g., I-3%) of the requests arc for scparntc (distgnct) documents A significant percentage (e.g., 1540%) of the fiIes and bytes acccsscd in the log nro accessed only once in the log The file size distribution and the transfer size distribution are benv-toiler! (e.g., Pareto with a z5 1) 10% of the files accessed on the server typically account for 90% of the scrvcr yuests and 90% of the bytes transferred Successive references to the same file are exponentially distributed and indcpcndcnt
Remote sites account for most (e.g., >‘iO%J of the accesses to the server. nnd most (e.g., LGOX) of the bytes transferred Web s&vets are accessed by hosts on many networks, witfi 10% OF the networks accounting for most (e.g., LZi%,) of the usage
A client accesses documents on the Web using a Web browser [37]. When the user selects a document to retrieve, the browser creates a request to be sent to the corresponding Web server. Each Web page may consist of multiple documents (files). Currently, each file is requested separately from the server.
A Web server responds to each request it receives from Web clients. The response from the server includes a status code to inform the client if the request succeeded. If the request was successful, then the response incIu<es the requested document. If the request was unsuccessful, a reason for the failure is returned to the cIient [38].
B. Recording Web Senter Workloadr
Web servers can be configured to record (in an access log) information about all of the requests and responses processed by the server [24]. Each line from the access log cqntains information on a single request for a document. The log entry for a normal request is of ihe form:
hostn&me- - -[dd/mmm/yyyy:hh:mm:ss Jz) request status bytes
From each log entry, it is possible to determine the name of the host machine making the request, the time that the r&quest was made, and the name of-the requested document. The entry also provides information about the server’s res$onse to this request, such as if the servh was able to satisfy thk request (if not, a reason why $e response was unsuccessful is given) and the number of bytes hnsmitted by the server, if any.
The access lo& pyoiide most’ .of thi data needed for workload characteriz$on studies *of ,web servers. However, they do not provide all of the informatioi that is of interest. For example, the log entries tell only fhe number of bytes
transferred for a document, not its actual size;’ there is no record of the elapsed time required for a document transfer; and there is no information on the complete set offiles avaiIable on the server, other than those documents that are accessed in the logs. Furthermore; there is no record of whether a file access was human-initiated qr software-initiated (e.g., by a Web crawle?), or what caching mechanisms, if any, are jn place at the client and/or the server. These issues are outside the control of our study: onr focus is solely on characterizing the workload seen by a typical Internet Web server in its de facto configuration.
C. Performance Issues and Related Work
The phenomenal growth in Web traffic has led to many performance problems, which in turn has resulted in much research activity on “improving” the World-Wide Web. The overall performance of the Web is determined by the perfor- mance of the components which make up the Web: the clients, thk seivers, the proxies, the networks, and the protocols used for communication.
Efficient Web broysers (clients) can use file caching to reduce the loads cat thg put on Web servers and network links. A recent study at Boston University {e] evaluated the effects of client-lizye1 caching on Web performance.
Improving the pe+mance of Web servers is vital to the goal of redu&g response times. Researchers at Boston Uni- versity are’developing a tool that takes detailed measurements of Web server activity, to help identify performance bottle-
‘These LWO values can differ. For example, in most Web browsers, users can abort a document tr$nsfer at any time. making the transfer size reportcrl in the log smasher than the actual document size.
‘A Web crawler tends to visit a large number of documents in n very short period of time, while a human user typically visits a smaller set of documents. usually wit@ longer inter-reference times (comzsponding to ttscr “think times’>.
.--- _ .- - __ ,. -
ARLIIT AND WILLIAhlSON: INTERNET WEB SERVERS
TABLE II SUMMARYOF Access JBG CHARACIERISTKS (RAW DATA)
Item
Access Log Duration
Access Log Start Diuc
Total Requests
Avg RequestsIDay
Totul Bytes Tmnshred (MB)
Avg Bytes/thy (MB)
fl
Jan. 1. 1995 I
Oct. 24, 1994 I
June 1, 1995
158 601
I
726 739
I
2408625
653 I
2059 I
11255
1701 I
7577
I
12330
7.0 I
21.5 I
57.6
-r NASA
2 months
July 1, 1995
3461612
56 748
62483
1024.3
ClarkNet
2 weeks
Aug. 28, 1995
3 328 632
237 759
27592
1970.9
633
NCSA
1 week
Aug. 28. 1995
2490512
355 787
28 268
4038.3
necks [2]. Yeager and McGrath [38] evaluate the performance impact of different Web server designs. Other researchers have studied the use of tile caching in reducing Web server loads WI.
Web proxies are useful for reducing response times and network traffic [16]. Researchers at several institutions are studying various cache replacement policies for Web proxies VI. PI, 1361.
Several studies have suggested the use of network file caches to reduce the volume of traffic on the Internet [lo], [13]. Researchers at NLANR have implemented a prototype hierarchy of caches, and are currently focusing on configuring and tuning caches within the global hierarchy [34].
The current protocol used for client-server interaction within the World-Wide Web (i.e., HTTP) is quite inefficient. A more efficient approach would allow for multiple client requests to be sent over a single TCP connection [23], [27].
Spasojevic et al. [32] suggest using a wide-area file system within the World-Wide Web. Current file systems, such as AFS [ 171, have mechanisms to address performance, reliability and security, problems with which the World-Wide Web is currently struggling.
Although the primary focus of this paper is workload char- acterization for Web servers, several relevant issues affecting server caching and performance are discussed in Section V. Client, proxy, network, and protocol performance issues are outside the scope of this paper.
III. DATA COLLECTION AND ANALYSIS
This section presents an overview of the six separate data sets used in our workload characterization study: the data collection sites, the “raw” log contents, the reduction of the raw data from the access logs into more manageable form, and
document types and sizes; the statistical characteristics of the six data sets are then summarized.
A. Data Collection Sites
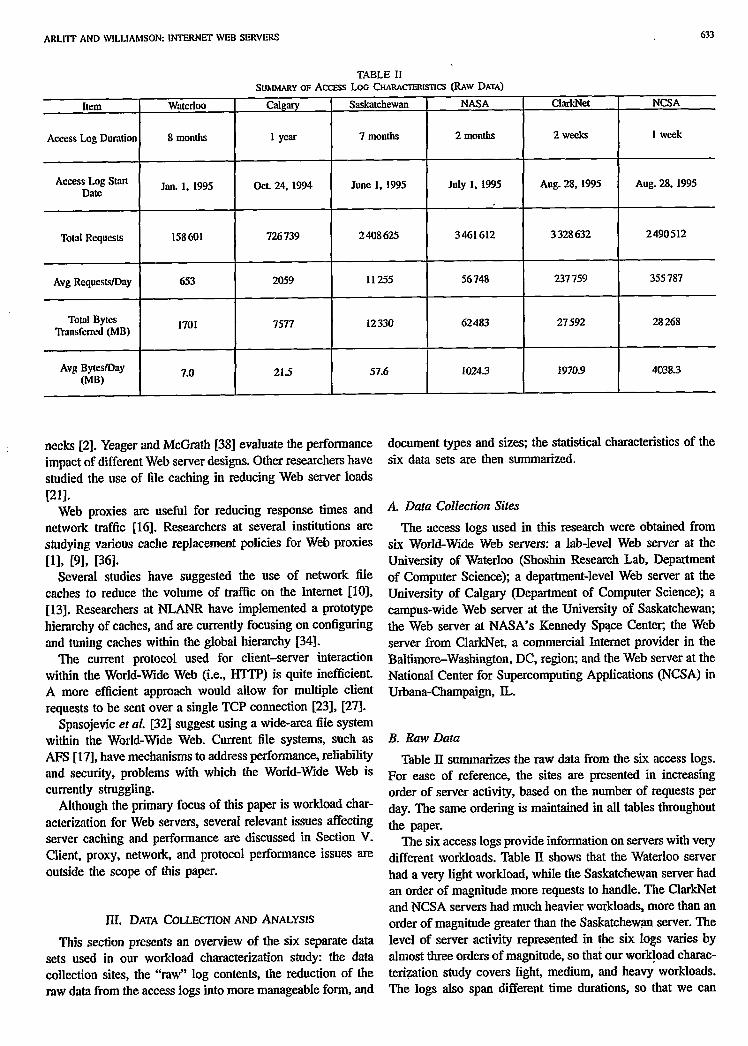
The access logs used in this research were obtained from six World-Wide Web servers: a lab-level Web server at the University of Waterloo (Shoshin Research Lab, Department of Computer Science); a department-level Web server at the University of Calgary (Department of Computer Science); a campus-wide Web server at the University of Saskatchewan; the Web server at NASA’s Kennedy Space Center; the Web server from ClarkNet, a commercial Internet provider in the Baltimore-Washington, DC, region; and the Web server at the National Center for Supercomputing Applications (NCSA) in Urbana-Champaign, IL.
Z3. Raw Data
Table II summarizes the raw data from the six access logs. For ease of reference, the sites are presented in increasing order of server activity, based on the number of requests per day. The same ordering is maintained in all tables throughout the paper.
The six access logs provide information on servers with very different workloads. Table II shows that the Waterloo server had a very light workload, while the Saskatchewan server had an order of magnitude more requests to handle. The ClarkNet and NCSA servers had much heavier workloads, more than an order of magnitude greater than the Saskatchewan server. The level of server activity represented in the six logs varies by almost three orders of magnitude, so that our workload charac- terization study covers light, medium, and heavy workloads. The logs also span different time durations, so that we can

634 IEEE/ACM TRANSACTIONS ON NETWORKlNG. VOL. 5, NO. 5, OCTOUER I997
TABLE III BREAKDOWN OF SERVER Rfmom~s FOR ALL DATA SETS
Response Code ‘Waterloo successful 86.6% Not Modified 7.8% Found 1.7% Unsuccessful 39% Total 100.0%
Calgary ’ 78.1%
13,5% 4.2% 4.2%
100.0%
Saskatchewan 90.7% 6.3% 1.7% 1.3%
100.0%
NASA 89.3% 7.7% 21% 0.9%
100.0%
ClarkNet 88.4% 8.1% 0.9% 2.6%
100.0%
NCSA 922,DQ 4,1% 0.3% 3.6%
100.0%
TABLE IV %MhwRY OF ACCESS LQG CHARACIXRISTICS (REDUCED DATA, SUCCESSFUL REQU~S ONLY)
Item Waterloo Calgary Saskatchewan NASA ClarkNet I NCSA Total Requests 137 277 567 794 2 184535 3092291 2940873 2 290299 Avg Requests/Day 565 1608 10208 50 693 21DO62 327 186 Distipct Requests 3413 8369 18871 9355 32240 23864 Distinct Requesmay 14 24 88 153 2303 3409 Total Bytes Transferred (MB) 1701 7577 12330 62483 27592 28268 Avg Bytes/Day (MB) 7.0 21.5 57.6 1024.3 1970.9 4038,3 Total Distinct Bytes @lB) 103.0 264.3 249.2 204.7 414.9 666.6 Distinct Bytes/Day (MB) 0.42 0.75 1.16 3.36 29.6 95.2 Mean Transfer Size (bytes) 12993 13993 5918 21188 9838 12942 Median Transfer Size (bytes) 2503 2674 1898 4179 4542 3849 Mean File Size (bytes) 33879 41511 16166 32500 13497 41337 Median FiIe Size (bytes) 5313 2994 1442 5943 1994 3044
study short term, medium term, and long teti aspects of Web server file referencing activity.
C. Access Log A,tulysis
The first step in our data analysis was to study the response codes in the Web server access logs. There are many possible responses to client requests. These include: 1) Successful-a valid document, which the client has permission to access, was found on the server and returned to the client (or partially returned, if the client aborted); 2) Not Modif;led--the client, which already has a copy of the document in its cache but wishes to verify that the document is up-to-date, is told thaf the document has not been modified at the se@er (thus no data bytes need to be transferred); 3) Found-the requested document is known to reside in a different location than was specified by the URL provided by the client, so the server responds with the new URL (but no! the document); and 4) Urtsuccessfu&5ther no such document exists, the client did not have permission to access this document, or an error occurred (at the server or during network communi- cation).
Table III provides an overall view of the response code frequencies observed in the access logs. From Table III, we can identify the first common characteristic in Web server workloads. Successful responses made up 78-92% of alI responses in the logs. Cache related queries that result in Not ModiJied account for 414%. The latter observation suggests either the limited use or the limited effectiveness of client- side or network-level caching in’the World-Wide Web. The Successjid and Nut Modified rqquests account for 92-97% of a11 requests across the six data sets.
D. Data Reduction
Since the Successjll responses account for all of the docu- ments transferred by the server, only these responses are used for the remaining analyses in this paper. This simplification focuses the workload characterization on the most common events.
Table IV provides a statistical summary of the reduced data sets. This tabIe shows that the number of distinct documents requested from the server is significantly lower than the total number of documents requested, implying that some documents are requested many, many times. The mean size of the documents transferled is quite small (x5-21 kEQ as might be expected, and the median is even smaller (x2-4 kB), These relatively small sizes suggest that Web users (and Web page designers) are very conscious of the impact of document size on download time, particularly over low-speed Internet links.
E. Document Types and Sizes
The next step in our analysis was to classify documents by type, using the generic categories HTML, Images, Sound, Video, Formatted, and Dynamic files. Classification was bnsed on the suffix used in file names (e.g., . html, . gif, . au, .mpeg, .Ps, .cgi, and many more). Unrecognized docu- ment types are classified as Other.
For each of the data sets in Table XV, statistics on the type of document requested were calculated. The results from this analysis for two of the six data sets (NCSA and NASA) are shown in Fig. 1. The graphs show the percentage of each document type seen based on requests, bytes transferred, distinct files accessed on the server, and distinct bytes accessed on the server.

.~ _- -... &
ARLITI- AND WILLIAMSON: INTERNET WEB SERVERS 635
TABLE V STATISTICS ox DISIINCT D~~JMENTS FOR ALL DATA SEKS
Item Waterloo Distinct Requestsffotal Requests 2.5% Distinct Bytes/Total Bytes 6.0% Distinct Files Accessed Only Once 32.4% Distinct Bytes Accessed Only Once 34.7%
Calgary 1.5% 3.5% 22.6% 19.8%
Saskatchewan 0.9% 20% 42.0% 39.1%
NASA 0.3% 0.3% 421% 15.3%
ClarkNet 1.1% 1.5%
324% 24.8%
NCSA 1.0% 2.4% 35.0% 39.1%
80
0 Requests Bytes Unique Unique
Transferned Files Byt=
(a)
HTha-
80
$j 60
ii j 40
20
0 it Requests Bytes Unique Unique
Transferred Files Bytes
0
Fig. 1. Distribution of document types: (a) NCSA server and @) NASA server.
Images m Audio -
Dynamic 0 Formatted tmgmt~
Other @iizi
The document type analysis identified a second common characteristic in Web server workloads. Across the six data sets, HTML and Image documents accounted for 90400% of the total request8 to the server.3 This observation is con- sistent with results reported by Sedayao [31] and by Cunha, Bestavros, and Crovella [12]. Both-of these papers reported that over 90% of client requests were for either HTML or image documents.
Table IV also indicates that most transferred documents are quite small, which is a third common characteristic. This phenomenon was also seen by Braun and ClafQ [IO] for requests to the NCSA’s Web server. Despite the fact that Web
31n our data sets, there is no common characteristic for HlML documents alone, or for Image documents alone. In fact, the usage of HTML and Image document types differs quite significandy for the NCSA and NASA data sets illustrated in Fig. 1.
browsers provide support for the use of multimedia objects like sound and video, documents of these types accounted for only O-01-1.2% of the requests in the six data sets. However, these types of files account for 0.2-30.8% of the bytes transferred, since these files tend to be much larger than other file types. Future growth in the use of video and audio files, made even easier with tools like Java [lS] and CGI scripts [38], may have a dramatic impact on Web server workloads.
Finally, Table V presents a breakdown of the distinct documents requested from each server. Distinct documents are determined based on the URL’s in the access log.
Table V illustrates two additional workload characteristics. First, only O-3-2.5% of the requests and 0.340% of the bytes transferred are for distinct documents. This observation implies that caching documents (at the server, at the client, or within the network) could greatly improve the performance of the server, as has been pointed out by Claf@ and Braun [lo]. Second, in all six data sets, approximately one-third (e.g., 22.6-42.10/o) of all the distinct documents are requested only once, and one-third (e.g., 1X3-39.5%) of the distinct bytes are transferred only once. This observation is somewhat surprising given that the six data sets represent time durations ranging from one week to one year. This “one time” referencing behavior has obvious implications on the maximum possible effectiveness of document caching policies. Further discussion of these implications is deferred until Section V.
F. Summary
This section has summarized the statistical characteristics of the six data sets used for our workload characterization study. While the six access logs differ greatly in duration and server activity, five common workload characteristics have been identified. These are summarized in the first five rows of Table I. The next section examines file referencing patterns and file size distributions for Internet Web servers, looking for further workload characteristics.
IV. WORKLOAD CHARACTERIZATION
This section presents a detailed analysis of file referencing behaviors on Internet Web servers, as well as a look at file sizes, transfer sizes, and the effect of user aborts in Web server workloads. We begin with an analysis of file and transfer size distributions.
A. File and Tran@er Size Distributions
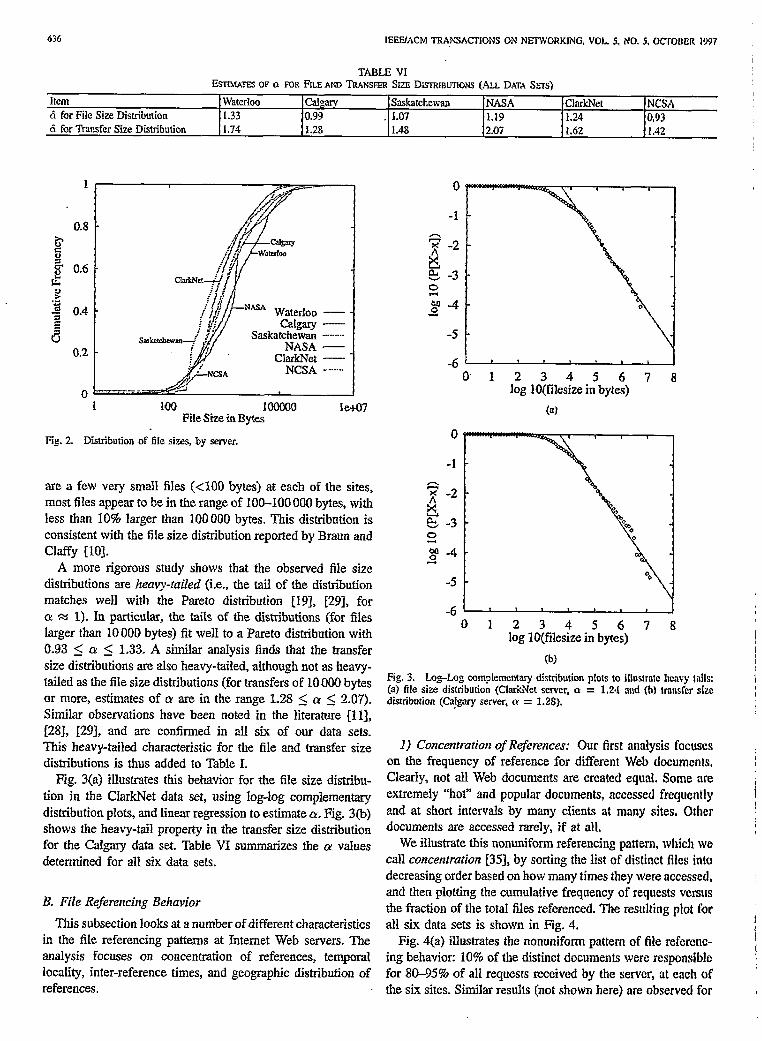
Fig. 2 shows the cumulative distribution of the sizes of the distinct documents (files) transferred by each site. While there
).
,
,
,
636 IEEEIACM TRANSACTIONS ON NETWORKING, VOL. 5. NO. 5, O~ODER IL997
TABLE VI ESIIMATES OF a FOR FILE AND TRANSFER SIZE DISTWWIONS (ALL DATA SETS)
Item Waterloo CaIgary Saskatchewan NASA ClarkNet NCSA 6 for File Size Distribution I.33 0.99 . 1.07 1.19 1.24 0.93 d for Transfer Size Distribution 1.74 1.28 1.48 2.07 1.62 il.42
Waterloo -
Saskatchewan -I...... NASA -
ClarkNet __ NaA _.-. -. -.
1Qo looal lei-07 File Size in Bytes
Fig. 2. Distribution of fib sizes, by server.
are a few very small files (<lOO bytes) at each of the sites, most files appear to be in the range of 100-100 000 bytes, with less than 10% larger than 100000 bytes. This distribution is consistent with the file size distribution reported by Braun and Claffy [lo].
A more rigorous study shows that the observed file size distributions are heavy-railed (i.e., the tail of the distribution matches well with the Pareto distribution [19], [29], for cy. = 1). In particular, the tails of the distributions (for files Iarger than 10000 bytes) fit well to a Pareto distribution with 0.93 5 Q 2 1.33. A similar anaIysis finds that the transfer size distributions are also heavy-tailed, akhough not as heavy- tailed as the file size distributions (for transfers of 10000 bytes or more, estimates of rr are in the range 1.28 5 a < 2.07). Similar observations have been noted in the literature Ill], [283, 1293, and are confirmed in all six of our data sets. This heavy-tailed characteristic for the file and transfer size distributions is thus added to Table 1.
Fig. 3(a) illustrates this behavior for the file size distribu- tion in the CIarkNet data set, using log-log compbmentary distribution plots, and linear regression to estimate Q. Fig. 3(b) shows the heavy-tail property in the trausfer size distribution for the Calgary data set. Table VI summarizes the CY v&es determined for all six data sets.
B. File Referencing Behavior
This subsection looks at a number of different characteristics in the fiIe referencing patterns at Internet Web servers. The anaIysis focuses on concentration of references, temporal locality, inter-reference times, and geographic distribution of references.
0
-1
e x -
B 2
% -3 0
M -4 s
-5
0. 1 2345678 log IO(filesize in bytes)
(a)
-6 ’ I I I 0 1 2 345678
log lO(filesize in bytes)
(b) Fig. 3. Log-Log complementary dislribution plots to illuslralc heavy Iails: (a) file size distribution (ClarkNet server. LZ = 1.24 and (b) transfer slzc distribution (Ca$ary server, a = 1.2s).
1) Concentrarion of References: Our first analysis focuses on the frequency of reference for different Web documents. Clearly, not all Web documents are created equal. Some are extremely “hot” and popular documents, accessed frequently and at short intervals by many ciients at many sites. Other documents are accessed rarely, if at all.
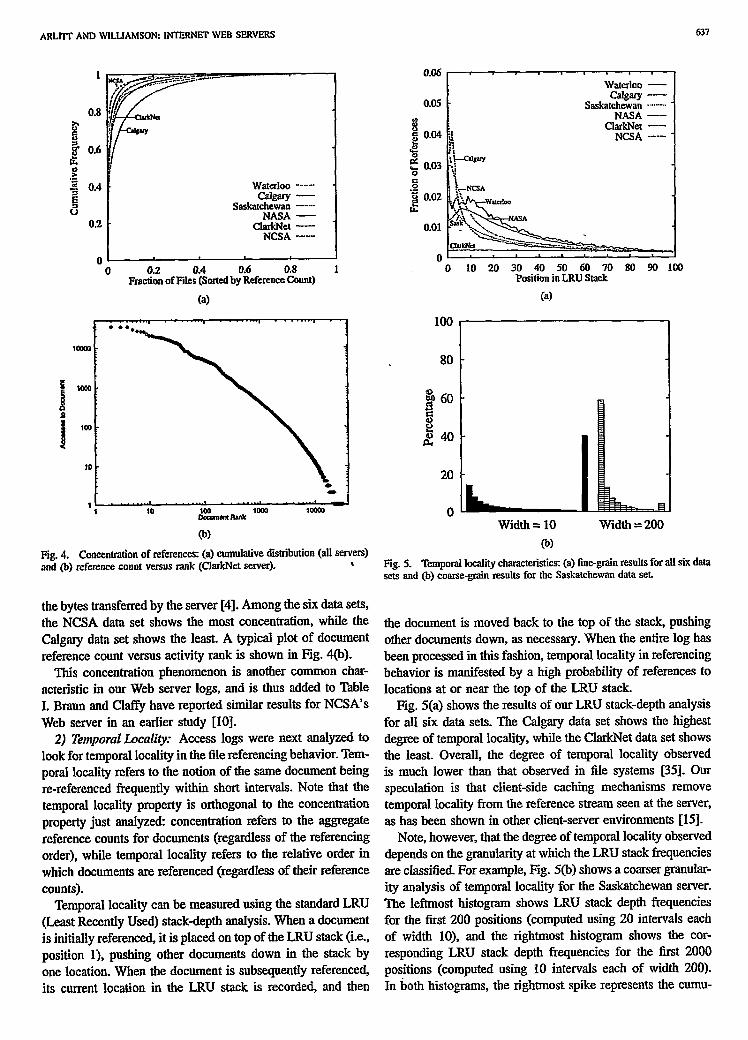
We illustrate this nonuniform referencing pattern, which we call concentration [35], by sorting the list of distinct files into decreasing order based on how many times they were accessed, and then plotting the cumulative frequency of requests versus the fraction of the tota files referenced. The resulting plot for all six data sets is shown in Fig. 4.
Fig. 4(a) illustrates the nonuniform pattern of fib referenc- ing behavior: 10% of the distinct documents were responsible for 8695% of all requests received by the server, at each of the six sites. Similar results (not shown here) are observed for
ARLIIT AND WILLIAMSON: INTERNET WEB SERVERS
0.8
WatffIoo ----. c&WY -
Saskatchewan o----.- NASA -
“is% - ---
0 0.2 0.4 0.6 0.8 1 Fraction of Files (Sorted by Reference Count)
(a)
11 . ...-...I --.....’ ..-....I ” d 1 10
LRMk 1000 loom
80
20
0
-c--.-s * . . . . .
Waterloo - W-Y -
Saskatchewan ....-.... NASA -
ClarkNet - NCSA ---.
20 30 40 50 60 70 80 Position in LRU Stack
69
Width = 10 0
Width = 200
Ag. 4. Concentration of references: (a) cumulative distribution (all servers) and (b) reference count versus rank (C1arkNe.t server)- \ Fig. 5. Temporal locality characteristics: (a) fine-grain results for all six data
sets and @) coarse-grain results for the Saskatchewan data set.
the bytes transferred by the server [4]. Among the six data sets, the NCSA data set shows the most concentration, while the Calgary data set shows the least. A typical plot of document reference count versus activity rank is shown in Fig. 4(b).
This concentration phenomenon is another common char- acteristic in our Web server logs, and is thus added to Table I. Braun and Claffy have reported similar results for NCSA’s Web server in an earlier study [IO].
2) Temporal L.ocality: Access logs were next analyzed to look for temporal locality in the file referencing behavior. Tem- poral locality refers to the notion of the same document being re-referenced frequently within short intervals. Note that the temporal locality property is orthogonal to the concentration property just analyzed: concentration refers to the aggregate reference counts for documents (regardless of the referencing order), while temporal locality refers to the relative order in which documents are referenced (regardless of their reference counts).
Temporal locality can be measured using the standard LRU (Least Recently Used) stack-depth analysis. When a document is initially referenced, it is placed on top of the LRU stack (i.e., position l), pushing other documents down in the stack by one location. When the document is subsequently referenced, its current location in the LRU stack is recorded, and then
the document is moved back to the top of the stack, pushing other documents down, as necessary. When the entire log has been processed in this fashion, temporal locality in referencing behavior is manifested by a high probability of references to locations at or near the top of the LRU stack.
Fig. 5(a) shows the results of our LRU stack-depth analysis for all six data sets. The Calgary data set shows the highest degree of temporal locality, while the ClarkNet data set shows tbe least. Overall, the degree of temporal locality observed is much lower than that observed in tile systems [35]. Our speculation is that client-side caching mechanisms remove temporal locality from the reference stream seen at the server, as has been shown in other client-server environments [15].
Note, however, that the degree of temporal locality observed depends on the granularity at which the LRU stack frequencies are classified. For example, Fig. 5(h) shows a coarser granular- ity analysis of temporal locality for the Saskatchewan server. The leftmost histogram shows LRU stack depth frequencies for the tirst 200 positions (computed using 20 intervals each of width lo), and the rightmost histogram shows the cor- responding LRU stack depth frequencies for the first 2000 positions (computed using 10 intervals each of width 200). In both histograms, the rightmost spike represents the cumu-

638 IEEUACM TRANSACTlONS ON NETWORKING, VOL. 5, NO, 5, OCTOBER I997
8
I NCSA I
6 12 18 24 Hour
Fig. 6. Distribution of hourly request arrival rate, by server.
lative reference frequencies for all remaining stack positions. Clearly, a greater degree of temporal locality is seen at coarser levels of granularity. The measurement results in Fig. 5(b) are consistent with those reported in 91.
3) Inrer-Reference limes: Our next analysis focuses on the inter-reference times for documents. The purpose of the anal- ysis is to determine if the request arrival process is Poisson (i.e., the time between successive requests are exponentially distributed and independent).
For our traces, the aggregate reference stream is definitely not Poisson, since time-of-day effects produce nonstationary request rates {see Pig. 6). Thus it is not possible to model the inter-reference times with a simple, fixed-rate Poisson process (this is similar to the problem faced by Paxson and Floyd for telnet and ftp session arrivals 1293).
The next simpIest modeI, as suggested by Paxson and Floyd [29], is to postulate that the inter-reference times during fixed interval lengths can be well modeled by homogeneous Poisson processes. Using this approach, the inter-reference times were again studied, this time over one-hour intervals. Under these conditions, the aggregate request stream still does not appear to be a Poisson process. Fig. 7(a) shows a comparison of the actual inter-reference time distribution (for a one-hour interval from the NASA trace, with 1166 requests processed within this period, for a mean inter-arrival time of 3.09 s) with an exponential distribution using the same mean arrival rate, While the empirical distribution follows the exponential distribution quite closely for short time scales, the empirical distribution has a much heavier tail (similar observations are made by Mogul [22]). Furthermore, inter-reference times show positive correlation [see Fig. 7(b)], perhaps because of machine-initiated requests [29].
There is evidence, however, that the request arrival process for individual documents is Poisson. For this analysis, we define a busy document as a document that is referenced at Ieast 50 times in a one-hour interval, in at least 25 different (nonoverlapping, but not necessarily contiguous) one-hour intervals in the trace. There were 135 such documents in our
-3 0 0.2 0.4 0.6 0.8 1 1.2 1.4 1,6
Log 1 OQnter-Arrival Time in seconds)
2 0.8
+ 0.6 ; 0.4
u 0.2 E .s 0 +j -0.2 E -0.4
2 2 -0-b --t -0.8
-1 ’ 0.‘ 5 10 15 20 25 30 35
Lag k
Fig. 7. Inter-reference time analysis (NASA server) (a) comparison IO c$- ponential distribution and (b) auto-correlation function.
traces: 0 from the Waterloo trace, 0 from Calgary, 2 from Saskatchewan, 34 from NASA, 44 from ClarkNet, and 55 from NCSA.
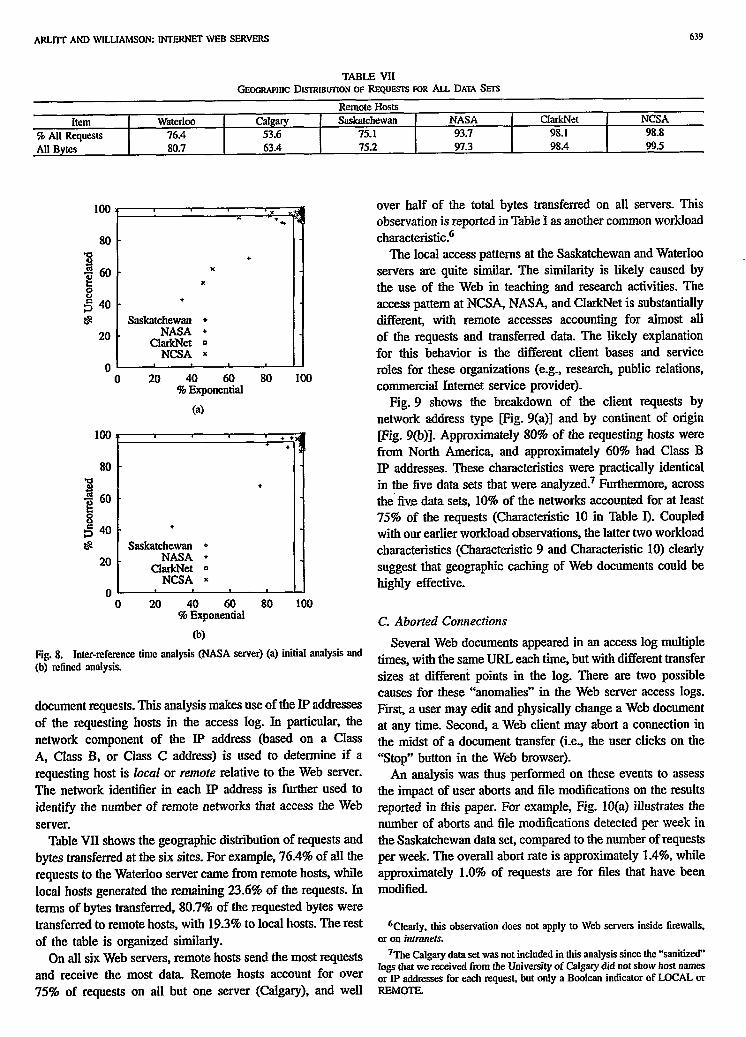
Fig. 8(a) shows the results of the analysis of the inter- reference times for these busy documents, using the tests described in 1291. There is one data point plotted for each document analyzed. If the reference stream is truly Poisson, we would expect 95% of the tested intervals to pass the test for exponentially distributed inter-arrivals and uncorrelated inter- an-iv& (i.e., they would appear in the upper right hand corner of the graph). Fig. S(a) shows that most of the files tested show reference behavior consistent with Poisson arrivals. Furthermore, if the anaIysis is tightened to exclude one-hour intervals where more than 2.5% of the reported inter-arrival times are zero4 then the files cluster even more closely in the upper-right-hand comes [see Fig. 8(b)]. Thus, the request streams for individual busy documents appear to be Poisson,
4) Geographic Disrriburion: Our final analysis of file ref- erencing behavior examines the geographic distribution of
4The server logs have a relatively coarse (I s) timeslamp resolution, and the presence of zeros makes the testing for exponentiality difficult.
5There are several outliers in this plot. The oullier 13 (0.100) is a fitc called “informationServersf.TesUTestPattem.html,” which was requested every 30 s by a single host within the NCSA domain. The other two signiknnt outlicrs were from the NASA data set. The first file was a live video feed of a shuttle launch, while the second was a dynrtmic ftlc that performed a countdown to the launch.
ARLIIT AND WILLIAMSON: INTERNET WEB SERVERS 639
Item 5% All Requests All Bytes
Water100 76.4 80.7
TABLE VII GE~CRAPHIC DKIRIBUTION OF REQUESTS FOR ALL DATA Sm
Remote Hosts Calgary Saskatchewan NASA
53.6 75.1 93.7 63.4 75.2 97.3
CM&et NCSA 98.1 98.8 98.4 99.5
100
80
3 $j 60 t: 00 5 40 ts
20
0
+ The local access patterns at the Saskatchewan and Waterloo x I servers are quite similar- The similarity is likely caused by
x
+
Saskatchewan * NASA +
ClarkNet 0 NCSA x
1
the use of the Web in teaching and research activities. The access pattern at NCSA, NASA, and ClarkNet is substantially different, with remote accesses accounting for almost all of the requests and transferred data. The likely explanation for this behavior is the different client bases and service
0 20 40 60 a0 100 roles fdr these organizations (e.g., research, public relations, % Exponential commercial Internet service provider).
over half of the total bytes transferred on all servers. This observation is reported in Table I as another common workload characteristic.6
80 B + 3 z 60
8 j 40 +
E2 Saskatchewan * 20 NASA +
ClarkNet q NCSA x
0 0 20 40 60 80 loo
% Exponential
(b)
loo
Fig. 8. Inter-reference time analysis (NASA server) (a) initial analysis and (b) refined analysis.
document requests. This analysis makes use of the IP addresses of the requesting hosts in the access log. In particular, the network component of the IP address (based on a Class A, Cfass B, or Class C address) is used to determine if a requesting host is local or remote relative to the Web server. The network identifier in each IP address is further used to identify the number of remote networks that access the Web server.
Table VII shows the geographic distribution of requests and bytes transferred at the six sites. For example, 76.4% of all the requests to the Waterloo server came from remote hosts, while local hosts generated the remaining 23.6% of the requests. In terms of bytes transferred, 80.7% of the requested bytes were transferred to remote hosts, with 19.3% to local hosts. The rest of the table is organized similarly.
On all six Web servers, remote hosts send the most requests and receive the most data. IRemote hosts account for over 75% of requests on all but one server (Calgary), and well
Fig. 9 shows the breakdown of the client requests by network address type [Fig. 9(a)] and by continent of origin pig. 9(b)]. Approximately 80% of the requesting hosts were from. North America, and approximately 60% had Class B IP addresses. These characteristics were practically identical in the five data sets that were analy~ed.~ Furthermore, across the-five data sets, 10% of the networks accounted for at least 75% of the requests (Characteristic 10 in Table I). Coupled with OUT earlier workload observations, the latter two workload characteristics (Characteristic 9 and Characteristic 10) clearly suggest that geographic caching of Web documents could be highly effective.
C. Aborted Connections
Several Web documents appeared in au access log multiple times, with the same UE& each time, but with different transfer sizes at different points in the log. There are two possible causes for these “anomalies” in the Web server access logs. First, a user may edit and physically change a Web document at any time. Second, a Web client may abort a connection in the midst of a document transfer (i-e., the user clicks on the “Stop” button in the Web browser).
An analysis was thus performed on these events to assess the impact of user aborts and file modifications on the results reported in this paper. For example, Fig. 10(a) illustrates the number of aborts and file modifications detected per week in the Saskatchewan data set, compared to the number of requests per week. The overall abort rate is approximately 1.4%, while approximately 1.0% of requests are for files that have been modified.
‘%learly, this observation’ does not apply to Web servers inside firewalls. or on intrunels.
7The Calgary data set was not included in this analysis since the “‘sanitized’ logs that we received from the University of Calgary did not show host names or IP addresses for each request, but only a Boolean indicator of LOCAL or REMOTE.

640 IEEE/ACM TRANSACTIONS ON NETWORKING. VOL. 5. NO. 5, OCTODHR I997
TABLE VIII ABORTED CONNECTIONS AND FILE MODFICATIONS
Item Waterloo Calgary Saskatchewan NASA ChUkNCC NCSA % of Connections Aborted 4.8 2.4 1.4 0.5 0.005 2.0 % of Bytes Aborted 10.3 7.8 5.6 2.2 0.006 8.4 % of Requests for Changed Files 2.5 IS.3 1.0 8.6 0.8 0.2
loo
80
$J 60
E
fg 40
QassA B CIassB a ClassC I
unknowtl = n lO,oaO -
ti 2 z’
loo - Requests -
10 - Aborts - Modifications --
5 10 15 20 25 30 35 Week Requests Sytes Unique
Transferred Hosts Domains ,
(4 North America B IMP
A”” I
IAXXII 1 Remote -
South America m 1 a0
g 60 5 j 40
20
txtrope - Africa
Asia-Pacific 0 unknown mm
Requests BYt= Transferred
Requests Bytes Aborts Aboxted Changes Trans. Bytes
[b) . . Fig. 10. Analysis of aborted connections: (a) aborted connections nnd file.
Fig. 9. Analysis of client IF addresses: (a) breakdown by network cIass modifications (Saskatchewan server) and (b) breakdown of requests by local (NCSA server) and (b) geographic distribution of requests by continent and remote (Waterfoo server). (ClarkNet server).
Fig. 10(b) analyzes aborts and file modifications at the Waterloo server from the standpoint of whether the requesting client is local or remote. 31 this data set, 76% of the incoming requests are from remote clients, and 98% of the aborted connections (which constitute 4.8% of the total requests) are aborted by remote clients. As expected, remote users are more likely fo abort a connection than are IocaI users, since network bandwidth to the Web server is often lower for remote users than local users. Regarding file modifications, 81% of the time, the first request to a modified f?le is made by i local client. This is likely the result of a user visually inspecting the changes that were just made to that file (or Web page).
Table VIII summarizes information about aborted connec- tions and file modifications for all six data sets. WhiIe the number of aborted connections is quite low, the number of bytes transferred by aborted connections is larger.
D. Summary
This section has presented a detailed study of Web server workload characteristics. Results were presented for file size distributions, file referencing patterns, and aborted connections in Web server workloads.
From the analyses reported in this section, five additional workload characteristics have been identified. These charnc- teristics appear in the last five rows of Table 1.
V. F~FORMAN~E IMPLICATIONS
We conclude our paper with a discussion of caching and performance issues for Internet Web servers. Despite the low temporal locality seen in most Web server workloads, caching stiI1 appears to be a. promising approach to im-
-. .x-- - -_
ARLIIT AND WILLIAMSON: INTERNET WEB SERVERS
proving Web performance because of the large number of requests for a small number of documents (Characteristic 4 from Table I), the concentration of references within these documents (Characteristic 7), and the small average size of these documents (Characteristic 3). We intentionally leave unspecified the location8 of the cache, focusing instead on the use of our workload characteristics to estimate the maximum performance improvement possible with Web server caching. For simplicity, the discussion assumes that all Web documents are read-only (i.e., never modified), and that file-level (not block-level) caching is used. Misses due to “cold start” are also ignored.
A. A Tradeoff: Requests versus Bytes
There are two main elements that affect the performance of a Web server: the number of requests that a server must process, and the number of data bytes that the server must transfer (i.e., disk I/O’s, packets).
There is, thus, a choice to be made between caching designs that reduce the number of requests presented to Internet Web servers, and caching designs that reduce the volume of network trafficP Both approaches represent possible avenues for improving Web server performance, but optimizing one criterion does not necessarily optimize the other. The choice between the two depends on which resource is tl,le bottleneck: CPU cycles at the server, or network bandwidth.
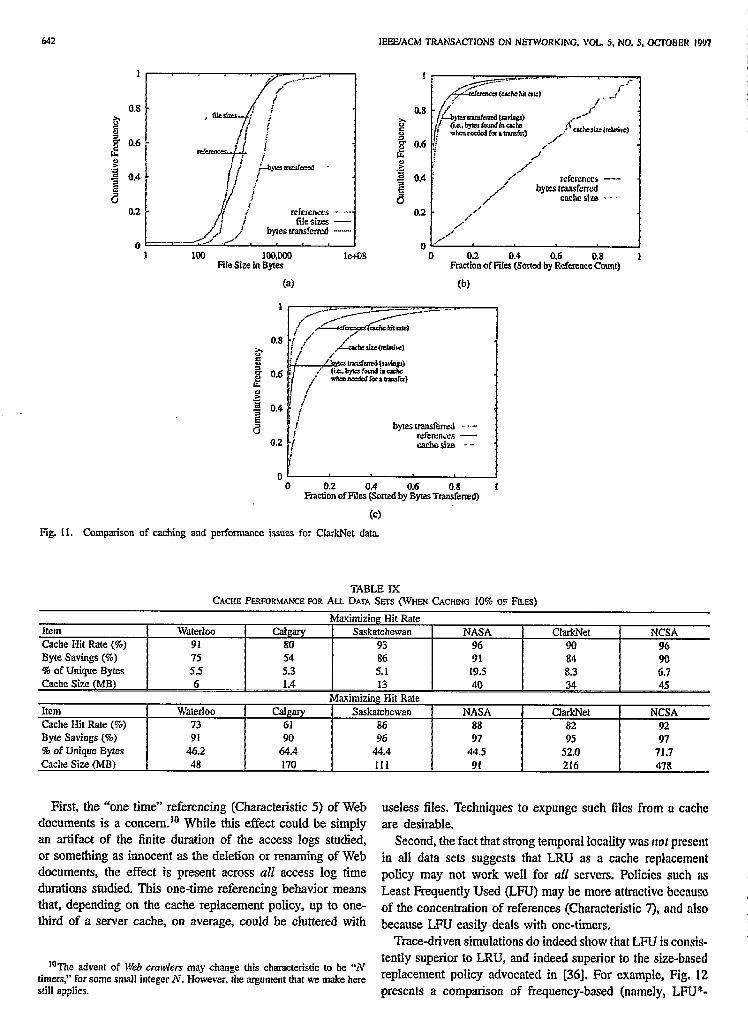
We illustrate this tradeoff in Fig. 11. While the discussion here focuses only on the ClarkNet data set, similar observa- tions apply for the other data sets.
The topmost graph [Fig. 11(a)] illustrates the relationship between the size of files on a Web server (from Fig. 2), the number of requests to those files, and the number of data bytes that requests to those files generate (Le., the “weighted value” obtained from the product of file size and number of times that a file is requested). This graph shows that 80% of all the documents requested from the ClarkNet server were less than 10000 bytes in size. 76% of all requests to the server were for files in this category. Thus, caching a large number of small files would allow the server to handle most of the requests in a very efficient manner. However, Fig. 11 also points out that the requests to files less than 10000 bytes in size generate only 26% of the data bytes transferred by the server. Furthermore, looking at the tail of the distribution, documents over 100000 bytes in size are responsible for 11% of the bytes transferred by the server, even though less than 0.5% of the requests are for files in this category (Characteristic 6). What this means is that in order to reduce the number of bytes transferred by the server
*Scvcral logical choices exist: 1) at the client, or the client’s network, to reduce requests to a remote server. 2) at the server, or the server’s network, to reduce disk accesses and/or byte transfers on the server’s network; 3) in the network itself. to reduce repeated “pulls” of the same document across a geographic region of the network; and 4) a combination of the above.
9Clearly. reducing the number of requests also reduces the volume of network traffic. but the main focus of the two approaches is different, as will bc shown.
641
as much as possible, a few large(r) files would have to be cached. That is, the server must sacrifice on “cache hits” for many small requests to save on bytes transferred for large requests.
The remaining two plots in Fig. 11 illustrate the tradeoff in more detail. The middle plot fig. I l(b)] shows the results for a cache designed to maximize cache hits for requests (i.e., to reduce the number of requests to the server). In this graph, the top line represents the cache hit rate for requests, the bottom line represents the cache size, and the middle line represents the potential savings in bytes transferred by the server when the cache is present. In this design, for example, caching 10% of the server’s distinct files (namely, the most frequently accessed documents) for the ClarkNet data set results in a cache hit rate of 90% (the top line in the graph). The documents in the cache, which represent the potential savings in bytes transferred, account for 84% (the middle line in the graph) of the bytes transferred by the server, and the cache size would need to hold 8.3% (the bottom line in the graph) of the total distinct bytes requested in the server access log.
The bottom plot Fig- 11(c)] represents the results for a cache designedto reduce bytes transferred In this graph, the top line represents the savings in bytes transferred, the bottom line represents the cache size, and the middle line represents the cache hit rate. In this design, for example, caching 10% of the server’s files (namely, the 10% of the documents that account for the most bytes transferred) results in an 82% cache hit rate (the middle line). The documents in the cache would account for 95% (the top line) of the bytes transferred, but the cache would have to be large enough to contain 52% (the bottom line) of the distinct bytes represented in the server access log.
Table IX presents the results for each of the six data sets. The top half of Table IX gives the results for a cache designed to maximize the hit rate. Across all six data sets, cache hit rates of SO-96% are possible using relatively small cache sizes (645 MB, representing 5-20% of the unique bytes). This cache design also saves 54-91% of the bytes transferred.
The bottom half of Table IX shows the performance results for a cache designed to maximize the byte savings. This study found that savings of 90-97% in bytes transferred are possible, as well as cache hit rates of 61-92%. However, larger cache sizes (48-478 MB, representing 44-72% of the unique bytes) are needed to achieve these results. Clearly there is a tradeoff to be made in cache size, cache hit rate, and bytes transferred by the server.
B. Cache Management Issues
Our final comments concern ‘one timers,” cache replace- ment strategies, and thresholding approaches to cache man- agement. We have investigated these caching issues using trace-driven simulations based on our Web server workloads [4X PI-
IEEWACM TRANSACTIONS ON NETWORKING. VOL. 5, NO. 5. OCTOBER 1997 I
1 100 loo,ow File&e in Bytes
dxnccs - byres tmnsfcned
cache she - - -
D 0.2 0.4 0.6 0.8 I Faction of F&s Qoad by Reference Count)
bytes uansfwred .‘-.-. referencvs - cachesize --
0 0 0.2 0.4 0.6 0.8 I
Fraction of Files (Sorted by Bytes Transferred)
Fig. Il. Comparison of caching and performance issues for ClarkNet data.
Item Cache Hit Rate (‘4) Byte Savings (%) % of Unique Bytes Cache Size (MB)
Item Cache Hit Rate (%) Byte Savings (%) % of Unique Bytes Cache Size {MB)
TABLE IX CACHE PERFORMANCE FOR Au. DATA Sms (WHEN CACHING 10% OF FILES)
Maximizing Hit Rate Waterloo Calgary Saskatchewan NASA ClarkNet NCSA
91 80 93 96 90 96 75 54 86 91 84 90 5.5 5.3 5.1 19.5 8.3 6.7 6 1.4 I3 40 34 45
Maximizing Hit Rate Waterloo CdgFUy Saskatchewan NASA 1 ClarkNet NCSA
73 61 36 88 82 92 91 90 96 97 95 97
46.2 64.4 44.4 44.5 52.0 71.7 48 170 111 91 216 478
First, the “one time” referencing (Characteristic 5) of Web documents is a conceru.rD While this effect could be simply an artifact of the finite duration of the access logs studied, or something as innocent as the deletion or renaming of Web documents, the effect is present across a21 access log time durations studied. This one-time referencing behavior means that, depending on the cache replacement pohcy, up to one- third of a server cache, on average, could be cluttered with
useless files. Techniques to expunge such files from a cache are desirabIe.
Second, the fact that strong temporal locality was nor present in all data sets suggests that LRU as a cache replacement poIicy may not work well for all servers. PoIicies such as Least Frequently Used (LPU) may be more attractive because of the concentration of references (Characteristic 7), and also because LFU easily deals with one-timers.
Trace-driven simulations do indeed show that LPU is consis-
loThe advent of l’eb crmvlers may change this characteristic to be “N tently superior to LRU, and indeed superior to the size-based
timers,” for some small integer X. However, the argument that we make hem replacement policy advocated in [36J. For example, Fig. 12 still applies. presents a comparison of frequency-based (namely, LPU*-

ARLITI’ AND WILLIAMSON: INTERNET WEB SERVERS 643
2 60 I% is c” 40 8 ” 20 0-
14 16 64 256 1024 Cache Size (MB)
(a)
100
0 I . . . Frequency - Recency -
Size ..w.-..
1 4 16 Cache Size&l)
256 1024
@) Fig. 12. Comparison of frequency-based. size-based, and recency-based replacement policies for the ClarkNet data set: (a) document hi& rate and (b) byte hit rate.
Aging, as described in [6]), frequency-based (LRU), and size- based (namely, the [log,(SIZE)J policy proposed in [36j) replacement policies for the ClarkNet data set, using the two standard metrics of Hit Rate and Byte Hit Rate for documents in the cache [36]. As shown in Fig. 12, the frequency-based policy provides consistently superior performance for both metrics. Note that the size-based policy, which provides the best hit rate in [36], can actually provide a significantly worse byte hit rate than other policies. Similar observations apply across all six of our data sets. Adding caching partitions based on document types helps in some cases, but does not change the relative ordering of the policies studied [4].
Third, there may be merit in using “size thresholds” in cache management, to better cope with the “heavy-tailed” Pareto dis- tribution of file sizes (Characteristic 6), and the issues raised in Section V-A. For example, two such threshold policies might be “‘never cache a document larger than X bytes” (because it uses up too much cache space, and adversely impacts hit rate), or “never cache a document smaller than Y bytes” (because it does not save much on bytes transferred by the server). Trace- driven simulation experiments confirm this intuition. Fig. 13 shows the simulation results for the NCSA data set using four possible thresholding policies: upper threshold only (100 kB), lower threshold only (500 bytes), lower and upper threshold (500 bytes and 100 kB, respectively), and no threshold. An
- Upper Only No Threshold -m---
Lower and Upper --- Lower Only ---
0 1 4 256 1024 16 64
Cache Size (h4B)
1 4 16 64 256 1024 Cache Size (MB)
@I
Fig. 13. Comparison of size-based thresbolding policies for the NCSA data set: (a) document hit rate and (b) byte hit rate.
upper threshold only provides a slight improvement in cache hit rate, but a substantial decrease in performance for byte hit rate. A lower threshold policy, on the other hand, provides the same byte hit rate, but witi a lower cache hit rate. Overall, the performance advantages of size-based thresholding policies are negligible.
VI. CONCLUSIONS
This paper has presented a detailed workload chamcteriza- tion study for Internet World-Wide Web servers. The study used logs of Web server accesses at six different sites: three from university environments, two from scientific research organizations, and one from a commercial Internet provider. The logs represent three different orders of magnitude in server activity, and span two different orders of magnitude in time duration.
From these logs, we have been able to identify ten common characteristics in Web server workloads. These characteristics appear in Table I at the start of the paper.
The observed workload characteristics were used to identify two possible strategies for the design of a caching system to improve Web server performance, and to determine bounds on the performance improvement possible with each strat- egy. The performance study identified the distinct tradeoff

644 IEEUAGM TRANSACTIONS ON NETWORKING. VOL. 5, NO. 5. OCTOIIER 1997
between caching designs that reduce network traffic, and caching designs that reduce the number of requests pre- sented to Internet Web servers. While the two approaches are somewhat at odds with each other, both represent possible avenues for improving Web server performance. Our results show that caching to reduce the number of requests may be more effective than caching to reduce bytes transferred. The observed workload characteristics also suggest cache management strategies, such as frequency-band replacement
“Tbe World-Wide Web,” Colnm!rt~. ACM vol. 37, no, 8. pp, 76-82, Aug. 1993.
[S] A. Bestavros, R. Carter, M. Crovclla, C. Cunha, A. Hcddnyn, nnd S. Mirdad, ‘Application-level document caching in the Intcmct,” in frvc. 2nd hr. Worksk~p Services Disrribuled Nellvorked Enairoruner&~ (SDNE’95). Whistler, BC, Canada, June 1395, pp. 166-173.
[9] 1. Bolot and P. Hoschka. “Performance engineering of the World-Wldc Web: Application to dimensioning and cache design: in Elec~rot~. Proc Sfh ht. -%&Wide Web Cot& F&s, France, M$y 6-10, 1996.
[IO] H. Bnun and K. Claffy, “Web tnfic charactedzntion: An nsscssmcnt of the impact of caching documents Erom NCSA’s Web server,” in Proa 2nd World Wide Web Cot$‘94: MosaL nnd Web, Chicago, IL, Oct. 1994.
that can improve the cache hit rate and byte hit rate for Internet Web servers.
Several relatively recent Web forces may someday under- mine or change our ten Web server workload characteristics. These forces include: Web crawlers, which couId reduce the one-time referencing phenomenon; improved protocols for Web interaction, which could improve bandwidth, encouraging users to request larger tiles; small-scale and large-scale Web caching architectures, which could alter the request streams that servers must handle; &nd a growing trend toward the use of video, audio, and interactivity on the Web (e.g., CGI, J&a), which could change the distributions of document types, fiIe sizes, and transfer sizes, as well as the median transfer size. Our workload characterization effort provides an important baseline from which to evaluate the impact of these forces on future Web server workloads.
ACKNOWLEDGMENT
The authors are grateful to the following people for mak- ing their Web server access logs availabIe for our study: J. Hodge, Department of Computer Science, University of Waterloo; R. Fridman, Department of Computer Science, University of CaIgary; E. Fogel, Department of Computing Services, University of Saskatchewau; J. Dumoulin, NASA (Kennedy Space Center); S. Balbach, ClarkNet; and R. Mc- Grath, NCSA.
This research was motivated by a discussion with V. Paxson in May 1995. V. Paxson was also instrumental in establishing th8 Internet Traffic Archive.
&FERENCES
[I] M. Abrams, C. Standridge, G. Abdulla. S. Williams. and E. Fox, “Caching proxies: Limitations and potenlials,” in Electron. Proc. 4rA World Wide Web Conj’95: T/x I’Pb Revoiurion, Boston, MA, Dec. I L-t4. 1995.
{2] J. Almeida. V. Ahneida, and D. Yates, “Measuring the behavior of a World-Wide Web server,” in Proc. 71!1 Cunr High F’e@nnance Netlvorking (HPNJ. White Plains, NY, Apr. 1997, pp. 57-72.
131 V. Almeida, A. Bestavros, M. Crovella, and A. de Oliveira, “Character- izing reference locality in the WWW.” in Proc. 4fb Int. Conj PuralleI Disrributed Inform. Syst. (PDIs’96), Dec. 1996.
[4] M. A&t, “A performance study of Internet Web servers,” M.S. thesis, Dept. Comput. Sci., Univ. Saskatchewan, June i996.
[5] M. Arlitt and C. Williamson, “Web server workload characterization: The search for invariants,” in Pmt. 1996 ACM SIGMETRKX Cot& Philadelphia, PA, May 1996, pp. 126-137.
L61 ‘“I&e-driven simulation of document caching strategies for GLt Web servers,” Sitnulafion J., vol. 68, no. 1, pp. 23-33, Jan. 1997.
[7] T. Bemers-Lee, R. Cailliau, A. Luotonen, H. Nielsen, and A. Secret,
[ii] M. Crovella and A. Bestavros, “Self-similarity in !Vorld Wide Web traffic: Evidence and possible causes,” in Proc. 1996 ACM SIGMEFRKS Co& Philadelphia. PA. May 1996, pp. 160-169.
[12] C. Cunha. A. Bestavms, and M. Crovella, “Chanctcristb of WWW client-based traces,” Tech. Rep. BU-CS-95-010, Boston Unia Computer Sci. Dept., 1995.
[13] P. Danzjg, M. Schwartz., and R. Hall, “A case for caching Ale objects inside intemelworks.” in Pmt. ACM SIGCOMM’93. San Frnncisco. CA, Sep. 1993, pp. 239-248.
[14] P. Danzig, S. Jamin. R. C&zeres, P. D. Mitzel, and D. Estrin. “An ompiri- cal workload model for driving wide-area TCPlIP network slmulnfionr,” fnfernerworking: Res. &per., vol. 3, no. I, pp* l-26, Mnr. 1992.
[15] K. Froese and R. Bunt, “The effect of client caching on file scrvcr workloads,” in Proc. 29111 Hmvaii In!. Co@ Sysf. Sci., Inn, 1996.
[16] S. Glassman, ‘A caching relay for the World Wide Web,” prcsentcd at the 1st it~r. ConJ World Wide Web, Geneva, Switzerland, Mny 1994.
1171 J. Howard, M. Kazar. S. Menees, D. Nichols, M. Sntynnnmynnan, R. Sidebotham, and M. West, “Scale and performance in n distributed lllo system,” ACM Trans. CotJIptt;er Sysf., vol. 6, no. I, pp, 51-81, Feb. 1988.
[18] Sun Microsystems, “Javasoft Home Page,” 1996. {19] N. Johnson and S. Katz. Eds.-in-Chief, Encyclopedia of S!&flcnl
Sciences, Vols. 6 and 9. New York: Wiley, 1988.- . 1201 T. Kwan. R. McGnth. and D. Reed. “NCSA’s World Wide Web server:
Design &d performance:’ IEEE &tnpttfer, vol. 28, pp. 68-74, NOV. 1995.
121) E. Markatos, ‘Main memory caching of Web documenls.” in Eircrrun. Proc. WJ l%rid Wjde Web Co>$, Paris. France, May 6-10. 1996.
1221 .J. Mogul, “Network behavior of a busy Web server and its clients,” Tech. Rep. WRL-TR-95.5, Digital West&m Res. Lab., Oct. 1995.
I231 -. ‘“The case for persistent-connection H’ITP:’ in Proc. AClM SIGcoMM’95, Cambridge, MA, Aug. 28-Sept. 1. 1995, pp. 299-3 13.
1241 National Center forSupe;omputing Applicatibns, “NCSA-l&pd,” 1994, 1251 Network Wizards. “Internet Domain Survey:’ 1996. 126) NSFNET Statistics, Apr. 1995. - 1271 V. Padmanabhan and J. Mogul, “Improving mP la!ency,” In Elticrmn.
Proc. 2nd World Wide \Veb Conj Mosnic nnd Web, Chicngo, IL, Od. 1994.
[2S] V. Paxson. “Empirically derived analytic models of wide-amn TCP connections,” IEEfZACM Trans. Networking, vol. 2, pp. 3 16-336, Aug. 1994.
{29] V. Paxson and S. Floyd, “Wide-area traffic: The failure of Poisson modeling,” in Proc. ACM SIGCOMM’94, London. England, Aug, 1994, pp. 257-268. I
1301 V. Paxson, “Growth trends in wide area TCP conneclions,” IEEE : Network, vol. S. pp, 8-17, July/Aug. 1994.
1311 J. Sedayao, “Mosaic will kill my network!,’ in Ebzcfrolr. Prvc. 2nd \\ti’nrld wide Web Con$: Mosnic and Web, Chicago, IL, Oct. 1994. I
1321 M. Spasojevic, M. Bowman, and A. Spector, “Using n wide-area Rlc svstem within the World-Wide Web.” in Electron. Proc. 2116 lib&! \Vicle
I
l&b ConjI’94: rMosnic and Web, Chicago, il.+ Oct. 1994. [33] A. Tanenbaum, Cotnp,uer Nehvurks, 3rd ed. Eaglewood Cliffs, NJ:
Prentice-Hall, 1996. I341 D. Wessels and K. Claffy, “Evolulion of the NLANR cache hlcmrchy:
Global configuration ch&enges,” 1996. f351 C. Williamson and R. Bunt, “Characlerizinr! short term iilc rcferenclnr!
behavior,” in Proc. fnr. PIloenix Conf. Cornpilfers Comr~rrv~, (IPCCCj] Phoenix, AZ, Mar. 1986. pp. 651-660.
1361 S. Williams, M. Abrams, C. Standtidge, G. Abdulla, and E, Fox, “Removal policies in network caches for World-Wide Web documents,’ I in Pmt. ACM SIGCOMM’96, Stanford, CA, Aug. 1996, pp. 293-305,
g37) World-wide Web Frequently Asked Qttesliotts, Apr. i 1, 1996, 1381 N. Yeager and R. McGrath, Web Server Ec~J~Jv~~~~~ The Adwtmd
GuideJor W&Id Wide &Veb b#mna~ivn Providers, San Francisco. CA: Morgan Kaufmann, 1996.
, .- I _ -
i ARLI’IT AND WILLIAMSON: INTERNET WEB SERVERS 645
Martin F. ArIitt received the B.Sc. and M.Sc. degrees from the University - ” .__ .- I_
of Saskatchewan. in 1994 and 1996. respectively. i Carey L. Williamson (M’91) received the B-SC. (Honors) degree from the University of
He is currently working as a Research Intern with the Broadband Informa- ; Saskatchewan in 1985, and Ph.D. degree from tion Systems Lab at Hewlett-Packard Laboratories in Palo Alto, CA, where Stanford University in 1991. his interests include Internet Web servers, intranets, Web server performance He is currently an Associate Professor in evaluation, and Web server benchmarking. the Department of Computer Science at the
University of Saskatchewan, Sask.. Canada. His research interests include network traffic measurement, workload characterization, Web
.- server performance evaluation, network simulation, high speed networking, and ATM.