internet use in hong kong: the 2008 annual survey report
TRANSCRIPT

Internet Use in Hong Kong:
The 2008 Annual Survey Report
(Jan 2009)
Web Mining Lab
Dept of Media & Communication
City University of Hong Kong
http://newmedia.cityu.edu.hk/hkip
http://weblab.com.cityu.edu.hk

Internet Use in Hong Kong (Jan. 2009)
1
PART I. EXPLANATORY NOTES
1. Internet Users: The survey is the 9th
annual survey of Hong Kong Internet Project (HKIP).
The target population of the report is those regular residents between 18 and 74 years old
who speak Chinese (including Cantonese, Mandarin and other Chinese dialects). The
term “Internet users” follows the definition of World Internet Project (WIP), which was
worded as “Are you using the Internet?”. This definition allows comparisons of the
results from the current survey with those from the 2000-2007 surveys. If any of the data
reported here are cited, please indicate the particular definition used in the report.
2. Networked Computers: the term refers to desktop computers and notebook computers at
home that were connected to the Internet. Other Internet-ready handheld devices, such as
PDAs or mobile phones, are not included.
3. The survey was funded by the Center for Communication Research, City University of
Hong Kong and by an Earmarked Competitive Research Grant (CERG CityU 1456/06H)
from the Hong Kong SAR Research Grants Council. The survey was implemented by
Professor Jonathan Zhu. The report, however, doesn’t represent any viewpoint of the
funding agency or the University. All the data were collected up to December 31, 2008.
Internet Use in Hong Kong (Jan. 2009)
2
PART II. SURVEY FINDINGS
1. Overall Internet Use in Hong Kong
1.1 Number of Internet Homes
Table 1. Internet Homes
Total Homes
(000)
Online Home PCs
(000)
Dialup Homes
(000)
Broadband
Homes*
(000)
2,298 1,910 40 1,870
% of Total Homes 83% 2% 81%
% of Internet Homes 100% 2% 98%
* “Broadband Homes” refers to those using ADSL or cable modem to connect to the Internet, excluding those
using ISDN (treated as “Dialup Homes”) or mobile phones to go online.
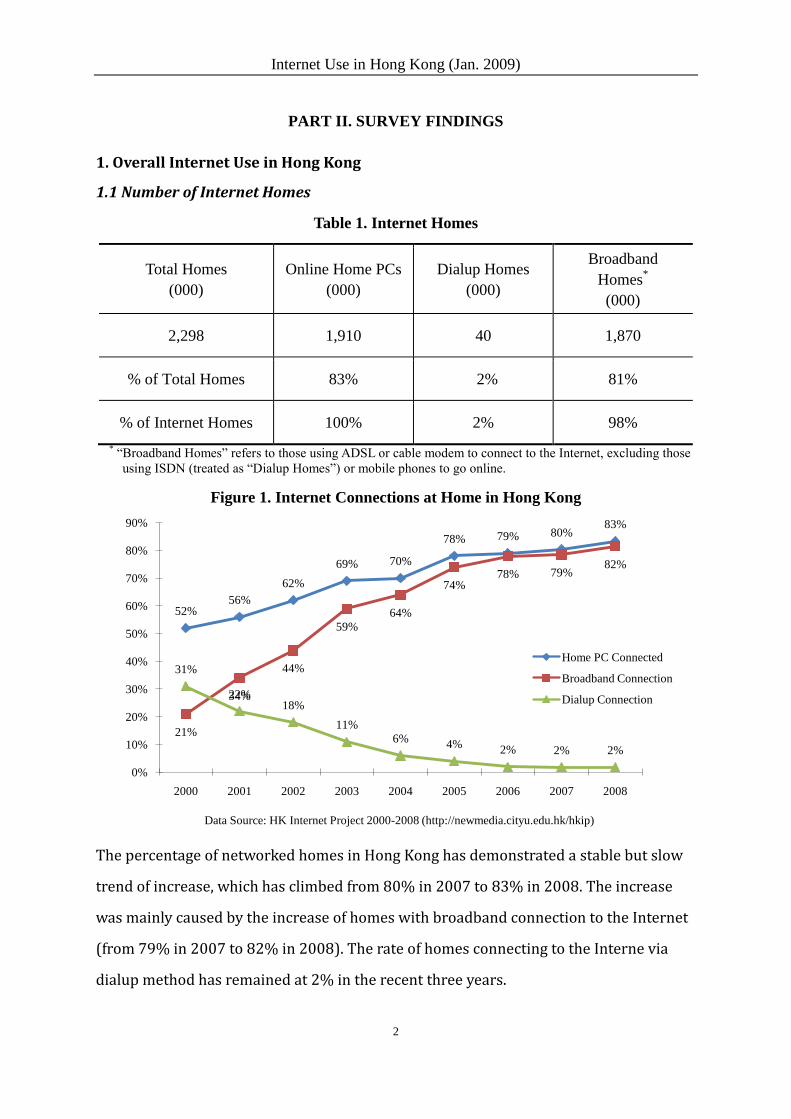
Figure 1. Internet Connections at Home in Hong Kong
The percentage of networked homes in Hong Kong has demonstrated a stable but slow
trend of increase, which has climbed from 80% in 2007 to 83% in 2008. The increase
was mainly caused by the increase of homes with broadband connection to the Internet
(from 79% in 2007 to 82% in 2008). The rate of homes connecting to the Interne via
dialup method has remained at 2% in the recent three years.
52%56%
62%
69% 70%
78% 79% 80%83%
21%
34%
44%
59%
64%
74%78% 79%
82%
31%
22%18%
11%
6%4%
2% 2% 2%
0%
10%
20%
30%
40%
50%
60%
70%
80%
90%
2000 2001 2002 2003 2004 2005 2006 2007 2008
Data Source: HK Internet Project 2000-2008 (http://newmedia.cityu.edu.hk/hkip)
Home PC Connected
Broadband Connection
Dialup Connection

Internet Use in Hong Kong (Jan. 2009)
3
1.2 Number of Internet Users
There were 3.65 million Internet users in Hong Kong at the end of 2008, who account for
68.7% of the corresponding population (i.e., 5.31 million regular residents) between 18 and
74. With sampling error considered, the actual number of Internet users may vary from 3.56
millions to 3.74 millions.
Figure 2. Annual Growth of Internet Users in Hong Kong
1% 1% 2% 3%6%
10%
16%
26%
33%
40%
45%49%
53% 54%
61%63%
67%69%
0%
10%
20%
30%
40%
50%
60%
70%
80%
1991 1992 1993 1994 1995 1996 1997 1998 1999 2000 2001 2002 2003 2004 2005 2006 2007 2008
18
-74
Ad
ult
s
Data Source: HK Internet Project 2000-2008 (http://newmedia.cityu.edu.hk/hkip)

Internet Use in Hong Kong (Jan. 2009)
4
2. Online Behavior and Perceptions of Internet Users
2.1 Individual Characteristics
1.Sex Distribution: Of the Internet users, 52.5% are male and 47.5% female. Trends in the
sex distribution of Internet users from 2000 to 2008 are shown in Table 2 and Figure 3.
Table 2. Sex and Internet Use
2000 2001 2002 2003 2004 2005 2006 2007 2008
Composition of the Users
Male 53% 54% 55% 53% 50% 51% 52% 52% 50%
Female 47% 46% 45% 47% 50% 49% 48% 48% 50%
Penetration Rate in the Population
Male 44% 50% 53% 54% 57% 66% 69% 74% 73%
Female 38% 39% 42% 43% 51% 57% 57% 61% 65%
Note: For “Composition of the Users”, percent of male = number of male users/total number of users; percent of
female = number of female users/total number of users. For “Penetration Rate in the Population”, percent of
male = number of male users/number of male respondents; percent of female = number of female users/number
of female respondents.
Figure 3. Sex Composition of Internet Users
In terms of penetration rate, users account for 73.2% of the corresponding male population
and 64.9% of the corresponding female population. There is a difference of 8% between the
sexes, which is smaller than that from 2005 to 2007, as shown in Figure 4. The average
growth rate of female users in these nine years is 6.9%, which is slightly higher than that of
male users (6.6%).
53% 54% 55% 53% 50% 51% 52% 52% 50%
47% 46% 45% 47% 50% 49% 48% 48% 50%
0%
20%
40%
60%
80%
100%
2000 2001 2002 2003 2004 2005 2006 2007 2008
Data Source: HK Internet Project 2000-2008 (http://newmedia.cityu.edu.hk/hkip)
Female
Male

Internet Use in Hong Kong (Jan. 2009)
5
Figure 4. Penetration Rate of Internet Use by Sex
2. Age Distribution: As shown in the first row of Table 3.
Table 3. Age and Internet Use
18~24 25~30 31~35 36~40 41~50 51~60 61~74
Composition of
the Users 15% 14% 13% 14% 27% 14% 4%
Penetration in
the Population 99% 96% 89% 87% 75% 48% 17%
As shown in Figure 5, middle-age users (31~50) are the major segment of Internet users in
Hong Kong, which accounts for 54% of the Internet users in 2008 and is higher than the
shares of youth (18~30, 29% in 2008) and old people (51~74, 17% in 2008).
44%
50%53% 54%
57%
66%69%
74% 73%
38% 39%42% 43%
51%
57% 57%61%
65%
0%
10%
20%
30%
40%
50%
60%
70%
80%
2000 2001 2002 2003 2004 2005 2006 2007 2008
Data Source: HK Internet Project 2000-2008 (http://newmedia.cityu.edu.hk/hkip)
Male
Female
Internet Use in Hong Kong (Jan. 2009)
6
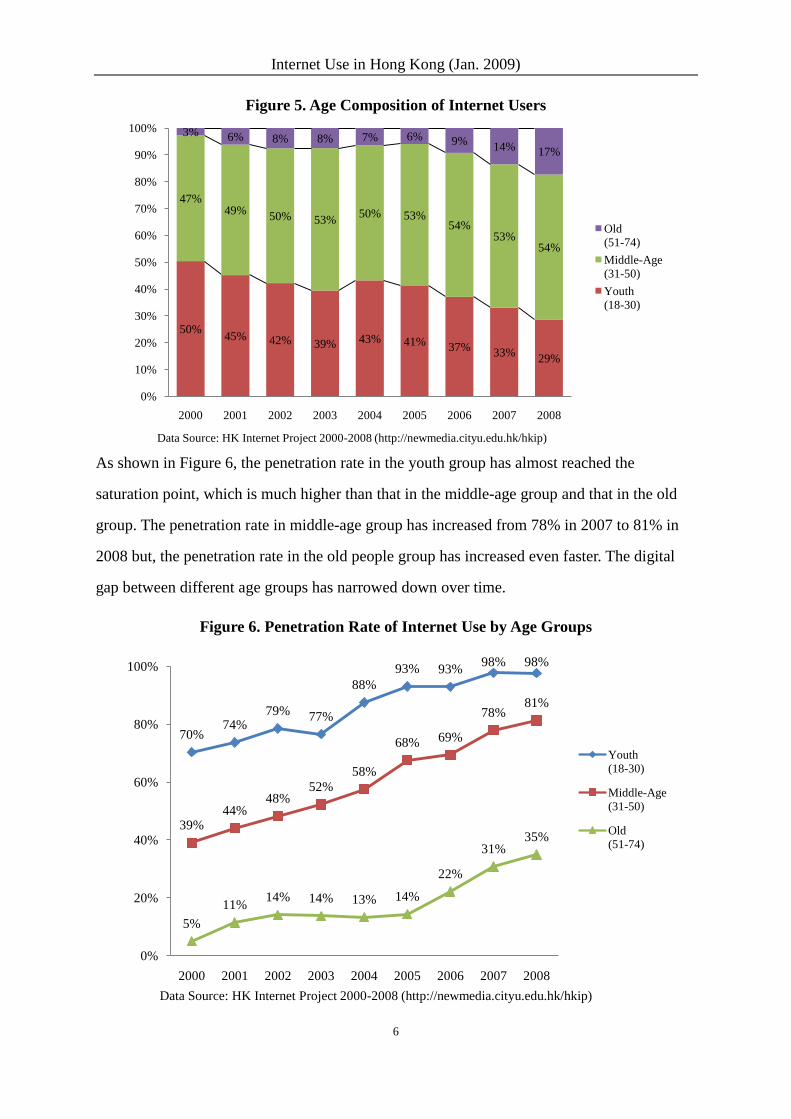
Figure 5. Age Composition of Internet Users
As shown in Figure 6, the penetration rate in the youth group has almost reached the
saturation point, which is much higher than that in the middle-age group and that in the old
group. The penetration rate in middle-age group has increased from 78% in 2007 to 81% in
2008 but, the penetration rate in the old people group has increased even faster. The digital
gap between different age groups has narrowed down over time.
Figure 6. Penetration Rate of Internet Use by Age Groups
50%45% 42% 39% 43% 41% 37%
33%29%
47%49%
50% 53%50% 53%
54%53%
54%
3% 6% 8% 8% 7% 6% 9%14% 17%
0%
10%
20%
30%
40%
50%
60%
70%
80%
90%
100%
2000 2001 2002 2003 2004 2005 2006 2007 2008
Data Source: HK Internet Project 2000-2008 (http://newmedia.cityu.edu.hk/hkip)
Old
(51-74)
Middle-Age
(31-50)
Youth
(18-30)
70%74%
79% 77%
88%
93% 93%98% 98%
39%44%
48%52%
58%
68% 69%
78%81%
5%
11%14% 14% 13% 14%
22%
31%35%
0%
20%
40%
60%
80%
100%
2000 2001 2002 2003 2004 2005 2006 2007 2008
Data Source: HK Internet Project 2000-2008 (http://newmedia.cityu.edu.hk/hkip)
Youth
(18-30)
Middle-Age
(31-50)
Old
(51-74)

Internet Use in Hong Kong (Jan. 2009)
7
3.Marital Status: Of the Internet users, 41% are unmarried (including singles, divorced and
widows) and 59% married.
Table 4. Marital Status and Internet Use
2000 2001 2002 2003 2004 2005 2006 2007 2008
Composition of the Users
Married 49% 53% 52% 52% 51% 53% 56% 54% 59%
Unmarried 51% 47% 48% 48% 49% 47% 44% 46% 41%
Penetration Rate in the Population
Married 30% 36% 36% 37% 42% 50% 52% 57% 61%
Unmarried 65% 61% 64% 67% 74% 86% 86% 86% 85%
As shown in Figure 7, in 2008, 59% of Internet users in Hong Kong are married, which
represents the largest share over the nine years under study.
Figure 7. Marital Statuses of Internet Users
In terms of penetration rate, users have always accounted for about 85% of the corresponding
unmarried population in the recent four years, whereas the rate of users in the married
population has increased stably, from 50% in 2005 to 52% in 2006, 57% in 2007 and 61% in
2008, which narrows the gap between the unmarried and married populations from 36% in
49%53% 52% 52% 51% 53% 56% 54%
59%
51%47% 48% 48% 49% 47% 44% 46%
41%
0%
10%
20%
30%
40%
50%
60%
70%
80%
90%
100%
2000 2001 2002 2003 2004 2005 2006 2007 2008
Data Source: HK Internet Project 2000-2008 (http://newmedia.cityu.edu.hk/hkip)
Unmarried
Married
Internet Use in Hong Kong (Jan. 2009)
8
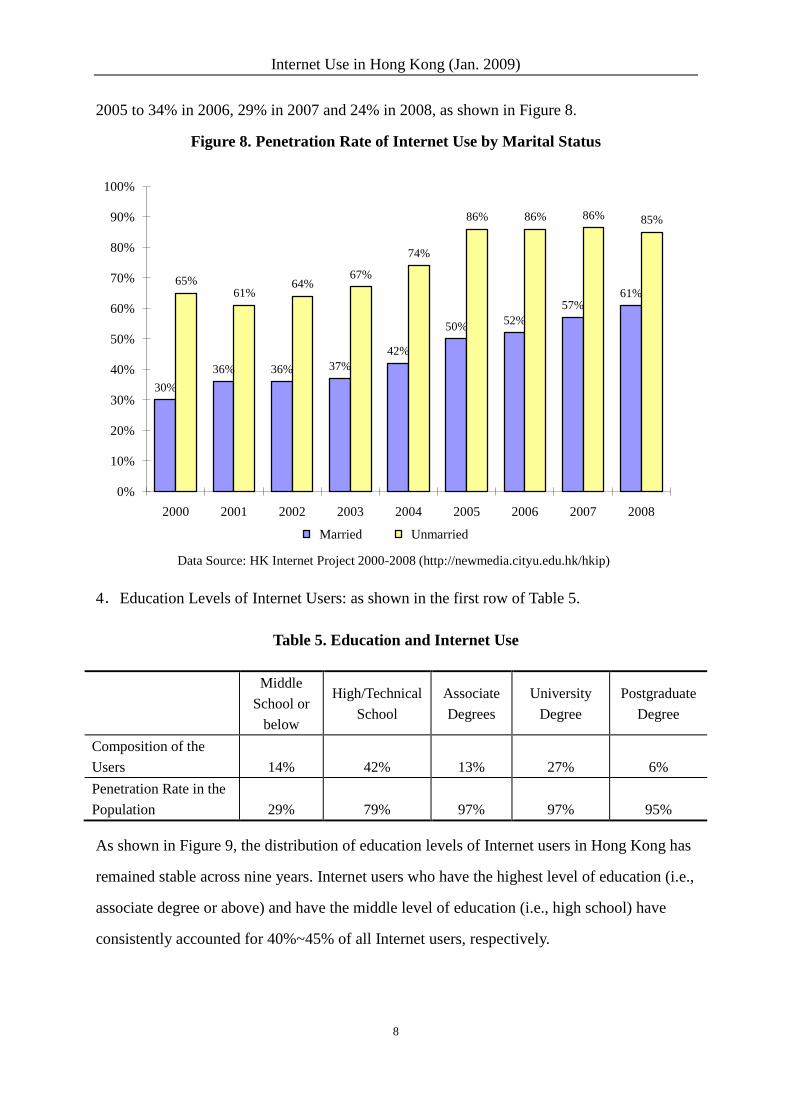
2005 to 34% in 2006, 29% in 2007 and 24% in 2008, as shown in Figure 8.
Figure 8. Penetration Rate of Internet Use by Marital Status
4.Education Levels of Internet Users: as shown in the first row of Table 5.
Table 5. Education and Internet Use
Middle
School or
below
High/Technical
School
Associate
Degrees
University
Degree
Postgraduate
Degree
Composition of the
Users 14% 42% 13% 27% 6%
Penetration Rate in the
Population 29% 79% 97% 97% 95%
As shown in Figure 9, the distribution of education levels of Internet users in Hong Kong has
remained stable across nine years. Internet users who have the highest level of education (i.e.,
associate degree or above) and have the middle level of education (i.e., high school) have
consistently accounted for 40%~45% of all Internet users, respectively.
30%
36% 36% 37%
42%
50%52%
57%61%
65%61%
64%67%
74%
86% 86% 86% 85%
0%
10%
20%
30%
40%
50%
60%
70%
80%
90%
100%
2000 2001 2002 2003 2004 2005 2006 2007 2008
Data Source: HK Internet Project 2000-2008 (http://newmedia.cityu.edu.hk/hkip)
Married Unmarried

Internet Use in Hong Kong (Jan. 2009)
9
Figure 9. Educational Composition of Internet Users
As shown in Figure 10, the penetration rate in the group with the highest level of education
has almost reached 100% in recent years, much higher than that in the two groups with less
education. The penetration rate in the group with the middle level of education has increased
from 49% in 2000 to 79% in 2008, whereas the penetration rate in the group with the least
education has increased from 13% in 2000 to 29% in 2008.
Figure 10. Penetration Rate of Internet Use by Education Level
15% 14% 11% 14% 13% 13% 14% 15% 14%
42% 40% 47%50% 48% 45% 46%
40% 44%
44% 46% 42%36% 39% 42% 40%
45% 41%
0%
10%
20%
30%
40%
50%
60%
70%
80%
90%
100%
2000 2001 2002 2003 2004 2005 2006 2007 2008
Data Source: HK Internet Project 2000-2008 (http://newmedia.cityu.edu.hk/hkip)
Associate Degree or
above
High School
Middle School or
below
76%
82%80%
85%90% 93% 91%
95% 97%
49%53% 55%
60%
69%73%
76% 78% 79%
13% 14% 13%16% 17%
22%24%
29% 29%
0%
10%
20%
30%
40%
50%
60%
70%
80%
90%
100%
2000 2001 2002 2003 2004 2005 2006 2007 2008
Data Source: HK Internet Project 2000-2008 (http://new media.cityu.edu.hk/hkip)
Associate Degree
or above
High School
Middle School or
below

Internet Use in Hong Kong (Jan. 2009)
10
5.Occupational Distribution: as shown in the first row of Table 6.
Table 6. Occupation and Internet Use
Civil
Servants
Managerial
&
Professional
Worker &
Shop
Assistant
Self
Employed Students
Retired &
Unemployed
Composition
of the Users 4% 17% 45% 4% 10% 21%
Penetration
Rate in the
Population
86% 95% 77% 91% 100% 41%
Figure 11 shows the occupational distribution of Internet users in Hong Kong from 2000 to
2008.
Figure 11. Occupational Composition of Internet Users
In terms of penetration rate, as shown in Figure 12, almost every student has used the Internet
for years. The rate among managerial or professional people and civil servants has grown
above 95%. The rate among retired/unemployed people has also increased rapidly, which is
consistent with the fast increase in the penetration rate among old people mentioned above.
13% 14% 12%22%
13% 15% 14% 14%10%
8%12% 16%
30%
20%13%
23% 20%21%
38%39% 34%
27%
38%
37%
34%34% 45%
34%27% 32%
19%26%
22%
24%
20%
21%
7% 8% 6% 3% 3%
14%
4%12%
4%
0%
10%
20%
30%
40%
50%
60%
70%
80%
90%
100%
2000 2001 2002 2003 2004 2005 2006 2007 2008
Data Source: HK Internet Project 2000-2008 (http://newmedia.cityu.edu.hk/hkip)
Self-employed/others
Managerial and
professional/Civil Servants
Worker/Shop assistant
Retired/Unemployed
Students

Internet Use in Hong Kong (Jan. 2009)
11
.Figure 12. Penetration Rate of Internet Use by Occupation
6.Household income: as shown in the first row of Table 7.
Table 7. Household Income and Internet Use
<HK$10K HK$10~
20K
HK$20~
30K
HK$30~
40K >HK$40K
Composition
of the Users 9% 29% 25% 14% 23%
Penetration
Rate in the
Population
32% 68% 82% 88% 94%
Figure 13 shows the distribution of monthly household income of Internet users in Hong
Kong from 2000 to 2008.
0%
10%
20%
30%
40%
50%
60%
70%
80%
90%
100%
2004 2005 2006 2007 2008
Data Source: HK Internet Project 2000-2008 (http://newmedia.cityu.edu.hk/hkip)
Students
Managerial and
professional/Civil
Servants
Self-employed/others
Worker/Shop assistant
Retired/Unemployed
Internet Use in Hong Kong (Jan. 2009)
12
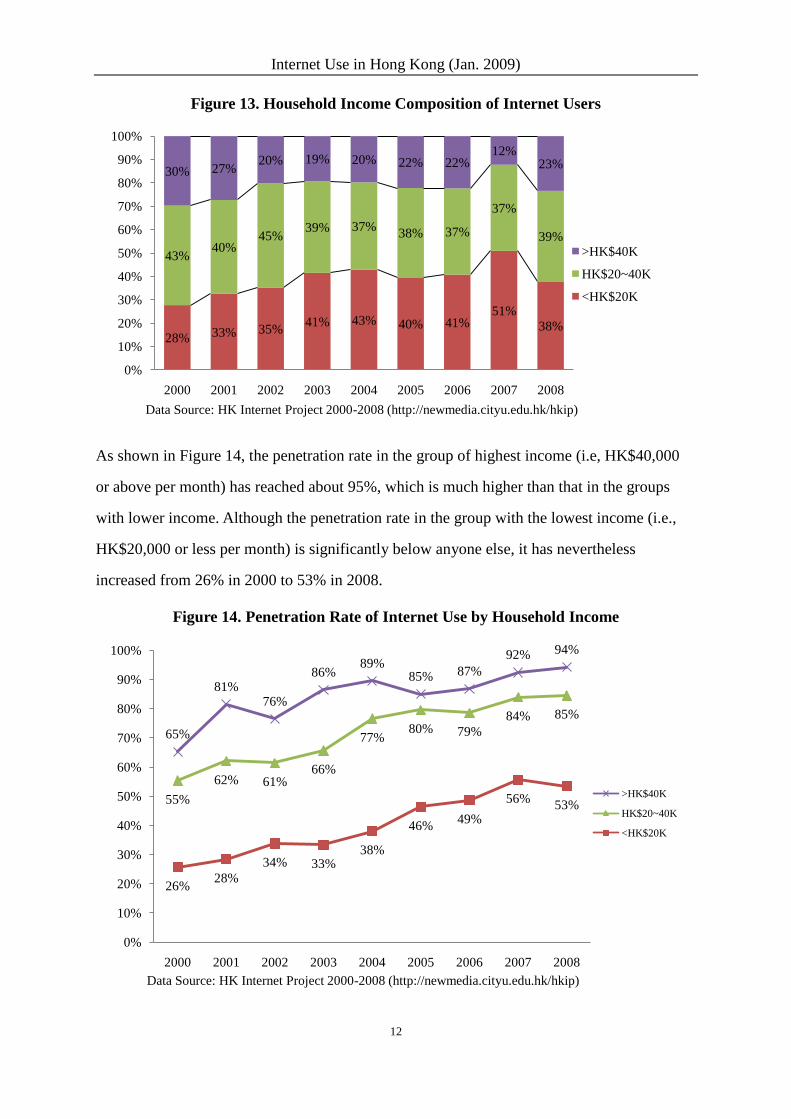
Figure 13. Household Income Composition of Internet Users
As shown in Figure 14, the penetration rate in the group of highest income (i.e, HK$40,000
or above per month) has reached about 95%, which is much higher than that in the groups
with lower income. Although the penetration rate in the group with the lowest income (i.e.,
HK$20,000 or less per month) is significantly below anyone else, it has nevertheless
increased from 26% in 2000 to 53% in 2008.
Figure 14. Penetration Rate of Internet Use by Household Income
28% 33% 35%41% 43% 40% 41%
51%
38%
43%40%
45%39% 37%
38% 37%
37%
39%
30% 27%20% 19% 20% 22% 22%
12%23%
0%
10%
20%
30%
40%
50%
60%
70%
80%
90%
100%
2000 2001 2002 2003 2004 2005 2006 2007 2008
Data Source: HK Internet Project 2000-2008 (http://newmedia.cityu.edu.hk/hkip)
>HK$40K
HK$20~40K
<HK$20K
65%
81%76%
86%89%
85% 87%
92% 94%
55%
62% 61%66%
77%80% 79%
84% 85%
26%28%
34% 33%38%
46%49%
56%53%
0%
10%
20%
30%
40%
50%
60%
70%
80%
90%
100%
2000 2001 2002 2003 2004 2005 2006 2007 2008
Data Source: HK Internet Project 2000-2008 (http://newmedia.cityu.edu.hk/hkip)
>HK$40K
HK$20~40K
<HK$20K
Internet Use in Hong Kong (Jan. 2009)
13
2.2 Internet Usage and Online Behavior
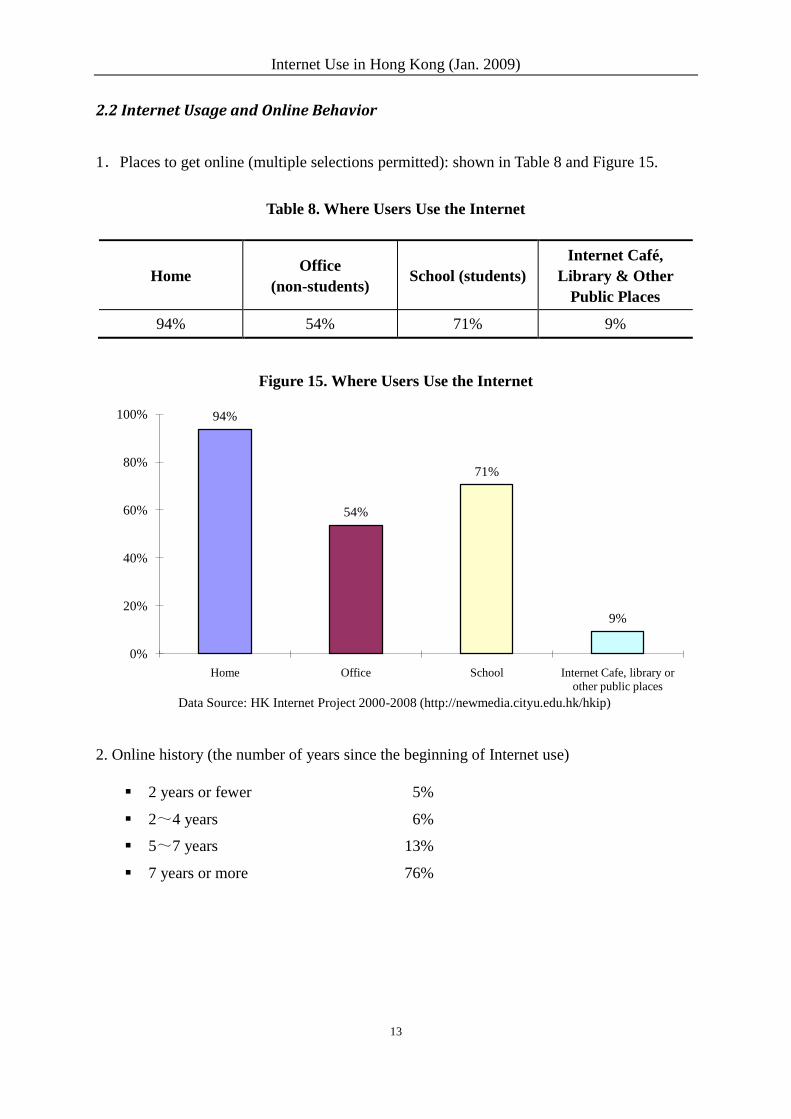
1.Places to get online (multiple selections permitted): shown in Table 8 and Figure 15.
Table 8. Where Users Use the Internet
Home Office
(non-students) School (students)
Internet Café,
Library & Other
Public Places
94% 54% 71% 9%
Figure 15. Where Users Use the Internet
2. Online history (the number of years since the beginning of Internet use)
2 years or fewer 5%
2~4 years 6%
5~7 years 13%
7 years or more 76%
94%
54%
71%
9%
0%
20%
40%
60%
80%
100%
Home Office School Internet Cafe, library or
other public places
Data Source: HK Internet Project 2000-2008 (http://newmedia.cityu.edu.hk/hkip)
Internet Use in Hong Kong (Jan. 2009)
14
3. Methods of Internet connection (multiple selections permitted):
2007 2008
Telephone dialup 9% 6%
Broadband 76% 82%
Cable Modem 8% 14%
Wireless (including WLAN, GPRS, WAP, EDGE, 3G, and
HSDPA) 20% 22%
Don’t know 5% 5%
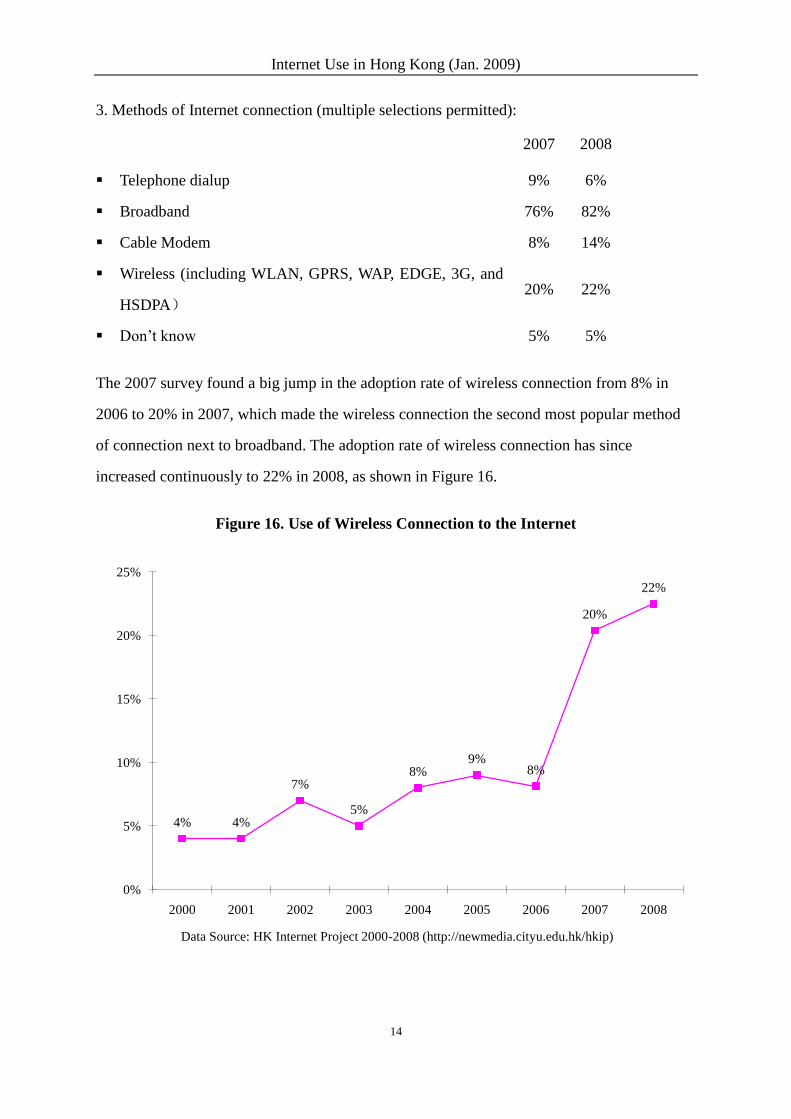
The 2007 survey found a big jump in the adoption rate of wireless connection from 8% in
2006 to 20% in 2007, which made the wireless connection the second most popular method
of connection next to broadband. The adoption rate of wireless connection has since
increased continuously to 22% in 2008, as shown in Figure 16.
Figure 16. Use of Wireless Connection to the Internet
4% 4%
7%
5%
8%9%
8%
20%
22%
0%
5%
10%
15%
20%
25%
2000 2001 2002 2003 2004 2005 2006 2007 2008
Data Source: HK Internet Project 2000-2008 (http://newmedia.cityu.edu.hk/hkip)

Internet Use in Hong Kong (Jan. 2009)
15
4.Devices for Internet connection (multiple selections permitted):
2007 2008
Desktop PC 91% 92%
Notebook PC 28% 37%
Mobile Phone 6% 10%
PDA 6% 5%
TV or other appliances 0% 0.2%
Other devices 0% 0.4%
As shown in Figure17, the rate of using desktop PCs to get online has remained at 90% in
2007 and 2008. The use of PDAs has also remained unchanged (at about 5%). The use of
notebook computers has substantially increased from 14% in 2006 to 28% in 2007 and 37%
in 2008, whereas the use of mobile phones has also grown from 6% in 2006 and 2007 to 10%
in 2008.
Figure 17. Devices Used to Get Online
91%
28%
6% 6%
0% 0%
92%
37%
10%5%
0.2% 0.4%
0%
20%
40%
60%
80%
100%
Desktop PC Notebook PC Mobile Phone PDA TV or other
appliances
other devices
Data Source: HK Internet Project 2000~2008 (http://newmedia.cityu.edu.hk/hkip)
2007 2008

Internet Use in Hong Kong (Jan. 2009)
16
5.Average number of hours on Internet use per week: 19 hours per user
6.Time of the day using the Internet (multiple selections permitted):
Table 9. Daily Cycle of Online Activities
1:00 2:00 3:00 4:00 5:00 6:00
9% 6% 2% 1% 1% 0%
7:00 8:00 9:00 10:00 11:00 12:00
1% 1% 3% 22% 29% 27%
13:00 14:00 15:00 16:00 17:00 18:00
22% 16% 27% 30% 25% 20%
19:00 20:00 21:00 22:00 23:00 24:00
15% 19% 37% 48% 42% 28%
As shown in Figure 18, the peak hours in the morning and the afternoon in 2008 have been
moved one hour later as compared with those in 2007, whereas the peak hours during the
evening in 2008 are almost the same as those in 2007.
Figure 18. Time Distribution of Internet Use in the 24-hour Cycle
0%
10%
20%
30%
40%
50%
1 2 3 4 5 6 7 8 9 10 11 12 13 14 15 16 17 18 19 20 21 22 23 24
Data Sources: HK Internet Project 2000-2008 (http://newmedia.cityu.edu.hk/hkip)
20072008

Internet Use in Hong Kong (Jan. 2009)
17
7.Primary purposes for Internet use (multiple selections permitted):
Information acquisition (e.g., search and web browsing) 85%
Leisure and entertainment 36%
Communication (e.g., e-mail, IM, SMS, chat, etc.) 31%
Study 9%
Online banking, trading, payment, etc. 10%
Getting free resources (e.g., free e-mail accounts, storage, downloads) 6%
Making friends (e.g., alumni sites) 1%
Online shopping 5%
Others 3%
8.Average time spent on websites in different languages:
Chinese websites in Hong Kong: 60%
Non-Chinese websites in Hong Kong: 7%
Chinese websites overseas: 16%
Non-Chinese websites overseas: 17%
The share has remained stable across nine years, as shown in Figure 19. Local websites in
Chinese are the first choice (60%). Overseas websites in both Chinese and non-Chinese are
the second choices (each accounts for about one-sixth), whereas local websites in
non-Chinese language account for the least share (less than 10%).
Figure 19. Online Time by Website of Different Languages
18% 17% 17% 15% 17% 17% 16%
20% 20% 16%15%
18% 20% 17%
50% 54% 58% 64% 56% 57% 60%
12% 9% 9% 6% 9% 10% 7%
0%
20%
40%
60%
80%
100%
2002 2003 2004 2005 2006 2007 2008
Data Source: HK Internet Project 2000-2008 (http://newmedia.cityu.edu.hk/hkip)
Non-Chinese sites
in HK
Chinese sites in
HK
Chinese sites
Overseas
Non-Chinese sites
Overseas

Internet Use in Hong Kong (Jan. 2009)
18
2.3. Nonusers of Internet in Hong Kong
1.Reasons for not using the Internet (multiple selections permitted):
Lack of Online Skills (total 63.2%)
Don’t know how to use/Fear of or confused by Internet
technology 53.4%
Language problem/Don’t know English 9.8%
Lack of Facilities or Resources (total 18.9%)
No computer/phone line, or computer without modem, or
computer not good enough 14.8%
Too expensive 3.6%
Transmission speed too slow 0.3%
Frequent interruption, busy signals, difficult to login 0.2%
Lack of Time or Interest (total 37.0%)
Feel the Internet useless/no such need 14.4%
No interest 12.9%
Too busy to have time 9.7%
Too scarce of useful websites/information 0.0%
Other Reasons (total 23.0%)
Too old/young, health problems 10.9%
Other difficulties 3.4%
No particular difficulty 3.4%
Don’t know 3.4%
Concerns about online security 1.1%
Worry about bad influences on children 0.6%
Concerns about breach of privacy 0.2%
Too many viruses 0.0%
As shown in Figure 20, lack of online skills has become the primary obstacle for nonusers to
adopt the Internet in recent years.

Internet Use in Hong Kong (Jan. 2009)
19
Figure 20 Obstacles for Nonusers to Use the Internet
2. As shown in Figure 21, the proportion of the adult population (18-74) in Hong Kong being
Internet users has grown from 40% in 2000 to 45% in 2001, 49% in 2002, 53% in 2003, 54%
in 2004, 60% in 2005, 63% in 2006, 67% in 2007 and 69% in 2008, at the annual growth rate
of 7.0%. Meanwhile, the proportion being nonusers has declined from 60% in 2000 to 55% in
2001, 51% in 2002, 47% in 2003, 46% in 2004, 40% in 2005, 37% in 2006, 33% in 2007 and
31% in 2008, at the annual reduction rate of 7.8%.
Figure 21. Rise of Users and Fall of Nonusers from 2000-2008
0%
10%
20%
30%
40%
50%
60%
70%
2000 2001 2002 2003 2004 2005 2006 2007 2008
Data Source: HK Internet Project 2000-2008 (http://newmedia.cityu.edu.hk)
Lack of Online Skills
Lack of
Facilities/ResourcesLack of Time/Interest
Other Reasons
40%45% 49% 53% 54%
60% 63% 67% 69%
60%55% 51% 47% 46%
40% 37% 33% 31%
0%
20%
40%
60%
80%
100%
2000 2001 2002 2003 2004 2005 2006 2007 2008
Data Source: HK Internet Project 2000-2008 (http://newmedia.cityu.edu.hk/hkip)
Nonusers
Users

Internet Use in Hong Kong (Jan. 2009)
20
2.4 Perceptions of the Internet between User and Nonusers
1.Do you trust the Internet (shown in Table 10).
Table 10. Trust in the Internet between Users and Nonusers
Users Nonusers Total
Fully distrust 0.4% 7% 3%
Partially distrust 10% 8% 9%
Half trust, Half distrust 41% 26% 35%
Partially trust 40% 17% 31%
Full trust 6% 5% 5%
Don’t know/hard to say 3% 37% 16%
As shown in Figure 22, Internet users are more positive about the Internet than are the
nonusers because the proportions holding a modest degree of trust in the Internet (“Partially
trust” and “Half trust and half distrust”) are significantly larger among the users than those
among nonusers.
Figure 22. Trust in the Internet between Uses and Nonusers
0%
10%
41%40%
6%
3%
7% 8%
26%
17%
5%
37%
0%
10%
20%
30%
40%
50%
Fully distrust Partially distrust Half trust, half
distrust
Partially distrust Full trust Don’t know/hard
to say
Data Source: HK Internet Project 2000-2008 (http://newmedia.cityu.edu.hk/hkip)
Users Nonusers

Internet Use in Hong Kong (Jan. 2009)
21
2. Importance of the Internet in life, work or study (shown in Table 11):
Table 11. Perceived Importance of the Internet between Users and Nonusers
Users Nonusers Total
Highly important 38% 5% 25%
Partially important 39% 13% 29%
Half important, Half
unimportant 17% 28% 21%
Partially unimportant 5% 20% 11%
Highly unimportant 0% 19% 7%
Don’t know/Hard to say 0% 15% 6%
As shown in Figure 23, in comparison with Internet nonusers, most Internet users agree that
Internet is important to their life and work or study, whereas the percentage of nonusers who
regard Internet not important is much higher than that of Internet users.
Figure 23. Perceived Importance of the Internet between Users and Nonusers
0%
10%
20%
30%
40%
50%
60%
70%
80%
2004 2005 2006 2007 2008
Data Source: HK Internet Project 2000-2008 (http:newmedia.cityu.edu.hk/hkip)
Users
Nonusers

Internet Use in Hong Kong (Jan. 2009)
22
PART III. SURVEY METHODOLOGY
1. Study Population
The target populations for the current study is those regular residents between 18 and 74
years old who speak Chinese (including Cantonese, Putonghua and other dialects) and live in
Hong Kong with a residential phone line. This definition follows World Internet Project (WIP)
practice and had been used continuously in our annual surveys from 2000 to 2007. The
results can be compared with our previous surveys in 2000-2007.
2. Sampling Method
Sample Size: 1,461 residents were successfully interviewed in the survey, resulting in a
sample size comparable to each provincial sample in the corresponding survey by CNNIC.
The sample size gives a sampling error of 2.6% at the 95% confidence level.
Sampling Procedure: As in the eight previous surveys, random digital dialing (RDD)
method was used to generate the sample. First, over 10,000 telephone numbers were
randomly created by a computerized program. Those numbers were contacted. When proven
to be a residential number, a person between 18 and 74, speaking Chinese, regularly living
the residence, with the last birthday among other qualified members, was selected for
interview. The same phone number/individual was called back up to five times at different
times of different days if no one was at the contacted telephone number, the chosen individual
was not at home or unavailable for interview.
Survey Response Rate: Calculated by Response Rate Formulae 3 (RR3) of the American
Association for Public Opinion Research (AAPOR), the response rate of the current survey is
29.4%, which is approximate to the previous surveys in 2000-2006 (i.e., 38%、35%、36%、
33%, 41%, 33% and 30%, respectively), and higher than that in 2007 (23%).
Weighting Method: Before analyzed, the data were weighted against Hong Kong Population
Census Estimates, June 2008, in terms of cross-distribution of age and sex. Consequently, the
distribution of sex and age of the current sample resembles that of the population.
Data Cleaning: The report above contains several average numbers, such as the average
online time per user. As widely known, average numbers are vulnerable to extremely large
or small values in the data. We have therefore followed the customary practice in data

Internet Use in Hong Kong (Jan. 2009)
23
processing: excluding extreme values (defined as larger than 3 standard deviations from the
mean in either direction). Averages calculated from the adjusted data are generally about 10%
smaller than the averages of the original data.