internet initiative japan inc . corporate overview … · september 7, 2015 . tse1:3774 nasdaq:iiji...
TRANSCRIPT

September 7, 2015 TSE1:3774 NASDAQ:IIJI
Internet Initiative Japan Inc. Corporate Overview
Mizuho Investment Conference 2015 in Tokyo
2
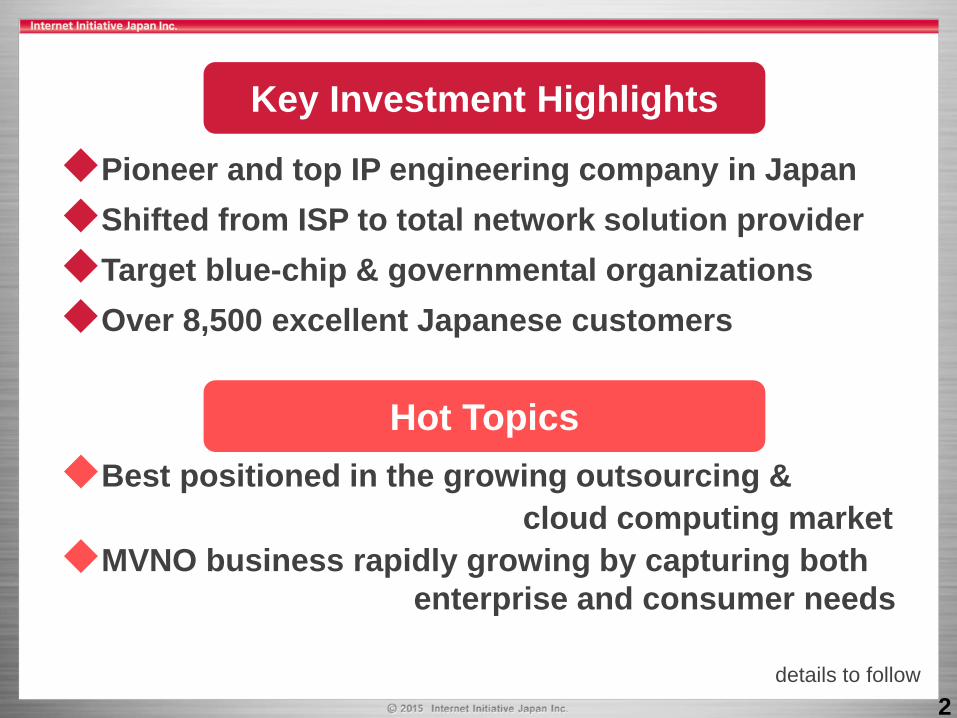
Key Investment Highlights
Pioneer and top IP engineering company in Japan Shifted from ISP to total network solution provider Target blue-chip & governmental organizations Over 8,500 excellent Japanese customers
details to follow
Best positioned in the growing outsourcing & cloud computing market MVNO business rapidly growing by capturing both
enterprise and consumer needs
Hot Topics
3
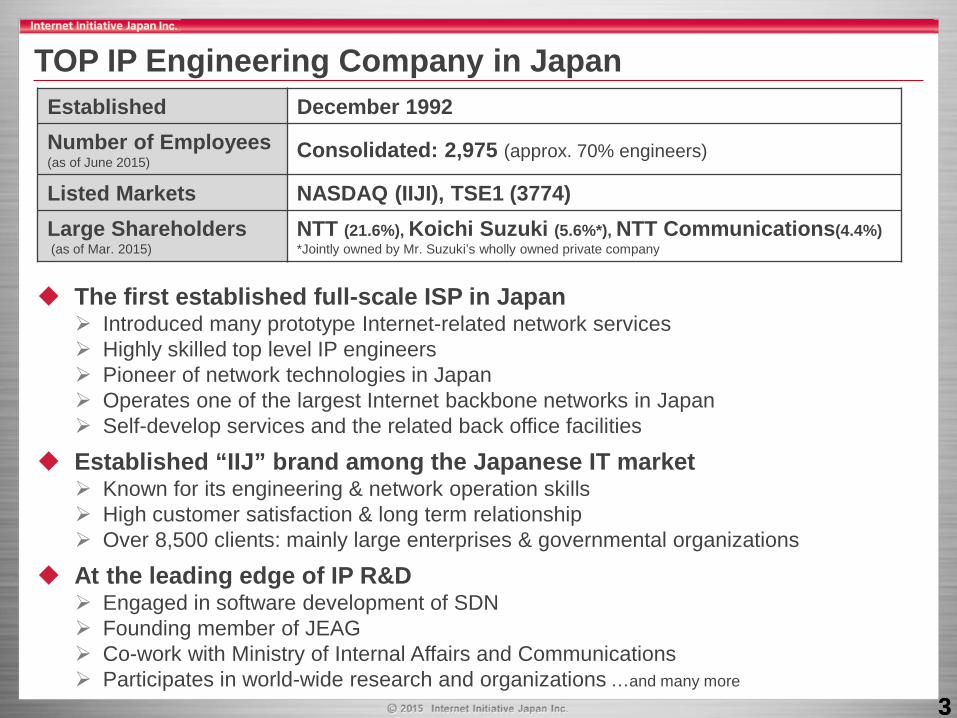
The first established full-scale ISP in Japan Introduced many prototype Internet-related network services Highly skilled top level IP engineers Pioneer of network technologies in Japan Operates one of the largest Internet backbone networks in Japan Self-develop services and the related back office facilities
Established “IIJ” brand among the Japanese IT market Known for its engineering & network operation skills High customer satisfaction & long term relationship Over 8,500 clients: mainly large enterprises & governmental organizations
At the leading edge of IP R&D Engaged in software development of SDN Founding member of JEAG Co-work with Ministry of Internal Affairs and Communications Participates in world-wide research and organizations …and many more
TOP IP Engineering Company in Japan
3
Established December 1992 Number of Employees (as of June 2015)
Consolidated: 2,975 (approx. 70% engineers)
Listed Markets NASDAQ (IIJI), TSE1 (3774) Large Shareholders (as of Mar. 2015)
NTT (21.6%), Koichi Suzuki (5.6%*), NTT Communications(4.4%) *Jointly owned by Mr. Suzuki’s wholly owned private company
4 4
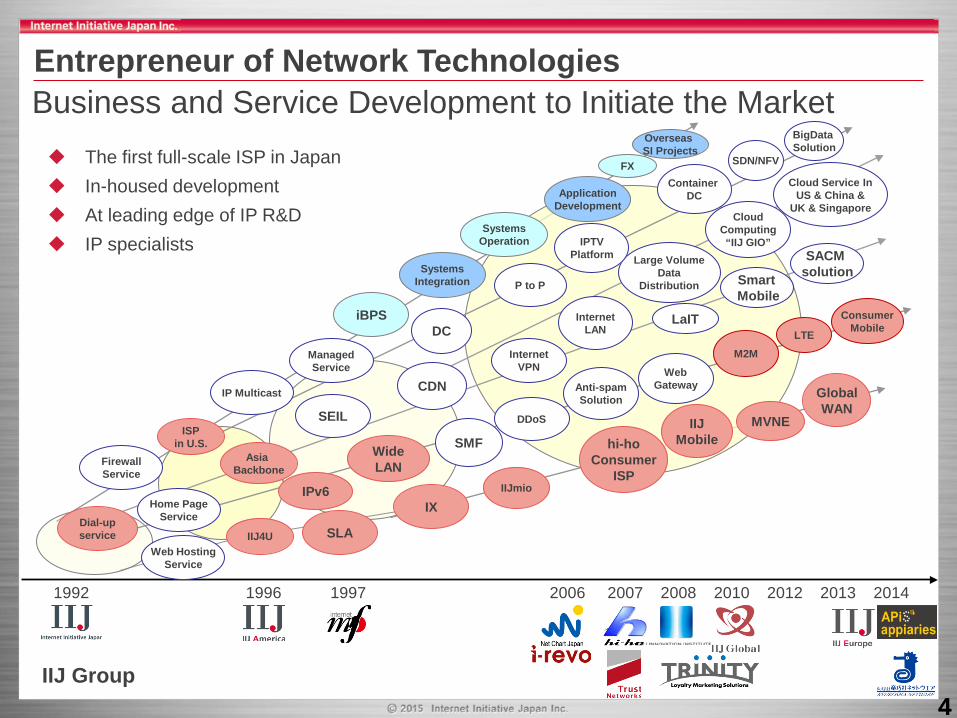
Entrepreneur of Network Technologies Business and Service Development to Initiate the Market
IIJ Group
Dial-up service
Internet VPN
IP Multicast
SMF
Anti-spam Solution
Managed Service
IPv6
Firewall Service
CDN
SEIL
P to P
Large Volume Data
Distribution
Asia Backbone
SLA
IX
ISP in U.S. hi-ho
Consumer ISP
IIJ4U
IIJmio
DC
Wide LAN
IIJ Mobile
iBPS
Systems Operation
Systems Integration
Application Development
IPTV Platform
Cloud Computing “IIJ GIO”
LaIT
DDoS
Home Page Service
Web Hosting Service
The first full-scale ISP in Japan In-housed development At leading edge of IP R&D IP specialists
Web Gateway
M2M
Internet LAN
FX
MVNE
Smart Mobile
Global WAN
Container DC
Cloud Service In US & China &
UK & Singapore
LTE
Overseas SI Projects
SDN/NFV
1992 1996 1997 2006 2007 2008 2010 2012 2013 2014
Consumer Mobile
SACM solution
BigData Solution

5 5
Strategic Shift in Business Model
Merger of corporate ISPs
Heavy price competition
CWC filed for Chapter 7
Rise in needs for Cloud /Outsourcing
Increase in number of ISPs
Total Network Solution Provider
BLOOM Harvesting the flower of
EMERGE Cloud Computing
WAN Business (M&A Sep. 2010)
Revenue (JPY million)
5
Listed on TSE
Birth Earned its enduring
client base
Transition Change in
business model
NASDAQ IPO
Recurring Revenue
One-time Revenue
From “ISP” to “Total Network Solution Provider”
Network Services:
Systems Integration:
Internet connectivity services Outsourcing services
Systems construction
Systems operation and maintenance
WAN services
FY14 revenue JPY123.1billion

6
Business Model: Cross-selling of Network Solutions Systems
Construction
Outsourcing & Systems
Operation
Over 8,500 Client Base
• Dedicated line connectivity IP service (cover over Gbps) IPv6 service
• Broadband connectivity Optical Fiber/ADSL
• Mobile connectivity (IIJ Mobile) LTE/3G
• WAN services Wide area Ethernet/VPN Global WAN
Outsourcing services include: • Security-related services (managed-FW and IPS, DDoS protection, URL filtering, anti-spam etc.) • Data center-related services (housing, facility management and operation) • Server-related services (E-mail services, web hosting, online storage, CDN etc.) • Network-related services (network management and monitoring, VPN, SEIL, SMF etc.) • IIJ GIO Hosting Package Services (15% of 1Q15 Cloud-related revenues)
Systems operation includes: • Operation and maintenance of a system constructed in Systems Construction • IIJ GIO Component Services (85% of 1Q15 Cloud-related revenues)
6
e.g. Large scale EC system,
Disaster recovery system, Security gateway system etc.
Number of Customers
Increase revenues per customer
Revenues by Customer
Internet Connectivity & WAN
7 7
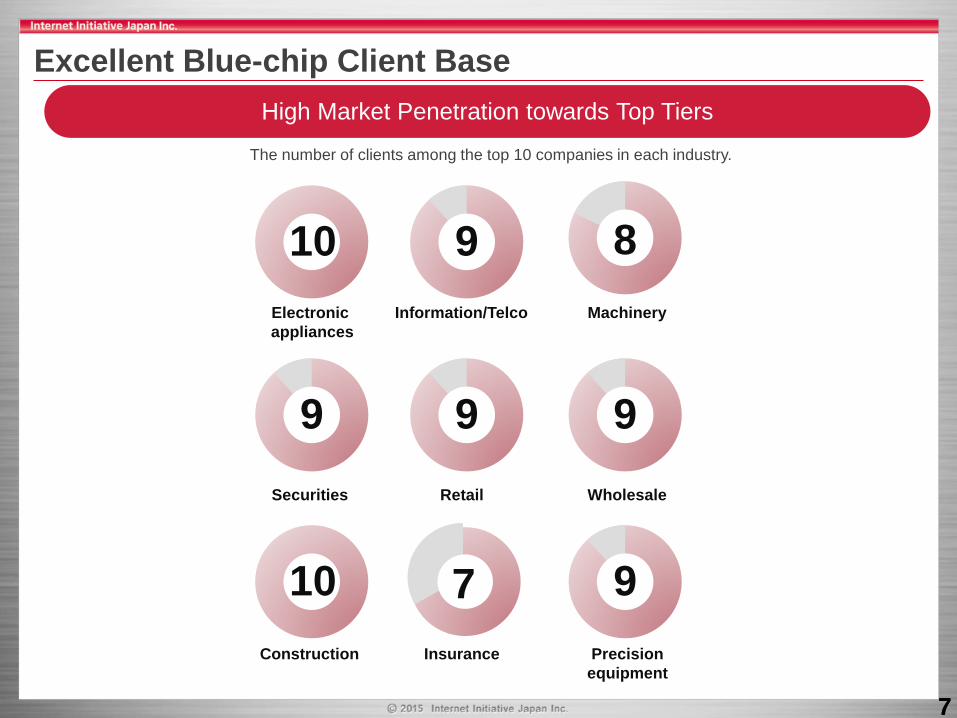
Excellent Blue-chip Client Base
The number of clients among the top 10 companies in each industry.
High Market Penetration towards Top Tiers
10 Electronic
appliances Information/Telco Machinery
Securities Retail Wholesale
Construction Insurance Precision equipment
9
9 9 9
8
10 9 7
8 8
Revenue Composition by Clients
Largest customer’s revenue is less than 3% of the total revenue Much room to increase revenue per customer
Revenue Distribution by Industry Revenue Distribution by Clients
Source: IIJ’s FY2014 financial results

9 9
Competitive Advantages IIJ can offer NW, Cloud, SI, and MVNO all at once
Systems Integrators Carriers Internet Connectivity Services
Outsourcing Services WAN Services
Network Integration Systems Operation
Private Cloud
Telephone Legacy Network Services
Mainframe Legacy Systems Operation
IIJ… has many highly skilled network engineers corresponds to the Internet market rapidly focuses on enterprises has an established brand among blue-chips has flat organization structure
IIJ… operates its own backbone network develops network services in-housed targets new IT market, not legacy SI
has long and rich experience in server operation has moderate number of employees
Cloud Computing Services
9
10 10
Private Cloud Market Growth in Japan
IIJ GIO’s Competitive Advantages
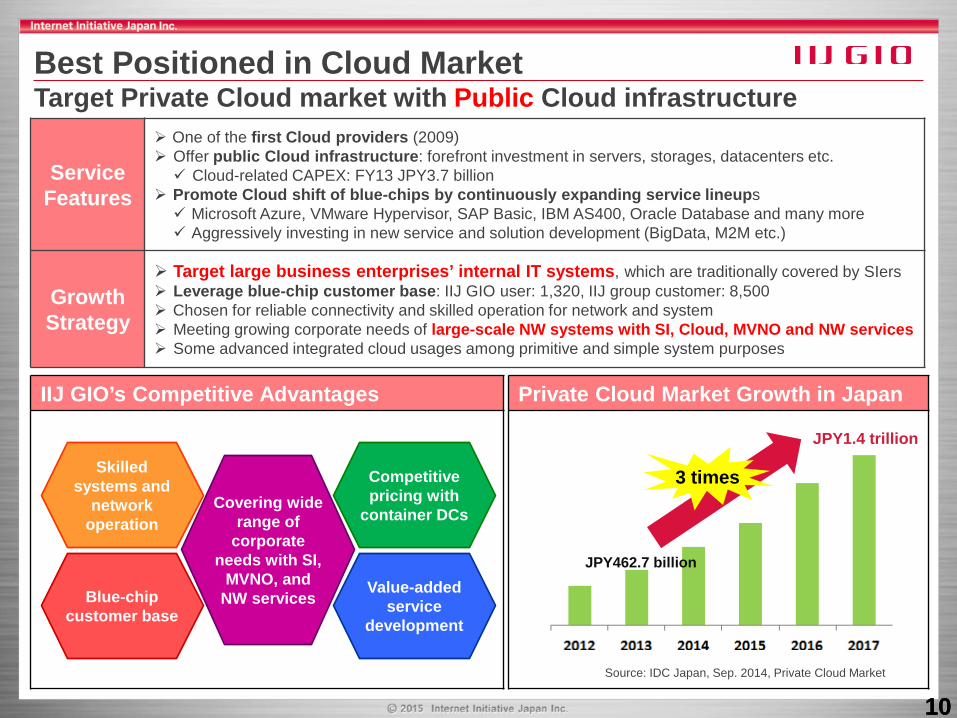
Best Positioned in Cloud Market Target Private Cloud market with Public Cloud infrastructure
JPY462.7 billion
Service Features
One of the first Cloud providers (2009) Offer public Cloud infrastructure: forefront investment in servers, storages, datacenters etc. Cloud-related CAPEX: FY13 JPY3.7 billion
Promote Cloud shift of blue-chips by continuously expanding service lineups Microsoft Azure, VMware Hypervisor, SAP Basic, IBM AS400, Oracle Database and many more Aggressively investing in new service and solution development (BigData, M2M etc.)
Growth Strategy
Target large business enterprises’ internal IT systems, which are traditionally covered by SIers Leverage blue-chip customer base: IIJ GIO user: 1,320, IIJ group customer: 8,500 Chosen for reliable connectivity and skilled operation for network and system Meeting growing corporate needs of large-scale NW systems with SI, Cloud, MVNO and NW services Some advanced integrated cloud usages among primitive and simple system purposes
JPY1.4 trillion
3 times
Source: IDC Japan, Sep. 2014, Private Cloud Market
Competitive pricing with
container DCs
Skilled systems and
network operation
Value-added service
development
Covering wide range of
corporate needs with SI,
MVNO, and NW services Blue-chip
customer base
11 11
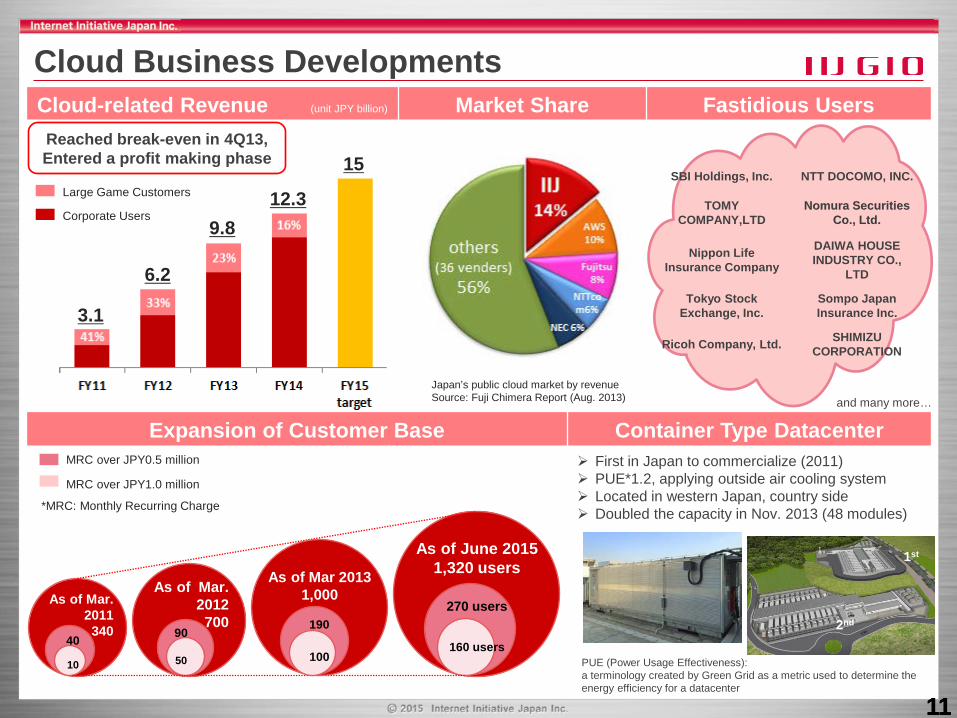
Cloud-related Revenue (unit JPY billion) Market Share Fastidious Users
Expansion of Customer Base Container Type Datacenter
First in Japan to commercialize (2011) PUE*1.2, applying outside air cooling system Located in western Japan, country side Doubled the capacity in Nov. 2013 (48 modules)
Cloud Business Developments
11
MRC over JPY0.5 million
MRC over JPY1.0 million
*MRC: Monthly Recurring Charge
Reached break-even in 4Q13, Entered a profit making phase
As of Mar. 2012 700
50
As of June 2015 1,320 users
270 users
160 users
As of Mar. 2011 340
10
As of Mar 2013 1,000
90 190
40 100
Japan’s public cloud market by revenue Source: Fuji Chimera Report (Aug. 2013)
1st
2nd
PUE (Power Usage Effectiveness): a terminology created by Green Grid as a metric used to determine the energy efficiency for a datacenter
3.1
6.2
9.8
Large Game Customers
Corporate Users 12.3
15
and many more…
SBI Holdings, Inc. NTT DOCOMO, INC.
TOMY COMPANY,LTD
Nomura Securities Co., Ltd.
Nippon Life Insurance Company
DAIWA HOUSE INDUSTRY CO.,
LTD
Tokyo Stock Exchange, Inc.
Sompo Japan Insurance Inc.
Ricoh Company, Ltd. SHIMIZU CORPORATION

12
MVNO Business
12
MVNOs
Sales channel
Consumer
Government Promotion Business Strategy Ministry of Internal Affairs and Communications is making efforts to create competition in the mobile phone industry of Japan. Mandated mobile carriers to remove SIM-lock on their
cellphones so that consumers can have more options when choosing smart phones
Backing up MVNOs through discussion with related parties
Improve MVNO infrastructure efficiency with enterprise & consumer traffic • 1st MVNO to use NTT Docomo’s network (2008) • 1st MVNO to offer LTE connectivity (2012) • Best positioned to meet corporate MVNO demands
1) large-scale MVNO infrastructure (constructed in 2008) 2) one of the largest internet backbone networks 3) various network services 4) offer MVNO, SI, and Cloud, NW all at once
CATV Toyama
Tochigi CATV
and many more
Ehime CATV
Enterprise
and many more
IIJ’s MVNO Platform (NTT Docomo’s mobile network)
M2M
and many more MVNO platform service
(MVNE business)
Dire
ct O
nlin
e Sa
les
BigData Cloud SI Security
13
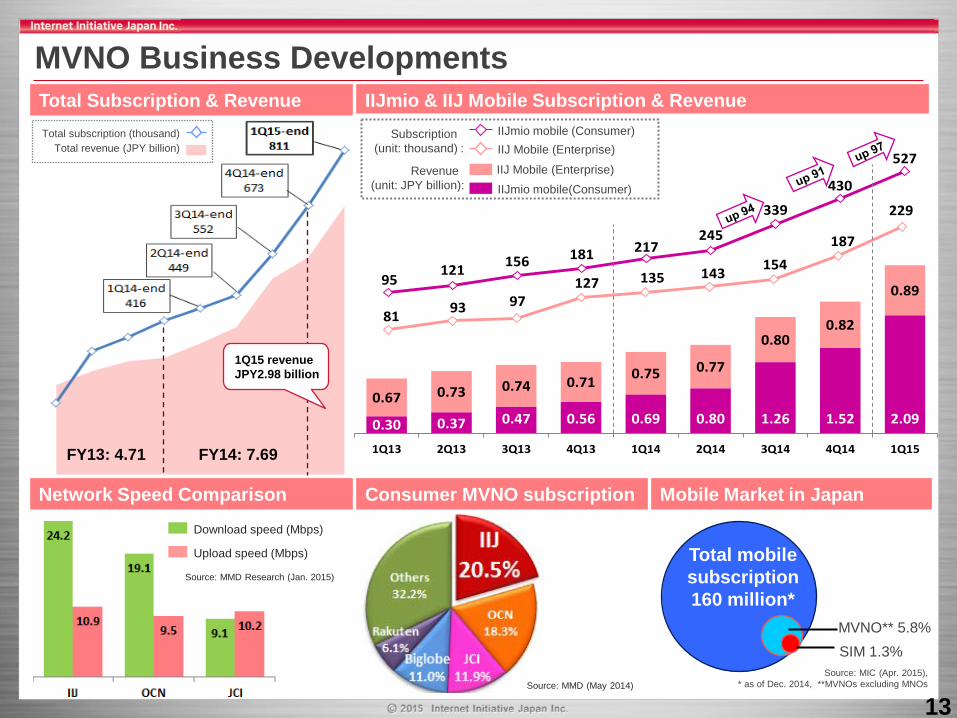
IIJmio & IIJ Mobile Subscription & Revenue Total Subscription & Revenue
MVNO Business Developments
FY13: 4.71 FY14: 7.69
Source: MMD Research (Jan. 2015)
Source: MMD (May 2014)
Download speed (Mbps)
Upload speed (Mbps)
Source: MIC (Apr. 2015), * as of Dec. 2014, **MVNOs excluding MNOs
IIJmio mobile (Consumer) IIJ Mobile (Enterprise)
IIJmio mobile(Consumer)
Subscription (unit: thousand) :
Revenue (unit: JPY billion):
Total subscription (thousand) Total revenue (JPY billion)
IIJ Mobile (Enterprise)
1Q15 revenue JPY2.98 billion
0.30 0.37 0.47 0.56 0.69 0.80 1.26 1.52 2.090.67 0.73 0.74 0.71 0.75 0.77
0.800.82
0.89
1Q13 2Q13 3Q13 4Q13 1Q14 2Q14 3Q14 4Q14 1Q15
95121 156 181 217
245
339
430
527
81 93 97127 135 143 154
187
229
Network Speed Comparison Consumer MVNO subscription Mobile Market in Japan
MVNO** 5.8% SIM 1.3%
Total mobile subscription 160 million*
14
Overseas Business Developments
14
Business Developments Requests to support build Cloud infrastructure from Asian countries
• Jointly provide Cloud services with a local carrier in Indonesia (Mar. 2015) Export container DCs to Laos and Russia,
Expect transactions to expand in the middle-to-long term • Accumulating similar prospective orders from other emerging countries
Enhance network infrastructure including an expansion of Internet backbone Overseas Cloud business developments
• Enhanced Cloud service lineups for Europe, Providing VMware hypervisor services (Oct. 2014)
• Launched Cloud services in Singapore (June 2014)
Overseas offices Financial Results (Unit: JPY billion)
Deficit
Revenue Main subsidiaries Est. Employees Business
IIJ America Inc. 1996 39 Provide mainly ISP services , Cloud services and SI to the Japanese companies in the U.S.A.
IIJ Europe Limited 2012*1 54*2 Provide mainly SI and Cloud services to the Japanese companies in Europe
IIJ Global Solutions China Inc. 2012 18 Provide mainly SI and Cloud services
in China
IIJ Global Solutions Singapore Pte. Ltd. 2012*1 18
Provide mainly SI and Cloud services to local and Japanese companies in Singapore
Pt. IIJ Global Solutions Indonesia 2015 - Provide Cloud-related services
operation in Indonesia
Game customers’ revenue FY13 FY14
JPY1.38 billion JPY0.50 billion *1 Became our subsidiaries *2 Includes IIJ Europe’s subsidiary of IIJ Deutschland GmbH
15
Financial Results
Business Model
ATM Operation Business Developments
< Trust Networks Inc. > • 79.5% subsidiary • Established in July 2007 • Pursue ATM operation business
Similar to “Seven Bank” model, high profitability • Seven Bank: 21,056 ATMs, revenue JPY106.0 billion, profit ratio 32.5% as of March 31, 2015
Placing ATMs in Pachinko parlors in Japan with dominant position • After long discussion, started to place in Kanto, Kansai, Kyushu and Tokai areas
Receive commission for each withdrawal transaction Strong revenue & income driver in mid-term
• Approx.11,900 Pachinko parlors in Japan as of Dec. 2013 (Metropolitan Police Dept.)
15
Number of placed ATMs* 280 440 625 855 1,059
*Number of placed ATMs are as of May each year except for FY14 which is the number as of Mar. 2015
Operating Income Revenue
Unit: JPY billion

16
IIJ Group – The Way Forward
16
Environment
IIJ Position
Action Aggressive business investment leap into the next phase of growth Stronger management structure: CEO Suzuki & COO Katsu Enhancement of human resources: number of employees increased by approx. 10% Further focus on service & solution development (Cloud, mobile, BigData etc.) Overseas business expansion:
• Building stronger relationship with Japanese customers • Seeking growth opportunities outside of Japan
Continuous service facility investment (Doubled container type DC capacity)
Best positioned to capture the growing demand with the combination of NW services, SI expertise, MVNO infrastructure Expertise in operating large Internet backbone network Blue-chip customer base of over 8,500 entities Long history of developing various network services A number of highly skilled engineers Continuously taking initiatives in network technology field
Japanese enterprise systems at a turning point Mainstream adoption of cloud services, outsourcing of corporate IT systems, M2M and IoT usages,
collapse of legacy SI business model etc. Systems becoming larger and requiring Cloud, MVNO, and network services all at once Data traffic explosion: 4K, 8K contents distribution, pervasive usage of smart phones, portable
devises etc.
17
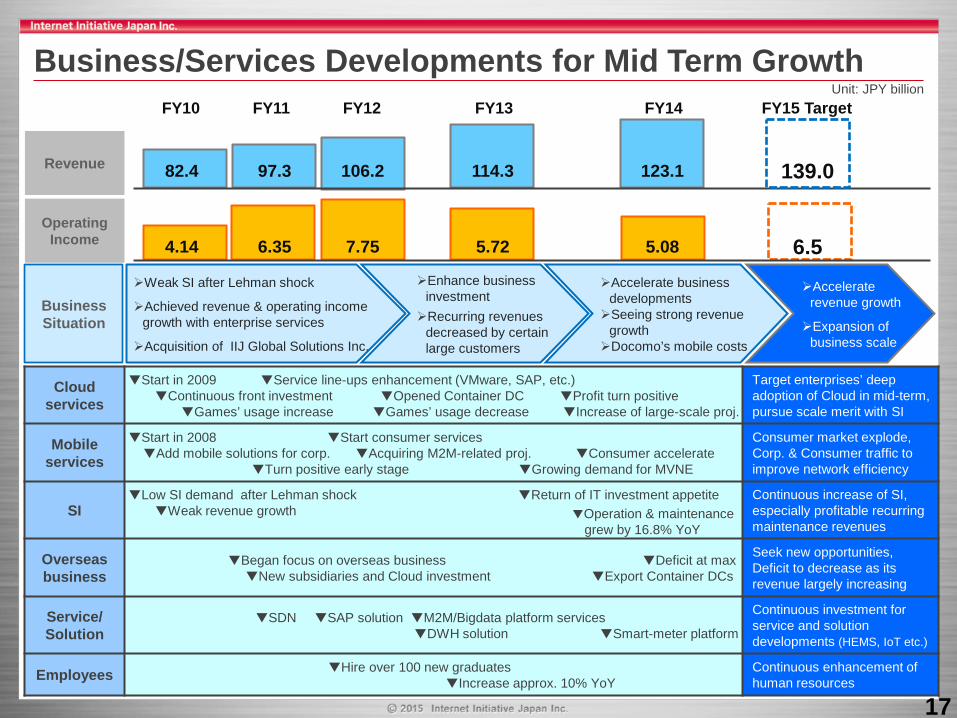
Business/Services Developments for Mid Term Growth
Cloud services
▼Start in 2009 ▼Service line-ups enhancement (VMware, SAP, etc.) ▼Continuous front investment ▼Opened Container DC ▼Profit turn positive ▼Games’ usage increase ▼Games’ usage decrease ▼Increase of large-scale proj.
Target enterprises’ deep adoption of Cloud in mid-term, pursue scale merit with SI
Mobile services
▼Start in 2008 ▼Start consumer services ▼Add mobile solutions for corp. ▼Acquiring M2M-related proj. ▼Consumer accelerate ▼Turn positive early stage ▼Growing demand for MVNE
Consumer market explode, Corp. & Consumer traffic to improve network efficiency
SI ▼Low SI demand after Lehman shock ▼Return of IT investment appetite ▼Weak revenue growth
Continuous increase of SI, especially profitable recurring maintenance revenues
Overseas business
▼Began focus on overseas business ▼Deficit at max ▼New subsidiaries and Cloud investment ▼Export Container DCs
Seek new opportunities, Deficit to decrease as its revenue largely increasing
Service/ Solution
▼SDN ▼SAP solution ▼M2M/Bigdata platform services ▼DWH solution ▼Smart-meter platform
Continuous investment for service and solution developments (HEMS, IoT etc.)
Employees ▼Hire over 100 new graduates ▼Increase approx. 10% YoY
Continuous enhancement of human resources
Revenue
Operating Income
FY10 FY11 FY12 FY13 FY14 FY15 Target
82.4 97.3 106.2 114.3 123.1 139.0
Weak SI after Lehman shock
Achieved revenue & operating income growth with enterprise services
Acquisition of IIJ Global Solutions Inc.
Enhance business investment Recurring revenues
decreased by certain large customers
Accelerate business developments Seeing strong revenue
growth Docomo’s mobile costs
Business Situation
Accelerate revenue growth
Expansion of business scale
4.14 6.35 7.75 5.72 5.08 6.5
Unit: JPY billion
▼Operation & maintenance grew by 16.8% YoY

18
FY2015 Financial Target
Mobile-related services Target over 1 million subscription by Dec. 2015, Target revenue of approx. JPY13 billion for FY2015 (up JPY5.3 billion YoY). Expect a slight decrease in gross margin ratio due to an increase in unprofitable voice service revenues. Expect Docomo’s mobile connectivity charge per bandwidth to decrease by 15% from the charge fixed in Mar. 2015.
Cloud-related services Target revenue of over JPY15 billion (up JPY2.7 billion YoY) by accumulating enterprise needs. Expect gross margin to increase by over JPY0.4 billion along with revenue growth.
Overseas business Target revenue of over JPY6.5 billion (up JPY1.6 billion YoY). Expect margin to increase by approx. JPY0.4 billion with revenue growth.
Enterprise network services Target revenue (excluding Cloud and mobile related) to increase by approx. JPY1.8 billion, considering an enhanced sales activity and expecting no large revenue decrease in WAN services.
SI Target revenue (excluding Cloud and overseas business related) to increase by approx. JPY3.8 billion with strong economy and accumulation of systems operation and maintenance revenue.
SG&A and R&D expenses Expect to increase by approx. JPY1.6 billion which is almost the same amount increased in FY14, expecting the increase in personnel-related costs and sales commission fee etc.。
Human resources Hired 155 new graduates. Plan to hire 160 second-career personnel (including approx. 140 personnel to replace outsourcing resource). Expect personnel-related cost to increase by approx. JPY3.0 billion.
YoY = FY15 target compared to FY14 results
Unit: JPY billion
(Annual) (Annual)
OperatingIncome 6.5 5.1 +1.4 +28.1%
FY15 Target(Apr. 2015-Mar.2016)
FY14 Actual(Apr. 2014-Mar.2015)
YoY(FY15 Target to FY14
Actual)
TotalRevenues 139.0 123.1 +15.9 +13.0%
Net Incomeattributable to IIJ 4.0 3.3 +0.7 +20.4%
Income beforeIncome Tax
Expense6.4 5.1 +1.3 +24.5%
Cash Dividends perShare JPY 22.00 JPY 22.00 - -
Net Incomeattributable to IIJ
per ShareJPY 87.07 JPY 72.31 + JPY 14.76 +20.4%
+13.7%Gross Margin 25.1 22.1 +3.0

19
(YoY) (+JPY1.25) (+JPY1.25) (+JPY1.25) (+JPY2.5) (+JPY2.5) (+JPY2.5) (+JPY3.25) ( - ) ( - )
FY2006 FY2007 FY2008 FY2009 FY2010 FY2011 FY2012 FY2013 FY2014 FY2015
FY2015 Dividend Forecast IIJ conducted a 1:200 stock split on common stock with an effective date of October 1, 2012. Dividend figures shown below are retroactively adjusted to reflect the stock split.
Interim Year-End
JPY7.50 JPY8.75
JPY10.00 JPY11.25
JPY13.75
JPY16.25
JPY18.75
JPY22.00 JPY22.00 JPY22.00 (forecast)
20
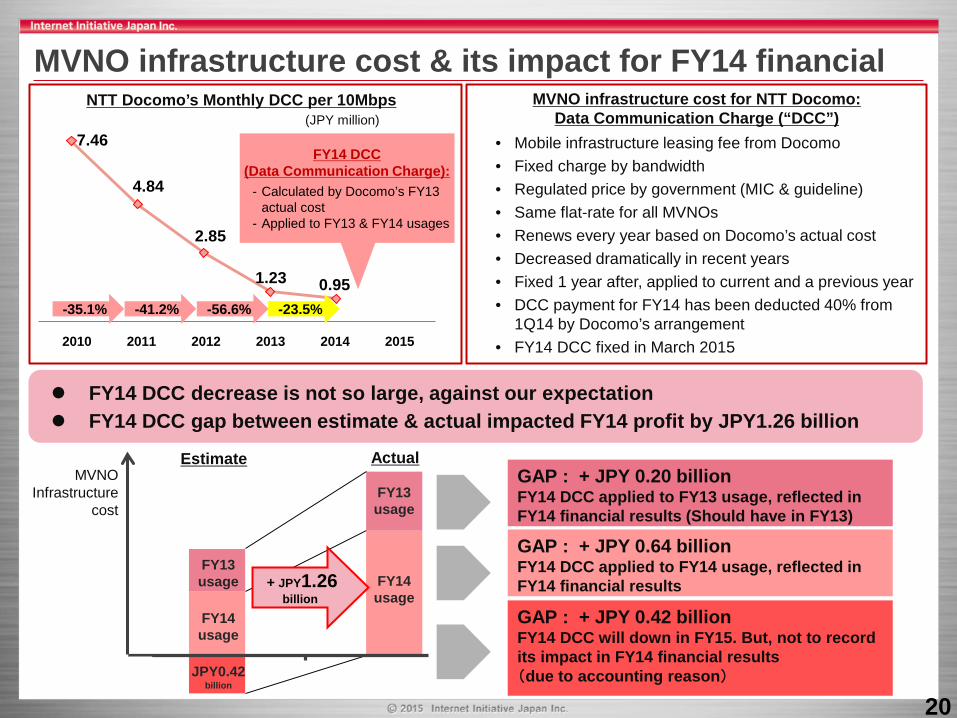
MVNO infrastructure cost for NTT Docomo: Data Communication Charge (“DCC”)
• Mobile infrastructure leasing fee from Docomo • Fixed charge by bandwidth • Regulated price by government (MIC & guideline) • Same flat-rate for all MVNOs • Renews every year based on Docomo’s actual cost • Decreased dramatically in recent years • Fixed 1 year after, applied to current and a previous year • DCC payment for FY14 has been deducted 40% from
1Q14 by Docomo’s arrangement • FY14 DCC fixed in March 2015
7.46
4.84
2.85
1.23 0.95 -41.2% -35.1% -56.6% -23.5%
MVNO infrastructure cost & its impact for FY14 financial NTT Docomo’s Monthly DCC per 10Mbps
(JPY million)
FY14 DCC decrease is not so large, against our expectation FY14 DCC gap between estimate & actual impacted FY14 profit by JPY1.26 billion
FY13 usage
FY13 usage
FY14 usage
FY14 usage
MVNO Infrastructure
cost
JPY0.42 billion
Estimate Actual
+ JPY1.26 billion
2010 2011 2012 2013 2014 2015
FY14 DCC (Data Communication Charge):
- Calculated by Docomo’s FY13 actual cost
- Applied to FY13 & FY14 usages
GAP : + JPY 0.20 billion FY14 DCC applied to FY13 usage, reflected in FY14 financial results (Should have in FY13) GAP : + JPY 0.64 billion FY14 DCC applied to FY14 usage, reflected in FY14 financial results GAP : + JPY 0.42 billion FY14 DCC will down in FY15. But, not to record its impact in FY14 financial results (due to accounting reason)

1Q FY2015 Financial Results Announced on August 7, 2015

22
Ⅰ. Summary of 1Q FY2015 Financial Results %: YoY change < 1Q15 Results> < FY15 Targets >
Revenues JPY31.46 billion up 14.2% JPY139.0 billion up 13.0% Gross margin JPY5.66 billion up 13.2% JPY24.1 billion up 13.7% Operating income JPY1.14 billion up 48.5% JPY6.5 billion up 28.1% Net Income attributable to IIJ JPY0.73 billion up 47.8% JPY4.0 billion up 20.4%
Ⅰ. Summary of 1Q FY2015 Financial Results %: YoY change < 1Q15 Results> < FY15 Targets >
Revenues JPY31.46 billion up 14.2% JPY139.0 billion up 13.0% Gross margin JPY5.66 billion up 13.2% JPY25.1 billion up 13.7% Operating income JPY1.14 billion up 48.5% JPY6.5 billion up 28.1% Net Income attributable to IIJ JPY0.72 billion up 46.8% JPY4.0 billion up 20.4%
Enterprise and consumer mobile led the growth • Subscription (unit: thousand): total 811 (up 138 QoQ), consumer 527 (up 97 QoQ), MVNE 104 (up 36 QoQ) • Increasing number of sales partners including over 40 CATV operators, Aeon’s 209 stores handling MNP transaction from July • Temporary positive cost impact of approx. JPY0.27 billion in 1Q15, applying supposed annual charge decrease rate of 15% to our
mobile infrastructure usage during FY14. (Recognized the same temporary positive impact of approx. JPY0.29 billion in 2Q14)
Systems operation and maintenance revenues increased by 23.5% YoY • Continuous contribution from systems construction projects migrated to operation and maintenance • Construction order received grew by 44.1% YoY, had a large network integration project of approx. JPY2.1 billion in 1Q15
Newly developed cloud and network services will be offered from fall • New cloud services “IIJ GIO Infrastructure P2” should promote hybrid cloud systems • New network services “IIJ Omnibus Services” incorporates SDN/NFV technologies for faster implementation of network elements
Rapid increase in demands for Internet security services and solutions • Providing multi-layered security solutions including DDoS protection service, widely used by mega banks & governmental organizations • Newly launched “IIJ Unified Security Solution” which quickly responds to cyber-attacks
Continuous focus on overseas business, especially Asia • 1Q15 revenue approx. JPY1.2 billion, deficit approx. JPY0.22 billion (1Q14 revenue approx. JPY1.2 billion, deficit approx. JPY0.23 billion) • Creating more and more business opportunities in Asia including container DC export projects, cloud business in Indonesia
Business investments to further expand business scale • Hired 155 new graduates in Apr. 2015 (129 in 2014, 136 in 2013), personnel-related expenses up 13.5% YoY • Operating costs and expenses and up 13.2% YoY
Revenue accumulated at an accelerated pace: 3-month revenue grew by 14.2% YoY(1Q15), 11.7% YoY(4Q14), 8.2% YoY(3Q14)
YoY: comparison with previous year
QoQ: 1Q15 compared to 4Q14 Subscription as of June 30, 2015
23
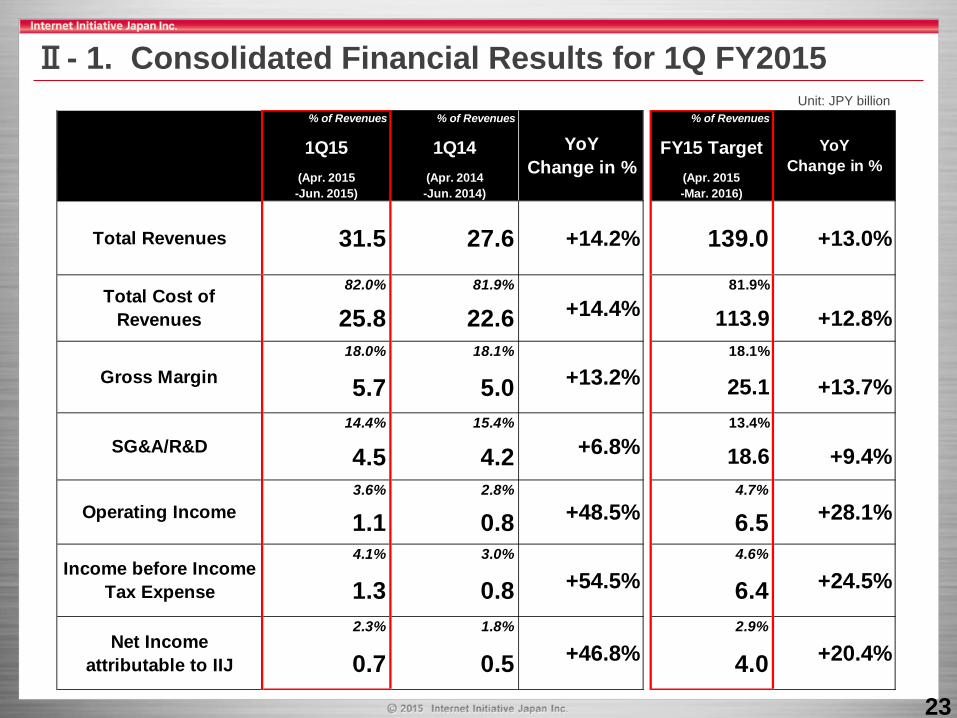
Ⅱ- 1. Consolidated Financial Results for 1Q FY2015 Unit: JPY billion
% of Revenues % of Revenues % of Revenues
1Q15 1Q14 FY15 Target(Apr. 2015-Jun. 2015)
(Apr. 2014-Jun. 2014)
(Apr. 2015-Mar. 2016)
82.0% 81.9% 81.9%
25.8 22.6 113.9 +12.8%18.0% 18.1% 18.1%
5.7 5.0 25.1 +13.7%14.4% 15.4% 13.4%
4.5 4.2 18.6 +9.4%3.6% 2.8% 4.7%
1.1 0.8 6.54.1% 3.0% 4.6%
1.3 0.8 6.42.3% 1.8% 2.9%
0.7 0.5 4.0
+28.1%
+24.5%
+20.4%
YoYChange in %
+13.0%
Net Incomeattributable to IIJ +46.8%
Income before IncomeTax Expense +54.5%
Operating Income +48.5%
Gross Margin +13.2%
SG&A/R&D +6.8%
Total Cost ofRevenues +14.4%
Total Revenues 31.5 27.6 +14.2%
YoYChange in %
139.0

24
Ⅱ- 2. Revenues Unit: JPY million Network Services
ATM Operation Business Equipment Sales Systems Integration (SI)
Outsourcing Service
Internet Connectivity Services (Enterprise)
WAN Service
Internet Connectivity Services (Consumer) Systems Operation and Maintenance Systems Construction YoY = 1Q15 compared to 1Q14
Recurring Revenue* 1Q15: JPY26,352 million (up 13.7% YoY) (83.8% of 1Q15 revenue)
* Represents the following monthly recurring revenues 1. Internet Connectivity Services (Enterprise) 2. Internet Connectivity Services (Consumer) 3. Outsourcing Services 4. WAN Services 5. Systems Operation and Maintenance
One-time Revenue * 1Q15: JPY4,148 million (up 16.8% YoY) (13.2% of 1Q15 revenue)
* Revenue which is recognized when systems or equipment are delivered and accepted by customers 1. Systems Construction 2. Equipment Sales
27,552 (+4.2%YoY)
29,620 (+6.0% YoY)
30,674 (+8.2% YoY)
35,204 (+11.7% YoY)
31,464 (+14.2% YoY)
FY14: 123,050
25
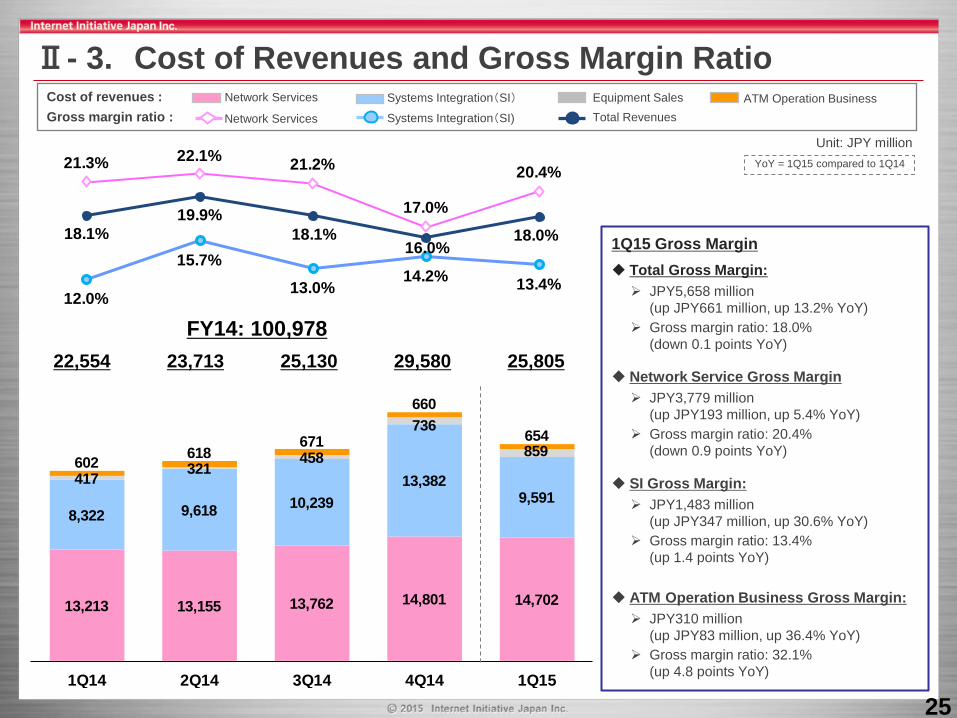
Ⅱ- 3. Cost of Revenues and Gross Margin Ratio
1Q15 Gross Margin Total Gross Margin: JPY5,658 million
(up JPY661 million, up 13.2% YoY) Gross margin ratio: 18.0%
(down 0.1 points YoY)
Network Service Gross Margin JPY3,779 million
(up JPY193 million, up 5.4% YoY) Gross margin ratio: 20.4%
(down 0.9 points YoY)
SI Gross Margin: JPY1,483 million
(up JPY347 million, up 30.6% YoY) Gross margin ratio: 13.4%
(up 1.4 points YoY)
ATM Operation Business Gross Margin: JPY310 million
(up JPY83 million, up 36.4% YoY) Gross margin ratio: 32.1%
(up 4.8 points YoY)
Unit: JPY million YoY = 1Q15 compared to 1Q14
Network Services
Network Services
Cost of revenues : Gross margin ratio :
ATM Operation Business Systems Integration(SI)
Equipment Sales Systems Integration(SI) Total Revenues
22,554 23,713 25,130 29,580 25,805 FY14: 100,978
13,213 13,155 13,762 14,801 14,702
8,322 9,618 10,23913,382
9,591417 321
458
736859
602 618 671
660
654
1Q14 2Q14 3Q14 4Q14 1Q15
18.1%19.9%
18.1%16.0%
18.0%
21.3% 22.1% 21.2%
17.0%
20.4%
12.0%
15.7%
13.0%14.2% 13.4%
26
1,581.4 1,633.0 1,705.6 1,730.81,912.0
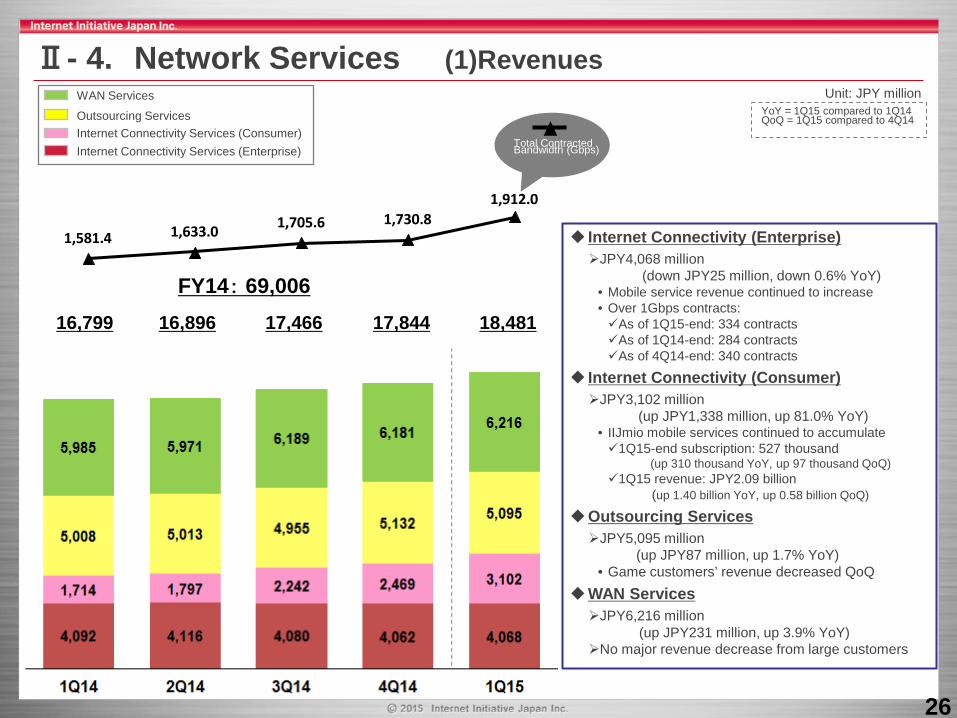
Ⅱ- 4. Network Services (1)Revenues
Outsourcing Services Internet Connectivity Services (Consumer)
WAN Services
Internet Connectivity Services (Enterprise) Total Contracted Bandwidth (Gbps)
Unit: JPY million
Internet Connectivity (Enterprise) JPY4,068 million (down JPY25 million, down 0.6% YoY)
• Mobile service revenue continued to increase • Over 1Gbps contracts: As of 1Q15-end: 334 contracts As of 1Q14-end: 284 contracts As of 4Q14-end: 340 contracts
Internet Connectivity (Consumer) JPY3,102 million (up JPY1,338 million, up 81.0% YoY)
• IIJmio mobile services continued to accumulate 1Q15-end subscription: 527 thousand
(up 310 thousand YoY, up 97 thousand QoQ) 1Q15 revenue: JPY2.09 billion (up 1.40 billion YoY, up 0.58 billion QoQ)
Outsourcing Services JPY5,095 million
(up JPY87 million, up 1.7% YoY) • Game customers’ revenue decreased QoQ
WAN Services JPY6,216 million (up JPY231 million, up 3.9% YoY) No major revenue decrease from large customers
16,799 16,896 17,466 17,844 18,481
FY14: 69,006
YoY = 1Q15 compared to 1Q14 QoQ = 1Q15 compared to 4Q14
27
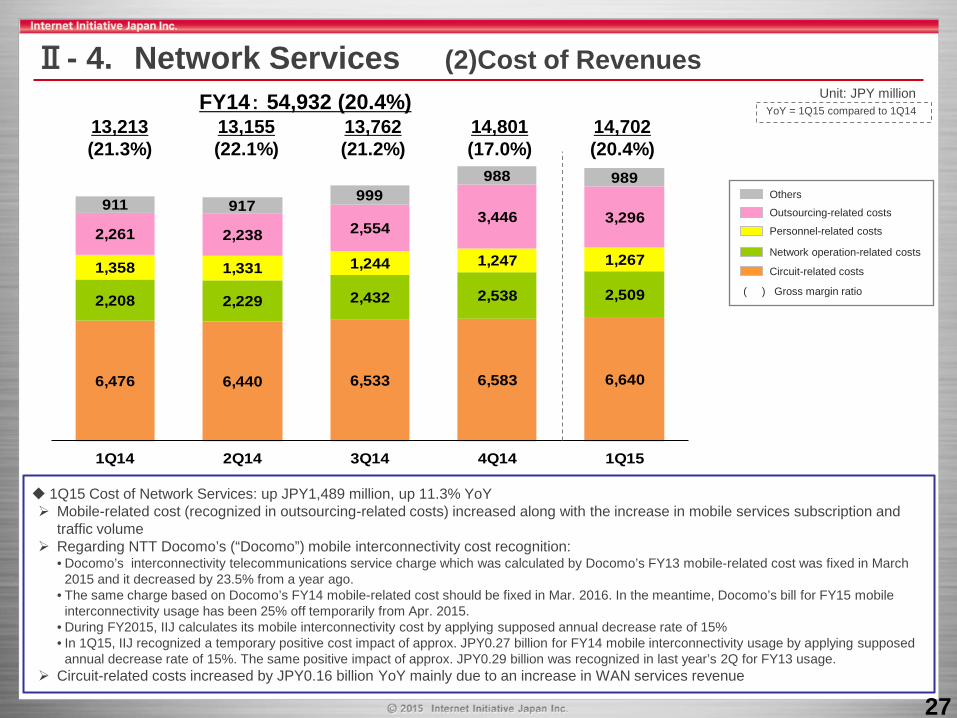
Ⅱ- 4. Network Services (2)Cost of Revenues Unit: JPY million
( ) Gross margin ratio
Others
Outsourcing-related costs
Personnel-related costs
Network operation-related costs
Circuit-related costs
1Q15 Cost of Network Services: up JPY1,489 million, up 11.3% YoY Mobile-related cost (recognized in outsourcing-related costs) increased along with the increase in mobile services subscription and
traffic volume Regarding NTT Docomo’s (“Docomo”) mobile interconnectivity cost recognition:
• Docomo’s interconnectivity telecommunications service charge which was calculated by Docomo’s FY13 mobile-related cost was fixed in March 2015 and it decreased by 23.5% from a year ago.
• The same charge based on Docomo’s FY14 mobile-related cost should be fixed in Mar. 2016. In the meantime, Docomo’s bill for FY15 mobile interconnectivity usage has been 25% off temporarily from Apr. 2015.
• During FY2015, IIJ calculates its mobile interconnectivity cost by applying supposed annual decrease rate of 15% • In 1Q15, IIJ recognized a temporary positive cost impact of approx. JPY0.27 billion for FY14 mobile interconnectivity usage by applying supposed
annual decrease rate of 15%. The same positive impact of approx. JPY0.29 billion was recognized in last year’s 2Q for FY13 usage. Circuit-related costs increased by JPY0.16 billion YoY mainly due to an increase in WAN services revenue
13,213 (21.3%)
13,155 (22.1%)
13,762 (21.2%)
14,801 (17.0%)
14,702 (20.4%)
FY14: 54,932 (20.4%)
6,476 6,440 6,533 6,583 6,640
2,208 2,229 2,432 2,538 2,509
1,358 1,331 1,244 1,247 1,267
2,261 2,238 2,5543,446 3,296
911 917999
988 989
1Q14 2Q14 3Q14 4Q14 1Q15
YoY = 1Q15 compared to 1Q14

28
3,084 4,784 4,625 7,944 3,203
1Q14 2Q14 3Q14 4Q14 1Q15
5,929 6,306 7,619
4,734
6,893
Ⅱ- 5. Systems Integration (SI) (1)Revenues Unit: JPY million
Systems construction revenues 1Q15 revenue: up JPY118 million, up 3.8% YoY 1Q15 order received: up JPY1,930 million, up 44.1% YoY Revenue increased due to an expansion in projects scale Large-scale projects orders received in 1Q15:
• Network integration project (approx. JPY2.1 billion) • MVNO service platform including billing, customer
management systems for a company entering MVNO business
• Renewal of Internet gateway for a major retail company • Construction of hybrid cloud systems for a prominent service
company etc.
1Q15 revenue: up JPY1,498 million, up 23.5% YoY
Adding RYUKOSHA’s revenue from 3Q14 (1Q15 JPY352 million) 85% of 1Q15 cloud-related revenue is recognized in systems
operation and maintenance revenues (15% in outsourcing) Systems construction projects which migrated to operation and
maintenance phase contributed to revenues
Order backlog
Systems Construction Revenues Systems Operation and Maintenance Revenues
※Systems construction’s order backlog and order received include equipment sales Order received
Systems operation and maintenance revenue
4,377 5,540 6,458 5,860 6,308
7,803 6,724 9,487 8,900 7,486
6,373 6,627 7,151 7,650 7,871
1Q14 2Q14 3Q14 4Q14 1Q15
20,635 20,732 23,068 24,319 23,934
< Systems Construction >
< Systems Operation and Maintenance >
YoY = 1Q15 compared to 1Q14
< Overseas business > 1Q15 revenue: approx. JPY 1.2 billion (almost same as 1Q14), business enterprise covered large game customers’ decrease
FY14: 20,437
FY14:27,800

29
Ⅱ- 5. Systems Integration (SI) (2)Cost of Revenues Unit: JPY million
( ) Gross margin ratio
Others
Purchasing costs
Outsourcing-related costs
Personnel-related costs
Network operation-related costs
1Q15 Cost of SI: up JPY1,269 million, up 15.3% YoY Number of outsourcing personnel as of June. 2015: 985 personnel (up 175 personnel YoY, up 16 personnel QoQ) Purchasing costs and outsourcing-related costs increased as number and scale of construction projects increased
8,322 (12.0%)
9,618 (15.7%)
10,239 (13.0%)
13,382 (14.2%)
9,591 (13.4%)
FY14: 41,562 (13.8%)
1,396 1,411 1,591 1,820 1,871
1,944 1,979 2,287 2,298 2,089390 386
407 475 4083,305 3,317
3,4763,959 3,818
1,2872,526
2,478
4,830
1,404
1Q14 2Q14 3Q14 4Q14 1Q15
YoY = 1Q15 compared to 1Q14 QoQ = 1Q15 compared to 4Q14

30
Ⅱ- 6. Number of Employees Unit: JPY million
Engineers 71%
Sales 18%
Administration 11%
[Employee Distribution]
Contract worker
Full time worker
YoY = 1Q15 compared to 1Q14
Personnel related costs & expenses
(% of revenue)
1Q15 personnel-related costs and expenses: up JPY624 million, up 13.5% YoY Acquired RYUKOSHA in 3Q14 , the number of employees increased by 264 personnel and personnel-related expenses increased Hired 155 new graduates in Apr. 2015 (129 in Apr. 2014, 136 in Apr. 2013, 75 in Apr. 2012)
(+140 from Mar. 2015) 2,353 2,523 2,546 2,818 2,835 2,975
4Q13 1Q14 2Q14 3Q14 4Q14 1Q15
4,408 (14.0%)
4,641 (16.8%)
4,643 (15.7%)
4,704 (15.3%)
5,114 (14.5%)
5,266 (16.7%)
(Number of employees)
2,062 2,212 2,218 2,456 2,465 2,614
291 311 328
362 370 361
2014/3 2014/6 2014/9 2014/12 2015/3 2015/6
31
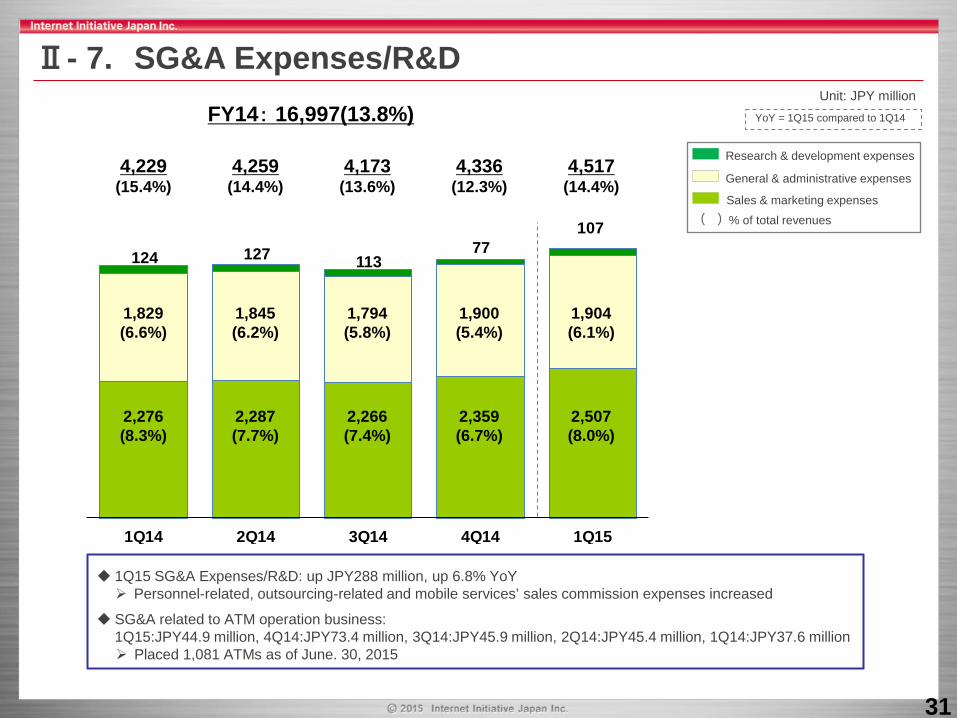
Ⅱ- 7. SG&A Expenses/R&D Unit: JPY million
( )
Sales & marketing expenses
General & administrative expenses
Research & development expenses
% of total revenues
1Q15 SG&A Expenses/R&D: up JPY288 million, up 6.8% YoY Personnel-related, outsourcing-related and mobile services’ sales commission expenses increased
SG&A related to ATM operation business: 1Q15:JPY44.9 million, 4Q14:JPY73.4 million, 3Q14:JPY45.9 million, 2Q14:JPY45.4 million, 1Q14:JPY37.6 million Placed 1,081 ATMs as of June. 30, 2015
124 127 113 77
107
1Q14 2Q14 3Q14 4Q14 1Q15
4,229 (15.4%)
4,259 (14.4%)
4,173 (13.6%)
4,336 (12.3%)
4,517 (14.4%)
FY14: 16,997(13.8%)
1,829 (6.6%)
1,845 (6.2%)
1,794 (5.8%)
1,900 (5.4%)
1,904 (6.1%)
2,276 (8.3%)
2,287 (7.7%)
2,266 (7.4%)
2,359 (6.7%)
2,507 (8.0%)
YoY = 1Q15 compared to 1Q14

32
Unit: JPY million
Operating Income Net Income Attributable to IIJ Operating Margin Ratio YoY = 1Q15 compared to 1Q14
Ⅱ- 8 Operating Income and Net Income
Income before income tax expenses: 1Q15: JPY1,278 million
(up JPY451 million, up 54.5% YoY) • Dividend income: JPY63 million • Foreign exchange gains: JPY27 million • Gains from fund investments: JPY96 million • Interest expense: JPY57 million
Net income attributable to IIJ: 1Q15: JPY721 million
(up JPY230 million, up 46.8% YoY) • Mainly due to equity in net income of Internet Multifeed: JPY61 million • Net income attributable to noncontrolling interests
including Trust Networks: JPY57 million
FY14 Operating income: 5,075 FY14 Net income attributable to IIJ: 3,322
220 624 523 319 450 Current income tax expense
132 98 36 (55) 111 Deferred tax expense (benefit)
34 35 46 40 61 Equity in net income of
equity method investees
(18) (24) (15) (18) (57) Less: Net income attributable to noncontrolling interests
33
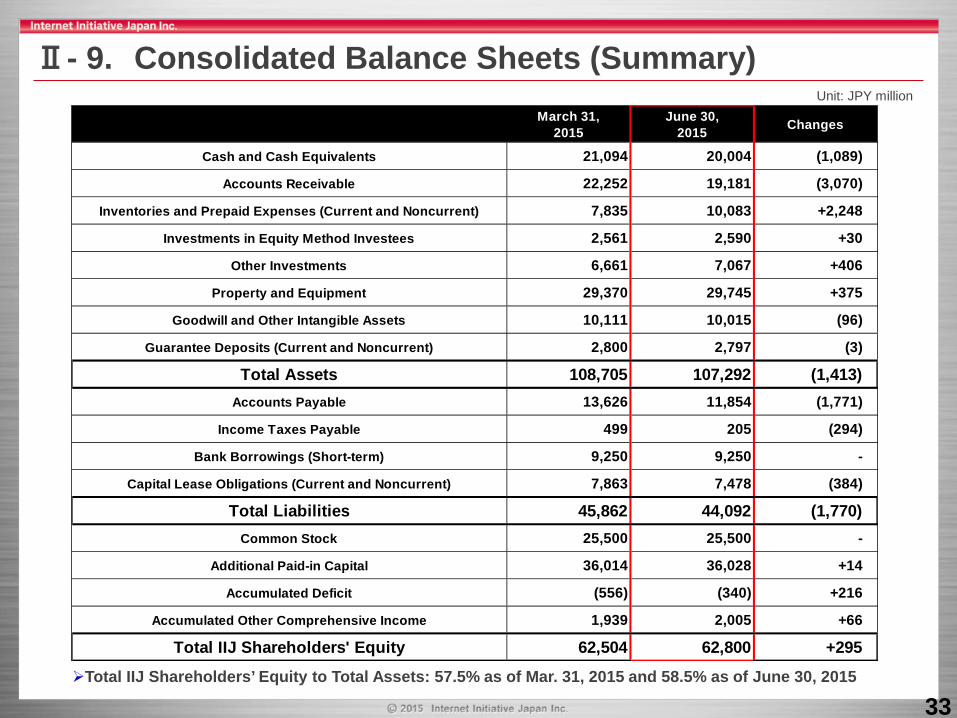
Unit: JPY million
Ⅱ- 9. Consolidated Balance Sheets (Summary)
Total IIJ Shareholders’ Equity to Total Assets: 57.5% as of Mar. 31, 2015 and 58.5% as of June 30, 2015
March 31,2015
June 30,2015 Changes
Cash and Cash Equivalents 21,094 20,004 (1,089)
Accounts Receivable 22,252 19,181 (3,070)
Inventories and Prepaid Expenses (Current and Noncurrent) 7,835 10,083 +2,248
Investments in Equity Method Investees 2,561 2,590 +30
Other Investments 6,661 7,067 +406
Property and Equipment 29,370 29,745 +375
Goodwill and Other Intangible Assets 10,111 10,015 (96)
Guarantee Deposits (Current and Noncurrent) 2,800 2,797 (3)
Total Assets 108,705 107,292 (1,413)Accounts Payable 13,626 11,854 (1,771)
Income Taxes Payable 499 205 (294)
Bank Borrowings (Short-term) 9,250 9,250 -
Capital Lease Obligations (Current and Noncurrent) 7,863 7,478 (384)
Total Liabilities 45,862 44,092 (1,770)Common Stock 25,500 25,500 -
Additional Paid-in Capital 36,014 36,028 +14
Accumulated Deficit (556) (340) +216
Accumulated Other Comprehensive Income 1,939 2,005 +66
Total IIJ Shareholders' Equity 62,504 62,800 +295

34
(1,509) (2,059) (1,563) (1,153) (1,539)1Q14 2Q14 3Q14 4Q14 1Q15
(3,339)
(1,815)(1,164)
(1,755) (2,053)
1Q14 2Q14 3Q14 4Q14 1Q15
2,855 2,490
4,667
2,901 2,498
1Q14 2Q14 3Q14 4Q14 1Q15
Ⅱ- 10. Consolidated Cash Flows
Financing Activities 1Q15 Breakdown YoY Change
Principal payments under capital leases 1,034 (30)
Dividends paid 505 (0)
Investing Activities 1Q15 Breakdown YoY Change
Purchases of property and equipment 2,370 (434)
Operating Activities 1Q15 Breakdown YoY Change
Net income 778 +269
Prepaid expenses (software license fee, bonus etc.) 1,753 (345)
Unit: JPY million YoY = 1Q15 compared to 1Q14
< Operating Activities >
< Investing Activities >
< Financing Activities >
FY14: 12,912
FY14: (8,073)
FY14: (6,283)

35
Ⅱ- 11. Other Financial Data (CAPEX etc.) Unit: JPY million
Capital Lease Cash CAPEX
< CAPEX >
< Depreciation and Amortization >
< Adjusted EBITDA >
FY14: 14,753
FY14:9,677
FY14:11,835

36
Ⅲ-1. Cloud Business Developments
As of June 2012 As of June 2013 As of June 2014 As of June 2015
Task-specific SaaS 0.46 (FX, POS etc.)
General purpose SaaS 0.08 (groupware etc.)
Cloud-related revenue (Unit: JPY billion)
GIO/Component 2.28
GIO/Hosting 0.51
Large game customers
Business enterprise customers
FY14:JPY12.26 billion
MRC* over JPY0.5 million MRC* over JPY1.0 million
Breakdown of 1Q15 revenue (Unit: JPY billion)
1Q15 cloud-related revenue recognition: 85% in systems operation and maintenance, 15% in outsourcing
*Monthly Recurring Charge
Cloud customer base
130
750 users
60
1,200 users
230
140
1,320 users
270
160
1,050 users
190
100
2.32 2.47 2.70 2.85 2.91 0.52 0.50 0.44
0.46 0.42
2.84 2.97 3.14 3.31 3.33
1Q14 2Q14 3Q14 4Q14 1Q15
Business progress 1Q15 revenue: Large game customers’ revenue decreased
and 1Q seasonal factor FX (Foreign Exchange) SaaS revenue
increased along with transaction increase New cloud service:
Developed “IIJ GIO Infrastructure P2” which will be launched in 2015/10, enabling flexible system composition by in-house developed SDN products and cloud orchestrator(*)
BigData-related projects: Accumulating orders including operation data visualization for a prominent logistics company
SAP business: Continuously accumulating orders by leveraging sales partnership
(*) Cloud orchestrator enables automatic implementation and management of complex computing systems including virtual servers.
June rev.0.97
Sep. rev.1.03
Dec. rev.1.08
Mar. rev.1.14
June rev.1.16
37
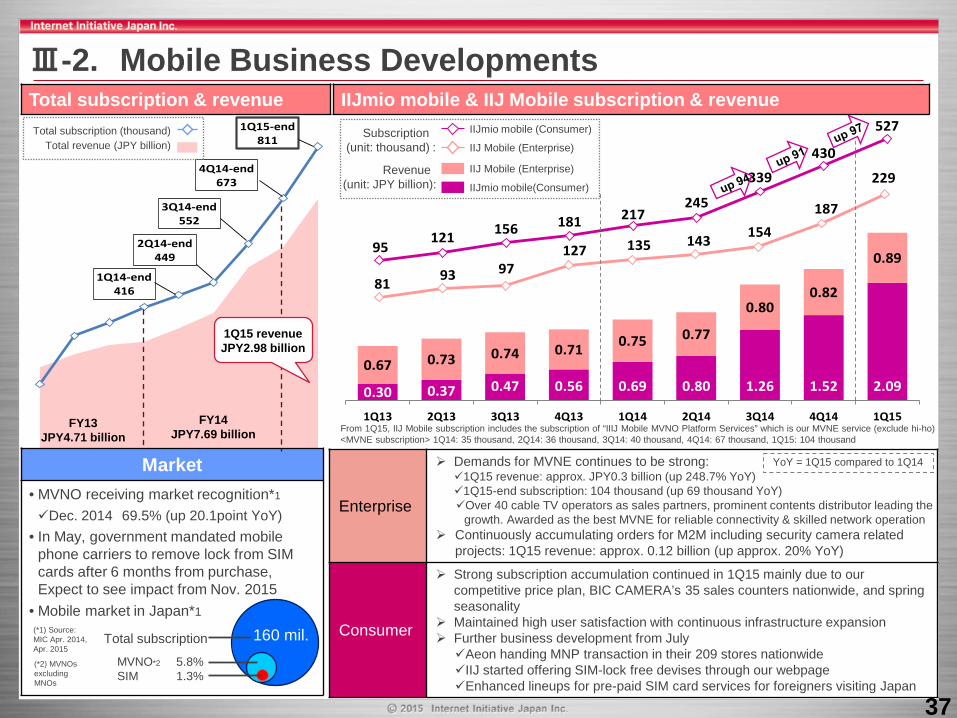
1Q14-end416
2Q14-end449
3Q14-end552
4Q14-end673
1Q15-end811
0.30 0.37 0.47 0.56 0.69 0.80 1.26 1.52 2.090.67 0.73 0.74 0.71 0.75 0.77
0.800.82
0.89
1Q13 2Q13 3Q13 4Q13 1Q14 2Q14 3Q14 4Q14 1Q15
95121 156 181 217
245
339
430
527
81 93 97127 135 143 154
187
229
Ⅲ-2. Mobile Business Developments Total subscription & revenue
Market • MVNO receiving market recognition*1
Dec. 2014 69.5% (up 20.1point YoY) • In May, government mandated mobile
phone carriers to remove lock from SIM cards after 6 months from purchase, Expect to see impact from Nov. 2015
• Mobile market in Japan*1
MVNO*2 5.8% SIM 1.3%
(*1) Source: MIC Apr. 2014, Apr. 2015
(*2) MVNOs excluding MNOs
Total subscription 160 mil.
IIJmio mobile (Consumer)
IIJ Mobile (Enterprise)
IIJmio mobile(Consumer)
FY13 JPY4.71 billion
FY14 JPY7.69 billion
IIJmio mobile & IIJ Mobile subscription & revenue
1Q15 revenue JPY2.98 billion
Total subscription (thousand) Total revenue (JPY billion)
Enterprise
Demands for MVNE continues to be strong: 1Q15 revenue: approx. JPY0.3 billion (up 248.7% YoY) 1Q15-end subscription: 104 thousand (up 69 thousand YoY) Over 40 cable TV operators as sales partners, prominent contents distributor leading the
growth. Awarded as the best MVNE for reliable connectivity & skilled network operation Continuously accumulating orders for M2M including security camera related
projects: 1Q15 revenue: approx. 0.12 billion (up approx. 20% YoY)
Consumer
Strong subscription accumulation continued in 1Q15 mainly due to our competitive price plan, BIC CAMERA’s 35 sales counters nationwide, and spring seasonality
Maintained high user satisfaction with continuous infrastructure expansion Further business development from July Aeon handing MNP transaction in their 209 stores nationwide IIJ started offering SIM-lock free devises through our webpage Enhanced lineups for pre-paid SIM card services for foreigners visiting Japan
IIJ Mobile (Enterprise)
Subscription (unit: thousand) :
Revenue (unit: JPY billion):
From 1Q15, IIJ Mobile subscription includes the subscription of “IIIJ Mobile MVNO Platform Services” which is our MVNE service (exclude hi-ho) <MVNE subscription> 1Q14: 35 thousand, 2Q14: 36 thousand, 3Q14: 40 thousand, 4Q14: 67 thousand, 1Q15: 104 thousand
YoY = 1Q15 compared to 1Q14
38
※ Forward-looking Statements Statements made in this presentation regarding IIJ’s or managements’ intentions, beliefs,
expectations, or predictions for the future are forward-looking statements that are based on IIJ’s and managements’ current expectations, assumptions, estimates and projections about its business and the industry. These forward-looking statements, such as statements regarding revenues, operating and net profitability are subject to various risks, uncertainties and other factors that could cause IIJ’s actual results to differ materially from those contained in any forward-looking statement. These risks, uncertainties and other factors include but not limited to: • a decrease of corporate spending or capital expenditure due to depression in the Japanese economy and/or corporate earnings decreased,
• an inability to achieve anticipated results and cause negative impact on profitability, • a possibility that less of reliability for our services and loss of business chances due to interrupt or suspend of our services,
• an excess increase and fluctuation in network rerated cost, mobile-related cost, and outsourcing cost, personnel cost etc,
• a possibility to lose business opportunity due to our inadequate resources in personnel and others, • an increase in competition and strong pricing pressure, • the recording of an impairment loss as a results of an impairment test on the non-amortized intangible assets such as goodwill,
• a decline in value and trending value of our holding securities. Please refer to IIJ’s filings on Form 20-F of its annual report and other filings with the United States Securities and Exchange Commission ("SEC") for other risks.
※ Contact Information IIJ Investor Relations Iidabashi Grand Bloom, 2-10-2 Fujimi, Chiyoda-ku, Tokyo, 102-0071, Japan
TEL: 81-3-5205-6500 URL: http://www.iij.ad.jp/en/ir/ E-Mail: [email protected]