internet initiative japan inc. corporate overview · *mrc: monthly recurring charge reached...
TRANSCRIPT

February and March 2015TSE1:3774 NASDAQ:IIJI
Internet Initiative Japan Inc.Corporate Overview

2
Key Investment HighlightsPioneer and Top IP Engineering Company in JapanShifted from ISP to Total Network Solution ProviderTarget Blue-chip & Governmental OrganizationsOver 8,500 Excellent Japanese Customers Growth Strategy with Recurring Revenues &
Income Growth
details to follow
Best Positioned in the Growing Outsourcing & Cloud Computing Market
MVNO Business Rapidly Growing by Capturing both Corporate and Consumer needs
Hot Topics

3
The first established full-scale ISP in Japan Introduced many prototype internet-related network services Highly skilled top level IP engineers Pioneer of network technologies in Japan Operates one of the largest Internet backbone networks in Japan Self-develop services and the related back office facilities
Established “IIJ” brand among the Japanese IT market Known for its engineering & network operation skills High customer satisfaction & long term relationship Approx. 8,500 clients: mainly large enterprises & governmental organizations
At the leading edge of IP R&D Engaged in software development of SDN Founding member of JEAG Co-working with MIC* Participation in world-wide research and organizations …and many more
TOP IP Engineering Company in Japan
3
Established December 1992Number of Employees(as of Dec. 2014)
Consolidated: 2,818 (approx. 70% engineers)
Listed Markets NASDAQ (IIJI), TSE1 (3774)Large Shareholders(as of Sep. 2014)
NTT (21.6%), Koichi Suzuki (5.6%*), NTT Communications(4.4%) *Jointly owned by Mr. Suzuki’s wholly owned private company
*MIC: Ministry of Internal Affairs and Communications

44
Entrepreneur of Network TechnologiesBusiness and Service Development to Initiate the Market
IIJ Group
Dial-upservice
InternetVPN
IP Multicast
SMF
Anti-spamSolution
ManagedService
IPv6
FirewallService
CDN
SEIL
P to P
Large VolumeData
Distribution
Asia Backbone
SLA
IX
ISPin U.S. hi-ho
ConsumerISP
IIJ4U
IIJmio
DC
WideLAN
IIJMobile
iBPS
SystemsOperation
SystemsIntegration
ApplicationDevelopment
IPTVPlatform
CloudComputing“IIJ GIO”
LaIT
DDoS
Home PageService
Web HostingService
The first full-scale ISP in Japan In-housed development At leading edge of IP R&D IP specialists
WebGateway
M2M
InternetLAN
FX
MVNE
SmartMobile
GlobalWAN
Container DC
Cloud Service InUS & China &
UK & Singapore
LTE
Overseas SI Projects
SDN/NFV
1992 1996 1997 1998 2006 2007 2008 2010 2012 2013 2014
ConsumerMobile
SACM solution
BigData Solution

55
Strategic Shift in Business ModelFrom “ISP” to “Total Network Solution Provider”
Merger of corporate ISPs
Heavy price competition
CWC filed forChapter 7
Rise in needs for Cloud /Outsourcing
Increase in number of ISPs
Internet Connectivity Services
Outsourcing Services
Systems ConstructionSystems Operation and Maintenance
WAN Services
Network Services:
Systems Integration:
Total Network Solution Provider
BLOOMHarvesting the flower of
EMERGECloud Computing
WAN Business (M&A Sep. 2010)
Revenue (JPY million)
5
Listed on TSE
BirthEarned its enduring
client base
TransitionChange in
business model
NASDAQ IPO
Monthly Recurring Revenue
One-time Revenue

6
IIJ Internet Backbone
Network services costs don’t increase along with network services revenues• If revenues are accumulated continuously, gross margin should continuously improve
Revenues
• Multiple cross-selling revenue sources* provided from the Internet backbone• Monthly recurring revenue, contract periods are usually 1 year (contracts per network bandwidth)• Blue-chip clients with mission-critical business, network operator clients (Carriers, ISPs, CATVs, etc)• Tough competition ended, only a few high-end ISPs survived• Revenues increase along with bandwidth migration and accumulation of service orders• Enjoying scale merit along with increasing traffic
Costs• Strong bargaining power as one of the largest independent ISPs leasing fibers• Mainly related to circuit-borrowing, network equipment, DC-borrowing, operations, personnel & outsourcing• While constantly expanding the network, costs barely increase
Business Structure of Network Services
6
Revenue
Cost
16.7% 18.3%19.8% 23.3% 23.9%
Gross margin ratio
FY2007 FY2008 FY2009 FY2010 FY2011 FY2012 FY2013 FY2014
18.3%
21.8%
22.1%

7
Business Model: Cross-selling of Network Solutions
Internet Connectivity & WAN
SystemsConstruction
Outsourcing &Systems
Operation
Over 8,500Client Base
• Dedicated line connectivityIP service (cover over Gbps)IPv6 service
• Broadband connectivityOptical Fiber/ADSL
• Mobile connectivity (IIJ Mobile)LTE/3G
• WAN servicesWide area Ethernet/VPNGlobal WAN
Outsourcing services include:• Security-related services (managed-FW and IPS, DDoS protection, URL filtering, anti-spam etc.)• Data center-related services (housing, facility management and operation)• Server-related services (E-mail services, web hosting, online storage, CDN etc.) • Network-related services (network management and monitoring, VPN, SEIL, SMF etc.) • IIJ GIO Hosting Package Services (approx. 17% of 3Q14 IIJ GIO revenues)
Systems operation includes:• Operation and maintenance of a system constructed in Systems Construction• IIJ GIO Component Services (approx. 83% of 3Q14 IIJ GIO revenues)
7
e.g.Large scale EC system,
Disaster recovery system, Security gateway system etc.
Number of Customers
Increase revenuesper customer
Revenues by Customer

88
Excellent Blue-chip Client Base
The number of clients among the top 10 companies in each industry.
Electronicappliances
Information/Telecommunications
10/10 10/10
Wholesale
9/10
Precisionequipment
10/10
Construction10/10
Banks
9/10
Machinery
8/10Securities
10/10
Insurance
8/10
High Market Penetration towards Top Tiers
8

99
Revenue Composition by Clients Largest customer’s revenue is less than 3% of the total revenue Much room to increase revenue per customer
Revenue Distribution by Industry
Revenue Distribution by Clients
Source: IIJ’s FY2013 financial results

1010
Competitive AdvantagesIIJ can offer NW, Cloud, SI, and MVNO all at once
Systems IntegratorsCarriersInternet Connectivity Services
Outsourcing ServicesWAN Services
Network IntegrationSystems Operation
Private Cloud
TelephoneLegacy Network Services
MainframeLegacy Systems Operation
IIJ…has many highly skilled network engineerscorresponds to the Internet market rapidly focuses on enterpriseshas an established brand among blue-chipshas flat organization structure
IIJ…operates its own backbone networkdevelops network services in-housedtargets new IT market, not legacy SIhas long and rich experience in server operationhas moderate number of employees
Cloud Computing Services
10

1111
Best Positioned in Cloud MarketTarget Private Cloud market with Public Cloud infrastructure
JPY462.7 billion
Service Features
One of the first Cloud providers (2009) Offer public Cloud infrastructure: forefront investment in servers, storages, datacenters etc. Cloud-related CAPEX: FY13 JPY3.7 billion
Promote Cloud shift of blue-chips by continuously expanding service lineups Microsoft Azure, VMware Hypervisor, SAP Basic, IBM AS400, Oracle Database and many more Aggressively investing in new service and solution development (BigData, M2M etc.)
Growth Strategy
Target large business enterprises’ internal IT systems, which are traditionally covered by SIers Leverage blue-chip customer base: IIJ GIO user: 1,260, IIJ group customer: 8,500 Chosen for reliable connectivity and skilled operation for network and system Meeting growing corporate needs of large-scale NW systems with SI, Cloud, MVNO and NW services Some advanced integrated cloud usages among primitive and simple system purposes
IIJ GIO’s Competitive Advantages Private Cloud Market Growth in JapanJPY1.4 trillion
3 times
Source: IDC Japan, Sep. 2014, Private Cloud Market
Competitive pricing with
container DCs
SkilledSystems and
Network operation
Value-added service
development
Covering wide range of
corporate needs with SI,
MVNO, and NW servicesBlue-chip
Customer Base

1212
Cloud-related Revenue Market Share Fastidious Users
Expansion of Customer Base Container Type Datacenter First in Japan to commercialize (2011) PUE*1.2, applying outside air cooling system Located in western Japan, country side Doubled the capacity in Nov. 2013 (48 modules)
Cloud Business Developments
12
MRC over JPY0.5 million
MRC over JPY1 million
*MRC: Monthly Recurring Charge
Reached break-even in 4Q13, Entered a profit making phase
As of Mar. 2012
700
50
As of Dec. 2014 1,260 users
270 users
160 users
As of Mar. 2011340
10
As of Mar 20131,000
90190
40100
MRC over JPY3 million approx. 50 users
Japan’s public cloud market by revenue Source: Fuji Chimera Report (Aug. 2013)
1st
2nd
PUE: Power Usage Effectivenessa terminology created by Green Grid as a metric used to determine the energy efficiency for a datacenter
3.1
6.2
9.8Large Game Customers
Corporate Users
% of total cloud-related
revenue
SBI Holdings NTT DOCOMO
TOMY COMPANY Nomura Securities
Nippon Life Insurance Company
Sompo Japan Nipponkoa
Tokyo Stock Exchange DAIWA HOUSE
Ricoh Company SHIMIZU CORPORATION
…. and many more

13
BigData
MVNOs
Sales channel
Consumer
Business StrategyImprove MVNO infrastructure efficiency
with enterprise & consumer traffic• 1st MVNO to use NTT Docomo’s network (2008) • 1st MVNO to offer LTE connectivity (2012)• Best positioned to meet corporate MVNO demands
1) large-scale MVNO infrastructure (constructed in 2008)2) one of the largest internet backbone networks3) various network services4) offer MVNO, SI, and Cloud, NW all at once
MVNO Business
13
Subscription as of Mar. (million)
Revenue(JPY billion)
Source : MM Research (June 2014)Total of mobile phone (3G/LTE), BWA (WiMAX/AXGP) and PHS
MVNO Market Growth in Japan
CATV Toyama
and many more
EhimeCATV
Enterprise
and many more
IIJ’s MVNO Platform (NTT Docomo’s mobile network)
Direct online salesCloudSISecurity
M2M
and many moreMVNO platform service
(IIJ as MVNE)
Tochigi CATV
itscom

14
IIJmio & IIJmobile Subscription & RevenueTotal Subscription & Revenue
MVNO Business Developments
MVNO (Non-MNO)4.4%
SIM-card offering 1%
Total subscription:552 thousand as of Dec. 2014
unit 1,000
JPY billion
FY112.73
FY122.94
FY134.71
1Q-3Q14JPY5.28 billion(up 54.8% YoY)
Revenue breakdown3Q14: 2.182Q14: 1.641Q14: 1.46
Enterprise mobile subscription (exc. MVNE)Consumer IIJmio revenue
Enterprise mobile revenue (exc. MVNE)
Consumer IIJmio subscription
1Q-3Q13JPY3.41 billion
Total Subscription:
As of Sep. 2014: 449 thousandAs of Jun. 2014: 416 thousandAs of Mar. 2014: 384 thousand
Source: MMD Research (Jan. 2015)
Consumer MVNOSubscription Share
Japan’s Mobile Market160 mil subscription*
Source: MMD (May 2014)
Source: MIC (Apr. 2014) as of Dec. 2013, MRI (Mar. 2014)
Unit: Mbps
Germany:15%Australia:14%Hong Kong:8%U.S.A 10%
Network Speed Comparison among MVNOs
Download speed
Upload speed

15
Overseas Business Developments Building stronger relationship with Japanese customers by cross-selling network, Cloud and SI
to meet various IT needs of Japanese customers globally Seeking growth opportunity both inside and outside of Japan
15
Shanghai
Hong Kong
LondonDusseldor
Thailand
Singapore
San JoseLos Angeles
New York Operating DeficitRevenue
Unit: JPY billion
FY12 Launched Cloud services in the U.S. and China (partnership with China Telecom) Opened an office in Thailand, started focusing on Asian region Japanese large SNS game customers aggressively expanded overseas market
FY13
Launched Cloud services in the U.K. Opened a datacenter in London, Extended Internet backbone to cover worldwide Enhanced service lineups for Cloud services in the U.S. Revenue accumulation from general customers while game customers’ demand slowed down
FY14
Export container type datacenters to Russia, Laos and more Launched Cloud services in Singapore Cloud business in Indonesia with a local carrier Received order from a large contents delivery company
Japan
Financial Results
Regions where IIJ group has provided services and/or solutions

16
ATM Operation Business DevelopmentsTotal number of ATMs & daily transaction per ATM
are the keys to the profit growth
< Trust Networks Inc. >• 79.5% subsidiary• Established in July 2007• Pursue ATM operation business
Business ModelSimilar to “Seven Bank” model, high profitability
• Seven Bank: 18,142 ATMs, revenue JPY106.0 billion, profit ratio 34.0% as of March 31, 2014
Placing ATMs in Pachinko parlors in Japan with dominant position• After long discussion, started to place in Kanto, Kansai, Kyushu and Tokai areas
Receive commission for each withdrawal transactionStrong revenue & income driver in mid-term
• Approx.11,900 Pachinko parlors in Japan as of Dec. 2013 (Metropolitan Police Dept.)
16
Revenue and Income growth
Number of placed ATMs* 280 440 625 855 1,048 *Number of placed ATMs are as of May each year except for FY14 which is the number as of Feb. 2015
Operating Income
Revenue
Unit: JPY billion

17
IIJ Group – The Way Forward
17
Environment
IIJ Position
Action
Aggressive business investment actions to leap into the next phase of growth Stronger management structure: CEO Suzuki & COO Katsu Enhancement of human resources: number of employees increased by approx. 10% Further focus on service & solution development (Cloud, mobile, BigData etc.) Overseas business expansion:
• Building stronger relationship with Japanese customers• Seeking growth opportunities outside of Japan
Continuous service facility investment (Doubled container type DC capacity)
IIJ is best positioned to capture the growing demand with the combination of NW services, SI expertise, MVNO infrastructure - strong competitive advantage - Expertise in operating large Internet backbone network Blue-chip customer base of over 8,500 entities Long history of developing various network services A number of highly skilled engineers Continuously taking initiatives in network technology field
Japanese enterprise systems at a turning point National ID system, mainstream adoption of cloud services, outsourcing of corporate IT systems,
increasing interest of incorporating MVNO infrastructure etc. Systems becoming larger and requiring Cloud, MVNO, and network services all at once Data traffic explosion: pervasive usage of smart phones, portable devises etc.

18
(YoY) ― (+JPY1.25) (+JPY1.25) (+JPY1.25) (+JPY2.5) (+JPY2.5) (+JPY2.5) (+JPY3.25) ―
FY2006 FY2007 FY2008 FY2009 FY2010 FY2011 FY2012 FY2013 FY2014
18
FY2014 Dividend ForecastIIJ conducted a 1:200 stock split on common stock with an effective date of October 1, 2012.
Dividend figures shown below are retroactively adjusted to reflect the stock split.
Interim Year-End
JPY7.50JPY8.75
JPY10.00JPY11.25
JPY13.75
JPY16.25
JPY18.75
JPY22.00JPY22.00
(Target)

19
Consolidated Financial Results for 1Q-3Q FY2014Unit: JPY billion
19
% of Revenues % of Revenues % of Revenues
1Q-3Q14 1Q-3Q13 FY14 Target(Apr. 2014-Dec. 2014)
(Apr. 2013-Dec. 2013)
(Apr. 2014-Mar. 2015)
81.3% 81.2%
71.4 67.218.7% 18.8%
16.4 15.514.4% 13.7%
12.7 11.34.3% 5.1% 5.3%
3.8 4.2 6.54.4% 5.6% 5.3%
3.9 4.6 6.52.6% 3.5% 3.3%
2.3 2.9 4.0
―
122.0
―
―
Total Cost ofRevenues +6.2%
TotalRevenues 87.8 82.7 +6.2%
YoYChange in %
OperatingIncome (10.1%)
Gross Margin +6.0%
SG&A/R&D +12.0%
Net Incomeattributable to IIJ (20.9%)
Income beforeIncome Tax Expense (15.9%)

Consolidated Financial Results for 1Q-3Q FY2014Announced on February 10, 2015

21
Recurring Revenue*(81.2% of 1Q-3Q14 revenue)1Q-3Q14: JPY71,312 million (up 5.1% YoY)3Q14: JPY24,617 million (up 8.3% YoY)
* Represents the following monthly recurring revenues
1. Internet Connectivity Services (Enterprise)2. Internet Connectivity Services (Consumer)3. Outsourcing Services 4. WAN Services5. Systems Operation and Maintenance
One-time Revenue *(15.8% of 1Q-3Q14 revenue)1Q-3Q14: JPY13,859 million (up 8.2% YoY)3Q14: JPY5,146 million (up 4.9% YoY)
* Revenue which is recognized when systems or equipment are delivered and accepted by customers
1. Systems Construction2. Equipment Sales
Ⅱ- 2. RevenuesUnit: JPY millionNetwork Services
ATM Operation BusinessEquipment SalesSystems Integration (SI)
Outsourcing Service
Internet Connectivity Services (Enterprise)
WAN Service
Internet Connectivity Services (Consumer) Systems Operation and MaintenanceSystems Construction
YoY = 1Q-3Q FY14 compared to 1Q-3Q FY13
1Q-3Q FY13: 82,746 1Q-3Q FY14: 87,846FY13: 114,272
26,441 27,956 28,349 31,526 27,552 29,620 30,674

22
1Q-3Q14 Gross MarginTotal Gross Margin: JPY16,448 million
(up JPY930 million, up 6.0% YoY) Gross margin ratio: 18.7%
(down 0.1 points YoY)
Network Service Gross Margin JPY11,031 million
(up JPY493 million, up 4.7% YoY) Gross margin ratio: 21.6%
(up 0.6 points YoY)
SI Gross Margin: JPY4,465 million
(up JPY94 million, up 2.2% YoY) Gross margin ratio: 13.7%
(down 1.3 points YoY)
Ⅱ- 3. Cost of Revenues and Gross Margin RatioNetwork Services
Network Services
Cost of revenues :Gross margin ratio :
ATM Operation BusinessSystems Integration(SI)
Equipment SalesSystems Integration(SI)Total Revenues
Unit: JPY millionYoY = 1Q-3Q FY14 compared to 1Q-3Q FY13
1Q-3Q FY13: 67,229 1Q-3Q FY14: 71,398FY13: 93,206
21,411 22,556 23,262 25,977 22,554 23,713 25,130

23
Internet Connectivity (Enterprise)1Q-3Q14: down JPY211 million, down 1.7% YoY3Q14: down JPY61 million, down 1.5% YoY
• Mobile service revenue continued to increase• Over 1Gbps contracts:As of 3Q14-end: 330 contractsAs of 3Q13-end: 263 contracts
Internet Connectivity (Consumer)1Q-3Q14: up JPY1,356 million, up 30.8% YoY3Q14: up JPY701 million, up 45.5% YoY
• IIJmio mobile service continued to accumulateSubscription (approx.):
3Q14-end: 339 thousand, up 94 thousand QoQ2Q14-end: 245 thousand, up 40 thousand QoQ
Revenue (approx.):1Q-3Q14: JPY2.75 billion, up 1.6 billion YoY3Q14: JPY1.26 billion, up 0.46 billion YoY
Outsourcing Services1Q-3Q14: up JPY356 million, up 2.4% YoY3Q14: up JPY114 million, up 2.3% YoY
• IIJ/GIO Hosting Service is growing but slower YoYdue to decline in demand from game customer
• Revenue decreased from 2Q14 due to termination of large-scale overseas datacenter contract
WAN Services1Q-3Q14: down JPY641 million, down 3.4% YoY3Q14: up JPY21 million, up 0.3% YoY
Ⅱ- 4. Network Services (1)Revenues
Outsourcing ServicesInternet Connectivity Services (Consumer)
WAN Services
Internet Connectivity Services (Enterprise)
Total Contracted Bandwidth (Gbps)
Unit: JPY million
1Q-3Q FY13: 50,301 1Q-3Q FY14: 51,162FY13: 67,286
16,785 16,825 16,691 16,984 16,799 16,896 17,466
YoY = 1Q-3Q FY14 compared to 1Q-3Q FY13QoQ = 3Q14 compared to 2Q14

24
1Q-3Q14 Cost of Network Services: up JPY367 million, up 0.9% YoY 3Q14 outsourcing costs increased from 2Q14 along with the increase in mobile subscription and traffic volume
(MVNO interconnectivity cost is recognized in outsourcing related costs)
Unit: JPY million
Ⅱ- 4. Network Services (2)Cost of Revenues
( ) Gross Margin Ratio
Others
Outsourcing Related Costs
Personnel Related Costs
Network Operation Related Costs
Circuit Related Costs
YoY = 1Q-3Q FY14 compared to 1Q-3Q FY13
1Q-3Q FY13: 39,764 (20.9%) 1Q-3Q FY14: 40,131 (21.6%)FY13: 53,046 (21.2%)
13,242(21.1%)
13,223(21.4%)
13,299(20.3%)
13,282(21.8%)
13,213(21.3%)
13,155(22.1%)
13,762(21.2%)

25
Ⅱ- 5. Systems Integration (SI) (1)Revenues< Systems Construction >
< Systems Operation and Maintenance >
Systems construction revenues 1Q-3Q14 revenue: up JPY859 million, up 7.4% YoY 3Q14 revenue: up JPY141 million, up 3.1% YoY 3Q14-end order backlog: up 6.9% YoY
Continue to accumulate projects with over JPY10 million
Examples of large-scale projects received in 3Q14:• Upgrading network security systems for a media company• Constructing large-scale ticketing system• Renewing a large-scale web system for an online retailer etc.
1Q-3Q14 revenue: up JPY2,589 million, up 14.7% YoY 3Q14 revenue: up JPY1,111 million, up 18.4% YoY
Added RYUKOSHA’s one-month revenue (JPY113 million)
83% of 3Q14 total cloud revenue is recognized in systems operation and maintenance revenues (17% in outsourcing)
Cloud revenue continuously increasing. Revenues from system construction projects which migrated to operation and maintenance phase strongly increased
3Q14-end order backlog: up 23.1%
Unit: JPY million
Order Backlog
Systems Construction Revenues
Systems Operation and Maintenance Revenues※Systems construction’s order
backlog and order received include equipment salesOrder Received
Systems operation and maintenance revenue
5,102 5,364 5,770 5,527 4,377 5,540 6,458
7,988 6,749 5,183 6,704 7,803 6,724 9,487
1Q-3Q FY13: 11,635 1Q-3Q FY14: 12,494FY13: 18,674
1Q-3Q FY13: 17,562 1Q-3Q FY14: 20,150FY13: 23,796

26
Ⅱ- 5. Systems Integration (SI) (2)Cost of RevenuesUnit: JPY million
YoY = 1Q-3Q FY14 compared to 1Q-3Q FY13QoQ = 3Q14 compared to 2Q14
( ) Gross Margin Ratio
Others
Purchasing Costs
Outsourcing Related Costs
Personnel Related Costs
Network Operation Related Costs
1Q-3Q FY13: 24,826 (15.0%) 1Q-3Q FY14: 28,179 (13.7%)FY13: 36,510 (14.0%)
7,350(15.4%)
8,416(15.7%)
9,061(13.9%)
11,684(12.0%)
8,322(12.0%)
9,618(15.7%)
10,239(13.0%)
1Q-3Q14 Cost of SI: up JPY3,353 million, up 13.5% YoYNumber of outsourcing personnel as of Dec. 2014: 948 personnel
(up 132 personnel YoY, up 41 personnel QoQ)SI gross margin decreased in 3Q14 due to a temporary increase
of network operation related costs with the disposal of facility for overseas project (JPY174 million) and the disposal of software for domestic project (JPY46 million)
M&A on Dec. 1, 2014: RYUKOSHA NETWARE Inc. • Engage in human resources outsourcing business• Capital: JPY10 million, Annual revenue: over JPY1 billion • Aim to strengthen our engineering resources to meet growing
demands for system outsourcing projects and to increase cost efficiency by in-housing outsourcing personnel
• Costs and expenses are mostly personnel-related, which are mostly recognized in cost of SI

27
1Q13 2Q13 3Q13 4Q13 1Q14 2Q14 3Q14
4,212(15.9%)
4,254(15.2%)
4,317(15.2%)
4,408(14.0%)
4,641(16.8%)
4,643(15.7%)
4,704(15.3%)
2,269 2,311 2,322 2,353 2,523 2,546 2,818
1Q-3Q14 personnel-related costs and expenses: JPY14.0 billion, up JPY1.2 billion YoY Number of employees and personnel-related expenses increased due to M&A of RYUKOSHA NETWARE Inc.(Dec. 1, 2014) Planning to hire 156 newly graduates in Apr. 2015, which includes 17 for RYUKOSHA and 13 for replacing outsourcing resources
(129 in Apr. 2014, 136 in Apr. 2013, 75 in Apr. 2012)
Ⅱ- 6. Number of Employees
Unit: JPY million
Engineers71%
Sales 17%
Administration 12%
[Employee Distribution]
Contract worker
Full time worker
Personnel related costs & expenses
(% of revenue)YoY = 1Q-3Q FY14 compared to 1Q-3Q FY13
RYUKOSHA NETWARE +264 employees

28
1Q-3Q14 SG&A Expenses/R&D: up JPY1,355 million YoY, up 12.0% YoY Increase in personnel-related, outsourcing-related, rent/relocation expenses, commission payments (recruiting agent fee etc.), and
sales commission expenses (MVNO related) Costs and expenses related to 1H14 headquarter relocation*: approx. JPY0.5 billion (1Q14:JPY0.2 billion, 2Q14: JPY0.3 billion)
*rent, relocation fee, depreciation and disposal of assets 3Q14 SG&A decreased from 2Q14. While advertising and sales commission expenses increased, headquarter relocation related costs
and expenses decreased SG&A related to ATM Operation Business:
3Q14:JPY45.9 million, 2Q14:JPY45.4 million, 1Q14:JPY37.6 million, 4Q13:JPY31.2 million, 3Q13:JPY32.4 million 1,048 ATMs in operation as of Feb. 10, 2015
Ⅱ- 7. SG&A Expenses/R&DUnit: JPY million
( )Sales and Marketing Expenses
General and Administrative Expenses
Research and Development Expenses
% of Total Revenues
YoY = 1Q-3Q FY14 compared to 1Q-3Q FY13
1Q-3Q FY13: 11,307 (13.7%) 1Q-3Q FY14: 12,662 (14.4%)FY13: 15,343 (13.4%)
3,725(14.1%)
3,697(13.2%)
3,886(13.7%)
4,036(12.8%)
4,229(15.4%)
4,259(14.4%)
4,173(13.6%)
1,500(5.7%)
1,537(5.5%)
1,608(5.7%)
1,729(5.5%)
1,829(6.6%)
1,845(6.2%)
1,794(5.8%)
2,115(8.0%)
2,048(7.3%)
2,183(7.7%)
2,202(7.0%)
2,276(8.3%)
2,287(7.7%)
2,266(7.4%)
29
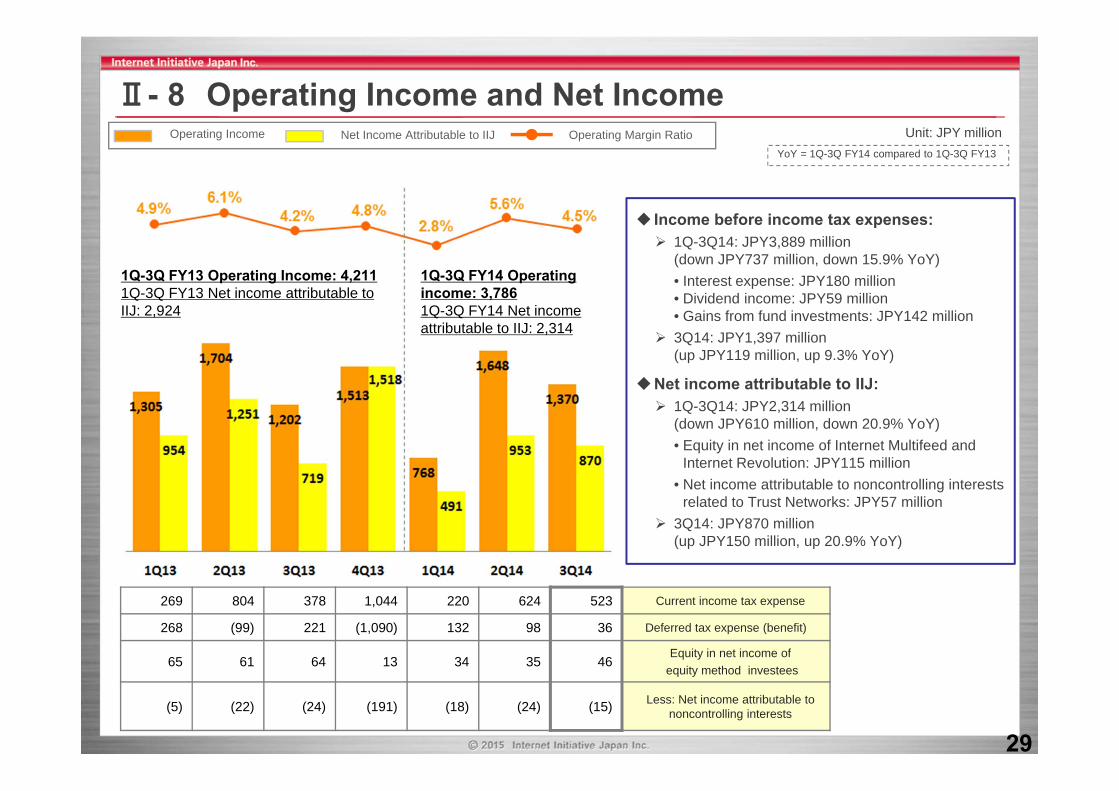
Income before income tax expenses: 1Q-3Q14: JPY3,889 million
(down JPY737 million, down 15.9% YoY)• Interest expense: JPY180 million• Dividend income: JPY59 million• Gains from fund investments: JPY142 million
3Q14: JPY1,397 million (up JPY119 million, up 9.3% YoY)
Net income attributable to IIJ: 1Q-3Q14: JPY2,314 million
(down JPY610 million, down 20.9% YoY)• Equity in net income of Internet Multifeed and
Internet Revolution: JPY115 million• Net income attributable to noncontrolling interests
related to Trust Networks: JPY57 million 3Q14: JPY870 million
(up JPY150 million, up 20.9% YoY)
269 804 378 1,044 220 624 523 Current income tax expense
268 (99) 221 (1,090) 132 98 36 Deferred tax expense (benefit)
65 61 64 13 34 35 46Equity in net income of
equity method investees
(5) (22) (24) (191) (18) (24) (15) Less: Net income attributable tononcontrolling interests
Ⅱ- 8 Operating Income and Net IncomeUnit: JPY millionOperating Income Net Income Attributable to IIJ Operating Margin Ratio
1Q-3Q FY13 Operating Income: 4,2111Q-3Q FY13 Net income attributable to IIJ: 2,924
1Q-3Q FY14 Operating income: 3,7861Q-3Q FY14 Net income attributable to IIJ: 2,314
YoY = 1Q-3Q FY14 compared to 1Q-3Q FY13

30Total IIJ Shareholders’ Equity to Total Assets: 57.7% as of March 2014 and 57.9% as of December 2014
Unit: JPY million
Ⅱ- 9. Consolidated Balance Sheets (Summary)
March 31,2014
December 31,2014 Changes
Cash and Cash Equivalents 22,421 21,047 (1,374)
Accounts Receivable 19,214 17,705 (1,509)
Inventories and Prepaid Expenses (Current and Noncurrent) 7,432 9,834 +2,402
Investments in Equity Method Investees 2,086 2,227 +142
Other Investments 6,356 6,543 +187
Property and Equipment 26,971 28,458 +1,487
Goodwill and Other Intangible Assets 10,309 10,210 (99)
Guarantee Deposits (Current and Noncurrent) 2,727 2,784 +57
Total Assets 103,867 105,829 +1,962Accounts Payable 12,542 11,779 (763)
Income Taxes Payable 1,079 336 (743)
Bank Borrowings (Short-term and Long-term) 10,380 9,400 (980)
Capital Lease Obligations (Current and Noncurrent) 8,356 7,943 (413)
Total Liabilities 43,686 44,240 +554Common Stock 25,497 25,500 +3
Additional Paid-in Capital 35,962 36,001 +39
Accumulated Deficit (2,868) (1,564) +1,303
Accumulated Other Comprehensive Income 1,713 1,720 +8
Total IIJ Shareholders' Equity 59,912 61,264 +1,352

31
Financing Activities 1Q-3Q14 Breakdown YoY Change
Principal payments under capital leases (3,140) (198)
Repayments of borrowings(short and long-term) (980) +30
Dividends paid (1,011) (100)
Investing Activities 1Q-3Q14 Breakdown YoY Change
Purchases of property and equipment (6,569) +659
Payments of guarantee deposits (1,611) (930)
Refund of guarantee deposits 1,559 +1,552
Operating Activities 1Q-3Q14 Breakdown YoY Change
Net income 2,371 (604)
Depreciation and amortization 7,217 +713
Net gain on other non-cash transactions 388 +432
Fluctuation of operating assets and liabilities 35 +3,738
Unit: JPY million
Ⅱ- 10. Consolidated Cash Flows< Operating Activities >
< Investing Activities >
< Financing Activities >
1Q-3Q FY13: 5,732 1Q-3Q FY14: 10,012FY13: 8,787
1Q-3Q FY13: (8,480) 1Q-3Q FY14: (6,318)FY13: (10,203)
1Q-3Q FY13: 12,408 1Q-3Q FY14: (5,131)FY13: 11,382
YoY = 1Q-3Q FY14 compared to 1Q-3Q FY13
32
Unit: JPY million
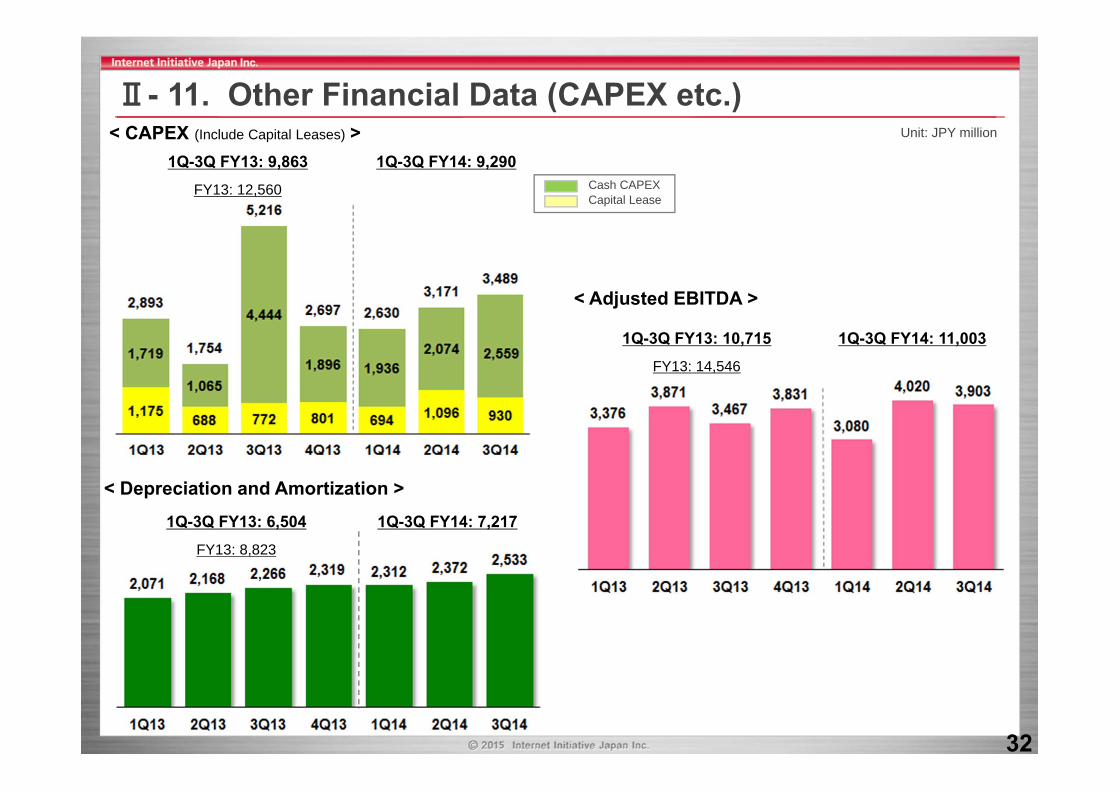
Ⅱ- 11. Other Financial Data (CAPEX etc.)
Capital LeaseCash CAPEX
< CAPEX (Include Capital Leases) >
< Depreciation and Amortization >
< Adjusted EBITDA >
1Q-3Q FY13: 9,863 1Q-3Q FY14: 9,290FY13: 12,560
1Q-3Q FY13: 6,504 1Q-3Q FY14: 7,217FY13: 8,823
1Q-3Q FY13: 10,715 1Q-3Q FY14: 11,003FY13: 14,546

33
Ⅲ-1. Cloud Business DevelopmentsBreakdown of 3Q14 revenue (Unit: JPY billion)Cloud-related revenue (Unit: JPY billion)
180
Dec. 2012900 users
90
Dec. 20131,090 users
210
120
As of Dec. 20141,260 users
270
160
Business Progress Continuously growing and accumulating enterprises’
demand while large game customers’ demand slowing down
Enhance competitive advantage in service qualities to acquire core business systems, accumulating orders of full-scale Cloud migration projects
• Average revenue per customer (excluding large gaming customers) increased by more than 20% from 3Q13
SAP business continues to grow, prospective orders for middle-to large scale projects increasing
FX (Foreign Exchange) transactions increased, contributed to its continuous revenue growth
Continuously developing and introducing new solutions• Solution to prevent unauthorized online banking
remittance for a major Japanese bank, plan to introduce to other financial organizations
• Solution for analyzing and applying Big Data with SAS and ZEAL
• Insurance agency system with Sompo Japan Nipponkoa Insurance Inc.
Expansion of Customer Base and Usage
40 usersMRC over JPY3.0 million:
50 users20 users
Large Game Customers Other Users
1Q-3Q13: 7.19 1Q-3Q14: 8.95 (up 24.5%)
2.29 2.42 2.48 2.64 2.84 2.97 3.14
Junerevenue
0.76
Sep.revenue
0.83
Dec.revenue
0.84
Mar.revenue
0.95
Junerevenue
0.97
Sep. Revenue
1.03
MRC over JPY0.5 million MRC over JPY1.0 million
3Q14 Revenue
3.14 billion
GIO/Component2.12
GIO/Hosting0.53
Task-specific SaaS(FX & POS)
0.41
General purpose SaaS (groupware SaaS etc.)
0.08
Approx. 14% of total Cloud-
related revenue
Dec. Revenue
1.08
3Q14 Cloud revenue recognition: 83% in systems operation and maintenance, 17% in outsourcing

34
Ⅲ-2. MVNO Business Developments
Enterprise• MVNE-related revenue*: JPY0.3 billion (up approx. 20% YoY)MVNO platform business for Panasonic, Canon Marketing Japan etc.Partnership with CATV association going well, Ehime CATV (Dec.
2014), under negotiation with tens of CATV operators
• M2M-related revenue*: JPY0.3 billion (up approx. 40% YoY)Continuously accumulating orders such as temperature
measurement etc. M2M projects tend to take longer to revenue recognition
because of devise development, testing, etc.
Total subscription:552 thousand as of Dec. 2014
unit 1,000
JPY billion
Total Subscription and Revenue IIJmio & IIJmobile Subscription & Revenue
FY112.73
FY122.94
FY134.71
1Q-3Q14JPY5.28 billion(up 54.8% YoY)
Revenue breakdown3Q14: 2.182Q14: 1.641Q14: 1.46
Consumer• Subscription accelerated with:Expansion of sales counters (10 counters as of Jan. 2015)
In addition to urban areas, opened a new store in suburb areaRelease of SIM lock-free devises such as iPhone6, ZenFone5 Competitive new price list from Oct. 2014High customer satisfaction (MMD Labo. etc.)
• MNP-compatible subscription increasingApprox. 50% of 3Q14 net addition were with voice callOver 80% of 3Q14 net addition were via sales partners,
others via direct online sales
Enterprise mobile subscription (exc. MVNE)Consumer IIJmio revenue
Enterprise mobile revenue (exc. MVNE)
Consumer IIJmio subscription
1Q-3Q13JPY3.41 billion
Total Subscription:
As of Sep. 2014: 449 thousandAs of Jun. 2014: 416 thousandAs of Mar. 2014: 384 thousand
YoY: 1Q-3Q FY14 compared to 1Q-3Q FY13
Consumer IIJmio: IIJmio High-speed Mobile/D services
*1Q-3Q FY14 revenue *MVNE-related subscription is included in OEM under Consumer Internet Connectivity Services

35
※ Forward-looking StatementsStatements made in this presentation regarding IIJ’s or managements’ intentions, beliefs,expectations, or predictions for the future are forward-looking statements that are based on IIJ’sand managements’ current expectations, assumptions, estimates and projections about itsbusiness and the industry. These forward-looking statements, such as statements regardingrevenues, operating and net profitability are subject to various risks, uncertainties and otherfactors that could cause IIJ’s actual results to differ materially from those contained in anyforward-looking statement. These risks, uncertainties and other factors include but not limited to:• a decrease of corporate spending or capital expenditure due to depression in the Japanese
economy and/or corporate earnings decreased,• an inability to achieve anticipated results and cause negative impact on profitability,• a possibility that less of reliability for our services and loss of business chances due to
interrupt or suspend of our services,• an excess increase in network rerated cost and outsourcing cost, personnel cost etc,• a possibility to lose business opportunity due to our inadequate resources in personnel and
others,• an increase in competition and strong pricing pressure,• the recording of an impairment loss as a results of an impairment test on the non-amortized
intangible assets such as goodwill,• a decline in value and trending value of our holding securities.
Please refer to IIJ’s filings on Form 20-F of its annual report and other filings with the UnitedStates Securities and Exchange Commission ("SEC") for other risks.
※ Contact Information IIJ Investor RelationsIidabashi Grand Bloom, 2-10-2 Fujimi, Chiyoda-ku, Tokyo, 102-0071, Japan
TEL: 81-3-5205-6500 URL: http://www.iij.ad.jp/en/ir/ E-Mail: [email protected]