internet-based distributed collaborative environment for engineering
TRANSCRIPT
THE UNIVERSITY OF OKLAHOMA
GRADUATE COLLEGE
INTERNET-BASED DISTRIBUTED
COLLABORATIVE ENVIRONMENT FOR
ENGINEERING EDUCATION AND DESIGN
A Dissertation
SUBMITTED TO THE GRADUATE FACULTY
in partial fulfillment of the requirements for the
degree of
Doctor of Philosophy
By
Qiuli Sun
Norman, Oklahoma
2001

INTERNET-BASED DISTRIBUTED
COLLABORATIVE ENVIRONMENT FOR
ENGINEERING EDUCATION AND DESIGN
A Dissertation APPROVED FOR THE SCHOOL
OF AEROSPACE AND MECHANICAL ENGINEERING
By
Kurt Gramoll, Ph.D.
Harold Stalford, Ph.D.
Kuang-Hua Chang, Ph.D.
Zahed Siddique, Ph.D.
David A. Sabatini, Ph.D.

© Copyright by QIULI SUN 2001
All Rights Reserved
iv
Dedicated to
my son, Jerry Sun,
my wife, Shuo Yang,
and my mother, Yufu Tang.
This accomplishment would not have been possible without
the constant support and encouragement of my wife and mother.

v
ACKNOWLEDGEMENTS
I would like to express my sincere appreciation to my advisor, Dr. Kurt Gramoll,
for providing timely support and guidance through my Ph.D. program. I also wish to
thank the members of my advisory committee, Dr. Harold Stalford, Dr. Kuang-Hua
Chang, Dr. David Sabatini, and Dr. Zahed Siddique, for invaluable advice and friendly
support.
I wish to thank all of the folks in the Sooner City project, Dr. Randall Kolar, Dr.
Robert Knox, Dr. Gerald Miller, Dr. Michael Mooney, Dr. Kanthasamy Muraleetharan,
and Dr. Baxter Vieux.
I would like to thank all of my coworkers in Engineering Media Lab, in particular,
Frank Lim, Julia Yew, Ji-Hoon Lee, Karthik Ranga, Kevin Stubblefield, Keith
Adolphson, Adrian Ng, Hai-Shuan Lam, Kian-Huat Tan, Hrishikesh Potdar, Ganesh
Balakrishnan, Te Woei Poon, and Tee Theng Tan, for being sources of advice,
encouragement, and friendship. I wish to thank Dave Dole, who provided a lingo 3D
Engine for noncommercial use. Besides, I want to thank my friends, Qunli Sun and Li
Tan, for their helpful suggestions in time of need.
I would like to acknowledge the National Science Foundation and School of Civil
Engineering and Environmental Sciences for their financial support.

vi
List of Tables........................................................................................................xiii
List of Illustrations ..............................................................................................xiv
Abstract ..............................................................................................................xviii
Chapter 1: Introduction......................................................................................... 1
1.1 Definition of the Need ............................................................................................. 1
1.1.1 The Need for Efficient Utilization of the Internet and Computing Power ........ 1
1.1.2 The Need of Industry ......................................................................................... 2
1.1.3 The Need for Education and Training ............................................................... 5
1.2 Obstacles and Solutions.......................................................................................... 5
1.3 Research Objectives................................................................................................ 7
1.4 Contributions........................................................................................................... 8
1.5 Potential Applications of the Virtual City ............................................................ 9
1.5.1 Potential Applications in Engineering Education.............................................. 9
1.5.2 Potential Applications in Industry ................................................................... 10
Chapter 2: Literature Review ............................................................................. 12
2.1 Distributed Collaborative Design ........................................................................ 12
2.1.1 Distributed Object-based Modeling and Evaluation Framework .................... 12
2.1.2 Discourse Model for Collaborative Design ..................................................... 14
2.1.3 Web-enabled Feature-based Modeling in a Distributed Environment ............ 14
2.1.4 Process-centric Distributed Collaborative Design ........................................... 15
2.1.5 Cybercut - A Web-based Design to Fabrication Tool ..................................... 16
2.1.6 Agent-based Collaborative Design .................................................................. 16
2.1.7 Product Development Management System.................................................... 17

vii
2.1.8 Internet-based Engineering Service ................................................................. 19
2.1.9 Distributed Editing Program and Collaborative Environment......................... 19
2.1.10 Asynchronous Commercial Collaborative Applications ............................... 20
2.1.11 Synchronous Commercial Collaborative Applications.................................. 21
2.1.12 Collaborative Examples in the Engineering Media Lab ................................ 22
2.1.13 Summary of the Survey for Distributed Collaborative Design...................... 23
2.2 Internet-based Education..................................................................................... 24
2.2.1 General Course Administration ....................................................................... 25
2.2.2 Information Delivery ....................................................................................... 26
2.2.3 Virtual Laboratories ......................................................................................... 26
2.2.4 Internet-based Simulations............................................................................... 27
2.2.5 Online Courses................................................................................................. 28
2.2.6 Virtual Universities.......................................................................................... 30
2.2.7 Summary of the Survey for Internet-based Education..................................... 31
Chapter 3: Essential Elements of the Environment.......................................... 32
3.1 Fundamental Elements for Distributed Collaborative Design ......................... 32
3.1.1 Sharing Information ......................................................................................... 32
3.1.2 Natural Communication................................................................................... 33
3.1.3 Manipulation of Design Objects ...................................................................... 33
3.1.4 Database Management ..................................................................................... 34
3.1.5 Generation of Design Documents.................................................................... 34
3.1.6 Intelligence....................................................................................................... 35
3.1.7 Guaranteed Real-time Delivery ....................................................................... 35

viii
3.1.8 Security and Scalability ................................................................................... 36
3.2 Fundamental Elements for Internet-based Engineering Education ................ 36
3.2.1 Interactivity ...................................................................................................... 36
3.2.2 Collaborative Learning .................................................................................... 37
3.2.3 Three-dimensional Visualization ..................................................................... 38
3.2.4 Encouragement of Creativity and Teamwork .................................................. 38
3.3 Implemented Elements in the Virtual City......................................................... 38
Chapter 4: Design of the Virtual City ................................................................ 40
4.1 Introduction........................................................................................................... 40
4.2 Three-dimensional Virtual World....................................................................... 42
4.2 Database Management ......................................................................................... 43
4.3 The Virtual City for Engineering Education...................................................... 43
4.4 The Virtual City for Engineering Design............................................................ 45
4.5 The Virtual City for Engineering Analysis......................................................... 47
Chapter 5: Implemented Technologies of the Virtual City .............................. 50
5.1 HTML and JavaScript ......................................................................................... 50
5.2 Shockwave and Multi-user Server ...................................................................... 51
5.3 VRML .................................................................................................................... 53
5.4 Java and Java 3D .................................................................................................. 54
5.5 Perl ......................................................................................................................... 57
5.6 ASP and SQL......................................................................................................... 57
5.7 SQL Server ............................................................................................................ 59
5.8 Internet Information Server ................................................................................ 59

ix
5.9 Multimedia Applications ...................................................................................... 60
Chapter 6: Framework and Content of the Virtual City ................................. 61
6.1 Three-dimensional Virtual World....................................................................... 61
6.1.1 Design of the Virtual World ............................................................................ 61
6.1.2 Functions of the Virtual World ........................................................................ 63
6.2 Online Database .................................................................................................... 64
6.2.1 Database Requirements.................................................................................... 64
6.2.2 Entity-Relationship Diagram ........................................................................... 65
6.2.3 Database Structure ........................................................................................... 66
6.2.4 Functions of the Online Database .................................................................... 67
6.3 Multimedia Modules............................................................................................. 68
6.3.1 Traffic Engineering.......................................................................................... 69
6.3.2 Steel Structure.................................................................................................. 73
6.3.3 Surveying ......................................................................................................... 76
6.3.4 Foundation ....................................................................................................... 81
6.3.5 Soil ................................................................................................................... 85
6.3.6 Consolidation ................................................................................................... 90
6.3.7 Structural Analysis........................................................................................... 93
6.3.8 Concrete ......................................................................................................... 104
6.3.9 Piping Network .............................................................................................. 108
6.4 Distributed Collaborative Geometric Modeling .............................................. 115
6.4.1 Introduction.................................................................................................... 115
6.4.2 Server-side Application ................................................................................. 115
x
6.4.2.1 Fundamentals of the Internet Used in the Geometric Modeling Module ... 116
6.4.2.2 Multi-user Server ........................................................................................ 117
6.4.2.3 Design of Java Multi-user Server ............................................................... 119
6.4.3 Client-side Application .................................................................................. 120
6.4.3.1 Fundamentals of Computer Graphics Used in the Client-side Application 122
6.4.3.2 Data Structures............................................................................................ 127
6.4.3.3 Implementation Algorithms........................................................................ 130
6.4.3.4 Functions of the Geometric Modeling Application .................................... 131
6.4.4 Uniqueness..................................................................................................... 140
6.4.5 Design Examples ........................................................................................... 141
6.5 Distributed Collaborative Engineering Analysis ............................................. 145
6.5.1 Introduction.................................................................................................... 145
6.5.2 Tetrahedral Elements ..................................................................................... 147
6.5.3 Hexahedral Elements ..................................................................................... 148
6.5.4 Functions of the Engineering Analysis Application ...................................... 154
6.5.4.1 Functions of the Top Toolbar ..................................................................... 154
6.5.4.2 Functions of the Left Toolbar ..................................................................... 155
6.5.4.2.1 Preferences............................................................................................... 156
6.5.4.2.2 Meshing.................................................................................................... 156
6.5.4.2.3 Boundary Conditions ............................................................................... 159
6.5.4.2.4 Forces....................................................................................................... 160
6.5.4.2.5 Computation and Result Reports ............................................................. 161
6.5.4.3 Functions of the Bottom Toolbar................................................................ 162
xi
6.5.5 Design of Internet-based Distributed Collaboration ...................................... 164
6.5.6 Comparison of Computational Results .......................................................... 166
6.5.7 Uniqueness..................................................................................................... 169
6.5.8 An Analysis Example .................................................................................... 170
Chapter 7: Assessment ....................................................................................... 172
7.1 Assessments on the Multimedia Modules ......................................................... 172
7.1.1 Assessment on the Traffic Engineering Module............................................ 172
7.1.2 Assessment on the Structural Analysis Module............................................. 174
7.2 Assessment on the Collaborative Geometric Modeling and Engineering
Analysis Modules ...................................................................................................... 176
Chapter 8: Conclusion ....................................................................................... 180
8.1 Summary.............................................................................................................. 180
8.2 Discussion of the Contributions......................................................................... 182
8.3 Recommendations for the Future Work........................................................... 187
References ........................................................................................................... 189
Appendices .......................................................................................................... 199
Appendix A: HTML Code With JavaScript .......................................................... 200
Appendix B: Lingo Script with the Stack Data Structure .................................... 202
Appendix C: ASP Script for the Dynamic VRML................................................. 205
Appendix D: Java Multi-user Server ...................................................................... 211
Appendix E: Java Multi-user Client ....................................................................... 214
Appendix F: Java 3D for the Engineering Analysis .............................................. 225
Appendix G: Perl Script for the VRML Structure................................................ 234

xii
Appendix H: ASP Script with SQL Statements ..................................................... 237
Appendix I: Homework Assignment of the Third Survey .................................... 240
Appendix J: Survey Questions of the Third Survey.............................................. 241
Appendix K: Opinions about the Implemented Technologies.............................. 242

xiii
List of Tables
Table 6.2.1 Logical Data Structure for the Online Database …………………………67
Table 6.4.1 B-Rep Data Structure…………………………………………………….127
Table 7.1 Survey Questions and Results about the Traffic Engineering Module….…173
Table 7.2 Test Statistics about the Survey on the Traffic Engineering Module………173
Table 7.3 Survey Questions and Results about the Structural Module………………175
Table 7.4 Test Statistics about the Survey on the Structural Module………………..176
Table 7.5 Survey Questions and Results about the Collaborative Modules…………177
Table 7.6 Test Statistics about the Survey on the Collaborative Modules…………...178

xiv
List of Illustrations
Fig. 1.1 Traditional Meeting on Design……………………………………………...4
Fig. 4.1 Three-tier Architecture of the Virtual City…………………………………40
Fig. 4.2 Overview of the Virtual City……………………………………………….42
Fig. 4.3 Distributed Collaborative Design…………………………………………..46
Fig. 5.1 Generation and Management of the 3D Virtual World…………………….54
Fig. 5.2 Internet Technologies………………………………………………………58
Fig. 6.1.1 3D Virtual World…………………………………………………………62
Fig. 6.2.1 ER Diagram for the Virtual City Database……………………………….66
Fig. 6.2.2 Login System of the Virtual City…………………………………………68
Fig. 6.3.1 Information Section of the Traffic Module ………………………………69
Fig. 6.3.2 Traffic Engineering Simulation ………………………………………….70
Fig. 6.3.3 Information Section of the Steel Structure Module………………………73
Fig. 6.3.4 Connection Illustration Using VRML……………………………………74
Fig. 6.3.5 Steel Structure Simulation……………………………………………….75
Fig. 6.3.6 Steel Structure Created by the Steel Structure Simulation………………76
Fig. 6.3.7 Information Section of the Surveying Module……..……………………77
Fig. 6.3.8 Surveying Simulation…………………………………………………….78
Fig. 6.3.9 Information Section of the Foundation Module………………………….82
Fig. 6.3.10 The X Stress Distribution in the Foundation Simulation……………….84
Fig. 6.3.11 Boundary Conditions of the Foundation Simulation……………………84
Fig. 6.3.12 Information Section of the Soil Module………………………………..86
Fig. 6.3.13 Line Load over the Surface of a Semi-infinite Soil Mass………………87

xv
Fig. 6.3.14 Distribution of Net Increase of Vertical Stress under Multiple Loads ……88
Fig. 6.3.15 The Curve of Lateral Pressure on the Retaining Wall under Loads………88
Fig. 6.3.16 The Dam Created by the Soil Simulation …………………………………89
Fig. 6.3.17 Information Section of the Consolidation Module…………………………91
Fig. 6.3.18 Consolidation Simulation………………………………………………….91
Fig. 6.3.19 Information Section of the Structural Analysis Module…………………..94
Fig. 6.3.20 Structural Analysis Simulation ……………………………………………94
Fig. 6.3.21 Preference Window………………………………………………………..96
Fig. 6.3.22 Member Property Window………………………………………………...97
Fig. 6.3.23 Node Displacements of a Truss Structure…………………………………98
Fig. 6.3.24 Member Loads of a Truss Structure………………………………………98
Fig. 6.3.25 Deflection of Members for a Frame Structure…………………………….99
Fig. 6.3.26 Moment Diagram of Members for a Frame Structure…….………………100
Fig. 6.3.27 Influence Line of the Bridge Member…………………………………….100
Fig. 6.3.28 Bridge Application of the Simulation…………………………………….101
Fig. 6.3.29 Information Section of the Concrete Module…………………………….104
Fig. 6.3.30 Concrete Simulation………………………………………………………105
Fig. 6.3.31 Overpass Designed by the Concrete Simulation…………………………107
Fig. 6.3.32 information Section of the Piping Network Module……………………..108
Fig. 6.3.33 Loop Searching Algorithm………………………………………………110
Fig. 6.3.34 Flow Rates and Directions………….……………………………………112
Fig. 6.3.35 System Curve and Pump Curve………..………………………………..113
Fig. 6.3.36 Piping System Deposited in the 3D Virtual World……………………...114

xvi
Fig. 6.4.1 Internet Four-layer Model………………………………………………..117
Fig. 6.4.2 Function of the Multi-user Server…..……………………………………118
Fig. 6.4.3 Shockwave Movie for Creating the 3D Wireframe Model………………121
Fig. 6.4.4 Java Applet for Shading the 3D Model.………………………………….122
Fig. 6.4.5 Perspective Projection………………….…………………………………126
Fig. 6.4.6 Parallel Projection……………………………..…………………………126
Fig. 6.4.7 Data Structure Used for Representing a Solid……………………………128
Fig. 6.4.8 Stack Data Structure………………………………………………………129
Fig. 6.4.9 Menu Levels of the Geometric Modeling Simulation…………………….132
Fig. 6.4.10 Pop-up Window for Retrieving Geometric Files………………………...133
Fig. 6.4.11 Pop-up Window for Saving Geometric Files…………………………….134
Fig. 6.4.12Buildings Designed by the Geometric Modeling Application……………134
Fig. 6.4.13 YZ View of the Bolt……………………………………………………..136
Fig. 6.4.14 3D Model Generated by ‘Revolution’ Operation………………………..138
Fig. 6.4.15 Interface for Java Applet of the Geometric Modeling Application……..139
Fig. 6.4.16 Preference Window……………………………………………………...140
Fig. 6.4.17 Dimensions for the Bolt…………………………………………………142
Fig. 6.4.18 Bolt in Wireframe………………….…………………………………….142
Fig. 6.4.19 Shaded Bolt………..………………….………………………………….143
Fig. 6.4.20 Bracket in Wireframe……………………………………………………143
Fig. 6.4.21 Shaded Bracket…………………………………………………………..144
Fig. 6.4.22 Clip in Wireframe………………………………………………………..144
Fig. 6.4.23 Shaded Clip……………………………………………………………....145

xvii
Fig. 6.5.1 Client-side Applet for Engineering Analysis……………………………...146
Fig. 6.5.2 Tetrahedral Element……………………………………………………….147
Fig. 6.5.3 Linear Hexahedral Element……………………………………………….148
Fig. 6.5.4 Interface of the Engineering Analysis Application………………………..153
Fig. 6.5.5 Window for File Importing………………………………………………..155
Fig. 6.5.6 Preference Window………………………………………………………..156
Fig. 6.5.7 Element Number Dialog Window…………………………………………157
Fig. 6.5.8 Boundary Condition Window……………………………………………..159
Fig. 6.5.9 Input Window for Point Forces…………………………………………...160
Fig. 6.5.10 Progress Bar………………………………………………………………161
Fig. 6.5.11 Results Report…………………………………………………………….161
Fig. 6.5.12 Post-Processing Combo Box……………………………………………...162
Fig. 6.5.13 Color Representation of z Stresses………………………………………..163
Fig. 6.5.14 Beam Example Used to Check the Results……………………………….167
Fig. 6.5.15 Stress Results Using Brick Elements in ANSYS…………………………167
Fig. 6.5.16 Stress Results Using Tetra Elements in ANSYS…………………………169
Fig. 6.5.17 Retaining Wall with Boundary Conditions and Forces…………………..170
Fig. 6.5.18 Meshes of the Retailing Wall……………………………………………..171
Fig. 6.5.19 Summary of the Computational Results…………………………………..171
xviii
Abstract
The expanding use of the Internet has provided tremendous possibilities for
engineering education as well as engineering design and analysis. With the use of the
Internet, new approaches can be adopted to teach engineering concepts, and distributed
collaborative engineering design and analysis become possible. This research investigates
the use of the Internet for engineering education, design, and analysis through the
presentation of a Virtual City environment.
The main focus of this research was to provide an infrastructure for engineering
education, test the concept of distributed collaborative design and analysis, develop and
implement the Virtual City environment, and assess the environment’s effectiveness in
the real world. A three-tier architecture was adopted in the development of the prototype,
which contains an online database server, a Web server as well as multi-user servers, and
client browsers. The environment is composed of five components, a 3D virtual world,
multiple Internet-based multimedia modules, an online database, a collaborative
geometric modeling module, and a collaborative analysis module. The environment was
designed using multiple Internet-based technologies, such as Shockwave, Java, Java 3D,
VRML, Perl, ASP, SQL, and a database. These various technologies together formed the
basis of the environment and were programmed to communicate smoothly with each
other.
The online database was designed to manage the changeable data related to the
environment, because it is an efficient approach to save, delete, retrieve, and search data.
The virtual world was used to implement 3D visualization and tie the multimedia
modules together. Students are allowed to build segments of the 3D virtual world upon
xix
completion of appropriate undergraduate courses in civil engineering. The end result is a
complete virtual world that contains designs from all of their coursework and is viewable
on the Internet. The environment is a content-rich educational system, which can be used
to teach multiple engineering topics with the help of 3D visualization, animations, and
simulations. Each multimedia module can be used to teach one specific engineering topic.
The concept of collaborative design and analysis using the Internet was
investigated and implemented. The key elements of collaboration, such as sharing
information, communication, and manipulation of design objects, are integrated into the
environment. Geographically dispersed users can build the same geometric model
simultaneously over the Internet and communicate with each other through a chat room.
They can also conduct finite element analysis collaboratively on the same object over the
Internet. They can mesh the same object, apply and edit the same boundary conditions
and forces, obtain the same analysis results, and then discuss the results through the
Internet.
Three assessments were conducted over a period of three semesters. Four modules
were evaluated in the assessment: traffic engineering, structural analysis, collaborative
geometric modeling, and collaborative engineering analysis modules. The results were
analyzed statistically, which demonstrates that the environment is helpful in engineering
education and design.
The research has led to the development of an Internet-based software
environment for engineering education and design. It is the first Internet-based prototype
integrating 2D simulations and 3D visualization in one environment. In addition, it is the
first collaborative framework for engineering education. It is also the first Internet-based
xx
application that can be used to conduct 3D finite element analysis collaboratively with
original considerations of implementation altogether. Nine multimedia modules were
developed, and each contains multiple unique features. For example, the user can use the
structural analysis module to define the truss and frame structures intuitively and
conveniently by drawing individual members. The modules can be used to encourage
learning about specific engineering topics. Multiple Internet-based technologies were
seamlessly integrated to form the basis of the prototype. The customized 3D virtual
worlds are generated using Perl, ASP, VRML, and the online database. Shockwave and
Perl talk to each other to create new virtual objects. Shockwave and Java communicate
smoothly to allow the user to design geometric models collaboratively. Standard stack
data structures were simulated by the list data structures of Lingo to solve the
management problem of the channels efficiently in Shockwave. Essential elements about
distributed collaboration and Internet-based engineering education were discussed. The
Virtual City is open to the public at www.vcity.ou.edu.

1
Chapter 1: Introduction
The expanding use of the Internet has provided tremendous possibilities for
engineering education as well as engineering design and analysis. New approaches can be
adopted to teach engineering concepts with the help of the Internet. Internet-based
simulations, online collaborative learning, and virtual worlds are three applications
available among the many possibilities. In addition to engineering education, the ubiquity
of the Internet has made distributed collaborative engineering design and analysis
possible. Geographically dispersed engineers will be able to complete design and analysis
tasks jointly through the Internet. The research investigates the use of the Internet for
engineering education, design, and analysis through the presentation of a Virtual City
environment. The Virtual City environment is proposed because both industry and
engineering education need prototype applications with efficient utilization of the Internet
and computing power. The environment is open to the public at www.vcity.ou.edu.
1.1 Definition of the Need
1.1.1 The Need for Efficient Utilization of the Internet and Computing Power
The Internet is a matrix of individual networks that connects computers around
the world. Computers with Internet access must have globally unique Internet Protocol
(IP) addresses. IP addresses are hierarchical, which makes it easy to route information
and access computers with specific IP addresses. Due to its omnipresence, the Internet
can be used to distribute information easily to the public. In contrast, individual networks
may run in local environments without IP configurations and be open only to specific
2
users. Hence, this research systematically examines the use of the Internet for engineering
education, design, and analysis.
Bandwidth and quality of service offered by the Internet are current major
concerns along with connectivity. However, with the introduction of new networking
technologies, such as wave division multiplexing, bandwidth concern will become less of
a problem. The networking industry has already been able to reach a transmission rate of
three terabits per second over a single fiber [1]. New Internet technologies, e.g. IP version
6, multicasting, and quality of service, are being developed [2, 3]. Many technical
problems associated with the existing Internet will therefore vanish. A large number of
new Internet-based applications will be needed to utilize the power of these new
technologies efficiently. Internet-based engineering education and distributed
collaborative engineering design and analysis are two paradigms among many possible
applications.
Not only are Internet technologies improving, but processor speeds are also
continuing to increase. It is reported that the maximum processor speed will be
approximately 12 GHz by 2005 if Moore’s law holds for three more 18-month cycles [3].
This is because numerous new technological innovations, such as advanced product
manufacturing techniques and next-generation microprocessor architectures, are being
adopted by the computer industry. In order to use the computing power efficiently, new
applications will also need to be developed.
1.1.2 The Need of Industry
Industry needs these new applications to address a number of problems. One
important industrial problem is that an individual engineer or a single company will not
3
be able to complete an entire design task alone as engineering design becomes
increasingly complex and international competition grows. To introduce a product into
the market in a timely fashion, concurrent engineering must be used to coordinate product
development that involves designers from different departments in the same company, as
well as from different companies. Because approximately 80% of a product’s life-cycle
development cost is driven by decisions made in the first twenty percent of the program
effort, concurrent engineering encourages early supplier involvement and even inclusion
of outside partners [5]. Early key decision-making should be supported by experts from
important suppliers and outside partners due to the complexity of the products and the
reliance on special technologies. Besides concurrent engineering, collaborative
engineering is another concept used in product development. It emphasizes team-based
exchange of useful engineering information to create a shared understanding [6]. The
creation of a shared understanding among team members is essential. Only after a shared
understanding is achieved can the team members address common problems successfully.
There are numerous immediate benefits of collaborative engineering, such as better
communication among team members, more shared understanding, faster team decisions,
and improved respect for cross-functional team mates. Long-term paybacks include
shortened development cycles, lowered development costs, improved product innovation,
and increased product quality. Industry has actually realized the importance of online
smooth collaboration. For example, Bill Gates of Microsoft said in an email sent to
developers and IT professionals that he envisioned an online world where constellations
of Internet-based services could collaborate seamlessly [104].

4
The designers and experts are often geographically separate and it is almost
impossible to move them all to the same working location. Traditionally, meetings, faxes,
and phones are used to coordinate design work (Fig. 1.1). These methods can cause
misunderstandings, delay of information transfer, and design conflicts, because complete
product design information is not accessible to designers and experts when needed.
Systems currently available on the market implement only some features of both
concurrent and collaborative engineering by transmitting the modified digital model and
its viewpoints between different computers. The modified digital model is then updated
on each connected computer, which gives the users the impression that they are working
on the same model [7]. It is therefore essential to design an Internet-based environment
that can support the key concepts of both concurrent and collaborative engineering.
Fig. 1.1 Traditional Meeting on Design

5
1.1.3 The Need for Education and Training
Educational institutions also need these new applications to address their unique
problems. As student populations increase, universities face the challenge of maintaining
high standards and effective education [8]. This is particularly true in the resource-
intensive engineering field. In industry, technological innovations are taking place every
day. Engineers and technicians must always continue learning in order to master new
technologies. Hence, efficient and inexpensive methods must be found to complement
traditional education and training. One solution is to use the Internet with its advantages
of low cost, convenience, and collaboration. Currently, an increasing number of people
have realized the importance of Internet-based education. For example, on November 16,
1999, John Chambers of Cisco delivered a keynote address to a Comdex audience at Las
Vegas. In his address, he described taking advantage of e-learning, calling it the “second
wave” of the Internet [9]. Through e-learning, employees will have life-long learning
opportunities, through which they will be able to learn whatever they want when they
need it. However, Internet-based education is still in its infancy. One of the obstacles to
Internet-based education is a lack of infrastructure and content-rich applications [9, 10].
1.2 Obstacles and Solutions
In order to reach the goal of concurrent and collaborative engineering, research is
being conducted continuously; however numerous obstacles exist with current research.
The first obstacle to achieving the goal is a lack of available homogeneous computer
resources. Computer systems often vary among different companies, various departments
in a single company, and even among different working groups in a single department.
Difficulties in realizing distributed design over so many computer systems are obvious.

6
Research has focused on how to coordinate these computer systems into one distributed
design environment.
The second barrier to reaching the goal is that it is difficult to implement 3D
visualization of design objects over many computers at the same time. For this reason,
current stand-alone 3D applications work only on local machines. There is no
communication among them.
The third obstacle is network bandwidth. Small network bandwidth makes large
data exchange slow and difficult, and frequent large data exchange is necessary in a
distributed collaborative design environment. However, with the development of Internet
technologies such as Virtual Reality Modeling Language (VRML), Java, Java 3D, IP
version 6, and quality of service, it has become possible to develop a real distributed
collaborative environment that can run on heterogeneous computer systems. This is
because Internet technologies have been designed for distribution over multiple
platforms. For example, by using VRML and Java 3D, it is possible to implement 3D
visualization in a distributed design environment with multi-user capability. Bandwidth
concern will become less of a problem as Internet bandwidth is continuing to grow. The
delivery of high-definition video data over the Internet2 has already been successfully
tested [2].
Institutions of higher education were one of the first to adopt the Internet as a tool
for education because of its ease of use, inexpensive cost, and fast speed of access. Much
research has been done in this area [36, 42]. However, most of the research has focused
on individual courses. Few have provided prototypes from the point of engineering
education where collaboration is important, and therefore most existing applications are
7
separate entities. A solution to these problems is to use Internet technologies to design a
environment with rich content for engineering education that supports 3D visualization,
interactivity, design, and analysis.
1.3 Research Objectives
The Virtual City environment has been developed to utilize the increasing
bandwidth and computing power efficiently by addressing both the educational and
industrial problems. This Internet-based framework is a collaborative educational
environment. It was designed to teach multiple engineering topics with the help of 3D
visualization, animations, and simulations. An Internet-based 3D virtual world was
implemented with a true 3D perspective that allows the users to avoid the high cost of
actually building the design, which is impractical with many engineering projects such as
large buildings and complex machines. Students are allowed to build segments of the 3D
virtual world corresponding to appropriate undergraduate courses in civil engineering.
The end result is a virtual world that includes designs from all of their coursework. The
virtual world is viewable on the Internet. An online database was designed to manage the
changeable data used in the Virtual City. Nine multimedia modules were developed for
specific engineering topics. These modules are highly interactive, because they used the
graphic representations as input and output. The students can learn the engineering topics
by exploring the modules. The multimedia modules are connected together by the 3D
virtual world. Generated 3D structures can be deposited in the virtual world. Three
assessments were conducted and analyzed to determine the effectiveness of the Virtual
City environment.
8
The Virtual City environment can also be utilized as a test bed to conduct
engineering design and analysis collaboratively over the Internet. Geographically
dispersed users can build the same geometric model and communicate with each other
simultaneously. Likewise, they can conduct finite element analysis collaboratively on the
same object over the Internet. They can mesh the same design object, apply the same
boundary conditions and forces, obtain the same analysis results, and discuss the results
through a chat room. With the help of the collaborative environment, the amount of travel
imposed on engineers, when they are located in different working sites, can be reduced.
The flexibility of selecting engineers for design projects can therefore be increased.
In summary, the objectives of this research are as follows:
• To provide a content-rich infrastructure for engineering education
• To test the concept of distributed collaborative design and analysis
• To develop the Virtual City framework
• To assess its effectiveness in the real world
1.4 Contributions
This research has led to the development of an Internet-based Virtual City for
engineering education, design, and analysis. It is the first Internet-based prototype
integrating 2D simulations and 3D visualization in one environment. In addition, it is the
first collaborative framework for engineering education. It is also the first Internet-based
application that can be used to conduct 3D finite element analysis collaboratively with
original considerations of implementation. Nine multimedia modules with unique
features have been developed. They can be used to encourage learning about specific
engineering topics. Generic modules, such as the structural analysis module and piping
9
network modules, were designed to encourage creativity by minimizing restriction on the
user’s input. Multiple Internet-based technologies have been seamlessly integrated
together to form the basis of the prototype. They were programmed to communicate
smoothly with each other. The customized 3D virtual worlds are managed efficiently by
the online database. A few unique programming techniques were also employed, for
example, using the list data structure to simulate the function of the stack data structure.
The importance of essential elements of distributed collaboration was discussed, and the
key elements, such as information sharing and manipulation of design objects, were
implemented in the environment. Finally, three assessments were conducted to evaluate
the effectiveness of the Virtual City. Statistical data show that the Virtual City was
helpful in engineering education and design, as discussed further in Chapter 8.
1.5 Potential Applications of the Virtual City
1.5.1 Potential Applications in Engineering Education
Due to the increasing Internet bandwidth and computing power, the idea of the
Virtual City can be extended to design virtual products for the purpose of engineering
education in the future. To obtain a mechanical engineering degree, the student usually
needs to take numerous courses, such as statics, dynamics, and mechanics of materials,
and machine design. Through careful organization, the student could integrate the
knowledge from respective courses to design multiple meaningful parts that could be
assembled together to form a virtual product. After the virtual product is designed, a
virtual manufacturing module could be used to test the manufacturability of product
parts. In detail, a virtual prototyping module could be used to build a complete prototype
assembly with geometric models of individual parts. This module could check feasibility
10
of assembly operations and perform static and dynamic simulations. Finally, a virtual
factory module could be used to simulate the complete production procedure of that
product. If something were to go wrong with the product, the user could redesign the
products.
The main purpose in designing a virtual product is that the user can learn
engineering topics by building individual virtual parts, testing manufacturability, and
making the products in a virtual factory. As the whole procedure would be modeled after
the methods industry uses to design real products, practicing engineers and students could
learn valuable knowledge in this virtual environment. Although the whole system as
envisioned seems particularly complicated, it should be less sophisticated than its
industry-level counterparts. It could be highly efficient, because this Internet-based
system could reach tremendous numbers of practicing engineers and students. Finally this
model could be the basis of a virtual university for engineering education.
1.5.2 Potential Applications in Industry
In addition to a virtual university, the idea of the Virtual City also has potential
applications in industry, especially in engineering. Because the Virtual City is a 3D world
with a true perspective, it can be used for city planning. City designers in different
locations can work collaboratively with the same view of the 3D city model.
Traditionally, design engineers and manufacturing engineers usually have
difficulty in communicating, because current CAD/CAE/CAM products are individual
programs, even though they are used extensively. Because design engineers and
manufacturing engineers usually work in different places, they cannot easily show each
other their 3D models and drawings. It is common for design engineers to go to factories

11
to work with manufacturing engineers. However, the need to do so is expensive and
imposes large amount of travel on engineers. It is even more expensive if sales people
and outside experts are also involved in the product development. However, if the
CAD/CAE/CAM products implements the idea of the Virtual City, it is possible to reduce
the amount of travel imposed on people involved in the product design as well as to
shorten development cycles. This is because the idea of the Virtual City is to allow
geographically dispersed individuals to collaborate over the Internet.
There are two ways to provide traditional CAD/CAE/CAM products with
distributed collaborative features. One way is rewrite the internal code of these products.
Another way is to design an engine that sits between the internal code of
CAD/CAE/CAM programs and their interface in order to transmit data. The latter way is
a more reasonable solution to add distributed collaborative capabilities to existing
CAD/CAE/CAM products, because rewriting the internal code is expensive and time-
consuming. No matter which method is chosen, mainstream CAD/CAE/CAM products
will implement the idea of the Virtual City to provide distributed collaborative
capabilities in the future.

12
Chapter 2: Literature Review
A large number of papers on the distributed collaborative design and Internet-
based education have been published. Numerous commercial products are also available
on the market. The following is a discussion of the previous works conducted on
distributed collaborative design and Internet-based education.
2.1 Distributed Collaborative Design
Research on distributed collaborative design falls into two categories. The first
one attempts to offer theoretical models such as distributed object-based modeling and
evaluation framework. As theoretical models are based on numerous assumptions, it is
usually difficult to implement them. The second category of research tries to implement
the idea of distributed collaboration in a practical way, such as web-enabled feature-
based modeling, Cybercut, and OneSpace.
2.1.1 Distributed Object-based Modeling and Evaluation Framework
Senin, Pahng, and Wallace, et al. proposed a distributed object-based modeling
and evaluation (DOME) framework for product design [11, 12, 13, 14, 15]. The basic
goals of DOME are intended to link distributed design modules, aid designers in
evaluating the system performance with different design alternatives, seek optimal
solutions, and make design decisions. The key assumption of DOME is that product
design problems can be decomposed into sub-problems. The sub-problems are modeled
as modules containing their own sub-problems or internal design details. Each module
has an interface that provides and obtains services from other modules. The product
design can be realized by assembling the modules and by coordinating the services

13
among the modules. As the design problem is subdivided into several modules, these
modules can be designed in a distributed environment. They are able to exchange design
information using a standard network communication protocol. In order to find the
optimal solutions for the design problem, optimization methods such as genetic
algorithms are used to help the designer make better decisions when design alternatives
are possible.
The advantages of DOME are knowledge encapsulation of the module, distributed
activities and design resources, trade-off analysis, and decision support. Because each
module uses an interface to exchange information with other modules, expert knowledge
and know-how are encapsulated in the module. This protects the intellectual property of
the owner of the module. The product design problem is decomposed into sub-problems,
which makes the distributed activities possible. The optimization method is integrated
into DOME, which provides trade-off analysis and decision support.
Although DOME is reported to have numerous advantages as mentioned above,
disadvantages do exist in DOME. The first disadvantage is that extensive effort is
necessary to decompose the product problem. In order to exchange services, each
module must have a standard interface. This is not easy because engineers in different
companies separately design each individual module. The second disadvantage is that
difficulty exists in dealing with circular dependencies of modules. The third disadvantage
is that DOME assumes the modules are generated in a heterogeneous computer
environment using specialized software tools. This creates problems with the smooth
flow of information among modules.

14
2.1.2 Discourse Model for Collaborative Design
Case and Lu proposed a discourse model used in software environments that
provides automation support for collaborative engineering design [16]. Their model treats
interactions between designers as a process of discourse. In this model, design
commitments are considered as options, subject to review and revision by other
designers. The model includes both structural and process specifications. A blackboard-
based workspace of the structural specifications integrates frames, constraints, semantic
networks, and libraries of sharable design objects, software agent modules, an electronic
mail system, and a virtual workspace language based in part on the Knowledge Query
Manipulation Language. Components of the process include specifications for identifying
agent interest sets, applying state transformations to the design model, switching design
contexts, finding conflicts between designers, and keeping track of resolved conflicts.
The discourse model is capable of managing a large complex design project
requiring the collaborative efforts of a number of individuals. It also has the capability to
detect unexpected conflict areas automatically among designers. Finally, it allows all
interested designers have an opportunity to participate in the resolution of conflicts via
conflict detection, rationalization, and resolution protocol. However, agents could not be
sent into the working place of other users to act as design advisors and critics in real-time
[16].
2.1.3 Web-enabled Feature-based Modeling in a Distributed Environment
Lee, Kim, and Han proposed a prototype to implement web-enabled feature-based
modeling in a distributed environment [17]. The prototype was implemented in a
server/client architecture, in which a feature-based solid modeling kernel worked as a

15
server to perform most of the modeling, and a client worked as an interface to conduct
graphical rendering and navigation and issue modeling requests. Multiple clients can
connect the server at the same time. The server was implemented in C++, and the client
was developed using Java and Java 3D. Common Object Request Broker Architecture
(COBRA) was chosen as a communication protocol between the server and the client. No
synchronous collaboration was implemented.
2.1.4 Process-centric Distributed Collaborative Design
In addition to web-enabled feature-based modeling, Kim, Lee, and Han proposed
a prototype called Process-centric Engineering Design WorkSpace (PEDWorks) for
distributed collaborative design [18]. PEDWorks deals with the collaboration of
multidisciplinary design teams who are geographically dispersed. PEDWorks uses
server/client architecture, which contains server-side applications such as a process
controller, a design board, a communication server, and a CAD server, as well as client-
side applications. Process flow graphs are used to represent complicated design problems.
Design teams share design processes and critical design information. The processor
controller monitors design conflicts and dependency. If a design conflict occurs, the
process controller notifies the related designers. In PEDWorks, a collaborative
conference can be requested to discuss the design problem synchronously. The
participants of the collaborative conference communicate by text, audio, or video. They
can load the same geometric model into their client computer from the database.
However, no real-time manipulation of the same geometric model is supported. The
client-side applications only talk with the server, and no peer communication is
implemented.

16
2.1.5 Cybercut - A Web-based Design to Fabrication Tool
Cybercut is an Internet-accessible and computerized machining service system
developed at the University of California at Berkeley [19, 20, 21, 22]. Currently, it
provides Internet-based services such as design-for-manufacturing CAD, Computer
Aided Process Planning (CAPP), and access to an open architecture machine tool for
fabrication of mechanical parts. The client’s computer is responsible for distributed
geometric modeling and CAPP. The design and process information are transferred into a
machine tool for fabrication. Three levels of agents - design agent, planning agent, and
fabrication agent - are utilized to exchange information between design, planning, and
fabrication.
Cybercut provides a ‘parts-on-demand’ service for mechanical parts, and allows
rapid fabrication technology to be accessible by anyone with a web browser and an
Internet connection. However, in order to manufacture parts designed by the user on a
milling machine, a feature-based, constrained destructive solid geometry design
environment is adopted. The user cannot build up the part from “nothingness”, and the
user must start a prismatic stock to remove certain shapes of material, referred to as
“features”. This is a practical way to solve fabrication problems at the beginning of
design, but it restricts the design freedom of the user.
2.1.6 Agent-based Collaborative Design
An agent is a special autonomous software entity that is able to reason and thus
achieve a specific goal. Agents can interact with each another, exchange data, and keep
track of information. The agent technology can aid distributed engineering design.
Toshiki Mori and Mark Cutkosky proposed an agent-based prototype implementation in

17
the design of a portable CD player [23]. The agent interface was written in Java, which
makes it possible for geographically dispersed design teams to communicate over the
Internet.
The basic procedure of an agent-based collaborative design is as following. First,
designer A creates part 1 of an assembly and publishes part 1. Designer B creates part 2
of the assembly and publishes part 2. Second, the design agent detects geometric
interferences between part 1 and part 2, and sends warnings to the specific designers.
Third, designer A modifies part 1 in an effort to eliminate the interferences and publishes
the modified part 1. Fourth, the design agent finds no inference between modified part 1
and part 2. Fifth, designer B decides to change part 2 and then publishes the changed part
2. Finally, the design agent suggests that designer A reject modified part 1 and accept the
original part 1.
One advantage of the agent-based collaborative design is that agents can track and
respond to changes in the state of the design. A designer however has to publish a new
design model in order for agents to trigger actions. In this case, it is difficult to achieve
real-time collaboration for agent-based design.
2.1.7 Product Development Management System
To share CAD information seamlessly across an enterprise, major CAD suppliers
have introduced a software system called product development management [24, 25, 26].
This software system extends CAD data not only to non-design departments of
companies such as analysis, tooling development, manufacturing, testing, quality control,
sales, and marketing, but also to suppliers and partners of these companies. The goal is to
shorten product development cycles and streamline product design. The major product

18
development management systems include Windchill from Parametric Technology
Corporation, MetaVPDM from SDRC, ENOVIAvpm from IBM and Dassault Systems,
ProductVision from Unigraphics Solutions, and OneSpace from CoCreate. Airbus, Sony,
and Lockheed-Martin are among the early adopters [27, 28].
The product development management system centers on managing CAD
information in a systematic way and sharing CAD information among design
departments, non-design departments, and partners. Most of such existing systems are
web-centric [29]. For example, Windchill’s end-users in engineering, manufacturing, and
other departments begin by going to the company’s product information home page. Via
hyperlinks, search engines, and applets, the end-users can navigate to work areas and
product information. In this way, the end-users can always obtain the most current
product information. Windchill uses a three-tier architecture - an Oracle 8 database as the
foundation, Java object servers as middleware, and a browser on top.
The product development management system partially implements the idea of
distributed collaborative design since synchronous collaborative geometric modeling and
engineering analysis are not the focus of the system. The management system usually
centers on asynchronous collaboration. For example, Windchill offers capabilities such as
publishing product information, viewing product information, and collaboration
notification. In particular, to view product information, a viewer can be used to display
3D models or 2D drawings for investigation, manipulation, and markup. The publishing
and notification capabilities guarantee communication and notification of critical factors
in product development, which allows product development teams to make better design
decisions quickly and bring the products to the market faster.

19
2.1.8 Internet-based Engineering Service
With the growth of the Internet, an increasing number of manufacturing
companies publish their product information on the Internet. In order to help the
customers such as designers and other manufacturers obtaining desirable product
information, Internet-based companies are established to provide sophisticated online
search services that are able to find product components based on the customers’
specifications [30]. Other efforts are made to link individual web pages to form a
knowledge database, which provides search tools to find the solutions for a specific
problem [31].
Another good example of Internet-based engineering services is offered by Inpart
[32]. Inpart’s DesignSuite consists of a library of 3D models of standard mechanical
components for well-known suppliers, which is accessible for a fee via the Web. This is
particularly beneficial to product design because mechanical products compose of
numerous standard parts and components. Instead of creating the 3D models of the
standard parts and components by themselves, the users can directly use the 3D models
from Inpart, which can reduce designers’ geometric construction work tremendously. To
generate creative ideas and reduce product design time, companies such as Seagate are
starting to use the Internet and teleconferencing to link different located design centers to
form a virtual design center [33]. In this case, it is not necessary to move intellectual
resources to one location and the cost of design is reduced consequently.
2.1.9 Distributed Editing Program and Collaborative Environment
Many Internet-based games are popular because of their multi-user capability.
Game technologies can also be used in developing distributed collaborative environment.

20
One example is a distributed editor called SimulEdit created at CIT, which allows people
in different locations to edit the same document using the Internet [34]. This editor
supports peer-to-peer communication using Java on the Internet. Changes made by one
person are immediately visible to everybody. Another example is Sieve, which is a
prototype Java-based collaborative environment for constructing visualization
interactively [35]. In this environment, multiple users can simultaneously construct and
manipulate a data-flow network in real-time. The environment supports flexible
collaboration by providing real-time information about participants’ actions and locations
in the workspace. Since Sieve was created using Java, it can run in the user’s browser.
2.1.10 Asynchronous Commercial Collaborative Applications
Currently, numerous asynchronous collaboration applications, also known as
groupware or teamware, are available on the market. HotOffice, Lotus Domino/Notes,
Agillion, and Microsoft Exchange 2000 server are the most common ones [68, 69, 70].
Although different applications may have different features, they usually use client/sever
architectures and offer a private Web site on which the authorized users can share files,
schedule meetings, and post messages on an internal level. One of the advantages of these
collaborative applications is that they alleviate the heavy use of e-mail as a
communication method. Other advantage is that they can let people collaborate even if
they are not available at the same time. AutoCAD 2000i is another recent product that
can publish product information on the Internet using images in DWF or JPEG format
[71]. However, as the name implies, asynchronous tools are not real-time collaboration,
and in the case of AutoCAD 2000i, the objects are not actually built and edited on the
web.

21
2.1.11 Synchronous Commercial Collaborative Applications
The purpose of synchronous collaborative applications is to let the users remain at
their current locations and share information with each other. Not only are documents
shared but also applications. Lotus SameTime is an example of a general-purpose real-
time collaborative application that offers text chat, whiteboard, and application sharing
[68]. Alibre Design explores the possibilities of using the Web as a collaborative tool in
the product design field [72]. The heart of Alibre Design is a 3D parametric feature-based
solid modeler, which can execute individually or execute and connect a design server and
a repository server. A popular three-tier architecture is used to develop the whole system
of Alibre Design. Both synchronous and asynchronous collaboration features are
integrated in the system. The user can use local processor power to design parts and save
them on local machine, and team members can collaborate in real time if needed. Another
feature of Alibre Design is that it uses Application Service Provider model to conduct
business, which is on subscription basis.
OneSpace from CoCreate is another example that uses the Internet to provide
collaborative services to the product design [101]. The OneSpace collaboration system
consists of a server and multiple clients. The collaboration server has a solid modeling
kernel to hold the 3D geometric product models and takes care of communication
between clients. The clients can trigger an upload of data into the OneSpace server for
real-time viewing, inspection, conferencing, markup, and collaborative editing of the 3D
model. The clients were designed using Java and benefited from Direct Model, a high-
performance graphics framework from Hewlett-Packard. One promising feature of
OneSpace is that it records the collaboration notes such as discussion, decisions, reasons

22
for making changes, and ideas to investigate further along with the geometric models.
The collaborative notes are particularly valuable because they capture the knowledge
associated with the design. They may be reviewed later by the same designers or other
engineers.
Synchronous collaboration is particularly useful when a critical design decision
needs to be made by several geographically dispersed engineers. Because it allows
engineers to discuss, review, and inspect the same design object simultaneously, design
decision can be made quickly with the support of experts in different areas. One purpose
of this research is therefore to investigate the concept of real-time collaborative geometric
modeling and engineering analysis.
2.1.12 Collaborative Examples in the Engineering Media Lab
To help with collaborative learning, a multi-user Painting and Drawing Board was
developed in engineering media lab using Director Multi-user [73]. The basic idea of the
board is to use Director Multi-user Server, which routes data between multiple drawing
boards. The main feature of the drawing board is that when a couple of users use the
board in different locations, they can see each other’s drawing. For example, when one
user draws a box on the board, every other user sees the box immediately on their board,
no matter where they are. Another feature is that the users can chat with each other while
using the board. The drawing board is useful when several people discuss an engineering
topic that needs a drawing to help understand the topic.
To assist students in solving statics problems jointly, a Truss Solver was
developed using multi-user technology [73]. With the Truss Solver, geographically
dispersed users can work and discuss on the same truss problem. The steps of solving the
23
truss problem and its results are visible to every user, which implements the concept of
collaborative learning and teamwork among students through the use of Internet.
In addition to helping with collaboration among students, the multi-user
technology can also be used in industry. The Factory Layout Planner is an example that
allows geographically dispersed engineers to work together on the same project through
the Internet [73]. Along with multi-user capability, the planner employs VRML to
demonstrate the 3D layout of the factory. The dispersed users not only share the 2D
layout, but also the 3D layout using VRML through the Internet. This is particularly
efficient when numerous users are working on the same layout and a lot of discussion
happens. Similar to the drawing board, the Factory Layout Planner offers a chat room for
the users to discuss the layout. The planner partially implements the idea of distributed
collaborative design. This is because the planner does not allow the users to design new
geometric objects and the users can only choose built-in geometric objects of the planner.
2.1.13 Summary of the Survey for Distributed Collaborative Design
From the above literature review, it is known that although work has been done in
this field existing environments are still in their infancy. Current collaborative
environments usually use the classical server/client architecture and have a powerful
geometric modeling kernel sitting on the server. The functions of clients are quite limited
and used mainly for displaying the models. This architecture therefore imposes high
traffic between the server and clients. Although analysis is as importance as design, no
research has been done on distributed collaborative engineering analysis.
This research proposed and implemented a different strategy, which can
significantly reduce the network traffic between the server and the clients. Although the
24
server/client architecture is still used, the task of geometric modeling is moved from the
server to the clients. The server only takes care of the communication. The clients have
the full capabilities to generate geometric models. Only a small amount of data is
transmitted over the Internet in each operation. This is because the transmitted data is not
the resultant geometric model, but related multiple commands. This research also
developed the first collaborative environment for 3D finite element analysis over the
Internet. The analysis environment takes the output of the design environment as its
input. Both work smoothly together. Another important feature of the prototype is that it
can export the geometric models into the 3D virtual world. The virtual world can
therefore be built dynamically.
2.2 Internet-based Education
In addition to conducting the design of real products over the Internet,
engineering education can also use the ubiquitous nature of the Internet. To answer how
the Internet will affect the traditional higher education, a study sponsored by the
California Education Round Table was performed [36]. Based on this study, it is believed
that the Internet and the World Wide Web will play multiple important roles in the higher
education. These roles include improving learning and teaching, improving the creation
of instruction and learning materials, creating educational communities, competing with
new educational providers, and adding policy and planning issues of the higher
education. Because of these potential advantages, universities are not the only leading
forces in the development of the Internet infrastructure technologies, but also are one of
the first to adopt these technologies for educational purposes. Soon after the creation of
the Web, universities started to employ it as a teaching tool to educate students and

25
provide training services to the public. The industry also utilizes the power of the Internet
to deliver training services. Learning companies, such as DigitalThink and Mentergy,
offers e-learning solutions to clients, including custom courseware development, step-by-
step consulting, and development and delivery tools [102, 103]. Learning companies have
moved beyond universities in the sense of their offered services. A large number of
papers have been published to address the issues of Internet-based education. Numerous
ways have been used by universities or learning companies to provide Internet-based
education and training, such as general course administration, information delivery,
virtual laboratories, Internet-based simulations, online courses, and virtual universities.
2.2.1 General Course Administration
Currently, the web is utilized as a general course administration tool by almost
every university. It has been used as an electronic way to distribute the course
information such as syllabi, information on lecturers and teaching assistants, course
description, reading lists, homework, and homework solutions. Many colleges, such as
the College of Engineering at the University of Oklahoma, provide course-page templates
for faculty use [37]. The templates provide an easy way for those professors who are not
familiar with HTML to create course pages. The Virtual Classroom Interface (VCI) of the
University of Illinois at Urbana-Champaign is another example, which provides
templates to simplify the creation and administration of course web pages [38]. Its main
objective is to automate the production process of course web pages and to reduce the
effort of faculty members. At Case Western Reserve University, students are able to
register for courses using the web to directly access Case’s mainframe student
information system [39].

26
2.2.2 Information Delivery
The web is an efficient way to deliver a large amount of information, such as
online textbooks and other course materials. These web-based textbooks are similar to
traditional textbooks. In addition to texts, the online textbooks usually also offer audio
clips, video clips, simulations, and relevant links. Another advantage is that keyword
searches are provided in these electronic books. The multimedia textbooks offered by the
virtual hospital of the University of Iowa is a good example [40]. A hyper textbook
written by Kenneth R. Koehler offers an overview of physics for students of biology and
chemistry [41]. The first edition of this hyper textbook has already been translated into
Japanese. A web-based database of course materials in computer architecture is being
developed at North Carolina State University [42]. At the University of Oklahoma,
manuals covering the use of Oracle databases are placed on the Web so that the students
taking the database course can access them.
2.2.3 Virtual Laboratories
Virtual laboratories can be set up over the Web to resolve the problem of
accessing expensive or dangerous experimental apparatuses such as laser devices, robots,
and CNC (Computer Numerical Control) machines. Jack and Karlesky at Grand Valley
State University developed a virtual manufacturing laboratory, which allows students to
access robots, CNC machines, DAQ (Data Acquisition) cards, and other equipment using
the web [43]. The students use the virtual reality devices to explore the equipment. They
then simulate the program on a virtual robot. After they believe the program is functional,
they can upload the program to the real robot and use a video link to monitor the robot.
Pniower and Ruane, et al. at Boston University also designed web-based experiments to

27
allow both local and remote users to conduct laboratory explorations using physical
experimental apparatuses over the web [44]. In these experiments, users are able to
transfer the data to the apparatuses, control the apparatuses, and observe the progress of
the experiments employing a live video link.
2.2.4 Internet-based Simulations
Although it is generally agreed that the use of simulations in engineering
education is beneficial to students, simulations are not widely used due to the relatively
small target user groups, the cost of development, and distribution problems. With the
introduction of the Internet technologies, these problems can be minimized.
An example of Internet-based simulations is “Mallard” which was developed by
Mike Swafford and Donna Brown at the University of Illinois at Urbana-Champaign
[45]. The Mallard environment uses several Java applets to teach freshmen electrical and
computer engineering courses at the University of Illinois at Urbana-Champaign. Within
the environment, students can do homework, and obtain immediate feedback about their
solutions. Students can also conduct the design of assembly code. Two interactive Web-
based applications called Virtual FlyLab and Virtual Earthquake were developed for
learning science [46]. An innovative use of Internet technology for education is to
employ VRML to teach design over the Internet. Ranga and Gramoll successfully
implemented two Internet-based design examples with the help of Practical Extraction
and Reporting Language (PERL) [47]. Another creative example is to use Java and
VRML in teaching machine kinematics [48]. Traditionally, machine kinematics was
taught using drafting tools. With the introduction of computer graphics and the Internet, it
becomes more efficient to use these technologies to demonstrate concepts of machine
28
kinematics visually in 3D models. Multiverse is a paradigm providing a standard
interface for various Internet-based simulations [49, 50, 51] that facilitate the use of
Internet-based simulation in education and training by employing Java and Web
technologies.
2.2.5 Online Courses
As the web provides unprecedented flexibility and multimedia capabilities to
deliver course materials, online courses are available for both on-campus and off-campus
students [52, 53]. At the University of Oklahoma the basic statics class was taught using
laptop computers, CD-ROMs, and the web [54]. The statics CD-ROM was used for main
course content, which was supplemented with web-based material such as homework,
examples, quizzes, solutions, and lectures. The lectures were videotaped, compressed into
a streaming video format, and placed on the server. After the lecture was presented,
students were able to access the video within one day. Using a wireless network card, the
students were able to view the lectures on the web. This allowed them to attend class
virtually anywhere on campus and provided the flexibility of learning on their own
schedule. At the University of Tennessee, the graduate level finite element course was
offered as a live, video-streamed lecture course over the web [55, 56]. Distance and off-
campus local students as well as on-campus students were able to access the course
materials. They were connected via a chat room and emails. Lam and Gramoll [57], and
Chambers [58] presented their experiences of using video streaming technology to
produce online courses. To minimize course delivery difficulty for distance education,
the Georgia Institute of Technology recently utilized the Internet as a new delivery way
to present online courses to remote students [59]. Compared to videotapes that were

29
employed previously, the online courses allowed rapid distribution and were free from
the problems generated by different video standards through the world. WebCT is a
commercial tool that is widely used and provides a systematic framework to produce
online courses [60].
Besides online courses for students, the Internet can also be used to provide the
online review for general users. The Fundamental of Engineering Review project at the
University of Oklahoma is another new paradigm that uses the web as a way to deliver an
online review [61]. The purpose of the project was to provide a flexible, easily accessible,
cost-effective, and interactive review package with the integration of multimedia
technologies such as graphics, animations, audio, video, and simulations. In this online
review, not only are basic topics reviewed but also there are the online exams with
problems. These problems are randomly generated so that the problems are different each
time the user takes the online exam.
To investigate the effectiveness of the online courses, research has also been
conducted. David R. Wallace and Philip Mutton compared the effectiveness of web-
based lecture and classroom-based lecture [62]. Their results showed that students who
used the web-based lectures performed better than students who took the classroom-base
lectures. Although the experiment was only on one topic, it rejected the hypothesis that
the two groups should perform equally. In another experiment that was also conducted by
David R. Wallace, the performance of two groups of students was investigated [63]. The
first group prepared for class using web-base materials and then received a traditional
class-based lecture that reviewed the topics in the class. The second group prepared for
class using the same web-based materials and then worked with the lecturer, applying
30
only a small portion of the subject in illustrative examples. After this, the students of
these two groups completed an assignment. The average grade performance of the first
group was 10.8% higher than that of the second group. The experimental finding suggests
that traditional classroom time might be used for higher value-added activities such as
mentoring and experiential activities if well-organized course materials are primarily
delivered using the Web. At the University of Missouri-Rolla, the effectiveness of an
online graduate engineering management course was investigated [64]. The results
showed that nearly 58% students believed that taking online course was a more or
significantly more effective learning experience. Although little documentation of the
effectiveness of web-based courses is available and more research is needed to identify
why web-based courses help learning, it does show that the web needs to be taken
seriously as a effective tool to help students learn.
2.2.6 Virtual Universities
To expand the use of the online courses, virtual universities were established to
offer educational services. Virtual Online University Services International, Inc.
(VOUSI), a Virtual Corporation operating as a Corporate University, offers professional
development and interactive education [65]. Athena University is a non-profit virtual
university administered by VOUSI and offers undergraduate and graduate programs in a
fully online and interactive environment. Magellan University is another virtual
university that offers online courses in liberal arts and business [66]. The Virtual
University of Michigan State University refers to courses offered through the Internet and
other technologically enhanced media [67].

31
2.2.7 Summary of the Survey for Internet-based Education
Although the educational activities over the Internet are diverse, no existing
educational environment can meet the requirements of 3D visualization, collaborative
learning, and the encouragement of creativity and teamwork. These requirements are
essential in education, especially in engineering education. A large number of simulations
were designed, but they were only for individual courses. No content-rich prototype was
developed from the viewpoint of engineering education.
The proposed research includes the development and implementation of a
content-rich environment for engineering education. Multiple simulations were
developed for specific engineering topics. They were tied together by the 3D virtual
world. Each simulation can be used to deposit a specific 3D structure in the virtual world.
For instance, the simulation of structural analysis can be used to create a bridge, and the
bridge can be deposited in the virtual world. Collaborative learning, and the
encouragement of creativity and teamwork are achieved through the collaborative design
and analysis environment. Users in different locations can discuss a design problem
through the use of the Internet. Furthermore, three assessments were conducted to
evaluate the effectiveness of the environment. For example, 17 students used the
collaborative design and analysis environment to finish an assignment of optimizing the
weight of a beam subject to the stress. A survey was conducted afterwards and its data
were analyzed statistically.

32
Chapter 3: Essential Elements of the Environment
3.1 Fundamental Elements for Distributed Collaborative Design
To develop a collaborative environment for engineering design and analysis, it is
important to identify its fundamental features derived from the expectations of the end
users. Different researchers may have different viewpoints, but this research focuses on
the discussion of essential features, such as sharing information, natural communication,
manipulation of design objects, database management, generation of design documents,
intelligence, guaranteed real-time delivery, security, and scalability.
3.1.1 Sharing Information
It is vital for authorized users to share the latest information and access the
previous information in a distributed design environment [74, 75, 76]. Design
information not only includes text descriptions of current design status but also
engineering information such as 3D models, engineering drawings, and analysis results.
In engineering design, the sharing of 3D models is particularly important because it is the
best way to present the design objects. Since the design objects are continuously being
updated while the design is going on, the environment should ensure that the users
always obtain the latest design information. If the users want to review a previous
version, they should also be able to access it seamlessly. Also, to decrease Internet
response time, it is critical to share commands instead of the full generated data. It is not
efficient to transmit large volumes of generated data over the Internet to update each
remote computer, but a command is small, which can be used to generate the data on the
local computer using the local CPU.

33
3.1.2 Natural Communication
Since design is essentially a collective work that requires many individuals to
work together, it is important that a distributed environment is capable of helping users
work collaboratively. Collaboration is the core concept of concurrent engineering and the
heart of team-based design [5, 6, 77]. To complete a design, negotiations among
participants need to take place continuously. As the designers are geographically
dispersed, the environment needs to create a naturally collaborative environment in which
each authorized participant can communicate with each other without obstacles [78, 79].
For synchronous collaboration, it is ideal to provide a face-to-face virtual world where
the participants can interact as if they were in the same room. For example, the
participants in the virtual world can point to the same design object with verbal and
nonverbal communication. Because different regions are in different time zones, it is also
important to allow the user to communicate asynchronously.
3.1.3 Manipulation of Design Objects
To collaborate efficiently in a synchronous way, the collaborative design
environment should not only create a virtual world for natural communication but also
provide the capability for participants to manipulate the same design object
simultaneously [79]. Whether the design object is a 3D model or a 2D drawing, when one
of the participants is manipulating the design object other dispersed participants should
see the action of the manipulation. If someone else makes a change to the design object,
others should see it immediately on their own computers. This is an essential feature for
synchronous collaboration.
34
3.1.4 Database Management
A database-management system (DBMS) should also be used to record design
information and keep the latest and previous design and specifications [75, 80, 81]. There
are numerous reasons for using a DBMS. First, a DBMS does not have concurrent-access
anomalies. This is important because many users may access the data at the same time.
Second, it can remove data redundancy and inconsistency. In a distributed multi-user
environment, it is unwise to keep multiple working copies of the data, because what starts
as the same data may disagree over time. Third, a DBMS can reduce the difficulty in
accessing data. As the database keeps all of the latest information related to the design,
the user can obtain any information from the database efficiently and conveniently. Also,
the user can search the database for specific information, which includes documents
regarding critical design decisions, specifications, and analysis results. Fourth, using a
DBMS, it is easy to enforce security constraints on different users compared to a
conventional file-processing system. Finally, it can ensure data transaction to be atomic,
which means the data transfer must happen in its entirety or not all.
3.1.5 Generation of Design Documents
As many participants may work on the same design object, the environment
should automatically record who makes the change when changes occur [82, 83]. When a
critical design decision is made, the environment should remind the participants to
provide the reasons supporting this design decision. This design document should be
stored along with other design document and 3D models as a part of the design object.
This is extremely helpful when a design object needs to be redesigned or a similar design
needs to be completed in the future. In this case, future designers can search information

35
of similar designs. There is no need for them to spend time in tracking related documents.
Carefully generated design documents will encourage reusing the design knowledge and
increase the productivity of the designers.
3.1.6 Intelligence
A distributed design environment should be an intelligent design support system
[76, 79, 80, 83]. Due to the distribution of the participants, the environment should be
able to automatically process routine work such as notifying all of the interested
participants when a critical change happens to a design object. The environment should
guarantee that this notification is read by all of participants in time. If someone disagrees
with the change, a meeting should be scheduled through the use of the collaborative
environment. The core argument should be recorded along with the design object for
future review. As design knowledge is routinely captured, the environment should be able
to provide knowledge support to the designer when similar designs are available. If
knowledge support of the environment is efficient, the development cycle of products can
be shortened.
3.1.7 Guaranteed Real-time Delivery
A distributed collaborative environment is a real-time application, which is
different from traditional data applications such as Telnet, FTP, and Web browsing. This
requires the quality of service from the Internet to be high so that lag time is minimized
[93]. The packets sent should reach their destinations in a specified time interval, for
instance, 100 ms. This also requires that Internet to promise guaranteed packet delivery
since it is unacceptable for packets sent by one user not to reach their destinations.

36
Currently, the Internet only implements a best-effort service model, which tries its best to
deliver the packets but without any guarantee. The Internet with necessary quality of
service may be available in the near future [93].
3.1.8 Security and Scalability
In a distributed design environment, privileges should be limited to needs of the
users [71]. Some should be only allowed to view the general information such as the
outer shape, while others should be allowed to see the detailed design. Data transferred
over the Internet should be protected carefully to prevent sensitive information from
being compromised [80]. Security strategy is critical to the success of distributed design
environments, because no company will adopt a distributed environment that does not
protect sensitive information sufficiently. As the number of the participants is constantly
changing, a distributed design environment should allow scaling while maintaining an
acceptable level of performance [81].
3.2 Fundamental Elements for Internet-based Engineering Education
Ideally, the fundamental elements for Internet-based engineering education should
include interactivity, collaborative learning, 3D visualization, and encouragement of
creativity and teamwork. This is because with these key elements Internet-based
engineering education is more effective. The following sections will discuss how these
elements associate with the Internet-based engineering education.
3.2.1 Interactivity
Interactivity helps students better understand course materials presented on the
Internet by allowing students to explore engineering concepts [45, 49, 50, 51]. An

37
Internet-based educational environment should not present just the course materials using
text, graphics, sound, and video. It should also provide interactive simulations in which
students can explore what they have learned in classes and obtain immediate feedback.
For example, when students are learning to compute the deflection of frame structures, it
would be particularly helpful if students can draw frame structures, apply forces,
determine the deflection, and then compare their solutions with computational results. If
their original solutions disagree with the computational deflection, the students can
investigate why their solutions are incorrect. In this case, interactivity helps students
grasp deflection calculation of frame structures.
3.2.2 Collaborative Learning
Just as collaboration is essential in the process of product development,
collaborative activities are also important in the learning process [84, 85, 86, 87]. An
Internet-based educational environment should allow dispersed students to study together
while taking Internet-based courses. For example, when a student is unable to solve a
statics problem using the learning environment, a teaching assistant should be able to
show the student the procedure through drawings and explanations. When the teaching
assistant draws a structure and applies a force, the student needing help can see each step
as the solution progresses, not just the final diagram. Collaborative learning is
particularly beneficial to students taking distance courses, because it is difficult for these
students to meet and discuss the course problems.

38
3.2.3 Three-dimensional Visualization
The best way to be successful in demonstrating engineering concepts, especially
in mechanical and civil engineering, is to use 3D models illustrating engineering concepts
[88, 89, 90]. Through 3D visualization, complex concepts can be explained without a lot
of words. Students can also obtain a direct impression of the 3D models, which is even
more useful if 3D models can be changed and created by the students.
3.2.4 Encouragement of Creativity and Teamwork
An Internet-based educational environment should not only present the course
materials but also should inspire creativity and encourage teamwork [91]. The creative
work done by students should be published in the educational environment where other
students can see it. An Internet-based educational environment should encourage team
spirit, because teamwork is the core idea of concurrent engineering in product
development. In such an environment, dispersed students should be able to discuss and
work on group projects synchronously or asynchronously, and therefore complete the
projects jointly.
3.3 Implemented Elements in the Virtual City
Generating design documents, intelligence, guaranteed real-time delivery,
security, and scalability are not the focus of this research. This is because generation of
design documents and intelligence are usually the research focus of design support
systems while security issues and scalability as well as quality of service are in the realm
of computer science. The Virtual City focuses on sharing information and manipulation
of design objects as they impacts engineering design and analysis. Communication is
39
achieved by providing real-time text-based discussion. Natural communication is not
considered because it requires expensive hardware and a high Internet bandwidth. A
database is used to manage the data of the Virtual City. These features can combine to
create a shared understanding of the design object in a distributed collaborative
environment.
Since an Internet-based distributed collaborative environment also supports
interactivity, collaboration, 3D visualization, and teamwork, it is particularly suitable to
use it as an engineering educational environment. The Virtual City contains nine
interactive multimedia modules to emphasize the interactivity. The modules simulate
specific engineering concepts and are seamlessly integrated into the Virtual City through
the use of a 3D virtual world.

40
Chapter 4: Design of the Virtual City
4.1 Introduction
The Virtual City is a framework for engineering education, collaborative
geometric modeling, and collaborative engineering analysis. It provides an Internet-based
engineering educational environment with rich content, and it allows dispersed users to
perform geometric modeling and engineering analysis jointly through the use of the
Internet. The architecture and layout of the Virtual City are discussed in the following
paragraphs.
Online DatabaseServer
Web Serverand Multi-user Server
Clients’ Browsers
Internet
Fig. 4.1 Three-tier Architecture of the Virtual City

41
A three-tier architecture is employed in the development of the Virtual City (Fig.
4.1) that contains an online database server, a Web server with multi-user servers, and the
clients’ browsers. Volatile information is managed by the online database management
system. The Web server works as middleware to take data from clients and store the data
in the database. It also retrieves data from database and presents the data to the clients.
Static information, such as description of engineering topics, is stored directly on the
Web server. The multi-user servers manage the communication between clients and are
independent from the Web server. As no dedicated computer was available to hold the
online database when the Virtual City was implemented, the Web server, the multi-user
server, and the online database server are located in the same computer. However, the
concept of implementation is still the same as the three-tier architecture.
The actual Virtual City is composed of five components: a 3D virtual world, the
Internet-based multimedia modules, an online database, a collaborative geometric
modeling module, and a collaborative engineering analysis module (Fig. 4.2). A key
component of the Virtual City is the 3D virtual world that contains various structures.
These structures are created and deposited by corresponding multimedia modules that
make up the second component of the Virtual City. Different multimedia modules are
tied together by the 3D virtual world. Each multimedia module covers a specific
engineering topic. A SQL database is utilized to manage volatile information such as user
account information and design information. The collaborative geometric modeling
module can be used to design simple structures that are deposited into the 3D virtual
world. The collaborative engineering analysis module is a natural extension from the
geometric modeling that can read data from the geometric modeling module, conduct

42
typical 3D finite element analysis, and display the stress results in color, all over the
Internet.
A 3D Virtual World(Virtual City)
Fig. 4.2 Overview of the Virtual City
4.2 Three-dimensional Virtual World
The Virtual City implements an Internet-based 3D virtual world with a true 3D
perspective. Students are allowed to build segments of the 3D virtual world upon
completion of appropriate undergraduate courses in civil engineering. The end result is a
complete virtual world that contains designs from all of their coursework, for example, a
highway system, bridge, dam, building, or steel structures. The virtual world is viewable
on the Internet and can be navigated by anyone over the web. The 3D virtual world is the
key to the Virtual City and ties all of the other components together.

43
4.2 Database Management
The Virtual City uses an online database management system to manage all of the
volatile data. This is because it is more efficient to save, update, and delete data in the
database than in the text files. The changeable data include data of user accounts, data of
team accounts, and data of generated structures in the 3D virtual world. To use the
Virtual City, each user must provide necessary information to create an account, such as
user account name and password. After creating an account in the database, the user can
log into the Virtual City, explore the multimedia modules, create structures, and deposit
them into his/her own 3D virtual world. Only an authorized user can log into his/her own
individual account that contains his/her private 3D virtual world. In order to use the
collaborative geometric modeling and engineering analysis modules, a shared team
account must be created in the database. The team members can then log in the team
account and use the geometric modeling module, the engineering analysis module, and
multimedia modules. In the team account, only one shared copy of the 3D virtual world is
stored but the number of structures in the shared 3D virtual world can be constantly
changing, because structures can be designed, constructed and deleted.
4.3 The Virtual City for Engineering Education
One of the main purposes of the Virtual City is for use in engineering education;
therefore it also focuses on interactivity, 3D visualization, collaborative learning, and
inspiring creativity and encouraging teamwork. Interactivity is achieved by developing
multiple multimedia modules that cover numerous engineering topics. In general, each
multimedia module has two subsections. One is an information subsection that explains a
specific engineering topic, and the other is a simulation that is designed to allow the user

44
to explore the topic. The user is expected to study the information subsection and related
materials carefully before they start exploring the simulation since the simulation
assumes that the user has a basic knowledge of the particular topic. Flexible interactivity
is always the central design concept of the simulations. The user can modify multiple
parameters, and draw a truss structure, frame structure, or cross section as input
information. The results of the simulation are then presented using animation, graphics,
contours, and tables. Another key design concept of the simulation is intuitive interface,
because ease of use is a required element for any product.
Three-dimensional visualization is difficult to implement over the Internet
because of heterogeneous computer systems. However, it is vital to let the user see and
work with 3D models in engineering education. Due to the introduction of VRML and
Java 3D, it has become possible to present 3D models through the Internet. In the Virtual
City, an Internet-based 3D virtual world is utilized to offer a central location to manage
various 3D structures created by different multimedia modules. Structures in the 3D
virtual world such as buildings, steel structures, bridges, highways, and dams are
generated from different multimedia modules. The 3D virtual world therefore ties all of
simulations together in one environment.
Collaborative learning and teamwork are difficult to integrate into the design of
an Internet-based engineering educational environment, because server-side and client-
side applications need to work together. However, as one of the main research objectives
of the Virtual City is to implement a truly distributed collaborative environment,
teamwork and collaborative learning are key functions of the Virtual City.
45
Inspiring creativity is always essential in engineering education. Generic modules
are designed to achieve this. For example, the structural analysis module provides a
generic truss/frame simulation that can perform analysis of any simple or complex truss
and frame structure. The user can draw any kind of topological structure and apply any
kind of valid boundary condition. The results can be obtained using finite element
analysis. Minimizing the restriction on the user’s input is one way to encourage
creativity. The collaborative geometric modeling module is another example that allows
the user to create flexible design objects and deposit them into a 3D virtual world.
4.4 The Virtual City for Engineering Design
The Virtual City is not only for engineering education but it can also be used for
engineering design. The collaborative geometric modeling module is capable of sharing
information, communication, and manipulation of design object, which are key elements
for a distributed collaborative environment.
In general, the geometric modeling module is a simple CAD program that
provides a generic general-purpose 2D drawing tool, 3D operations such as extrusion and
revolution, and a rendering tool. However, it is different from traditional tools, because
its internal design supports multi-user capabilities. Users in the same team can work on
the same geometric object in different locations. Real-time information sharing and real-
time manipulation of the same design object were implemented. Because it is difficult to
implement natural communication features such as video over the current Internet due to
the bandwidth limitation, only a real-time text-based chat room was developed for
communication with this basic prototype.

46
Online DatabaseServer
Multi-user Serverand Web Server
Internet
Designer A(California)
Designer B(Oklahoma)
Designer C(Michigan)
Fig. 4.3 Distributed Collaborative Design and Analysis
The collaborative geometric modeling module works as follows. Let’s assume
there are three designers in a design team. Designer A is in California; Designer B is in
Oklahoma; Designer C is in Michigan (Fig. 4.3). First designer A and B log in the design
environment. Designer A draws a line and Designer B sees it immediately; Designer B
draws another line and thinks the location of first line is not good enough and moves the
first line; then Designer A sees changes Designer B has made. Designer C then logs into
the design environment, and joins the work of other two. Designer C immediately sees
the work-in-progress from the other two designers. The main idea is that only one copy of
the file is kept and the designers share the same design object. If Designer A disagrees
with designer C, he can communicate with designer C through a chat room. After the

47
cross section is finished, it can be extruded to obtain a 3D object. Then Designer C feels
that it is difficult to produce this part and wants to discuss it with his peer designers. He
rotates the object and his peer designers immediately see the part rotation on their own
screen. Then they can discuss the production problem while viewing the object from the
same point of view.
4.5 The Virtual City for Engineering Analysis
The same concept of distributed collaboration can be extended to engineering
analysis. Similar to geometric modeling, the key elements to distributed collaboration
such as sharing information, communication, and manipulation of design objects were
implemented in the engineering analysis module.
The engineering analysis module is a CAE program that can conduct typical finite
element analysis and visually demonstrate the computational results. The difference
between the engineering analysis module and traditional CAE programs is that the
module is Internet-based and supports multi-user features. This is the first engineering
analysis tool to implement distributed collaboration. When in the investigation stage, this
type of analysis tool was not found to have been developed by any other researchers. The
engineering analysis module can import the geometric data generated by the geometric
modeling module and display it in wireframe. The user then can specify the material
properties and units for the imported geometric model. Automatic meshing was
developed to prepare the data input for finite element analysis. The user can assign the
number of elements associated with three edges to perform meshing. After the meshing is
over, boundary conditions, point forces, and/or distributed forces can be applied. Two
kinds of elements were used in the engineering analysis. One is a tetrahedral element and

48
the other is a hexahedral element. The user can select the preferred element. The last step
is to conduct computation and check the visual results or read the result report.
The engineering analysis module is just a prototype to demonstrate the concept of
collaborative engineering analysis. It is not simply a full, commercial finite element
program. One of its limitations is that it can auto-mesh only geometric objects with six
faces since the auto-meshing of an arbitrary geometric object was not implemented.
To illustrate how distributed collaboration works in the engineering analysis
environment, let’s assume there are three engineers in an analysis team. Engineer A is in
California; Engineer B is in Oklahoma; Engineer C is in Michigan (Fig. 4.3). First
Engineer A and B log into the environment and start the applets. Through a chat room,
Engineer A discusses with B which file they need to work on together. Engineer B then
loads the target geometric data file into her applet, and the same file is loaded
immediately on the applet of Engineer A. Engineer A decides to assign the number of
elements along three edges and perform automatic meshing to the geometric object. The
meshing is propagated to the applet of Engineer B, and Engineer B sees the meshes.
However, Engineer B thinks the meshing is not good and discusses it with Engineer A.
Engineer B then deletes the previous meshing and conducts her meshing. The deletion
and new meshing are propagated back to the applet of Engineer A. Engineer C then logs
into the environment and starts the applet. As they all log into the same team account,
Engineer C immediately sees the work-in-progress from the other two engineers. After
they finish working on the boundary conditions and forces, one of them starts the
computation and the computation command is propagated to the other two engineers’
applets. All of them obtain the same computational results, and they are able to discuss

49
the results by visually sharing the same viewpoint. For example, say, Engineer C wants to
discuss von Mises stress with the other two engineers. He selects the von Mises
distribution on his applet. The other two engineers instantly see the same demonstration
on their own screens. If Engineer C wants to investigate the analysis by himself, he can
temporally leave the team. In this case, any action by other two engineers will not be
propagated to him, and his behavior will not affect the analysis conducted by the other
two engineers. Engineer C is disconnected from other two engineers. If Engineer C joins
the team again, he will lose whatever is on his applet and obtain a copy of the work-in-
progress of the other two engineers.

50
Chapter 5: Implemented Technologies of the Virtual City
To develop the Virtual City framework, numerous Internet technologies were
employed, including Hypertext Markup Language (HTML), JavaScript, Director
Shockwave, VRML, Java, Java 3D, Active Service Page (ASP), Structured Query
Language (SQL), Perl, and the SQL online database. These technologies were chosen
because they are well defined and commonly used at commercial web sites. They were
utilized together and programmed so that they can communicate smoothly with each
other. For example, ASP and the online database work together to generate VRML
virtual worlds dynamically, and Shockwave and Perl talk to each other to create new
virtual structures. This is a unique feature of the framework since these various
technologies together form the basis of the Virtual City. In addition to these technologies,
numerous multimedia applications, such as Flash, Premiere, Photoshop, Freehand, and
Dreamweaver, were employed to develop the framework.
5.1 HTML and JavaScript
HTML is the basic vehicle that delivers text information over the Internet. Other
Internet technologies are used to add interactivity, animation, and 3D worlds to the basic
HTML pages. HTML is a tag-based document formatting language, which can be read by
any web browser. It is relatively easy to update HTML pages, because only one copy of
the information is kept on the server and all users view the same page. All of the
information sections of the multimedia modules were created using HTML.
Although HTML is good at delivering static text information over the Internet, it
cannot be used to distribute dynamic information. JavaScript was used to add

51
interactivity to the HTML pages [92]. This interactivity includes dynamically generating
content in HTML pages, controlling the browser, and transferring information among
HTML pages. The page content can be based on user input, which makes HTML pages
distinct from traditional books. In the Virtual City, JavaScript was used to transfer the
user ID among pages. Hence, the user only needs to provide the user ID once. JavaScript
was also employed to transfer data among the HTML pages, and Shockwave simulations
therefore read the data. Appendix A demonstrates the use of HTML code with JavaScript.
5.2 Shockwave and Multi-user Server
JavaScript is excellent in adding text-oriented interactivity to static HTML pages.
However, it is difficult to use JavaScript to perform complicated, graphic-oriented
simulations. To construct simulations over the Internet, other technologies can be
employed such as Shockwave. Macromedia’s Director was used to develop Shockwave
simulations. A Shockwave simulation can be embedded into HTML pages. The user can
then play the Shockwave simulation in the browser with a Shockwave player, which is
now bundled with Internet Explorer and Netscape. If the Shockwave player has not been
installed, the user will be alerted and prompted to install it. This auto-installation is
particularly convenient when distributing the Shockwave simulation to remote users.
Shockwave is graphic-oriented, so it can be used to develop applications with
complicated static and dynamic graphics. It has a built-in programming language called
Lingo. Lingo is powerful in providing interactivity and controlling the graphics. Also,
vector-based graphics are supported in Director Shockwave and can be controlled by
Lingo. Because the graphic can be generated and deleted dynamically, the file size of a
Shockwave simulation can be reduced dramatically. Numerous multimedia modules in

52
the Virtual City employed this vector-based technique extensively. For instance, the
consolidation module used the vector-based graphic to represent the time-based change
of effective stress during consolidation. Another good example of using the vector-based
graphic is the structural analysis module, in which topologically different 2D truss and
frame structures can be drawn dynamically and then analyzed. Besides controlling
graphics, Lingo was used to perform other complex numerical computations such as
finite element analysis. Shockwave is not a stand-alone technology without
communication with others. Shockwave simulations can obtain environmental parameters
from HTML pages. These parameters could be dynamic data passed into the simulations.
Similar to other Internet technologies, Shockwave supports the server/client model. This
model allows the client to communicate with the server by CGI programs. Because of
these, Shockwave is a key technology used to develop multimedia modules. The
multimedia modules in the Virtual City have used Shockwave technology in unique ways
to enhance engineering education. Some examples are foundation, consolidation,
structural analysis, and piping network modules.
In addition to client/server capabilities, Director provides a Shockwave multi-user
server for developing multi-player applications. The multi-user server links numerous
Shockwave simulations through the Internet and usually is used to develop Internet-based
multi-player games. The Virtual City borrowed the idea of Internet-based multi-player
games and implemented the distributed collaborative concept in geometric modeling. The
Shockwave multi-user server is a standard component of Director, which runs on the
server and delivers messages between different Shockwave simulations on each user’s
53
browser. Special communication codes were used to implement the multi-user concept in
the Shockwave simulations.
5.3 VRML
Shockwave is good at performing 2D simulation, but it is not strong in 3D. In
order to present a 3D world over the Internet, an efficient 3D modeling language is
needed. (It should be noted, however, that Macromedia is expected to incorporate 3D
capabilities into Director Shockwave in the near future.) For these purpose, VRML was a
good choice for the Virtual City, because it is a platform-independent, international
standard for viewing 3D worlds over the Internet. VRML supports interactivity,
animation, modification, and hyperlinks, which make it suitable to navigate 3D worlds.
VRML uses text to describe the 3D model, allowing VRML files to be edited in any text
editor. Furthermore, other programs such as Perl and ASP scripts can generate VRML
files dynamically.
In the Virtual City, the 3D virtual world is constructed using VRML. Except for
the standard ground that is the same for all users, Perl scripts dynamically generate all of
the other structures in the 3D virtual world (Fig. 5.1). First they take the data from the
Shockwave simulation, and then Perl scripts interpret the data and generate the VRML
files based on the received data. The 3D virtual world is generated by an ASP script,
which takes the data from the database and dynamically presents the world to the user.
VRML is usually used to describe a fixed 3D virtual world. However, with the help of
Perl, ASP, and the online database, VRML can be utilized to present a highly dynamic
3D virtual world (Appendix C). The research of the Virtual City thus widens the
technical horizon of the VRML.

54
Perl
Shockwave Simulations
VRML Files
Online Database
3D Virtual World
ASP
ASP
Generate
Save Manage
Retrieve
Constitute
Fig. 5.1 Generation and Management of the 3D Virtual World
5.4 Java and Java 3D
VRML is excellent in presenting static 3D objects over the Internet. However, it
needs the help of other programming languages to create dynamic objects and conduct
complex computation. To create dynamical geometric objects, other languages with full
capabilities are needed, such as Java and Java 3D.
Java is a general-purpose programming language similar to C++. The key
features of Java are: simple, object-oriented, multi-threaded, robust, high-performance,
secure, platform-independent, portable, and network supporting. Java is simple, because
it follows the basic syntax of C/C++ but eliminates difficult concepts such as pointers.
Programmers familiar with C++ can learn it easily. Java is a strong object-oriented

55
programming language, which inherits the object-oriented concepts of C++. To create
multi-task applications, Java allows for the creation of multi-thread processes in one
application. Java does not allow using pointers and conducts garbage collection
automatically, which eliminates the task of memory management and therefore makes
Java robust in application design. The performance of Java has been improved and can
compete with C++ due to the introduction of new technologies such as Java HotSpot and
Just-In-Time compiling. These features make Java an excellent programming language
for application development. A large number of commercial applications on the market
have been designed using Java. Java is good not only for stand-alone applications, but
also for Internet-based applications – Java applets. Java is designed for the Internet, so it
guarantees the security of Java applets at a programming language level. It imposes strict
security strategies on the Java applets, because applets are executed on the client
machines. Java assures platform-independence through a Java virtual machine. As Java
implements different Java virtual machines for different platforms, the Java applications
and Java applets can execute without any change on different platforms. This eliminates
the portability problems of C/C++. Java provides high-level support for networking. So it
is particularly suitable to use it designing distributed collaborative applications, such as
the distributed collaborative geometric modeling and engineering analysis of the Virtual
City. Another powerful feature of Java is that objects can be serialized for transmission
over the Internet. This feature can facilitate the development of distributed collaborative
applications, because it makes easy to read the transmitted information. The
programming necessary to data management can be dramatically reduced. The distributed

56
collaborative engineering analysis employed this object serialization technique
extensively.
To design a geometric modeling application using Java, a 3D application
programming interface is needed, which is Java 3D. Similar to OpenGL, which is a
platform-dependent 3D application programming interface, Java 3D provides a 3D-
related library to design 3D applications. OpenGL is not object-oriented while Java 3D is.
Java 3D is a standard extension of Java, which works smoothly in a Java environment.
When a Java 3D application is created, both Java 3D classes and Java classes are used.
Java is used to design the user Interface and perform computation while Java 3D is
employed to complete the 3D-related mathematical operations and rendering tasks.
Java and Java 3D were selected as a major technology to implement the
distributed collaboration, because they support networking, 3D, and can be safely
downloaded to run on client machines. The rendering task of the collaborative geometric
modeling module is done by an applet designed by Java and Java 3D (Appendix E). Java
and Java 3D were also used to design another applet, which is the first Internet-based
distributed collaborative finite element analysis. A Java-based multi-user server was also
designed to work simultaneously with the geometric modeling and engineering analysis
applets to achieve the collaborative features (Appendix D). The functions of the Java-
based multi-user server are the same as the Shockwave multi-user server. The only
difference is that the Java-based multi-user server was developed specifically for the
Virtual City while the Shockwave multi-user server is a general-purpose commercial
program.
57
5.5 Perl
Client-side interactivity is not enough in the Virtual City. Server-side interactivity
is also needed to allow data to be exchanged with the server. The Perl programming
language is one of many languages that can perform functions of Common Gateway
Interface (CGI). Perl can gather the data from HTML form pages or Shockwave
simulations, process the data, and send the results back to the HTML pages or
Shockwave simulations. As mentioned previously, Perl is used to generate the VRML
files of structures dynamically in the 3D virtual world, which is a unique way to modify
the 3D virtual world (Appendix G).
5.6 ASP and SQL
In addition to using Perl to provide server-side interactivity, ASP is another way
to achieve this. ASP is different from CGI applications in that a small DLL file interprets
ASP scripts. This DLL file resides in the same memory space as the Internet Information
Server. ASP is based on VBScript programming language and can be used to generate
HTML pages dynamically, process client’s requests, and access the online databases. In
the Virtual City, ASP is mainly used to insert data, search and update the database, and
present the results in dynamically generated HTML pages. ASP is also utilized to present
the searched results from the database to Shockwave simulations. An innovative use of
ASP is that ASP dynamically generates a VRML 3D virtual world with the help of SQL
statements. The unique feature of the Virtual City is that the same ASP script generates
different virtual worlds based on various input. This tremendously reduces the task of
managing the numerous virtual worlds of the users. ODBC is used to access the database
server through ASP and SQL statements.

58
Client’s Browser
Online Database
HTML ShockwaveSimulation
JavaApplet
VRMLPlayer
Web Server
Perl
ASP
SQL
VRMLFiles
GeometricFiles
Internet
Fig. 5.2 Internet Technologies
SQL is a user-friendly powerful query language that utilizes a combination of
relational-algebra and relational-calculus. Because of this, SQL works only with
relational databases such as Access, SQL database, and Oracle. SQL is not just a “Query
Language”. It contains numerous features besides querying a database. For example, it

59
can define the structure of the database, manipulate the data, specify security constraints,
assure data integrity, and provide transaction control. In the Virtual City, SQL statements
are embedded in ASP scripts to access the SQL database (Appendix H). The results are
presented in text format or HTML format after the ASP scripts are interpreted.
Figure 5.2 demonstrates how these Internet technologies work together and how
they communicate in the Virtual City. For instance, the Shockwave simulation accesses
the online database through ASP, generates geometric files, and finally shades the
geometric files through the Java applets.
5.7 SQL Server
ASP and SQL work with a database to manipulate the data. Numerous databases
are available such as Access, MS SQL Server, Oracle, and IBM DB2. The Virtual City
selected MS SQL Server as a central place to store data. This is because ASP can
smoothly access MS SQL Sever. Another important factor is that it is easy to shift
between Access and MS SQL Server without modifications of ASP files. MS SQL Server
is a medium-size relational database and can be used for e-commerce and data
warehousing. It supports all of the general requirements of a database, such as integrity,
atomicity, concurrent access, and security. Because of these, MS SQL Server was chosen
to manage the data of the Virtual City.
5.8 Internet Information Server
Besides the database server, the Virtual City also needs a server-side application
called Internet Information Server (IIS) to publish information over the Internet. The
general function of IIS is that it responds to the user’s request with suitable information

60
such as a HTML page, video clip, or multimedia simulation. IIS manages all data
published publicly, and is the key application to allow users to browse the web site. In the
Virtual City, Microsoft IIS was chosen due to its accessibility. Another reason is that
ASP and MS SQL Server work seamlessly with Microsoft IIS.
5.9 Multimedia Applications
In addition to Director, numerous other multimedia applications were also utilized
to develop the Virtual City. These multimedia applications include Flash, FreeHand,
Photoshop, Dreamweaver, and Premiere. Flash is good at demonstrating animations with
small file sizes. In the structural analysis module, multiple Flash animations were used to
present truss concepts. FreeHand provides convenient drawing tools to create diagrams. It
was used to design diagrams illustrating technical concepts. Photoshop is a standard
graphics program, which can be used to change the color tint, remove backgrounds, add
shadows, edit photos, etc. All pictures in the Virtual City were edited employing
Photoshop. Dreamweaver is an advanced web page builder that lets the user construct
HTML web pages without dealing with the actual codes. The information sections of the
multimedia modules were constructed using Dreamweaver. Premiere is an excellent
video edit program, which allows the user to splice together still pictures, movies and
sound into a nice video. It was utilized to edit and compress a video clip illustrating
traffic congestion due to poor ramp design in the traffic engineering module.

61
Chapter 6: Framework and Content of the Virtual City
The Virtual City consists of five components: a 3D virtual world, an online
database, multiple multimedia modules, a collaborative geometric modeling module, and
a collaborative engineering analysis module. The 3D virtual world contains structures
deposited from multimedia modules. The online database manages dynamic data of the
Virtual City. The multimedia modules illustrate specific engineering topics with the help
of Shockwave simulations. The geometric modeling and engineering analysis modules
implement the concept of distributed collaboration for design and analysis through the
use of the Internet.
6.1 Three-dimensional Virtual World
The 3D virtual world is key to the Virtual City, because it provides an excellent
way to tie various components, such as the online database, multimedia modules, and
engineering design modules, together into one system – the Virtual City (Fig. 6.1.1).
Also, 3D visualization is unique to this research, because, as of now, there is no Internet-
based 3D visualization for engineering educational purposes. In fact, even desktop-based
educational 3D visualization is rare. The following two sections will discuss the design of
the 3D virtual world and its main functions.
6.1.1 Design of the Virtual World
The 3D virtual world was designed using VRML with the help of Perl, ASP,
SQL, and the online database. These Internet technologies work together to generate its
visual objects dynamically. There are two types of visual objects in the virtual world, as
described below.

62
Fig. 6.1.1 Three-dimensional Virtual World
The first type of visual objects is a base ground, river, reservoir, and boat, as well
as hills and numerous trees. These objects are geometrically fixed and serve as a basic
platform for the virtual world. As they are fixed, these visual objects are pre-designed
using a VRML authoring tool, and every user receives the same copy. The second type of
visual objects is generated dynamically. Each user can create visual objects with different
shapes or sizes. A coordinate system is used to determine the positions of the objects. The
steps for generating objects are as follows. First, the Shockwave simulation is used to
help design and prepare the data for particular objects. For example, designing a bridge
requires data including section numbers, node positions, and the layout of the bridge.
Second, the data is transmitted from the Shockwave simulation to the server. The server
then starts a CGI-Perl program to take the data, and create an object in VRML format.
The object can be seen immediately in the virtual world. Meanwhile, the data related to
the object is saved in the database using ASP and SQL for later retrieval. Third, the user
63
can modify the object by submitting new data. For instance, if the user dislikes the layout
of the generated bridge he can modify the previous bridge by adding, deleting, or moving
trusses and resubmit it to the server.
Besides using Internet technologies to create individual objects, the entire virtual
world is dynamically managed by an ASP script with the help of SQL statements and the
database. The virtual world is a customized world belonging to individual users. It is,
however, inefficient and inconvenient to save multiple copies of the virtual world. One
solution is to save only the customized parts of the virtual world and use a creative
strategy to manage these customized parts. This strategy uses an ASP script to accept the
data of the user account as input. Based on the input data, the ASP script then searches
the database to retrieve virtual structures associated with that particular user and
dynamically generates a virtual world. Using ASP, it is easy to set different default
viewpoints for different simulations. This strategy is particularly efficient, because it can
manage a large number of users. More sophisticated applications could be designed based
on this prototype of the virtual world.
6.1.2 Functions of the Virtual World
The main function of the virtual world is to allow the user to see the ‘big picture’
using 3D visualization. Multimedia modules of the Virtual City can be used to build
specific virtual objects that are deposited into the virtual world. For example, the traffic
engineering module can be used to deposit a highway system and the structural analysis
simulation to deposit a steel bridge. These modules are designed for appropriate
undergraduate courses. When the student finishes these courses, a complete meaningful
virtual world is also built. As the virtual world is built on the Internet, the student can
64
demonstrate it to anyone with Internet access. This minimizes the difficulty of
presentations with traditional design.
6.2 Online Database
The online database is a central place to manage dynamic data of the Virtual City.
The reason a database was chosen to manage the dynamic data is that it is the most
efficient approach to save, delete, retrieve, and search data. Similar to the design of
conventional databases, the database design for the Virtual City is divided into four steps.
The first step includes requirement collection and analysis. Collecting all possible
functional requirements of the database is a crucial step of database design, because the
rest of the design is based on this step. The relationships of requirements are then
analyzed to eliminate redundancy. The next step is conceptual design. It is usually
implemented by drawing an entity-relationship (ER) diagram based on logical
relationships of the requirements. The third step is logical design. Tables are created
based on the ER diagram, and the structure of the database is therefore determined in this
step. The last step is physical design. The tables and their physical data structures are
implemented in a specific database management system (DBMS). For example, MS SQL
Server or Oracle may be used to design the actual database. In this research, MS SQL
Server was selected as the DBMS, because it works seamlessly with other Internet
technologies. The following sections will discuss these steps in detail.
6.2.1 Database Requirements
The requirements of the online database were collected from the Virtual City.
There are two categories of accounts that need to be tracked in the database. Each user

65
must have an individual account while several users may share a team account. To create
a user account in the database, the user must provide a unique user account name, last
name, first name, email address, and select a password for the account. The user is also
asked to provide information such as occupation, major, and frequency of using online
learning. The registration date is recorded when the account is created.
A unique team account name must be provided by the coordinator. The team
account may have several members besides the coordinator. Members may share the
team account, and the team account may have multiple geometric modeling files,
multiple VRML files, or both. Each account manages the information associated with the
soil, consolidation, steel, building, traffic engineering, and concrete modules. Each
module contains a few data items. For example, the data items for the soil module include
user ID, and values associated with the bottom, left, top, and height of a dam. When the
user logs into the account, the database tracks the login ID, session ID, event type, client
IP address, user agent, and the number of hits.
6.2.2 Entity-Relationship Diagram
Through analysis of the relationships of the above requirements, an ER diagram
was drawn to demonstrate graphically the overall logical structure of the online database
(Fig. 6.2.1). Such a diagram consists of rectangles, ellipses, diamonds, lines, double
ellipses, double diamonds, double rectangles, and double lines. Traditionally, each
component has a particular meaning [99].

66
login AccountsessionLogInfo
logID
userIPAddresssessionID
eventType
numberOfHits
userAngentISA
teamAccount userAccount
registrationDate
userID
password
lastName
firstName
userInfo
coordinatorID
manageVRML
manageModels
manageMembers
modelsmembers VRML
fileNamefileNamememberID
consolidation
soil
steelbuilding
highway
concrete
eventDateTime
Fig. 6.2.1 ER Diagram for the Virtual City Database
6.2.3 Database Structure
From the entity-relationship diagram, a number of tables can be generated (Table
6.2.1). These tables are the logical data structure of the online database. An attribute with

67
an underscore is the primary key that uniquely identifies a tuple in a specific table.
Physical table design in MS SQL Server follows exactly the same data structure.
Table 6.2.1 Logical Data Structure for the Online Database
Number Tables 1 UserAccount (userID, password, lastName, firstName, email, registrationDate,
groupID) 2 UserInfo (userID, occupation, major, onlineLearning) 3 TeamAccount (teamID, coordinatorID, registrationDate) 4 TeamMembers (teamID, memberID) 5 TeamFolderFiles(teamID, filename) 6 TeamFolderVRMLFiles(teamID, filename) 7 SessionLogInfo (eventDateTime, eventType, userAccountID, sessionID,
userIPAddress, numberOfHits, userAgent, logID) 8 Steel (userID, bayHeight, bayLength, bayWidth, noOfBayLength,
noOfBayWidth, noOfBayHeight) 9 Soil (userID, damBottom, damLeft, damTop, damHeight) 10 Highway (userID, roadWidth, skyLineLaneNum) 11 Consol (userID, HoValue, landWidth, landLength) 12 Concrete (userID, beamNum, transparency) 13 Building (userID, height, leftRight, frontBack)
*Underscores indicate the primary keys of the corresponding tables.
6.2.4 Functions of the Online Database
The main purpose of the online database is to provide a solid method of managing
data. There are three different types of data in the database. The first type is related to
account management. This includes user account, and team account. The user may log in
as an individual member or as a member of a team account (Fig. 6.2.2).
The second type of data is used to manage geometric parameters. These
geometric parameters control the shape of the 3D objects that are deposited in the virtual
world. The user may modify this data at any time.
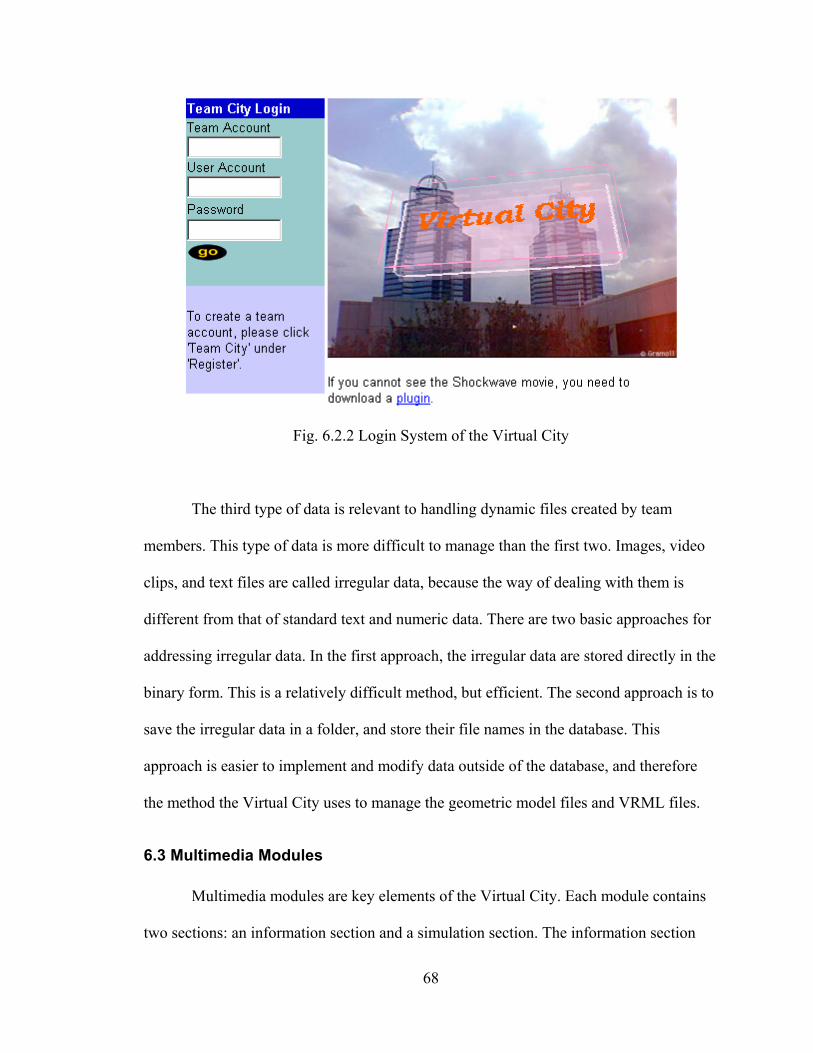
68
Fig. 6.2.2 Login System of the Virtual City
The third type of data is relevant to handling dynamic files created by team
members. This type of data is more difficult to manage than the first two. Images, video
clips, and text files are called irregular data, because the way of dealing with them is
different from that of standard text and numeric data. There are two basic approaches for
addressing irregular data. In the first approach, the irregular data are stored directly in the
binary form. This is a relatively difficult method, but efficient. The second approach is to
save the irregular data in a folder, and store their file names in the database. This
approach is easier to implement and modify data outside of the database, and therefore
the method the Virtual City uses to manage the geometric model files and VRML files.
6.3 Multimedia Modules
Multimedia modules are key elements of the Virtual City. Each module contains
two sections: an information section and a simulation section. The information section

69
covers the key engineering concepts related to the module. The simulation section is a
Shockwave simulation that allows the user to learn engineering concepts through
exploration. Most simulations are tied to the 3D virtual world by allowing the user to
design and deposit a specific structure in the 3D virtual world. The finished modules are
the traffic engineering, steel structure, surveying, foundation, soil, consolidation,
structural analysis, concrete, and piping network.
Fig. 6.3.1 Information Section of the Traffic Engineering Module
6.3.1 Traffic Engineering
The traffic engineering module was designed for the Introduction to Engineering
course at the University of Oklahoma. As the course served freshman engineering
students, only the basic concepts of traffic engineering were covered. There are three
sections in the module. The first uses text and pictures to explain the definitions; the
second is an interactive traffic simulation; the third is a video that demonstrates how the

70
poor design of a ramp can cause traffic congestion. The highway system of the 3D virtual
world is designed using this module. Figure 6.3.1 illustrates the information web page for
the traffic engineering module. Other modules follow the same style.
The first section of the module covers the definition of the Level of Service (LOS)
A, B, C, D, E, and F. Levels of service range from light vehicle traffic volume associated
with unobstructed flow (LOS A) to extremely heavy traffic congestion (LOS F). Each
LOS definition is accompanied with a picture to show the traffic volume visually
corresponding to that level of service. Levels of service are defined by different levels of
service flow in terms of vehicles per hour. In the vicinity of on-ramps, the highway
maximum service flow values are reduced due to increased lane changes, weaving, and
merging. For the sake of the module, the reduction in maximum service flow was made a
function of the length of the acceleration lane at the end of the on-ramp. A table in the
learning environment is used to give the reduced maximum service values for different
acceleration lane lengths.
Fig. 6.3.2 Traffic Engineering Simulation

71
The second section of the module consists of a Shockwave simulation and
explanatory texts. As mentioned in the previous section, the Director authoring tool was
used to program the simulation. The exported Director file is a Shockwave simulation
that can be distributed across the web. The purpose of this module is to demonstrate the
concept of level of service visually.
There are thirteen features in the simulation (Fig. 6.3.2).
1. There are three lane configurations: 2, 3, and 4 lanes the users can select.
2. There are three choices for the length of the acceleration lane.
3. If the user wants to increase or decrease the number of freeway lanes, he can add
or delete a lane.
4. There are five intersections available for design. Each intersection affects the
design of the next one.
5. The level of service is illustrated using color shading based on the user’s input of
the traffic volume and the number of lanes. For example, if the current level of
service is A, green shading appears. If the current level of service is D, the red
shading is used.
6. The cost of an individual intersection and the cost of a total of five intersections
are automatically calculated.
7. The number of the cars displaying on the freeway is based on the user’s input. In
this module, each multiple of 500 vehicles/hour is represented with a moving car.
The maximum number of vehicles shown on the freeway is 16.
8. The velocity of the vehicles on the freeway has a relationship with the level of
service. The velocity with level of service A is the highest.

72
9. If the total maximum service flow with only two lanes is more than 5,500
vehicles/hour, the vehicles on the screen will crash with sound effects.
10. The user can turn the sound on and off.
11. A photo is used to show a real ramp.
12. The current design configuration is outputted to the user during the session.
13. A message is used to prompt the user when there is a problem with the design.
The third section of this module includes a video of real traffic flow showing
traffic congestion due to poor ramp design. As the file size of the video is large, video-
streaming technology is used to play the video over the web. The latest Windows media
player is also needed on the user’s computer to play the video.
In engineering design, performance and cost need to be considered
simultaneously. Therefore, when a student selects different design strategies, such as
different numbers of lanes, the cost is also estimated. This helps reinforce the relationship
between performance and cost to the students. After the basic traffic engineering
concepts are introduced, the students are asked to determine the best design of the
freeway for the given conditions. The design variables include the traffic flow rate, the
number of lanes, and the length of acceleration lane. Students can choose the design
variables by themselves, but they are not allowed to exceed a reasonable range of values.
There are numerous unique features in the traffic engineering module. It uses
various colors to demonstrate different levels of service. The cars on the highway are
moving with significantly different speeds at different levels of service, which gives a
direct impression of the problem to the students. Although it is a simple design problem,

73
performance and cost are considered simultaneously, which is an important concept for
freshman students to understand.
6.3.2 Steel Structure
The steel structure module was designed for the Graphics and Design course at
the University of Oklahoma and first used in the spring of 1999. Students who took this
course used the module to help them understand the basic concepts of steel structures
when they learned AutoCAD. The students were assumed to have little knowledge about
steel structures, and only basic concepts were covered in this module.
Fig. 6.3.3 Information Section of the Steel Structural Module

74
The information section includes seven subtopics - Introduction, Code, Beam,
Column, Joist, Decking, and Connections (Fig. 6.3.3). Text, graphics, photos, and 3D
models are used to present the concepts to the students. In these different media, VRML
is used to present 3D connection models (Fig. 6.3.4). With VRML, students are able to
navigate in the virtual world by rotating around and zooming into the connections, which
allows them to see details of the connections. This technique is helpful in deepening the
understanding of the connection structures.
Fig. 6.3.4 Connection Illustration Using VRML
The Internet-based simulation (Fig. 6.3.5) of this module imitates the steps of
designing a single bay steel structure. The purpose of this module was to provide an
easily accessible tool for students to experience the design process for steel structures
using the newly acquired knowledge. The main features of this simulation are as follows:

75
1. Building types, building size, live and dead loads, codes, safety factors and yield
stress can be selected or entered.
2. Clicking on one of the two icons representing joists creates joists. The number of
joists can be changed.
Fig. 6.3.5 Steel Structure Simulation
3. Clicking on the force icon generates a point force. The point force is moved by a
"click-and-drag" motion and will snap to the beams or joists. The magnitude of
the force can be modified by double clicking the force.
4. The type of beam or column can be selected through double clicking the specific
beam or column.
5. Clicking on the 'Calculate' button performs the stress calculation. If the maximum
stress of any member is larger than the allowable stress, the member is shaded red
to depict failure.

76
6. If the “Results” icon is clicked, the stress results of members can be viewed.
7. The user can deposit a steel structure in the 3D virtual world if the “Submit” icon
is clicked.
An important unique feature of this simulation is that a complicated steel structure
can be designed dynamically in the 3D virtual world through the modification of three
parameters (Fig. 6.3.6). The user can then view the details of how numerous bays connect
with each other. Also, it can give the user an impression of 3D steel structures and
stimulate their interests in leaning more about steel structures.
Fig. 6.3.6 Steel Structure Created by the Steel Structure Simulation
6.3.3 Surveying
The surveying module was designed for the Engineering Surveying course at the
University of Oklahoma and used in the fall of 1999. The motivation for this module was

77
to provide an Internet-based data processing tool for the Engineering Surveying course.
Previously, to process surveying data, students used a specific software program to
generate 2D contour plots. However, by integrating a number of Internet-based
technologies, a surveying simulation could be developed to generate 2D contours and
visually present 3D surfaces on the Internet. The idea of generating 2D contours and
demonstrating a 3D surface at the same time was realized by integrating Shockwave and
VRML technologies. CGI-Perl was also used to read data from the Shockwave
simulation, generate a VRML file, and send the VRML file back to the user’s browser.
Fig. 6.3.7 Information Section of the Surveying Module

78
The design of the surveying module is similar to the steel structure, which also
includes two sections: an information section (Fig. 6.3.7) and a simulation section. The
information section contains three subtopics: Introduction, Surface, and Algorithm.
Concepts related to the contour, and an algorithm, Shepard's Method, for the generation
of the contours in the simulation were explained.
Fig. 6.3.8 Surveying Simulation
The simulation uses irregular field data, which is gathered by conducting surveys
over an area. Because surveying points are irregularly distributed over the field, the

79
resultant data are not uniform along the x and y direction. However, to plot the contour of
the data, regular data has to be used, which means that steps in the data along x and y
direction are uniform. Shepard's Method is employed to calculate the regular data points
from the irregular data points. A contour-plotting algorithm is used to draw the contour,
and a CGI-Perl script generates the VRML file on the server, which is shown on the
user's browser (Fig. 6.3.8).
The users are able to upload their field survey data to the server because they have
their own accounts on the server. They first browse their local hard disks and select
desired files, and then click the ‘Upload’ button to upload the files. A CGI-Perl script
then takes the data files and save them on their own specific folders. Special Perl codes:
binmode(STDIN), binmode(STDOUT), and binmode(STDERR) are needed if the server
uses the Windows Operating System.
After the data is uploaded on the server, the simulation can then process the data,
plot the contour, and generate the 3D surface based on computational results. To compare
the difference using the same algorithm with different parameter values, two generated
surfaces are presented in the VRML world and two contours are plotted on the
simulation. This is to show that the same algorithm with different parameter values may
result in different contour lines and surfaces. The students therefore can understand that
the generated contours and surfaces are only computational results and depend on the
selection of parameter value of the algorithm. The main features of this simulation are as
follows:
1. The main surveying simulation interface contains three areas: button, contour, and
message areas.
80
2. If the user clicks the 'Input' button, a new window appears. The window is used to
specify the values of various parameters. The user can change these values, but
there are some restrictions on the parameters. The Q values must be less than 3.0
and greater than 1.5 due to numerical restrictions. The number of grids along x, y
should be less than 20; otherwise it will take several minutes to finish the
calculation.
3. If the user clicks the 'Process' button, the button remains depressed and the
simulation becomes inactive, which indicates that the simulation is conducting
computation. After the 'Process' button pops up, the simulation becomes active
again. If the user does not make any change in the input window, the 'Process'
button is inactive since the calculation is completed. However, if the user changes
any one of the first three values in the Input window, the 'Process' button is re-
activated. If the user only changes the value of the number of contour lines, the
'Process' button remains inactive.
4. After the user clicks the 'Process' button, the Buttons 'Contour 1', 'Contour 2', 'V
Compare', and 'V Check' become active. If the user clicks the 'Contour 1' and
'Contour 2' buttons, 2D contours are generated. If the user clicks the 'V Compare'
and 'V Check' buttons, the VRML world is updated based on the results of the
calculation.
5. If the user clicks the 'Report' button, a report window appears. The actual data is
from the validation file (no interpolation) and assumed to be the exact elevation.
The computed data is based on the Q parameter in the report window and not the
Q parameters used to calculate 2D contours. The user can adjust the value of Q
81
parameter in the report window to obtain the minimum value of factor by clicking
'Calculate' button.
6. If the user clicks the 'Clear' button, the contours are erased.
The surveying module is a paradigm that demonstrates the power of using various
Internet technologies to explain complex engineering concepts. The unique creativity of
the module is that it can display 2D contours and 3D surfaces simultaneously over the
Internet. The user can also upload a data file to the server and process it using the
surveying simulation. Furthermore, the user does not need to maintain the processing tool
because it runs on the server.
6.3.4 Foundation
The foundation module was designed for the course of Foundation Engineering at
the University of Oklahoma and used in the spring of 2000. In foundation engineering,
most bearing capacity theories consider a surface along which the soil is assumed to fail
under loading. The assumed failure surface usually does not properly account for such
effects as the eccentricity of the load; thus the actual failure surface is usually different
from the assumed surface. Also, students taking a course of foundation engineering
frequently experience difficulty when trying to understand the stress distribution in soil
supporting a foundation. The foundation module was developed to help students better
comprehend these concepts.
The information session of the foundation module includes seven subtopics:
Introduction, Terzaghi, Modification, General, Eccentricity, Hansen, Meyerhof, and
References (Fig. 6.3.9). The Terzaghi subtopic discusses the capacity equations of strip
foundation, circular foundation, and square foundation using the Terzaghi’s bearing
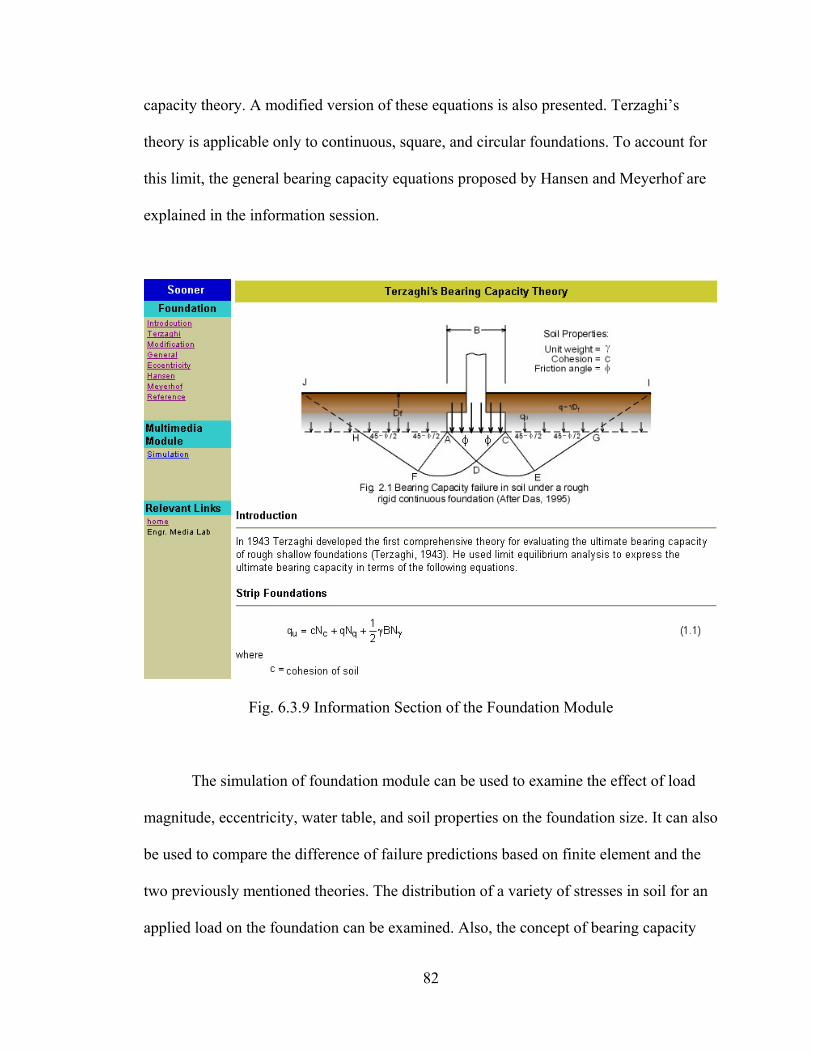
82
capacity theory. A modified version of these equations is also presented. Terzaghi’s
theory is applicable only to continuous, square, and circular foundations. To account for
this limit, the general bearing capacity equations proposed by Hansen and Meyerhof are
explained in the information session.
Fig. 6.3.9 Information Section of the Foundation Module
The simulation of foundation module can be used to examine the effect of load
magnitude, eccentricity, water table, and soil properties on the foundation size. It can also
be used to compare the difference of failure predictions based on finite element and the
two previously mentioned theories. The distribution of a variety of stresses in soil for an
applied load on the foundation can be examined. Also, the concept of bearing capacity

83
failure is illustrated by an animation with a voice explanation. The main features of the
foundation simulation are as follows:
1. The Shockwave simulation calculates the width of the foundation based on the
Terzaghi’s bearing capacity theory or general bearing capacity theory using an
iteration strategy.
2. If the 'Input' icon is clicked, the user can specify the values of numerous
parameters and select the desired theory. The user can accept the default values.
3. Before the user uses finite element analysis (FEA) method to calculate stresses,
the user must first mesh the computation area by clicking the 'Mesh' icon, which
is the third icon. By moving slider bars, the user can change the number of
elements.
4. After the user select the desired number of elements, the user can then click on the
'Matrix' icon to perform FEA. The finer meshing the user chooses to use, the more
time it will take to finish the FEA process. For example, it takes about 90 seconds
in a 400MHz computer to complete a FEA process with 8 6× meshing.
5. After the FEA calculation is over, the user can then view the stress components,
such as x stress, y stress, shear stress, minimum principle stress, maximum
principle stress, and shear principle stress.
6. By clicking the sixth icon, the user can view an animation, which demonstrates
the behavior of the footing when applied to loading.
Figure 6.3.10 is a possible distribution of x stress obtained by the foundation
simulation. The grid shows how the computed area is meshed. The red contour lines
demonstrate the area whose maximum principal stress is larger than 7.819 psi. Other

84
contour lines’ color changes gradually from red to green. The number of total elements in
this example is 192. More elements usually mean better results. However, it takes more
time to obtain the results, because finite element analysis is computation-intensive.
Fig. 6.3.10 X Stress Distribution in the Foundation Simulation
Fig. 6.3.11 Boundary Conditions of the Foundation Simulation
The soil under the foundation is assumed to be a plain strain problem, because the
foundation in z direction is significantly long. Triangular elements are used due to its

85
ease of programming. The mesh strategy is simple; the area near to the foundation has
more elements (Fig 6.3.10). The boundary conditions are illustrated in Fig. 6.3.11. The
left and right side are rollers while the bottom side is fixed.
The foundation simulation was found to be the first Shockwave simulation to
implement finite element analysis visually over the Internet, which is a unique feature of
the foundation module. The interface is user-friendly because the user does not need to
prepare the data using other programs. The user can perform automatic meshing by
moving a slider bar. This tremendously reduces the tedious work of data preparation such
as the numbering of nodes. The contour algorithm of the surveying module was used in
this simulation to draw the colored stress lines. The stress distribution is hence visually
demonstrated using these colored lines. Because of this, the area with high stresses and
low stresses can be easily located.
6.3.5 Soil
The soil mechanics module was designed for the Soil Mechanics course at the
University of Oklahoma. In the foundation module, the distribution of stresses under the
foundation is examined based on the finite element method while in this module the net
increase of vertical stress in soil is estimated based on elasticity theory. The best way to
understand the net increase of vertical stress due to a point load, line load, and string load
is to demonstrate their distribution visually in the soil. Thus, one of the main purposes of
this module was to show the distribution of the net increase of vertical stress visually
under one or multiple loads. Another purpose was to present a curve of the lateral
pressure on the retaining wall when multiple loads are applied.

86
Fig. 6.3.12 Information Section of the Soil Module
The information section of the soil module covers five subtopics: Point Load,
Line Load, String Load, Linearly Increasing Load, and Lateral Pressure on the Retaining
Wall (Fig. 6.3.12). Under the assumption that soil is elastic, isotropic and homogeneous,
theoretical solutions of net increase of vertical stress are presented. Based on results of
net increase of vertical stress, theoretical solution of lateral pressure on the retaining wall
is also explained.
The simulation of the soil module performs the computation based on the
theoretical equations. Two topics of soil mechanics are covered in this simulation. The
first one covers the vertical stress distribution under various loads. For example, when a
line load of infinite length with an intensity q/unit length is applied on the surface of a

87
semi-infinite soil mass, the net increase of vertical stress at point A (Fig. 6.3.13) can be
determined by the following equation:
( )3
22 2
2z
qzpx zπ
∆ =+
(6.3.1)
Note that the value calculated by Eq. (6.3.1) is the additional stress on soil due to the line
load, which does not include the overburden pressure of the soil above the point A.
Vertical stress increment distribution under two types of loads is illustrated by contour
lines (Fig. 6.3.14).
A
x
z
y
x
z
∆pz
q/unit length
Fig. 6.3.13 Line Load over the Surface of a Semi-infinite Soil Mass
The second topic covers the lateral pressure due to different loads. A curve is
presented to show the lateral pressure on the retaining wall (Fig. 6.3.15). The point load,
line load, strip load, and embankment load are applied at the top of the soil. The
superposition method was used to determine the vertical stress net increment at any point
under multiple loads.
The main features of the simulation are as follows:

88
1. For the point load and line load, the maximum vertical stresses are assumed to be
equal to the point load and the line load. Theoretically, the maximum vertical
stresses under the point load and line load are infinity.
Fig. 6.3.14 Distribution of Net Increase of Vertical Stress under Multiple Loads
Fig. 6.3.15 The Curve of Lateral Pressure on the Retaining Wall under Loads

89
2. The point load, line load, strip load, and embankment load are moved horizontally
with a "click-and-drag" motion.
3. The values of these loads can be changed with a "click-and-drag-the-heads-of-the-
loads" motion.
4. Load magnitude can be modified by doubly clicking on the load.
5. The maximum numbers of point loads and line loads are five. The maximum
number of strip loads is three. Only one embankment load is allowed.
6. The unit can be ft and lb or N and m.
7. The individual load can be cleared by "click-and-drag" to the 'Trash' icon.
8. All of the loads are deleted if clicking on the 'Clear' button.
9. Moving the slider can change the scale of the contour line’s values.
10. If the user clicks on the 'Submit' button, a new window pops up to ask the user to
set the dimensions of an earth dam. This earth dam is deposited in the Virtual City
if the 'OK' button is clicked (Fig. 6.3.16). The dam was chosen because it
produces an embankment load.
This simulation is an excellent illustration to demonstrate the superposition
method. The user can add, delete, or move the forces to experience the different
combined effects using the contour lines. The simulation is therefore straightforward and
intuitive. Because the theoretical equations are used, the results are obtained quickly.
Hence, the user can compare this simulation with the foundation simulation, which
employs finite element method. Also, visualization of net increase of vertical stress can
help users better understand the theoretical equations.

90
Fig. 6.3.16 The Dam Created By the Soil Simulation
6.3.6 Consolidation
The consolidation module is the second module designed for the course of Soil
Mechanics at the University of Oklahoma, which can be used to reinforce the knowledge
of the consolidation process in saturated soils. Its main purpose was to simulate how pore
water pressure, effective stress, and settlement evolve over time, in an effort to help
students that usually experience difficulty in comprehending the relationships between
these parameters.
The information section presents an overview of the main principles and aspects
of the theory of consolidation (Fig. 6.3.17). Only the essential elements are addressed,
because the overview is not intended to give details on every aspect of the theory. Four
subtopics were covered, including Introduction, Basics of Consolidation, Theory of
Consolidation, and Settlement Prediction in Terms of Time and Magnitude.

91
Fig. 6.3.17 Information Section of the Consolidation Module
Fig. 6.3.18 Consolidation Simulation
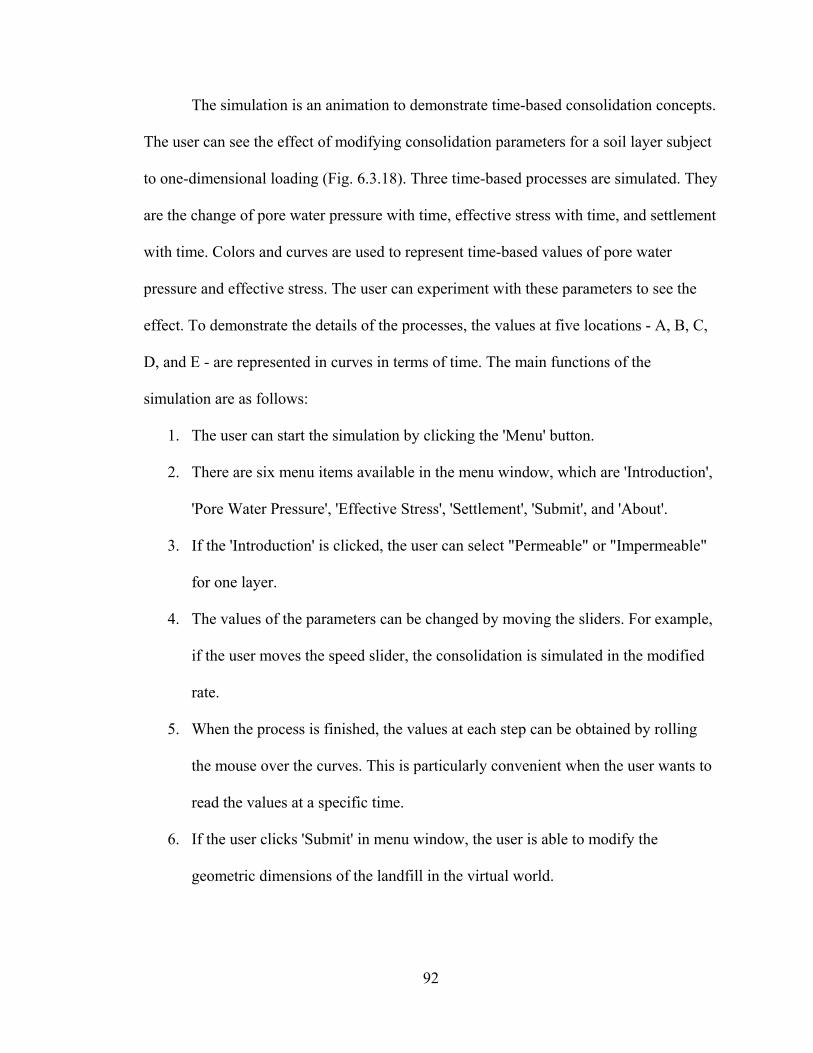
92
The simulation is an animation to demonstrate time-based consolidation concepts.
The user can see the effect of modifying consolidation parameters for a soil layer subject
to one-dimensional loading (Fig. 6.3.18). Three time-based processes are simulated. They
are the change of pore water pressure with time, effective stress with time, and settlement
with time. Colors and curves are used to represent time-based values of pore water
pressure and effective stress. The user can experiment with these parameters to see the
effect. To demonstrate the details of the processes, the values at five locations - A, B, C,
D, and E - are represented in curves in terms of time. The main functions of the
simulation are as follows:
1. The user can start the simulation by clicking the 'Menu' button.
2. There are six menu items available in the menu window, which are 'Introduction',
'Pore Water Pressure', 'Effective Stress', 'Settlement', 'Submit', and 'About'.
3. If the 'Introduction' is clicked, the user can select "Permeable" or "Impermeable"
for one layer.
4. The values of the parameters can be changed by moving the sliders. For example,
if the user moves the speed slider, the consolidation is simulated in the modified
rate.
5. When the process is finished, the values at each step can be obtained by rolling
the mouse over the curves. This is particularly convenient when the user wants to
read the values at a specific time.
6. If the user clicks 'Submit' in menu window, the user is able to modify the
geometric dimensions of the landfill in the virtual world.
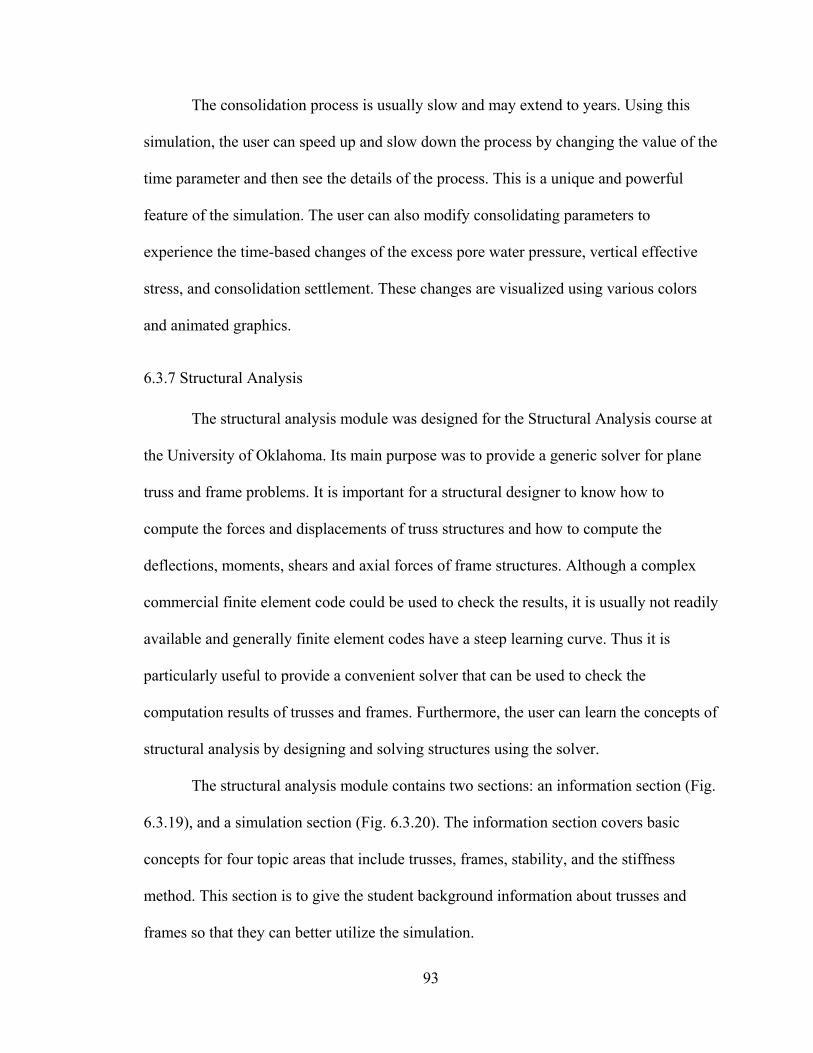
93
The consolidation process is usually slow and may extend to years. Using this
simulation, the user can speed up and slow down the process by changing the value of the
time parameter and then see the details of the process. This is a unique and powerful
feature of the simulation. The user can also modify consolidating parameters to
experience the time-based changes of the excess pore water pressure, vertical effective
stress, and consolidation settlement. These changes are visualized using various colors
and animated graphics.
6.3.7 Structural Analysis
The structural analysis module was designed for the Structural Analysis course at
the University of Oklahoma. Its main purpose was to provide a generic solver for plane
truss and frame problems. It is important for a structural designer to know how to
compute the forces and displacements of truss structures and how to compute the
deflections, moments, shears and axial forces of frame structures. Although a complex
commercial finite element code could be used to check the results, it is usually not readily
available and generally finite element codes have a steep learning curve. Thus it is
particularly useful to provide a convenient solver that can be used to check the
computation results of trusses and frames. Furthermore, the user can learn the concepts of
structural analysis by designing and solving structures using the solver.
The structural analysis module contains two sections: an information section (Fig.
6.3.19), and a simulation section (Fig. 6.3.20). The information section covers basic
concepts for four topic areas that include trusses, frames, stability, and the stiffness
method. This section is to give the student background information about trusses and
frames so that they can better utilize the simulation.

94
Fig. 6.3.19 Information Section of the Structural Analysis Module
Fig. 6.3.20 Structural Analysis Simulation
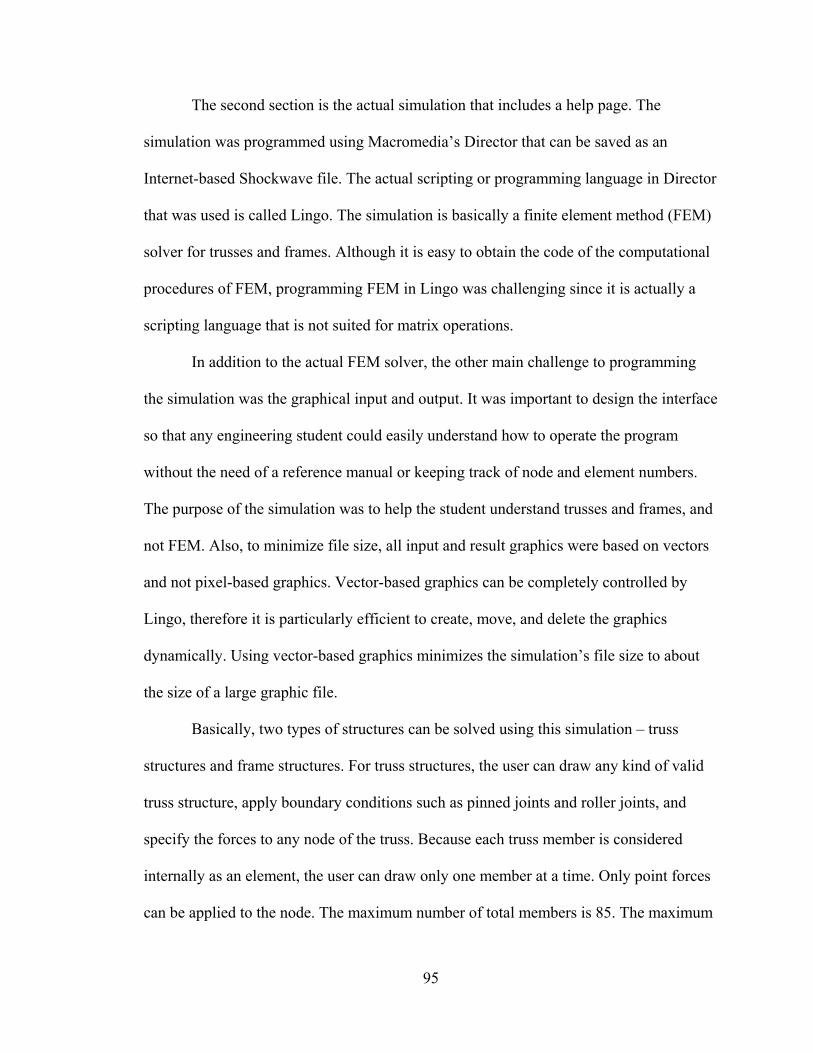
95
The second section is the actual simulation that includes a help page. The
simulation was programmed using Macromedia’s Director that can be saved as an
Internet-based Shockwave file. The actual scripting or programming language in Director
that was used is called Lingo. The simulation is basically a finite element method (FEM)
solver for trusses and frames. Although it is easy to obtain the code of the computational
procedures of FEM, programming FEM in Lingo was challenging since it is actually a
scripting language that is not suited for matrix operations.
In addition to the actual FEM solver, the other main challenge to programming
the simulation was the graphical input and output. It was important to design the interface
so that any engineering student could easily understand how to operate the program
without the need of a reference manual or keeping track of node and element numbers.
The purpose of the simulation was to help the student understand trusses and frames, and
not FEM. Also, to minimize file size, all input and result graphics were based on vectors
and not pixel-based graphics. Vector-based graphics can be completely controlled by
Lingo, therefore it is particularly efficient to create, move, and delete the graphics
dynamically. Using vector-based graphics minimizes the simulation’s file size to about
the size of a large graphic file.
Basically, two types of structures can be solved using this simulation – truss
structures and frame structures. For truss structures, the user can draw any kind of valid
truss structure, apply boundary conditions such as pinned joints and roller joints, and
specify the forces to any node of the truss. Because each truss member is considered
internally as an element, the user can draw only one member at a time. Only point forces
can be applied to the node. The maximum number of total members is 85. The maximum

96
number of joints is 13 for each type of joint. The maximum number of forces is 20 for
each type of force. The simulation therefore cannot be used to solve large truss problems.
There are two ways to specify detailed input information: the preference window
and the member property window. Figure 6.3.21 illustrates the preference window of the
simulation. In the preference window, the user can specify appropriate grid step ratio of
the grid system to map real-world dimensions. The lengths of the members are
determined implicitly based on the grid system. Default values for material and member
geometric properties are also set in the preference window. The user can also give
material and geometric properties to individual members (Fig. 6.3.22) by double clicking
individual members.
Fig. 6.3.21 Preference Window

97
Fig. 6.3.22 Member Property Window
The results for truss structures are presented in four ways: summary of results,
report of individual members, displacement visualization (Fig. 6.3.23), and load
visualization (Fig. 6.3.24). In the summary of results, the values of the maximum
displacement and maximum stress are reported. If an individual member is double-
clicked, its displacements and stress can be accessed. Also, the stability of each member
is checked and reported based on the basic Euler equation. To demonstrate the relative
difference of the displacement, a new truss structure with node movement based on the
displacements is drawn. The color is utilized to show the loads in each member.
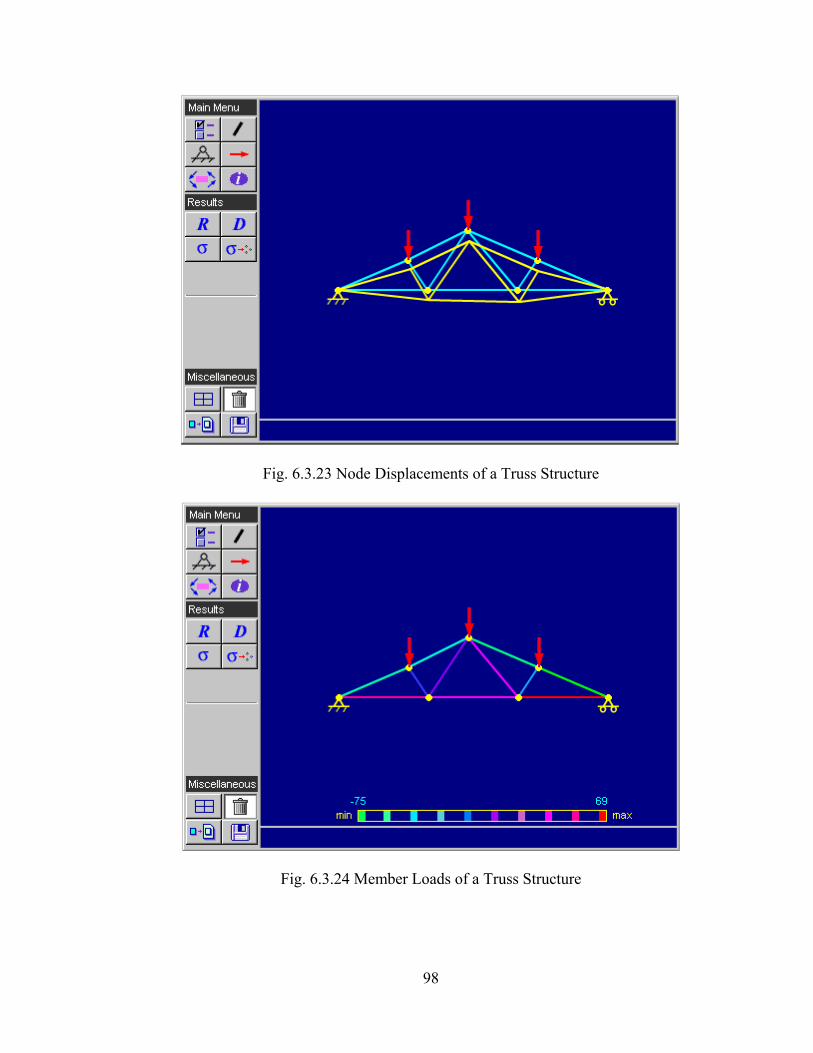
98
Fig. 6.3.23 Node Displacements of a Truss Structure
Fig. 6.3.24 Member Loads of a Truss Structure

99
In addition to truss structures, the user can draw any type of frame structure. The
number of members, joints, and forces are limited, similar to the truss structures. Point
forces, moment, and distributed loads in x direction and y direction can be applied to the
frame. By double-clicking the forces, the user can change their magnitudes. Similarly,
the simulation reports a summary of the computational results, such as maximum
displacement of nodes, maximum moment of nodes, and maximum axial force of
members. Each member’s deflection (Fig. 6.3.25), moment diagram (Fig. 6.3.26), shear
diagram, axial force diagram can be visually presented.
Fig. 6.3.25 Deflection of Members for a Frame Structure

100
Fig. 6.3.26 Moment Diagram of Members for a Frame Structure
Fig. 6.3.27 Influence Line of the Bridge Member

101
Fig. 6.3.28 Bridge Application of the Simulation
The structural simulation is a generic application, and can be used to help develop
various specific applications. One particular application, a bridge with a moving load,
was a specific case that was programmed into the simulation due to its unique output
needs. After the user chooses the bridge option, the number of the sections in the

102
preference window can be specified. Then the user needs to add the actual truss members
between the two end points of the bridge. A moving load, which simulates a vehicle, is
applied to the bridge and the program calculates and records the member loads as the
vehicle moves across the bridge. From this information, an influence line is drawn for
any selected member (Fig. 6.3.27). In addition, an animation is developed to show the
displacements of each node when the vehicle is moving. A 3D virtual world, which is an
Internet-based city built by the use of various multimedia modules, is used to provide a
‘big picture’ of the bridge (Fig. 6.3.28). The user can draw a 2D bridge in the simulation
and then generate a 3D bridge by depositing it in the virtual world.
The main features of the simulation are as follows:
1. A grid is used to map the real-world dimension through the use of a grip step
ratio. By depressing the 'Grid' button, the user can turn the grid on.
2. The steps to use this generic solver are: (1) Click 'Preference' button to set the
preference; (2) Click 'Member' button to generate, move, and delete members; (3)
Click the 'B.C.' button to apply the boundary conditions such as pin joint and
fixed joint; (4) Click 'Force' button to apply forces; (5) Click 'Solve' button to
solve the problem; (6) Under the 'Solve' button, click the any sub-button to obtain
the information of the results, such as stress of truss member and deflection of the
frame member.
3. If the user clicks the 'Trash' icon, all of members, forces, and boundary conditions
are deleted.
4. If the user drags a member, joint, or force to the 'Trash' icon, that member, joint,
or force is deleted immediately.

103
5. The property input window can be accessed through double-clicking a member or
force.
6. The computation is performed if the user clicks the 'Solve' button.
7. If the user selects to perform truss analysis only a subset of menus of boundary
conditions, forces, and results show up.
8. The user can save a structure with boundary conditions and forces on the server.
Later, the structure can be retrieved using the simulation. Because only one
structure can be saved, the previous structure will be overwritten if the user tries
to save another structure. The computational results are not saved, because they
can be easily obtained by running the simulation again.
Numerous unique features can be found in this simulation. First, no similar
Internet-based frame solver was found during module development. Second, the user can
define the truss and frame structures by drawing connected individual members, which is
an intuitive and convenient approach. Third, the computational results are visually
demonstrated. For truss structures, new truss structures are drawn to display the
displacement at each node. For frame structures, new deflected frame structures are
generated to represent the deflection of each member, which is usually difficult to draw
by hand. Moment and shear diagrams are also drawn for the frame structure, which are
simple in concept but tedious to draw them. Fourth, a complex bridge can be designed
using this simulation and then deposited into the virtual world. Fifth, the structure as well
as the forces and boundary conditions can be saved on the server and retrieved using the
simulation. Last, the simulation can help students design simple truss and frame
structures with analytical results.

104
6.3.8 Concrete
The concrete module was designed for the Concrete Design course at the
University of Oklahoma. Its main purpose was to compare the results of the working
stress method and strength design method. The working stress method was the dominant
concrete design method in United States before 1970’s, and it was gradually replaced by
the strength design method since then. This is because the strength design method has
numerous advantages over the working-stress method. For example, the strength design
method better estimates load-carrying ability, uses a more consistent theory, employs a
more realistic factor of safety, and permits more flexible designs. However, using both
methods on the same beam and comparing their results can deepen the students’
understanding of these two methods.
Fig. 6.3.29 Information Section of the Concrete Module

105
The information section of the concrete module discussed four subtopics:
Introduction, Beam Theory, Working Stress Method, and Strength Design Method (Fig.
6.3.29). The classic beam theory was reviewed, because it is the foundation of the
working stress method. The theory of working stress method and the strength design
method was covered using text, equations, and illustrations. The user can grasp the basic
differences of the two methods by studying the information section.
Fig. 6.3.30 Concrete Simulation
The concrete simulation is a generic tool for comparing both methods (Fig.
6.3.30). The main functions of the simulation are as follows:

106
1. The user can set preferences such as concrete maximum compression stress,
reinforcing bar yield stress, and grid parameters. The grid parameters are used to
define the real-world dimensions of the geometry.
2. By manipulating individual members, the user can draw beam cross sections, such
as rectangular and triangular shapes. The members can be generated and deleted
by "Click-and-Drag" motion. Dimensions of the cross section can be adjusted by
moving the end of the members.
3. Reinforcing bars can be applied, moved, and deleted. The positions of the bars
relative to the cross section are computed automatically in the simulation.
4. The user can then compute the permissible ultimate moment capacity of the
concrete beam and the position of the neutral axis using the strength design
method. Under this same moment, the stress distribution can be obtained using the
working stress method.
5. The computational stresses from the working stress method can be compared with
the concrete maximum compression stress and reinforcing bar yield stress. The
strength design method uses the computational stresses to calculate the moment.
6. The geometric shape can be deleted, and new ones can be built.
To link the concrete module to the virtual world, an overpass on the highway can
be built using the simulation (Fig. 6.3.31). The cross section of the beam in the virtual
world is generated from the concrete drawn by the user. The number of the beams can be
specified to let the user design a reasonable overpass. The beams are below the road, but
the user can adjust the transparency of the road to make the beams visible.

107
Fig. 6.3.31 Overpass Designed by the Concrete Simulation
The concrete simulation illustrates a successful example of using the geometric
object as input for the simulation. A simulation developed for educational purpose
usually has low investment and is usually completed by a graduate student with a half-
time appointment in two or three months. With limited human and financial resources, it
is difficult to create geometric objects dynamically and use the geometric objects as input
for the simulation. The concrete module was successful in solving this problem by
allowing the user to draw the desired geometric objects as input for the simulation. The
concrete simulation can recognize the different shapes of the geometric objects and
choose appropriate formula based on the shapes. This is a unique feature of the concrete
simulation, and the same technique can be used in developing other engineering
simulations.

108
6.3.9 Piping Network
The piping network module was designed for the Environmental Engineering I
course at the University of Oklahoma. Its main purpose was to provide an easily assessed
generic solver for pipe networks. Piping networks are a basic problem in civil
engineering. The computer is needed for design and analysis due to their complexity, and
commercial software is available for this kind of task. It is important however for a civil
engineer to understand the theory and concepts behind the automatic analysis. Thus, it is
useful to provide an Internet-based semi-automatic solver for piping networks. The
students can learn the concepts through exploration.
Fig. 6.3.32 Information Section of the Piping Network Module

109
The information section (Fig. 6.3.32) of the piping network consists of four
subtopics: Principles, Conservation of Mass, Conservation of Energy, and Piping System
Analysis. These concepts were only briefly covered with text explanations. By studying
these subtopics, the user can have a basic understanding of the concepts related to the
piping network analysis.
The principles of conservation and related equations, which were explained in the
information section, are at the heart of the piping network simulation. Two systems of
equations can be used to solve the same network problem. One is a system of Q-
Equations, and the other is a system of H-Equations. Numerical methods are used to
solve the systems of equations. The system of Q-equations is based on the continuity
(conservation of mass) and work-energy principles, and assumes the flows as the
principal unknowns. To satisfy the continuity principle, the flow into a junction must be
equal to the flow out of the junction (Eq. 6.3.2).
0j iQJ Q− =∑ (6.3.2)
where
jQJ is the flow out of the junction (demand).
iQ is the flow into the junction from the pipe i.
To satisfy the work-energy principle, the sum of the head loss around each independent
loop must be equal to zero (Eq. 6.3.3).
0fiH =∑ (6.3.3)
where
fiH is the functional head loss in pipe i.

110
The head loss can be expressed as a function of discharge via the Hazen-Williams or
Manning equation. The system of H-equations is based on the continuity principle and
assumes head losses as the principal unknowns. The form of H-equations is the same as
Eq. 6.3.2.
The simulation allows the user to draw the piping network dynamically. The
lengths of the individual pipes are automatically computed based on a grid system. The
pipe diameter and roughness coefficient can be modified. A reservoir can be added to the
network, and its elevation can be specified. At each node, a demand can be defined. To
solve the system of Q-Equations, one or multiple independent loops may be needed due
to the work-energy principle. Theoretically, algorithms exist that can find the necessary
independent loops. It is however an important learning process for the user to identify
and specify the loops. This simulation, therefore, requires the user to pick the necessary
independent loops by clicking on the appropriate areas.
AB
C
Piping Network
αβ
γϕ
Fig. 6.3.33 Loop Searching Algorithm

111
An algorithm is needed to search the selected loop, because the loop data are not
stored internally in the simulation. The loop-searching algorithm works as follows (Fig.
6.3.33):
1. Obtain the mouse position A.
2. Find the nearest node B to the mouse position. Make sure the line AB has no
intersection point with any existing edge besides the nodes. If it has, move to the
second nearest node, name it as B, and check the intersection point again.
3. Find all of edges with the common node B. Compute the angles between these
edges and line AB. Obtain the edge with the minimum angle and name it as BC. C
is the next node of this edge. Record this edge.
4. Again find all of edges with common node C. Delete BC edge from these edges.
Formulate the line equation of BC. Find another nodes of these edges and check if
they are located on the same side of BC edge as the mouse position A. If yes,
compute the angles between the edges and edge BC. The edge with a minimum
angle is the desired edge. Record this edge.
5. Repeat step 4 until the edge reaches node B.
The computational results are presented graphically to the user. Flow rates and
their directions along the pipes are visually demonstrated (Fig. 6.3.34). Likewise, flow
velocities and losses along the pipes are computed and displayed the same way. Pressures
and heads at nodes can also be presented if the user clicks appropriate buttons.
The main features of the simulations are as follows:
1. Click the 'Preference' button to set the preferences. The user can specify the unit,
pipe diameter, roughness coefficient, and node elevation.
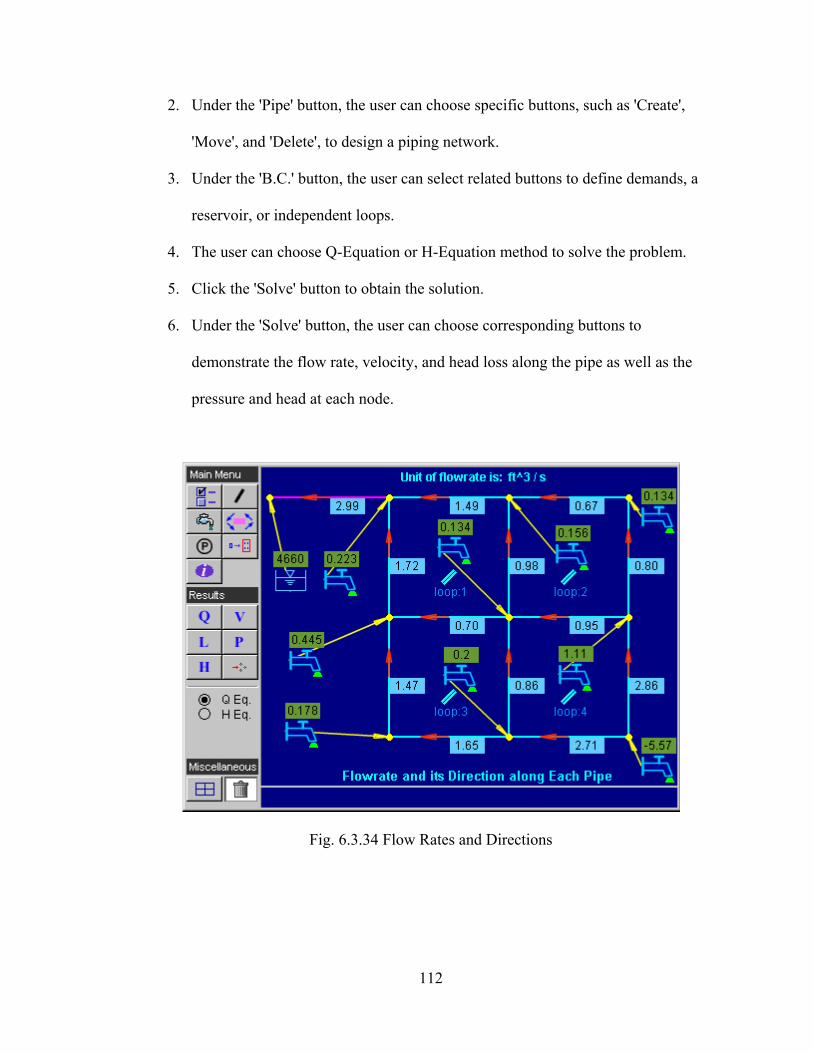
112
2. Under the 'Pipe' button, the user can choose specific buttons, such as 'Create',
'Move', and 'Delete', to design a piping network.
3. Under the 'B.C.' button, the user can select related buttons to define demands, a
reservoir, or independent loops.
4. The user can choose Q-Equation or H-Equation method to solve the problem.
5. Click the 'Solve' button to obtain the solution.
6. Under the 'Solve' button, the user can choose corresponding buttons to
demonstrate the flow rate, velocity, and head loss along the pipe as well as the
pressure and head at each node.
Fig. 6.3.34 Flow Rates and Directions
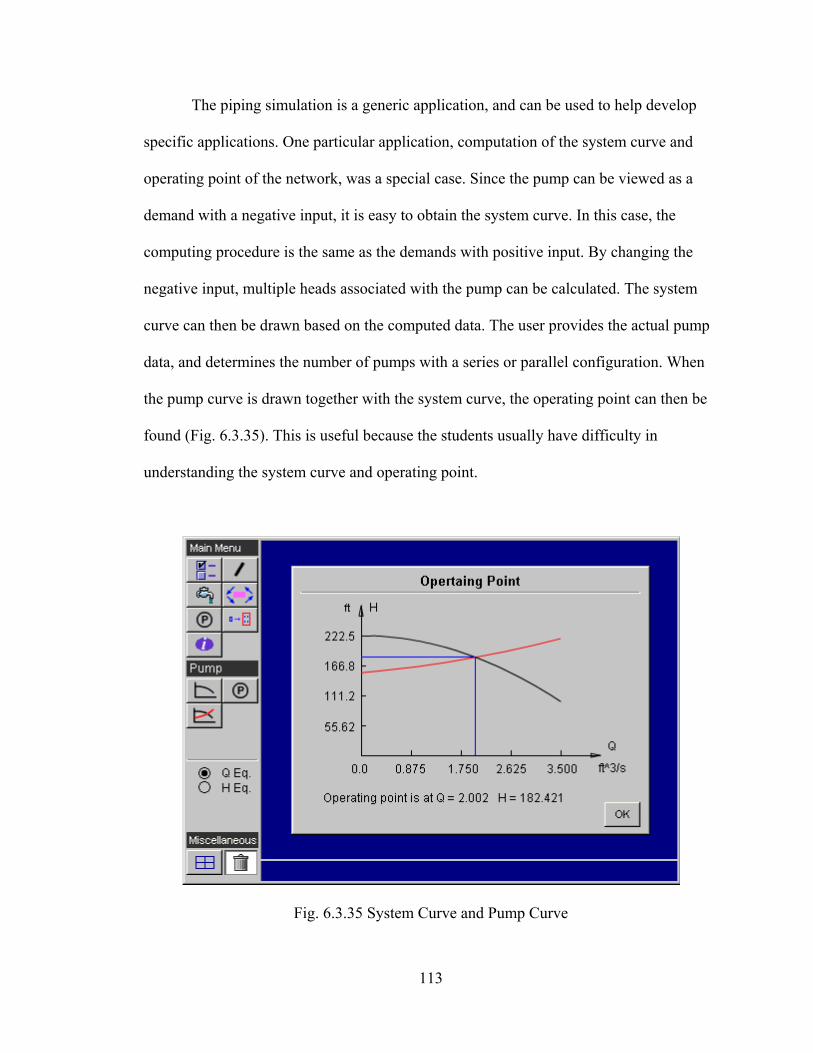
113
The piping simulation is a generic application, and can be used to help develop
specific applications. One particular application, computation of the system curve and
operating point of the network, was a special case. Since the pump can be viewed as a
demand with a negative input, it is easy to obtain the system curve. In this case, the
computing procedure is the same as the demands with positive input. By changing the
negative input, multiple heads associated with the pump can be calculated. The system
curve can then be drawn based on the computed data. The user provides the actual pump
data, and determines the number of pumps with a series or parallel configuration. When
the pump curve is drawn together with the system curve, the operating point can then be
found (Fig. 6.3.35). This is useful because the students usually have difficulty in
understanding the system curve and operating point.
Fig. 6.3.35 System Curve and Pump Curve

114
Fig. 6.3.36 Piping System Deposited in the 3D Virtual World (Looking from below
ground upward)
There are multiple unique features in the piping network simulation. Similar to
the structural analysis and concrete modules, it provides an intuitive way to draw, move,
and delete the pipes. The user can visually define the reservoir and demands in a
straightforward and convenient way. The simulation automatically records the index of
each node and pipe. This minimizes the tedious work of preparing the data of the
network. The computational results are graphically presented; the user therefore does not
need to read the result tables. Once the system curve are computed and drawn, the
operating point is found and presented visually to the user. Also, a piping system can be
deposited in the virtual world (Fig. 6.3.36).

115
6.4 Distributed Collaborative Geometric Modeling
6.4.1 Introduction
The Virtual City is not only for engineering education as discussed previously,
but also for engineering design. Traditionally, engineers use an expensive
CAD/CAE/CAM package to complete design projects. If they are scattered in different
locations, they travel and meet to discuss design issues. However, the omnipresence of
the Internet has opened a new window to develop unprecedented engineering design
tools. These tools can overcome the difficulties related to conventional design tools, such
as the lack of collaborative capabilities. The geometric modeling module is one such
prototype that internally supports collaboration of remote users. It consists of two
components: a client-side geometric modeling application, and a multi-user server
application. The client-side application performs geometric modeling while the server-
side application manages communication and coordination. Two technologies:
Shockwave and Java were mainly used to implement the module. The reason to employ
two different technologies is that Shockwave could not shade 3D geometric models at the
time this research was done. Java was therefore selected to help shade geometric models
generated by Shockwave simulations.
6.4.2 Server-side Application
Theoretically, applications can communicate with each other directly through the
Internet, but they need to know each other’s IP addresses in advance. This is particularly
inconvenient when a user’s computer is configured to obtain a dynamic IP address. Also,
these applications cannot run inside a browser, because the browser restricts direct

116
communication between client computers for security reasons. Therefore another
approach was adopted, which uses a server-side application to avoid difficulties
associated with direct communications. The browser-based client-side applications can
easily talk to the server-side application. The server-side application can then route
messages to interested client-side applications.
6.4.2.1 Fundamentals of the Internet Used in the Geometric Modeling Module
The communication between the server-side and client-side applications through
the Internet is a complex procedure, however, the user only experiences the sending and
receiving of data. To explain how data is transmitted over the Internet, a four-layer model
is often used (Fig. 6.4.1). At the lowest level are various networking protocols, denoted
as NET1, NET2, etc. The second layer consists of the Internet Protocol (IP). The third
layer is a transport layer that contains two main protocols - the Transmission Control
Protocol (TCP) and the User Datagram Protocol (UDP). Above the third layer is an
application protocol layer that consists of a number of protocols, such as the File Transfer
Protocol (FTP) and the HyperText Transport Protocol (HTTP).
When the client-side application of the client computer sends data to a server-side
application of the server computer, the data usually goes through the application protocol
layer, the transport layer, the IP layer, and finally the first layer to the physical link.
When the server-side application of the server computer receives data from the client-side
application of the client computer, the data usually goes from the physical link to the first
layer, the IP layer, the transport layer, and finally the application protocol layer. In
practice, the networking Application Programming Interface (API) is used to hide the
complexity and details of protocols.

117
DATA NETWORK
TFTP
NETn
IP
Client Computer
Client-side Application
FTP HTTP NV
TCP UDP
NET1 NET2 ...
TFTP
NETn
IP
Server Computer
Server-side Application
FTP HTTP NV
TCP UDP
NET1 NET2 ...
IP = Internet Protocol TCP = Transmission Control ProtocolUDP = User Datagram Protocol FTP = File Transfer ProtocolHTTP = HyperText Transport ProtocolTFTP = Trivial File Transport Protocol
Fig. 6.4.1 Internet Four-layer Model
6.4.2.2 Multi-user Server
The networking API was used to develop the client-side geometric modeling and
server-side multi-user applications of the Virtual City. The server-side multi-user
application plays an essential role in collaboration. It includes two programs: a
Shockwave multi-user server and a Java multi-user server. Both are capable of receiving
and delivering packets to clients-side applications (Fig. 6.4.2). The reason for two multi-
user servers is that the geometric modeling module utilized two different Internet
technologies: Shockwave and Java. Shockwave simulations can only communicate with

118
the Shockwave multi-user server, and Java applets can be easily programmed to talk with
the Java multi-user server.
Multi-user Server
Internet
Designer A(California)
Designer B(Oklahoma)
Designer C(Michigan)
Designer A sendspacket P
Both designer B and Creceive packet P
Fig. 6.4.2 Function of Multi-user Server
The Shockwave multi-user server works with the Shockwave simulation of the
client-side geometric modeling module. The Java multi-user server, which was developed
for the collaborative geometric modeling and engineering analysis modules, delivers the
packet of one client’s applet to the applets of other clients. The design concepts of both
servers are similar, and both keep a table for each design team. When the user starts the
geometric modeling application, both the Shockwave simulation and Java applet send a
registration packet with the name of design team, client’s IP address, and port numbers to
their corresponding multi-user servers. The multi-user servers record the data in the
related table. Because the IP address and port number is unique at any given time, the

119
Shockwave multi-user server then uses them to communicate with the Shockwave
simulation, and the Java multi-user server uses them to talk with the Java applet. As the
design object is shared only in the same design team, members are not allowed to
communicate between different design teams.
6.4.2.3 Design of Java Multi-user Server
The Shockwave multi-user server is a standard extension of the Director program.
There was no need to develop a new one for the Shockwave simulation. However, no
standard Java multi-user server was available. Java was used to design a Java multi-user
server for the distributed collaborative geometric modeling and engineering analysis
module. Socket implementation was chosen, because it is widely accepted in the
networking world. Both TCP socket and UDP socket were used. Since UDP is a
connectionless protocol, only unreliable channels are provided. Due to an underlying
limitation in the size of UDP packets, the maximum size of a packet that can be sent in
one time is 8 Kbytes. No data priority is currently considered with the packet.
Internally, a session manager was used to control communication between team
members in the Java multi-user server. When users log into the environment, they have to
provide a team account name, username, and password. As the team account name is
unique in the environment, it is used as the name of the session. If the user is the first
team member to log in the environment, a new session is initiated, and named after the
team account. Multiple communication channels associated with the session are created
simultaneously. Each channel corresponds with a particular action. Other team members
can then join the session and communication channels. It is highly desirable to use
different channels for different actions. This is because (in this case) only one specific
120
action is associated with each channel. When an appropriate command message is sent to
a particular channel, the channel’s consumer can take action easily and does not need to
assess how to act based on the received message. The channel uses an event model, and
takes action only when receiving a command message. For example, when one team
member changes the color of the design object, a command message is automatically sent
to the color channel, and therefore the consumer of the color channel updates the
computers of other team members. When no event occurs, the consumer of the channel is
idle. This is particularly efficient because no computing power is used when nothing
happens.
In a collaborative environment, discussion of design ideas before taking actions is
encouraged. A chat room, therefore, was designed to allow the users to exchange ideas.
When multiple participants are working on the same design object, they are strongly
encouraged to coordinate their actions. This is because design is a constructive activity
and makes sense for participants communicate with each other in a collaborative
environment.
6.4.3 Client-side Application
Similar to the server-side application, the client-side geometric modeling
application also consists of two programs: a Shockwave simulation and a Java applet.
The Shockwave simulation generates 3D wireframe models (Fig. 6.4.3), and the Java
applet shades them (Fig. 6.4.4). The applet was developed using Java 1.3 and Java 3D
1.2.1. In order to run the applet, a Java 1.3 plug-in and a Java 3D 1.2.1 plug-in are
necessary to be downloaded from the web site of Sun Microsystems and installed. If the
user wants to run the applet while no Java 1.3 plug-in is available, the browser will

121
automatically ask the user if he/she wants to download the Java 1.3 plug-in. If the user
says ‘yes’, the Java 1.3 plug-in will be automatically downloaded and installed. However,
the user has to download the Java 3D 1.2.1 plug-in manually.
Fig. 6.4.3 Shockwave Movie for Creating the 3D Wireframe Model
The general procedure of building a geometric model involves a number of steps.
First the user creates a 3D wireframe model, assigns it a name, and saves it on the server.
The user then starts the Java applet, and selects the same name given to the wireframe
model. The Java applet loads the geometric model data generated by the Shockwave
simulation from the server, renders it, and displays it. Both work simultaneously to
display the same model. If the user makes any change to the 3D wireframe model, the
change will be propagated to the model automatically in the Java applet, because both of
them share the same model name. As discussed previously, the Shockwave simulation
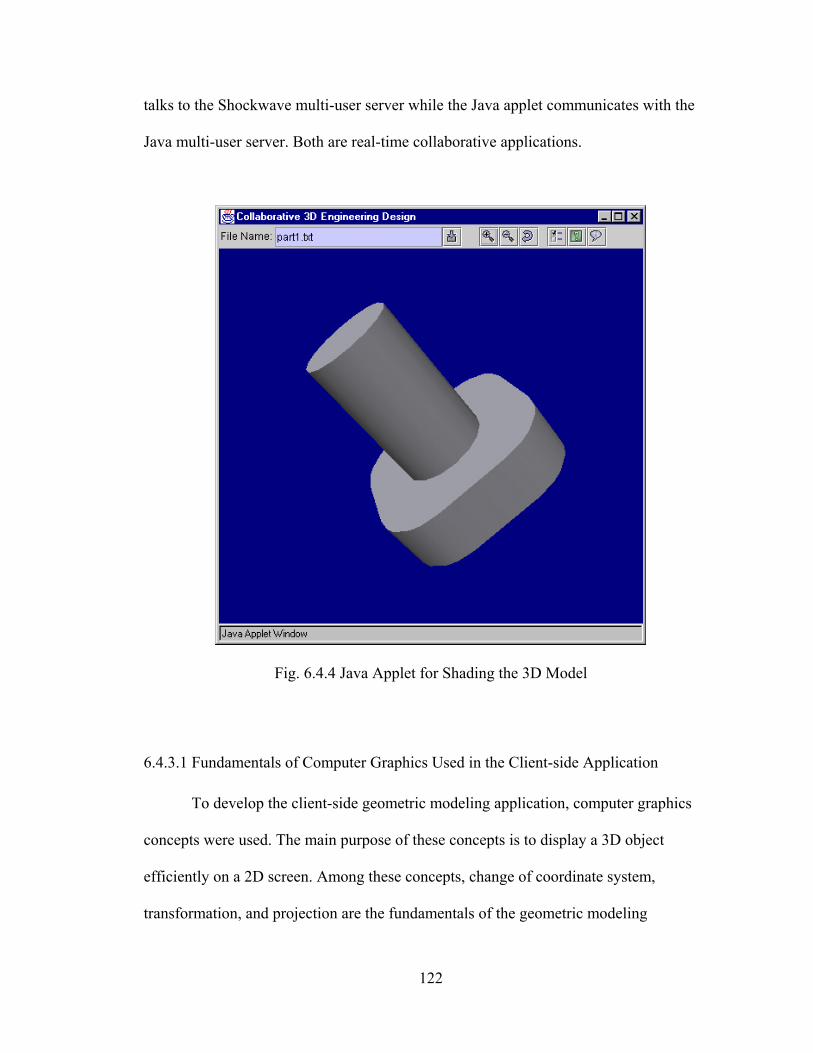
122
talks to the Shockwave multi-user server while the Java applet communicates with the
Java multi-user server. Both are real-time collaborative applications.
Fig. 6.4.4 Java Applet for Shading the 3D Model
6.4.3.1 Fundamentals of Computer Graphics Used in the Client-side Application
To develop the client-side geometric modeling application, computer graphics
concepts were used. The main purpose of these concepts is to display a 3D object
efficiently on a 2D screen. Among these concepts, change of coordinate system,
transformation, and projection are the fundamentals of the geometric modeling
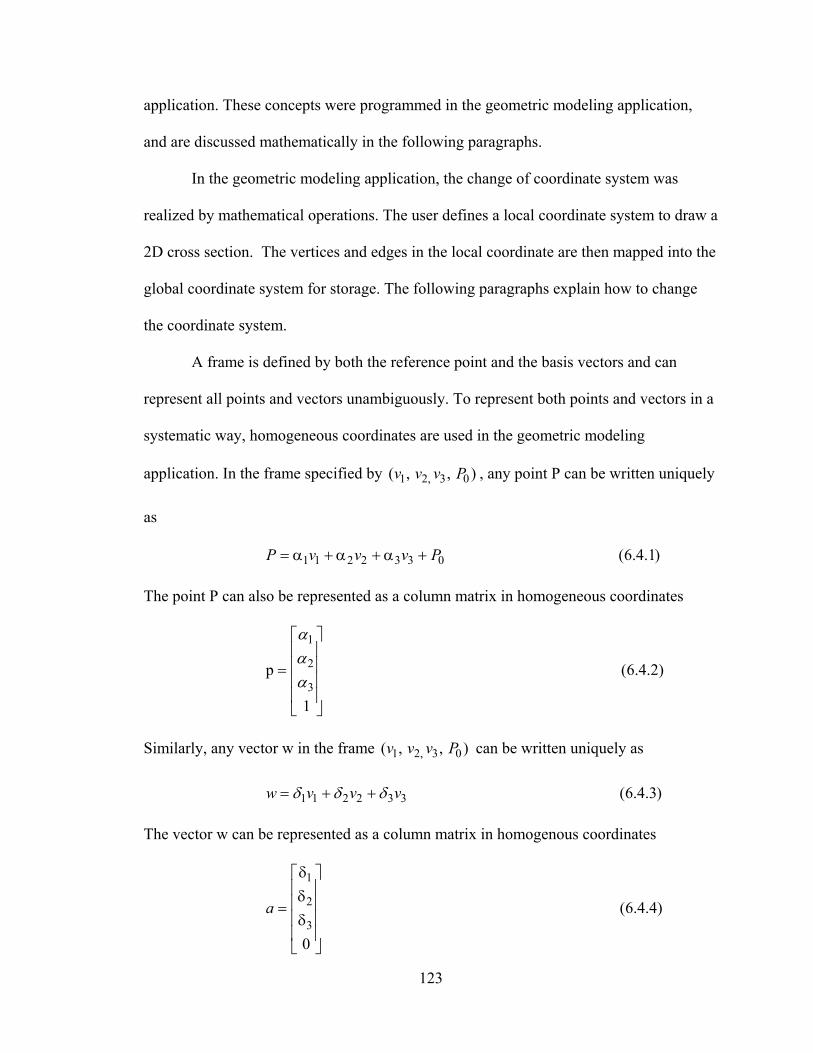
123
application. These concepts were programmed in the geometric modeling application,
and are discussed mathematically in the following paragraphs.
In the geometric modeling application, the change of coordinate system was
realized by mathematical operations. The user defines a local coordinate system to draw a
2D cross section. The vertices and edges in the local coordinate are then mapped into the
global coordinate system for storage. The following paragraphs explain how to change
the coordinate system.
A frame is defined by both the reference point and the basis vectors and can
represent all points and vectors unambiguously. To represent both points and vectors in a
systematic way, homogeneous coordinates are used in the geometric modeling
application. In the frame specified by 1 2, 3 0( , , )v v v P , any point P can be written uniquely
as
1 1 2 2 3 3 0 (6.4.1)P v v v P= α + α + α +
The point P can also be represented as a column matrix in homogeneous coordinates
1
2
3p (6.4.2)
1
ααα
=
Similarly, any vector w in the frame 1 2, 3 0( , , )v v v P can be written uniquely as
1 1 2 2 3 3 (6.4.3)w v v vδ δ δ= + +
The vector w can be represented as a column matrix in homogenous coordinates
1
2
3(6.4.4)
0
a
δ δ = δ

124
Both the points and vectors therefore can be represented as column matrices.
Assume 1 2, 3 0( , , )v v v P and 1 2, 3 0( , , )u u u Q are two frames, the basis vectors and
reference point of the second frame can be expressed in terms of the first frame as
1 1
2 2
3 3
0 0
(6.4.5)
u vu v
Mu vQ P
=
M is a matrix, which has the form
11 12 13
21 22 23
31 32 33
41 42 43
00
(6.4.6)01
M
γ γ γ γ γ γ = γ γ γ γ γ γ
If a is a vector or a point in frame 1 2, 3 0( , , )v v v P and b is a vector or point in frame
1 2, 3 0( , , )u u u Q , the following is a general equation used to change coordinate systems
(6.4.7)Ta M b=
This equation was programmed in the client-side geometric modeling application. By
applying this equation, any vector and vertex in one coordinate system can be converted
easily into another system.
Transformation is the second essential concept used in developing the geometric
modeling application. Translation, rotation, and scaling are three elements of
transformation. Transformation can be realized by multiplying a matrix if the points and
vectors are represented using homogeneous coordinates. The following equations were
used in programming transformation in the geometric modeling application.

125
If point p is moved to p’ by a displacement vector ( , , )x y zα α α , the following
equation is employed to perform translation
' (6.4.8)p Tp=
where
1 0 00 1 0
(6.4.9)0 0 10 0 0 1
x
y
zT
α α = α
If point p is scaled to 'p by , ,x y zβ β β along x, y, z axis, the following equation
is used to perform scaling.
' (6.4.10)p Sp=
where
0 0 00 0 0
(6.4.11)0 0 00 0 0 1
x
y
zS
β β = β
If point p is rotated to p’ about the z axis by an angle θ , the following equation is
used to perform rotation.
' (6.4.12)zp R p=
where
cos sin 0 0sin cos 0 0
(6.4.13)0 0 1 00 0 0 1
zR
θ − θ θ θ =
Similar equations can also be obtained for rotation about the x and y axis.

126
Projection is the third essential concept used in programming the geometric
modeling application. Projection’s main purpose is to display a 3D object correctly on a
2D screen. There are two kinds of projections: perspective and parallel. Mathematically,
they can be obtained by multiplying a projection matrix. Perspective projection assumes
that there exists a center of projection (COP) (Fig. 6.4.5). All of the projectors meet at
COP. If COP is moved to infinity, the projectors become parallel and the projection is
called parallel projection (Fig. 6.4.6).
Center of Projection
Projection plane
3D ObjectProjector
Fig. 6.4.5 Perspective Projection
Projection plane
3D ObjectProjector
Fig.6.4.6 Parallel Projection

127
Both projections were used in the geometric modeling application. Parallel
projection was used in the Shockwave geometric modeling simulation due to its ease of
implementation. Perspective projection gives the user a better impression of 3D effect,
and was employed in the Java shading applet.
6.4.3.2 Data Structures
Besides the graphic concepts, the data structure used to store 3D data is also of
particular importance. This is because all of the 3D operations were designed on top of
the data structure. In this research, a B-Rep data structure is used, because it can be easily
implemented. The B-Rep data structure stores the basic elements composing the
boundary of a solid: the vertices, the edges, and the faces. Table 6.4.1 shows the three-
part data structure representing the solid in Fig. 6.4.7.
Table 6.4.1 B-Rep Data Structure
Vertex Table Edge Table Face Table Vertex Coordinates Edge Vertices Face Edges
V1 X1, Y1, Z1 E1 V1, V2 F1 E4, E3, E2, E1 V2 X2, Y2, Z2 E2 V2, V3 F2 E5, E12, E8, E4 V3 X3, Y3, Z3 E3 V3, V4 F3 E9, E5, E1, E6 V4 X4, Y4, Z4 E4 V4, V1 F4 E2, E7, E10, E6 V5 X5, Y5, Z5 E5 V1, V5 F5 E3, E8, E11, E7 V6 X6, Y6, Z6 E6 V2, V6 F6 E9, E10, E11, E12 V7 X7, Y7, Z7 E7 V3, V7 V8 X8, Y8, Z8 E8 V4, V8
E9 V5, V6 E10 V6, V7 E11 V7, V8
E12 V8, V5

128
V1 V2
V3V4
V5 V6
V7V8
E1E2
E3E4
E5E6
E7E8
E9E10
E11E12
F2
F3
F4
F5F6
F1
Fig. 6.4.7 Data Structure Used for Representing a Solid
Each row of the vertex table stores the x, y, and z coordinates of the vertices.
These coordinates are defined with respect to the world coordinate system. The edge
table stores the end vertices of each edge. The face table stores the boundary edges for
each face. The order of edges for each face is obtained by traversing it counterclockwise
when viewed from the outside. By storing the edges in this way, the inside and the
outside of the solid can be distinguished. Both the Shockwave simulation and the Java
applet used the B-Rep data structure.
In addition to the B-Rep data structure, the stack data structure was also used
extensively in developing the Shockwave geometric modeling simulation. Shockwave
lingo is a special programming language, which has a cast library to manage all of the
visual entities. To display these visual entities on the stage, they must be placed in
different channels. The channel is a container to store visual entities in Director. Since all
of the line entities are dynamically created and may be deleted after creation, it was a

129
challenge to manage the free channels efficiently. One solution is to use stack data
structures.
Stacks are called the last-in, first-out data structures, which store a set of objects
in a primitive data structures such as arrays and restrict operations such as ‘delete’ and
‘insert’ to apply only to the “top” of the data structure. In stack terminology, the delete
operation is called ‘pop’, and the insert operation is called ‘push’. A stack data structure
can be used to remember the past information, so this information will be available when
needed. Another important usage of the stacks is that stacks can be employed to manage
free space. Using stacks, some algorithms can be implemented easily, such as the non-
recursive inorder, and preorder and postorder traversals of the binary trees. The
specification of an abstract data type for a stack usually has six key operations: create an
empty stack, check if the stack is empty, get the object from the top of the stack without
removing it, remove the object from the top of the stack, insert a new object on the top of
the stack, and return the number of current objects in the stack.
Channel 4
Channel 5
Channel 6
Channel 7
Channel 4
Channel 5
Channel 6
Channel 7
Channel 1Channel 2
Channel 3
Channel 3
Channel 2
Channel 1
Delete Channel 1 & 2
Usedchannels
Freechannels
Freechannels
Usedchannels
Fig. 6.4.8 Stack Data Structure

130
Shockwave Lingo does not support a built-in stack data structure, but has a list
data structure that can be used to simulate the stack data structure. The concept of the
stack data structure can then be used to manage the free sprite channels and the naming of
the cast members (Fig. 6.4.8). Free channels are pushed into a stack when the application
starts. A channel is popped out from the stack when the application needs it. If a line on
that channel is deleted, that channel is free again and is pushed back into the stack for
later use. Using a stack, the problem of keeping track of the free channels in the
Shockwave simulation was efficiently solved. The naming of the cast members was
solved using the same technique. Appendix B illustrates using a list in Lingo to simulate
the functions of stack data structures.
6.4.3.3 Implementation Algorithms
In addition to data structures, numerous algorithms were used in programming the
geometric modeling application. Among these algorithms are the drawing operations:
‘Corner’, ‘Trim’, and ‘Round’. As an example, the algorithm to compute an intersection
point is discussed in the following paragraph. This example shows the importance of
choosing efficient algorithms.
Assume there are two lines. The first line is defined by 1 1 1 1( , , )P x y z and
2 2 2 2( , , )P x y z while the second line by 3 3 3 3( , , )P x y z and 4 4 4 4( , , )P x y z . The intersection
point is needed. There are numerous ways to compute the intersection point. The
parametric method is more effective, because additional useful information can be
obtained in addition to the intersection point.
In a parametric form, any point on the first line can be represented as

131
1 1 2 1
1 1 2 1
1 1 2 1
( )( ) (6.4.14)( )
x x t x xy y t y yz z t z z
= + − = + − = + −
Likewise, any point on the second line can be represented as
3 2 4 3
3 2 4 3
3 2 4 3
( )( ) (6.4.15)( )
x x t x xy y t y yz z t z z
= + − = + − = + −
Where 1t and 2t are parameters that can be any value.
As the intersection point is needed, the following equations should be satisfied.
1 1 2 1 3 2 4 3
1 1 2 1 3 2 4 3
1 1 2 1 3 2 4 3
( ) ( )( ) ( ) (6.4.16)( ) ( )
x t x x x t x xy t y y y t y yz t z z z t z z
+ − = + −+ − = + −+ − = + −
By solving the first two equations, the values of 1t and 2t can be obtained. They are then
inserted into the third equation. If the third equation is satisfied, there exists an
intersection point. Otherwise, no intersection point exists between these two lines.
If an intersection point exists between two lines, 1t and 2t can be used to
determine the location of the point. If 10 1.0t≤ ≤ , the intersection point is located
between 1P and 2P . If 1 0t < or 1 1.0t > , the intersection point is located outside 1P and 2P .
6.4.3.4 Functions of the Geometric Modeling Application
The geometric modeling application consists of two components: a Shockwave
simulation and a Java applet. Their interfaces were also designed using two different
technologies: Shockwave and Java. The functions of the two components are therefore
different. The Shockwave simulation is used for building geometric models while the
applet is for shading models.
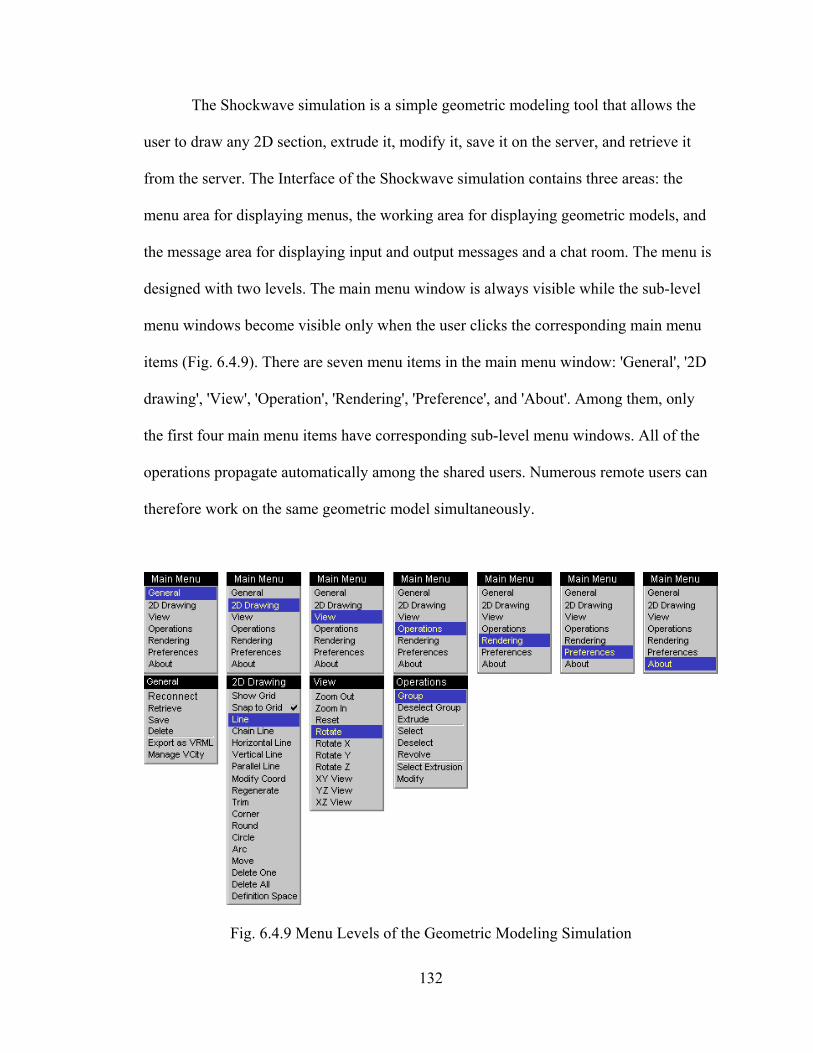
132
The Shockwave simulation is a simple geometric modeling tool that allows the
user to draw any 2D section, extrude it, modify it, save it on the server, and retrieve it
from the server. The Interface of the Shockwave simulation contains three areas: the
menu area for displaying menus, the working area for displaying geometric models, and
the message area for displaying input and output messages and a chat room. The menu is
designed with two levels. The main menu window is always visible while the sub-level
menu windows become visible only when the user clicks the corresponding main menu
items (Fig. 6.4.9). There are seven menu items in the main menu window: 'General', '2D
drawing', 'View', 'Operation', 'Rendering', 'Preference', and 'About'. Among them, only
the first four main menu items have corresponding sub-level menu windows. All of the
operations propagate automatically among the shared users. Numerous remote users can
therefore work on the same geometric model simultaneously.
Fig. 6.4.9 Menu Levels of the Geometric Modeling Simulation

133
Fig. 6.4.10 Pop-up Window for Retrieving Geometric Files
There are six menu items in the ‘General’ sub-level menu window: 'Reconnect',
'Retrieve', 'Save', 'Delete', 'Export as VRML', and 'Manage City'. In the Shockwave multi-
user server, there is an idle timer to control connections. If no activity occurs in a
connection for a given time, the multi-user server will drop that connection. However, the
user can establish the connection again by clicking on the 'Reconnect' menu item. If the
user clicks on the 'Retrieve' menu item, the user can download data files from the server
and then retrieve geometric models (Fig.6.4.10). If the user clicks on the 'Save' menu
item, the user can specify a file name to the current geometric model and save it on the
server (Fig. 6.4.11). If the user employs the same file name as an existing file, the
existing file will be overwritten. If the user clicks on the 'Delete' menu item, the user can
delete any existing geometric data file. Also, the geometric model can be exported in a
VRML format and deposited in the 3D virtual world if the user clicks on the 'Export as
VRML'. Figure 6.4.12 illustrates buildings designed by the geometric modeling
application. Multiple objects may be deposited in the Virtual World. The user can

134
manage the Virtual World by deleting some or all of these objects if he/she clicks on the
'Manage City' menu item.
Fig. 6.4.11 Pop-up Window for Saving Geometric Files
Fig. 6.4.12 Buildings Designed by the Geometric Modeling Application

135
The ‘2D Drawing’ sub-level menu window contains eighteen menu items: 'Show
Grid', 'Snap to Grid', 'Line', 'Chain Line', 'Horizontal Line', 'Vertical Line', 'Parallel Line',
'Modify Coord', 'Regenerate', 'Trim', 'Corner', 'Round', 'Circle', 'Arc', 'Move', 'Delete One',
'Delete All', and 'Definition Space'. Each menu item is associated with a specific drawing
operation. The user can select appropriate menu items to draw 2D sections on the
working area. If the user clicks on a menu item, the menu item is selected and becomes
highlighted. A grid is used to help locate the positions. The user can choose to show the
grid by clicking on the 'Show Grid' item. The grid can be activated or deactivated by
clicking on the 'Snap to Grid' item. If the 'Line' item becomes highlighted, a line with
random direction can then be drawn by "click-and-drag" motion. If the user selects the
'Chain Line' item, clicking different locations can create chain lines. If the user chooses
the 'Horizontal Line' or 'Vertical Line' item, horizontal or vertical lines can be generated
by "click-and-drag" motion. If the 'Parallel Line' is highlighted, parallel lines can be
created based on a specific line. If accurate coordinates are necessary, the user can click
on the particular node and type in the actual coordinate values when the 'Modify Coord'
item is highlighted. Clicking on the 'Regenerate' item updates the geometric model based
on the inputted coordinate values. A line can be used to trim other lines when the 'Trim'
item is selected. Two intersecting lines can generate a corner when the 'Corner' item is
picked. To create a corner, the user picks two desired lines, and then indicates the
quadrant. When the 'Round' item is highlighted, the user can generated a round corner
between two lines by providing a radius value. If the 'Circle' or 'Arc' item is selected, the
user can create a circle or an arc. The circle and the arc are simulated by a number of
lines. As a result, the whole circle and arc cannot be moved at the same time. The lines
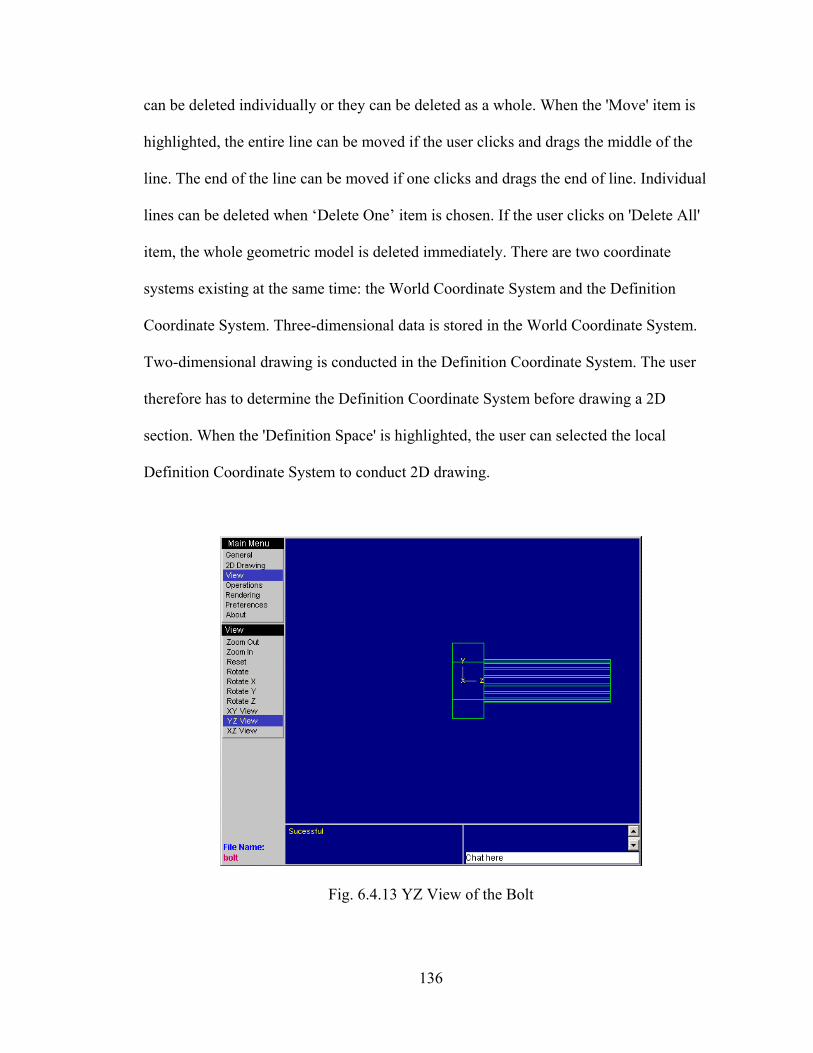
136
can be deleted individually or they can be deleted as a whole. When the 'Move' item is
highlighted, the entire line can be moved if the user clicks and drags the middle of the
line. The end of the line can be moved if one clicks and drags the end of line. Individual
lines can be deleted when ‘Delete One’ item is chosen. If the user clicks on 'Delete All'
item, the whole geometric model is deleted immediately. There are two coordinate
systems existing at the same time: the World Coordinate System and the Definition
Coordinate System. Three-dimensional data is stored in the World Coordinate System.
Two-dimensional drawing is conducted in the Definition Coordinate System. The user
therefore has to determine the Definition Coordinate System before drawing a 2D
section. When the 'Definition Space' is highlighted, the user can selected the local
Definition Coordinate System to conduct 2D drawing.
Fig. 6.4.13 YZ View of the Bolt
137
The ‘View’ sub-level menu window includes ten items: 'Zoom Out', 'Zoom In',
'Reset', 'Rotate', 'Rotate X', 'Rotate Y', 'Rotate Z', 'XY View', 'YZ View', and 'XZ View'.
These menu items provide interactive viewing operations. The user can zoom in, zoom
out, and reset the scale of 3D models by clicking on the 'Zoom Out', 'Zoom In', and
'Reset' items. The simulation supports free rotation as well as rotation about the x, y, and
z axes if the user clicks on the 'Rotate', 'Rotate X', 'Rotate Y', and 'Rotate Z' items. XY,
YZ, and XZ views can also be obtained when 'XY View', 'YZ View', and 'XZ View'
items are clicked (Fig. 6.4.13).
There are seven items in the ‘Operation’ sub-level menu window: 'Group',
'Deselect Group', 'Extrude', 'Select', 'Deselect', 'Revolve', 'Select Extrusion', and 'Modify'.
These menu items provide tools to generate 3D models. Two operations - extrusion and
revolution, are currently supported. A closed section can be extruded at a specified
distance to create a 3D model. The user first draws a closed 2D section in the definition
coordinate system. He/she then clicks on the 'Group' item to highlight it. The user next
picks two consecutive lines to select the whole section. Last, he/she clicks on the
'Extrude' item to specify the distance of the extrusion. If the user wants to pick a different
section, he/she can deselect the current one by clicking on the 'Deselect Group'. A profile
around an axis can be revolved to generate a 3D model (Fig. 6.4.14). The user first draws
an axis and a profile, and then clicks on the 'Select' item to highlight it. He/she next
selects the desired axis and profile. Last, the user clicks on the 'Revolve' item to create
the 3D model. An important feature of the geometric modeling application is that the
distance of the extrusion can be modified after the user conducts the extrusion. The user
first clicks on the 'Select Extrusion' item to highlight it, and then picks an edge along the
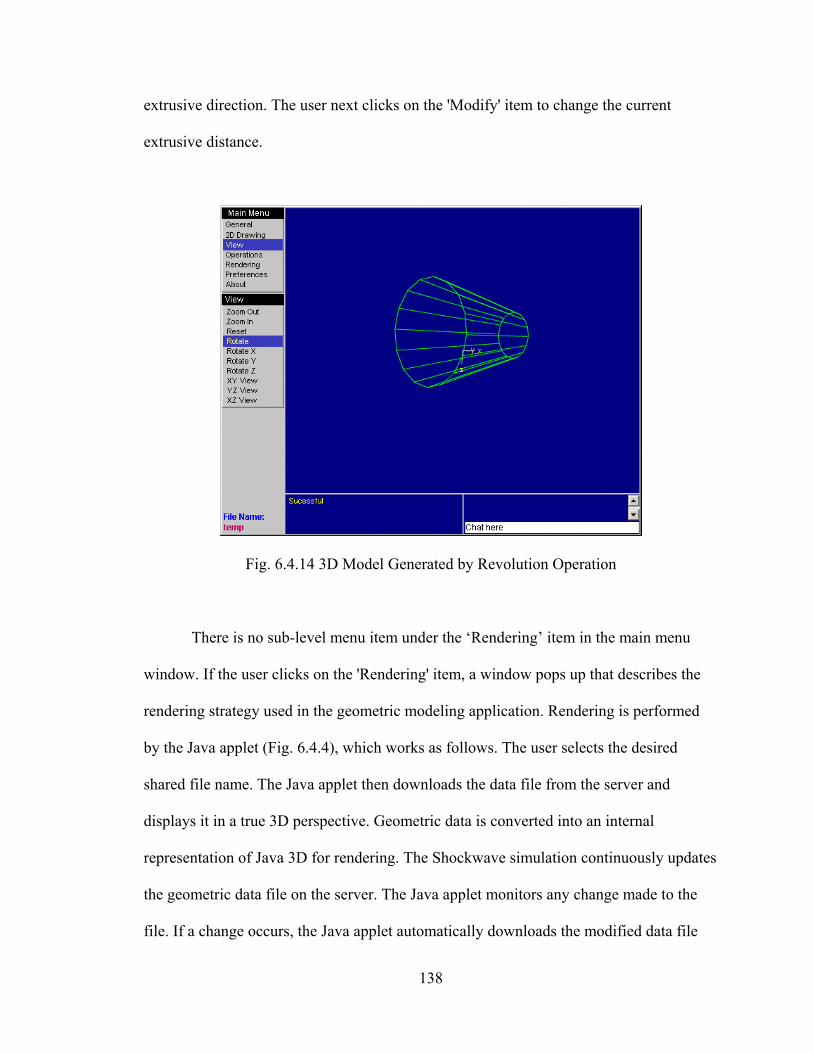
138
extrusive direction. The user next clicks on the 'Modify' item to change the current
extrusive distance.
Fig. 6.4.14 3D Model Generated by Revolution Operation
There is no sub-level menu item under the ‘Rendering’ item in the main menu
window. If the user clicks on the 'Rendering' item, a window pops up that describes the
rendering strategy used in the geometric modeling application. Rendering is performed
by the Java applet (Fig. 6.4.4), which works as follows. The user selects the desired
shared file name. The Java applet then downloads the data file from the server and
displays it in a true 3D perspective. Geometric data is converted into an internal
representation of Java 3D for rendering. The Shockwave simulation continuously updates
the geometric data file on the server. The Java applet monitors any change made to the
file. If a change occurs, the Java applet automatically downloads the modified data file

139
and redisplays it in the Java applet. A corresponding Java multi-user server works
simultaneously with the Java applet. If one user rotates the model, other users can see the
action and simultaneously obtain the same view of the model. The color of the displayed
geometric model can be modified, and any change to the color propagates to other users’
applets. The interface design of Java applet is easier than that of the Shockwave
simulation because Java provides standard interface-related classes. In addition, the
functions of this applet are relatively simple, because its main task is to render 3D
geometric models. It consists of two areas: 1) button and message area, and 2) working
area. Figure 6.4.15 illustrates the message and button area of the applet.
Fig. 6.4.15 Interface for Java Applet of the Geometric Modeling Application
Similarly, there is no sub-level menu item under the 'Preferences' and 'About'
items in the main menu window. If the user clicks on the 'Preferences' item, a window
pops up to let the user specify preferences (Fig. 6.3.16). There are three types of
preferences. The view volume should be specified based on the actual dimensions of the
model. It also determines the definition coordinate system. The zoom ratio controls the
behaviors of zooming operations. The next six parameters define the location of the
definition space in the world coordinate system. If the user clicks on the 'About' item, a
window pops up to show the author information of the application.

140
Fig. 6.4.16 Preference Window
6.4.4 Uniqueness
A number of unique features can be found in this distributed collaborative
geometric modeling module. It is a complex application that smoothly integrates
numerous Internet technologies, such as Java, Java 3D, Shockwave, ASP, SQL, VRML,
Perl, and the database. It is the first collaborative geometric modeling tool for
engineering education. Its collaborative capability encourages team spirit. It was
integrated seamlessly with the 3D virtual world by depositing the generated 3D geometric
objects into the virtual world. The generated geometric objects can be retrieved and
analyzed by the collaborative engineering analysis module.
Furthermore, its architecture is different from that of conventional collaborative
geometric modeling applications. Conventional applications usually have a geometric
modeling engine located on the server, and a client-side application is mainly used to
display the model. The traffic between the server and client is usually high in such

141
applications. However, in this research, the multi-user server only manages
communication between team members, and the client-side application takes care of
modeling. Due to the adoption of this architecture, the user can interact directly with the
geometric model to accomplish a variety of operations such as selecting geometric
entities. This architecture also minimizes network traffic, because there is no need to
download the geometric model after each operation.
A few unique programming techniques were employed in the development of the
module. The object-oriented concepts were used extensively to integrate the vector-based
graphic techniques. This significantly increases the readability of the codes. Standard
stack data structures were simulated by the list data structures of Lingo. Using stacks
efficiently solves the management problem of the channels.
6.4.5 Design Examples
Since the collaborative geometric modeling module is a prototype, not a general-
purpose commercial program, its capability is limited. Despite this, it can still be used to
design useful geometric objects and is excellent for engineering education. Figures
6.4.17, 6.4.18 and 6.4.19 show an example of bolt design utilizing the geometric
modeling application. Figures 6.4.20 and 6.4.21 demonstrate an L bracket. Figures
6.4.22 and 6.4.23 illustrate a clip.

142
1530 7.5
10∅
Fig. 6.4.17 Dimensions for the Bolt
Fig. 6.4.18 Bolt in Wireframe

143
Fig. 6.4.19 Shaded Bolt
Fig. 6.4.20 Bracket in Wireframe
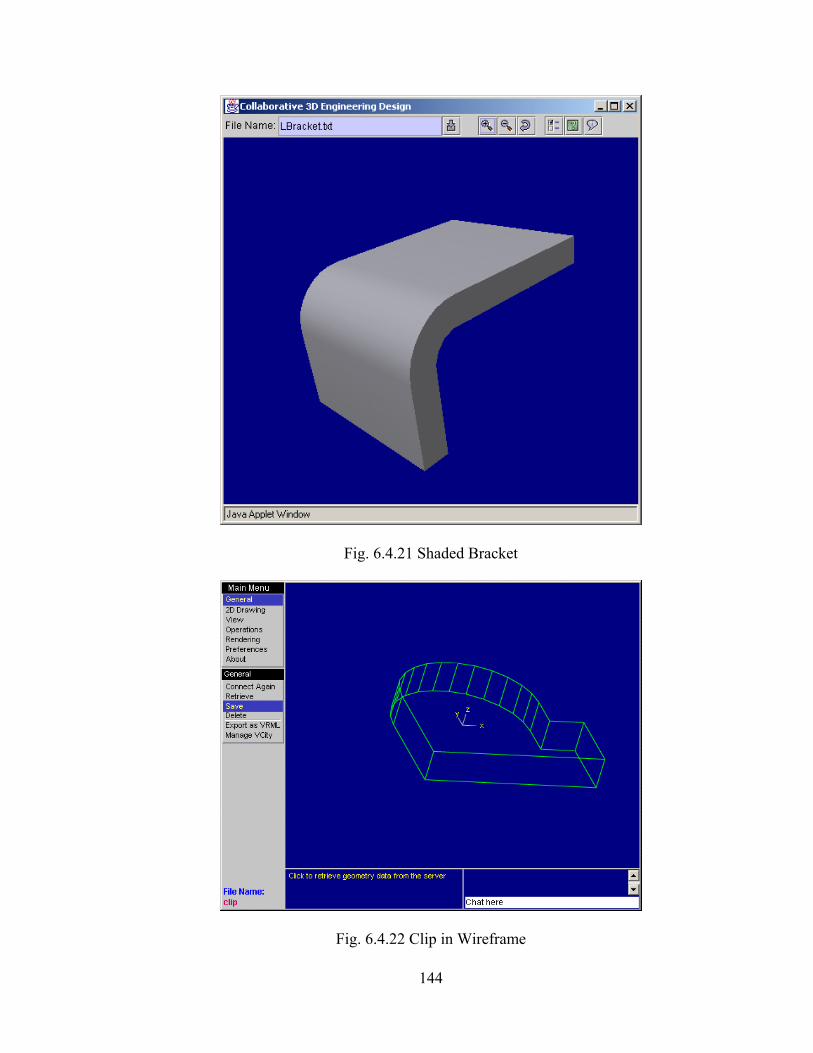
144
Fig. 6.4.21 Shaded Bracket
Fig. 6.4.22 Clip in Wireframe
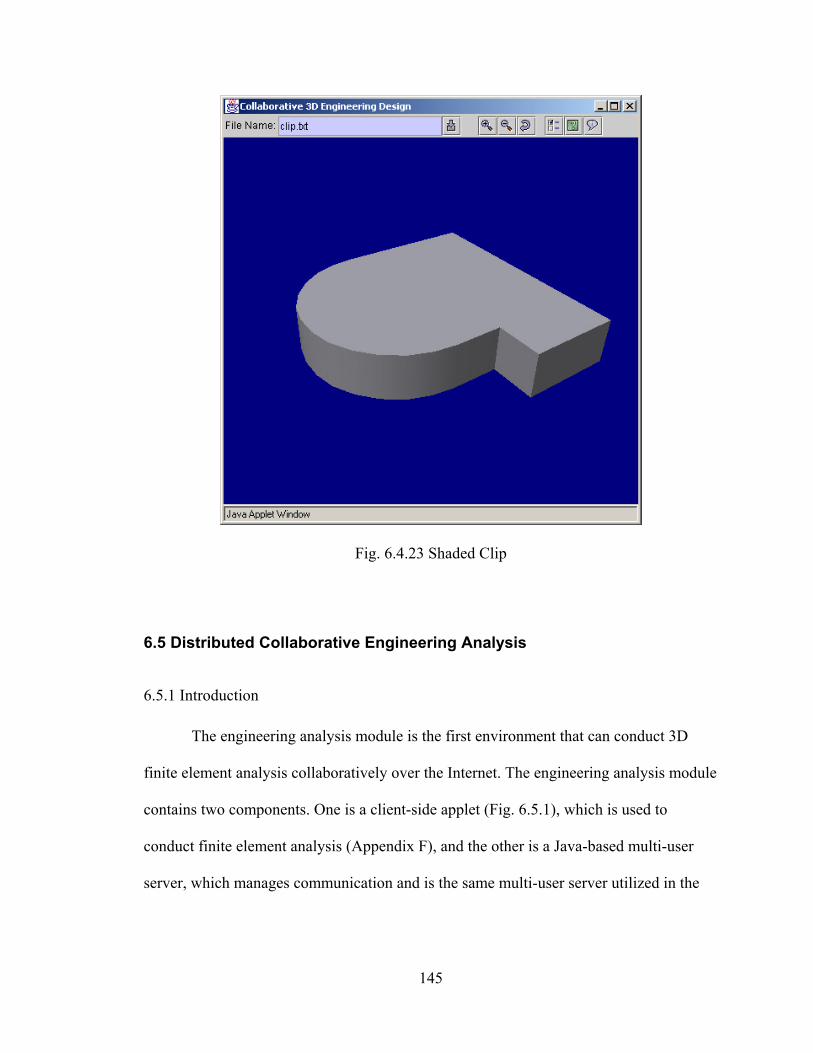
145
Fig. 6.4.23 Shaded Clip
6.5 Distributed Collaborative Engineering Analysis
6.5.1 Introduction
The engineering analysis module is the first environment that can conduct 3D
finite element analysis collaboratively over the Internet. The engineering analysis module
contains two components. One is a client-side applet (Fig. 6.5.1), which is used to
conduct finite element analysis (Appendix F), and the other is a Java-based multi-user
server, which manages communication and is the same multi-user server utilized in the

146
geometric modeling module. Employing the same multi-user server can reduce the
number of programs and hence minimize programming and managing tasks.
Fig. 6.5.1 Client-side Applet for Engineering Analysis
Currently, two types of elements: tetrahedral elements and hexahedral elements
have been implemented. These two elements are the most common elements in 3D finite
element analysis. Java and Java 3D were chosen to develop the engineering analysis

147
module, because they provide excellent performance, support networking and 3D, and
can be downloaded safely to run on client machines.
6.5.2 Tetrahedral Elements
Any structure is essentially a 3D model, although there are numerous simplified
models such as rod, beam, plane stress, and plane strain elements. It is necessary to
develop 3D elements for finite element analysis. The tetrahedron is the basic 3D element,
and may be four-node, eight-node, ten-node, or twenty-node. Among them, four-node
tetrahedral elements are the simplest and were chosen for designing the engineering
analysis module (Fig. 6.5.2). The linear shape functions were employed to develop the
stiffness matrices in terms of a global coordinate system. Detailed discussions about the
development of stiffness matrices and the assembly of the global stiffness matrix can be
found in numerous references [94, 95, 96].
z
y
x
1
2
4
3
Fig. 6.5.2 Tetrahedral Element

148
6.5.3 Hexahedral Elements
In addition to tetrahedral elements, eight-node hexahedral elements were also
implemented in the engineering analysis module. To derive the isoparametric formulation
of the stiffness matrix for eight-node linear hexahedral elements, an isoparametric
coordinate system is used as shown in Fig. 6.5.3. The element faces are then defined by
, , ' 1s t z = ± .
The shape functions are defined as
(1 )(1 )(1 ' ' )(6.5.1)
8i i i
iss tt z z
N+ + +
=
with , , ' 1i i is t z = ± and 1, 2, ..., 8i = .
t
s
z′
1
2
3
4
5
6
8
7
Fig. 6.5.3 Linear Hexahedral Element
Expanding the above equation, the following equations can be obtained

149
1
2
3
4
5
6
7
(1 )(1 )(1 ') ( 1, 1,1)8
(1 )(1 )(1 ') ( 1, 1, 1)8
(1 )(1 )(1 ') ( 1,1, 1)8
(1 )(1 )(1 ') ( 1,1,1) (6.5.2)8
(1 )(1 )(1 ') (1, 1,1)8
(1 )(1 )(1 ') (1, 1, 1)8
(1 )(1 )(1 ')8
s t zN
s t zN
s t zN
s t zN
s t zN
s t zN
s t zN
− − += − −
− − −= − − −
− + −= − −
− + += −
+ − += −
+ − −= − −
+ + −=
8
(1,1, 1)
(1 )(1 )(1 ') (1,1,1)8
s t zN
−
+ + +=
These shape functions will now be used to map the solid block in isoparametric
coordinates , ,s t and 'z to the block of , ,x y and z coordinates whose size and shape are
determined by the twenty-four nodal coordinates 1 1 1 8 8 8( , , ), ..., ( , , )x y z x y z . The
mapping functions are derived as follows,
1
1
1 8 1
1 8
1 8 83 24
8
8 24 1
0 0 0 00 0 0 0 (6.5.3)0 0 0 0
xy
x N N zy N Nz N N x
yz
×
×
⋅ ⋅ ⋅ = ⋅ ⋅ ⋅ ⋅ ⋅ ⋅
⋅ ⋅ ⋅
Assume that u, v, and w are the displacements along the x, y, and z axes. Based on the
theory of linear elasticity, the strain/displacement relationships are

150
( ) 0 0
( )0 0
( )0 0(6.5.4)
( ) ( ) 0
( ) ( )0
( ) ( )0
x
y
z
xy
yz
zx
x
y
uz v
wy x
z y
z x
εεεγγγ
∂ ∂
∂ ∂
∂ ∂ = ∂ ∂ ∂ ∂
∂ ∂ ∂ ∂ ∂ ∂
∂ ∂
The displacement functions within an element are now defined by the same shape
functions as used to define the element shape; that is,
1
1
1 8 1
1 8
1 8 83 24
8
8 24 1
0 0 0 00 0 0 0 (6.5.5)0 0 0 0
uv
u N N wv N Nw N N u
vw
×
×
⋅ ⋅ ⋅ = ⋅ ⋅ ⋅ ⋅ ⋅ ⋅
⋅ ⋅ ⋅
Equation 6.54 and 6.5.5 can be combined to obtain the following equation,
[ ]
1
1
1
6 24
8
8
8 24 1
(6.5.6)
x
y
z
xy
yz
zx
uvw
Buvw
εεεγγγ
×
×
= ⋅ ⋅ ⋅
where
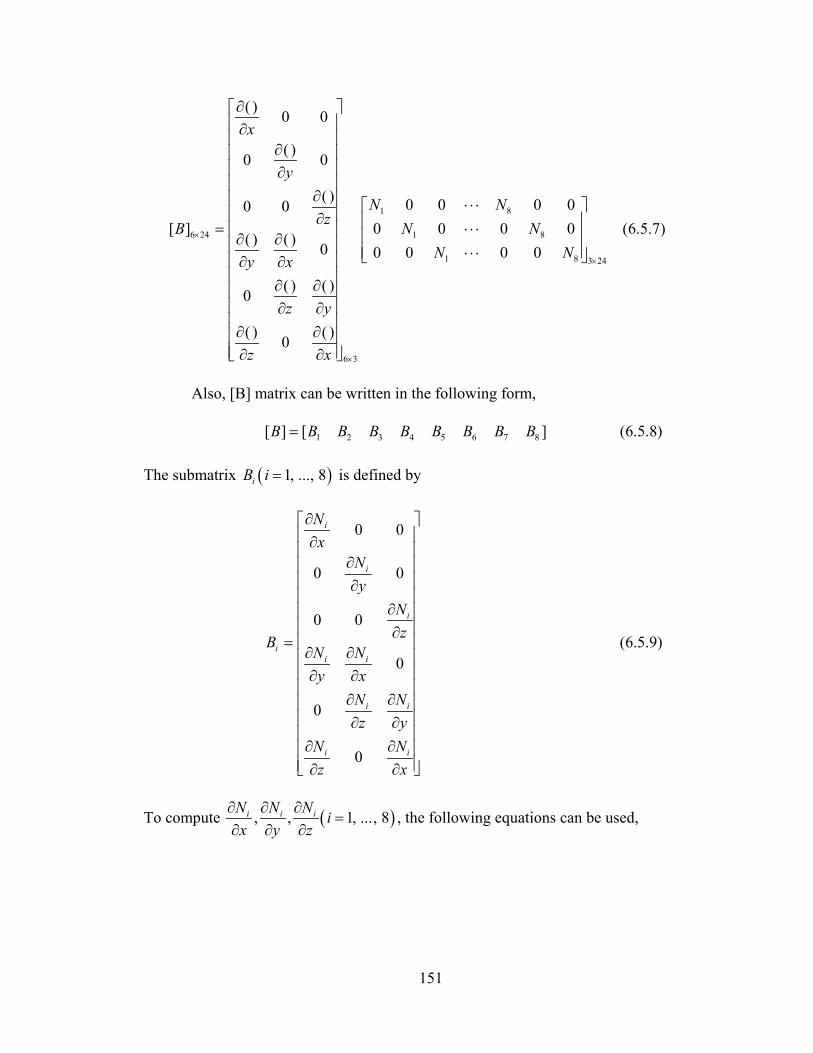
151
1 8
6 24 1 8
1 8 3 24
6 3
( ) 0 0
( )0 0
( ) 0 0 0 00 0[ ] 0 0 0 0 (6.5.7)
( ) ( ) 0 0 0 0 0
( ) ( )0
( ) ( )0
x
y
N NzB N N
N Ny x
z y
z x
×
×
×
∂ ∂
∂ ∂
∂ ⋅ ⋅ ⋅ ∂ = ⋅ ⋅ ⋅ ∂ ∂ ⋅ ⋅ ⋅ ∂ ∂ ∂ ∂ ∂ ∂ ∂ ∂
∂ ∂
Also, [B] matrix can be written in the following form,
1 2 3 4 5 6 7 8[ ] [ ] (6.5.8)B B B B B B B B B=
The submatrix ( )1, ..., 8iB i = is defined by
0 0
0 0
0 0(6.5.9)
0
0
0
i
i
i
ii i
i i
i i
Nx
Ny
NzB
N Ny x
N Nz y
N Nz x
∂ ∂
∂ ∂
∂ ∂
= ∂ ∂
∂ ∂
∂ ∂ ∂ ∂ ∂ ∂
∂ ∂
To compute ( ), , 1, ..., 8i i iN N N ix y z
∂ ∂ ∂=
∂ ∂ ∂, the following equations can be used,

152
' ' ' (6.5.10)
i
i
i
i
N y zs s s
N y zt t t
N y zN z z zx J
∂ ∂ ∂∂ ∂ ∂
∂ ∂ ∂∂ ∂ ∂
∂ ∂ ∂∂ ∂ ∂ ∂
=∂
' ' ' (6.5.11)
i
i
i
i
Nx zs s s
Nx zt t t
Nx zN z z zy J
∂∂ ∂∂ ∂ ∂
∂∂ ∂∂ ∂ ∂
∂∂ ∂∂ ∂ ∂ ∂
=∂
' ' ' (6.5.12)
i
i
i
i
Nx ys s s
Nx yt t t
Nx yN z z zz J
∂∂ ∂∂ ∂ ∂
∂∂ ∂∂ ∂ ∂
∂∂ ∂∂ ∂ ∂ ∂
=∂
where 1, ..., 8i = and
(6.5.13)
' ' '
x y zs s sy y zJt t tz y zz z z
∂ ∂ ∂∂ ∂ ∂∂ ∂ ∂
=∂ ∂ ∂∂ ∂ ∂∂ ∂ ∂
The 24 24× stiffness matrix is now given by
1 1 1
1 1 1[ ] [ ] [ ][ ] ' (6.5.14)Tk B D B J ds dt dz
− − −= ∫ ∫ ∫
where [D] is defined by

153
{ } { }[ ] (6.5.15)Dσ ε=
which is a system of equations for the stress/strain relationships. Details about [D] matrix
can be found in the reference [94].
It is best to evaluate [k] by numerical integration. In this research, a 2 2 2× × rule
(Gaussian quadrature) was used to evaluate the eight-node hexahedral element stiffness
matrix. More details about the evaluation of [k] can be found in the reference [94]. After
the local stiffness matrix [k] is computed, the global stiffness matrix can then be
assembled.
Fig. 6.5.4 Interface of the Engineering Analysis Application

154
6.5.4 Functions of the Engineering Analysis Application
It is always a challenge to design a user-friendly intuitive interface for finite
element analysis. This is because finite element analysis is a complex procedure and
demands that the user have an understanding of the problem, mechanics, theory, and
limitations of the finite element method. The interfaces of commercial finite element
codes are usually difficult to use, because their original interface design was historically
based on X Windows of the UNIX operating system. Therefore, one of the primary goals
of the engineering analysis application was to design a user-friendly interface. Buttons
are grouped into three toolbars according to their functions: top toolbar, left toolbar, and
bottom toolbar, as discussed further below (Fig. 6.5.4).
These three toolbars provide button-driven actions. In addition, the user can also
employ the mouse to rotate, translate, and zoom in on or out from the object. For
example, if the user clicks and drags the mouse, the user can rotate the object. This is
particularly convenient, because these actions are not associated with any button.
6.5.4.1 Functions of the Top Toolbar
The top toolbar includes the buttons related to importing new files, connecting
team members, zooming, and showing information. If the user clicks on the 'Import'
button , a window pops up that lets the user select an available file from the file list
(Fig. 6.5.5). The list is generated by a CGI program, which obtains the file names from
the database. If the user clicks on the 'Enter' button, the selected file name shows up in
the message area beside the ‘Import’ button. The 'Network' button is consistent with
the icon , which shows that the user is ready to share the analysis procedures with

155
other members. However, if the user clicks on the 'Network' button, its image changes to
and the icon becomes , which shows that user does not share any analysis
procedure with other members. The next three buttons are the 'Zoom In' button ,
'Zoom Out' button , and 'Reset' button . The user can clicks on these buttons to
adjust the viewing distance to the model. The last two buttons in the top toolbar are the
'Help' button , and 'About' button . The user can use these two buttons to obtain the
information about the application and author.
Fig. 6.5.5 Window for File Importing
6.5.4.2 Functions of the Left Toolbar
The left toolbar incorporates the buttons related to finite element analysis.
Clicking on the first seven buttons creates immediate actions, such as the generation of
meshes, computation, and creation of distributed forces and boundary conditions, as well
as, the presentation of the report. Depressing the other buttons allows the user to take
mouse actions, such as picking a quad, edge, force, or boundary condition.
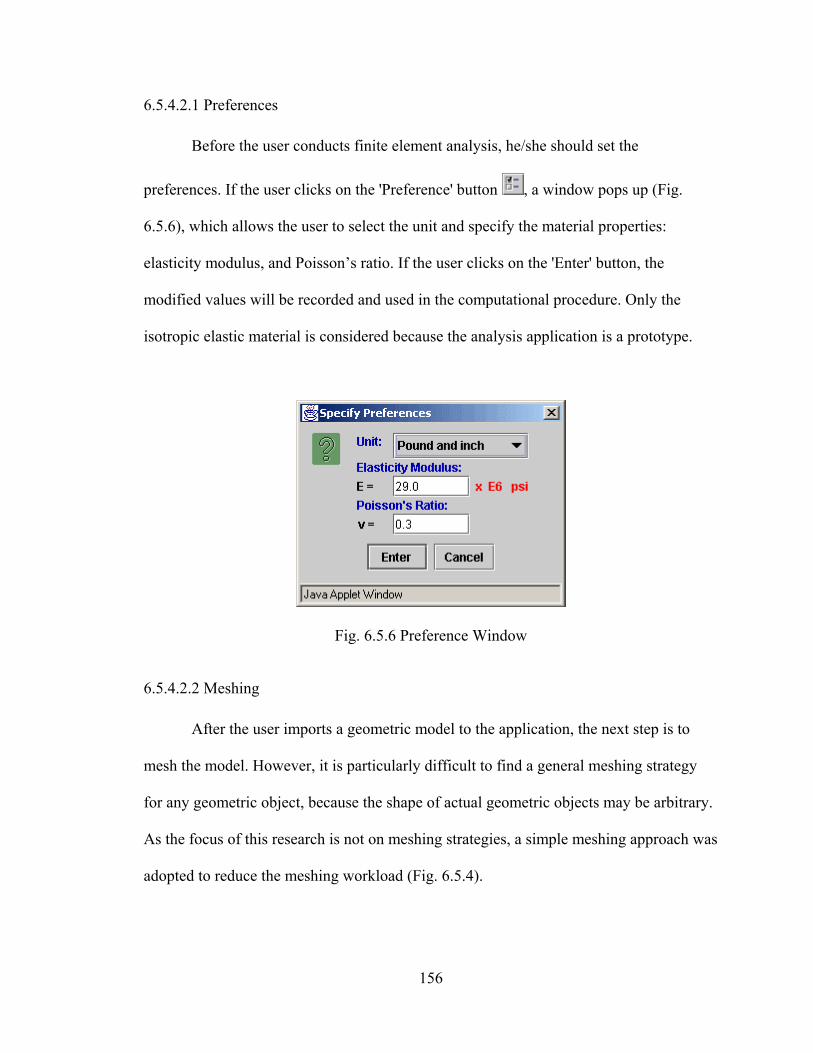
156
6.5.4.2.1 Preferences
Before the user conducts finite element analysis, he/she should set the
preferences. If the user clicks on the 'Preference' button , a window pops up (Fig.
6.5.6), which allows the user to select the unit and specify the material properties:
elasticity modulus, and Poisson’s ratio. If the user clicks on the 'Enter' button, the
modified values will be recorded and used in the computational procedure. Only the
isotropic elastic material is considered because the analysis application is a prototype.
Fig. 6.5.6 Preference Window
6.5.4.2.2 Meshing
After the user imports a geometric model to the application, the next step is to
mesh the model. However, it is particularly difficult to find a general meshing strategy
for any geometric object, because the shape of actual geometric objects may be arbitrary.
As the focus of this research is not on meshing strategies, a simple meshing approach was
adopted to reduce the meshing workload (Fig. 6.5.4).

157
This meshing approach involves a few steps. First, the user depresses the 'Pick
Edges for Meshing' button . Second, the user selects an arbitrary edge of the
geometric object and a dialog window pops up (Fig. 6.5.7). The user then assigns the
number of blocks to be associated with that edge. Third, the user chooses another edge
that has a common vertex with the first edge selected and assigns the number of blocks to
be associated with the second edge. Fourth, the user picks a third edge that shares a
common vertex with the first two edges selected and assigns the number of blocks to be
associated with the third edge. When these three values are ready, the geometric object
can then be meshed into multiple eight-node blocks if the user clicks on the 'Mesh' button
. The vertices of these blocks are automatically indexed. Figure 6.5.4 demonstrates the
blocks generated by this meshing approach. The limitation of this approach is that it only
works with geometric objects having six surfaces. If the geometric objects have more or
less than six faces, this approach does not work.
Fig. 6.5.7 Element Number Dialog Window
As these blocks can be used as the hexahedral elements, no further meshing is
needed. For tetrahedral elements, it is necessary to further divide each block into five or

158
six tetrahedra. In this research, each block was divided into six tetrahedral elements.
Detailed discussions about division can be found in the reference [96].
When the meshing approach is available, it is crucial to find an efficient way to
store the global stiffness matrix. This is important due to limitations in storage capacity.
Assume that a meshed 3D object has 2000 nodes and that each element of the matrix
requires two bytes for data storage. The meshed object may form a 6000 6000× global
matrix, which needs 72 megabytes of memory to store it. Although more memory is
available with current computers, it is still not enough to hold the uncompressed matrix,
especially considering many more nodes may be needed for the analysis of complex 3D
objects.
As the global matrix is symmetric and banded, a banded-symmetric format
storage approach is used in this research. This format is not necessarily the most efficient
format; however it is simple to implement. Using a banded-symmetric format, only the
main diagonal and nonzero upper codiagonals need to be stored; hence, the number of
stored elements is tremendously reduced. In addition to the storage efficiency, the
equation-solution time with banded storage is also less than that required without banded
storage [94].
The algorithm for solving linear equations with a banded-symmetric format is
standard and can be found in numerous references [96, 97]. This research used the
FORTRAN source code from the reference [96]. The FORTRAN code was converted
into Java code.

159
6.5.4.2.3 Boundary Conditions
When the meshing is finished, it is necessary to apply boundary conditions.
Below the button , the next three buttons are grouped to deal with boundary
conditions. First, the user depresses the 'Pick Quads' button , and he/she then picks
desired quads. The selected quads become green. Second, the user clicks on the
'Boundary Condition' button , and a window pops up to let the user specify the
degrees of freedom for selected quads (Fig. 6.5.8). If the user chooses to clicks on the
'Enter' button, a colored block is placed on the top of the green quads to indicate that a
boundary condition is applied on these quads. If the user wants to change the degree of
freedom of the boundary condition, he/she can depress the 'Edit BC' button and then
pick the colored block that represents the boundary condition. A window pops up to let
the user modify the degrees of freedom. If the user decides to delete the generated
boundary condition, he/she can depress the 'Delete BC' button , and then click on the
desired colored block to delete it.
Fig. 6.5.8 Boundary Condition Window

160
6.5.4.2.4 Forces
Two types of forces can be applied in the analysis application: point forces and
distributed forces. The user first depresses the 'Point Force' button , and then picks
any node. A window pops up to let the user specify the value of point forces (Fig. 6.5.9).
If the user clicks on the ‘Enter’ button, a point force is created with the direction
specified by its three components. Likewise, the user can use the two buttons below the
button to edit and delete the point force.
Fig. 6.5.9 Input Window for Point Forces
It is more complex to specify the distributed forces, and the procedure is similar
to create the boundary condition. The user first depresses the 'Pick Quads' button ,
which is below the 'Delete Point Force' button , and then picks desired quads. The
user next clicks on the 'Distributed Forces' button , and a window pops up to allow the
user to define the direction and value of distributed force. If the user clicks on the 'Enter'
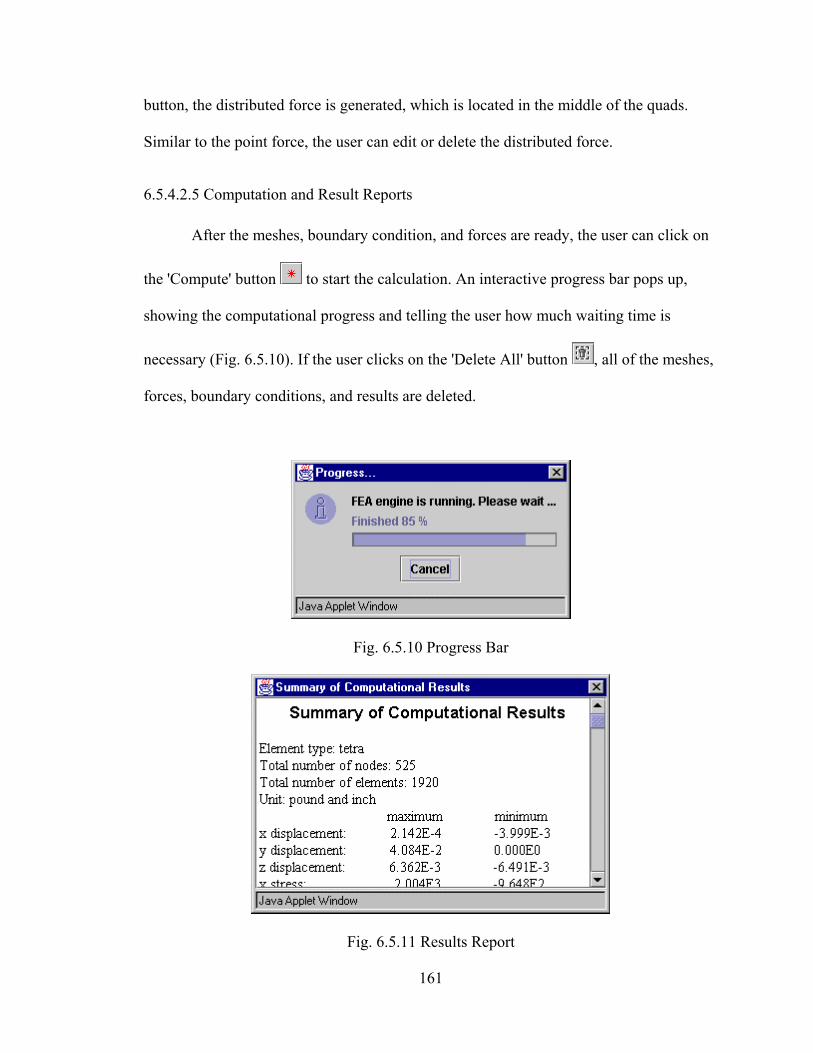
161
button, the distributed force is generated, which is located in the middle of the quads.
Similar to the point force, the user can edit or delete the distributed force.
6.5.4.2.5 Computation and Result Reports
After the meshes, boundary condition, and forces are ready, the user can click on
the 'Compute' button to start the calculation. An interactive progress bar pops up,
showing the computational progress and telling the user how much waiting time is
necessary (Fig. 6.5.10). If the user clicks on the 'Delete All' button , all of the meshes,
forces, boundary conditions, and results are deleted.
Fig. 6.5.10 Progress Bar
Fig. 6.5.11 Results Report
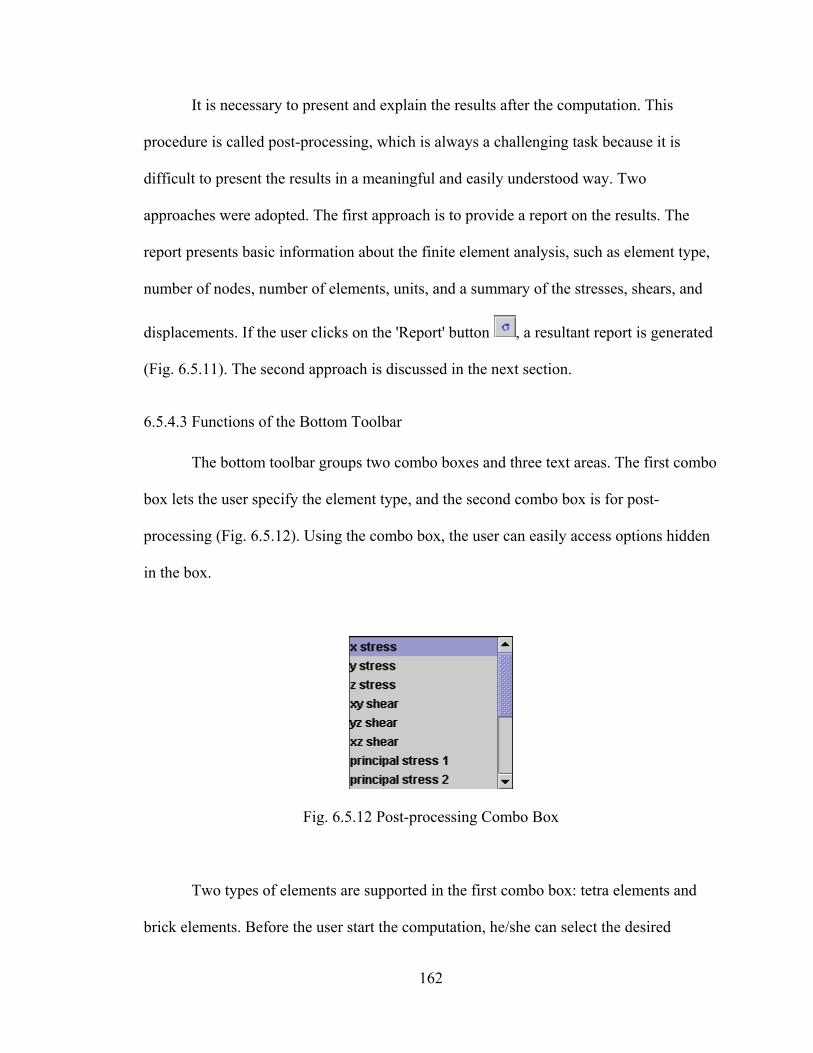
162
It is necessary to present and explain the results after the computation. This
procedure is called post-processing, which is always a challenging task because it is
difficult to present the results in a meaningful and easily understood way. Two
approaches were adopted. The first approach is to provide a report on the results. The
report presents basic information about the finite element analysis, such as element type,
number of nodes, number of elements, units, and a summary of the stresses, shears, and
displacements. If the user clicks on the 'Report' button , a resultant report is generated
(Fig. 6.5.11). The second approach is discussed in the next section.
6.5.4.3 Functions of the Bottom Toolbar
The bottom toolbar groups two combo boxes and three text areas. The first combo
box lets the user specify the element type, and the second combo box is for post-
processing (Fig. 6.5.12). Using the combo box, the user can easily access options hidden
in the box.
Fig. 6.5.12 Post-processing Combo Box
Two types of elements are supported in the first combo box: tetra elements and
brick elements. Before the user start the computation, he/she can select the desired

163
elements. In the second combo box, the user can choose different results to be displayed.
This is the second approach for post-processing, which utilizes colors to demonstrate the
stresses and displacements visually.
Fig. 6.5.13 Color Representation of z Stresses
The idea of the second approach for post-processing is simple. Assume that the z
stress needs to be presented. First, the maximum z stress and minimum z stress are
determined. Second, the nodes with the maximum z stress are assigned the color red, the
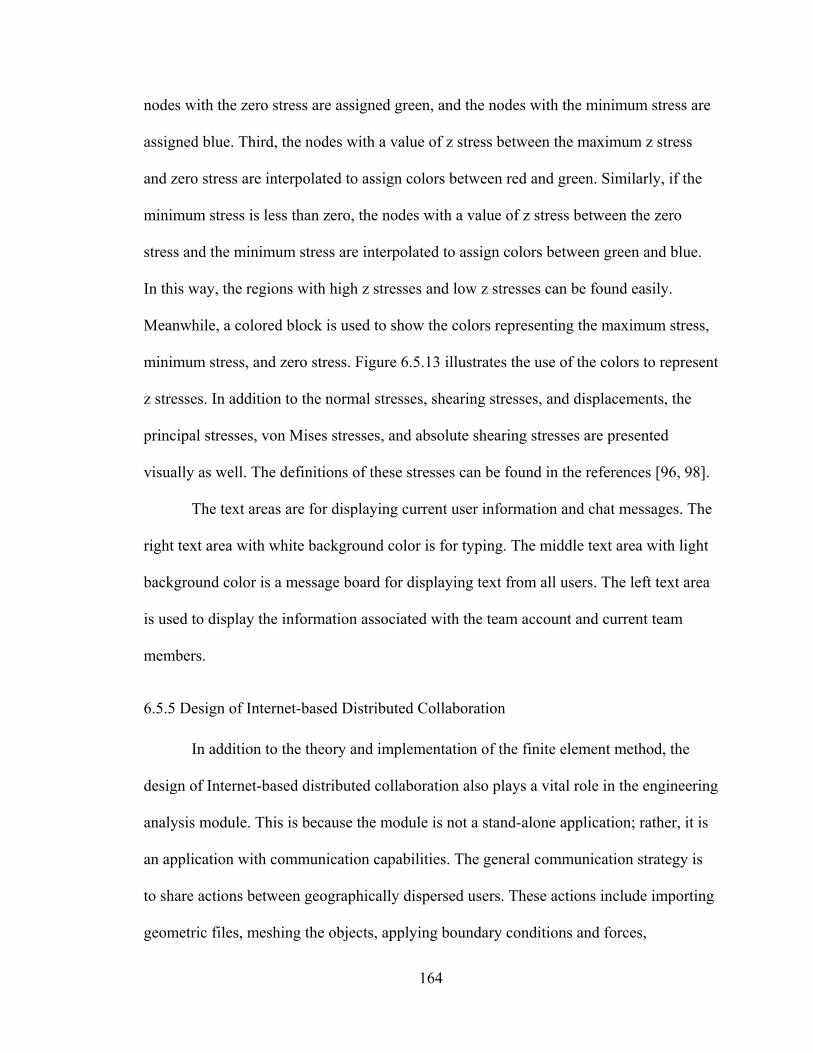
164
nodes with the zero stress are assigned green, and the nodes with the minimum stress are
assigned blue. Third, the nodes with a value of z stress between the maximum z stress
and zero stress are interpolated to assign colors between red and green. Similarly, if the
minimum stress is less than zero, the nodes with a value of z stress between the zero
stress and the minimum stress are interpolated to assign colors between green and blue.
In this way, the regions with high z stresses and low z stresses can be found easily.
Meanwhile, a colored block is used to show the colors representing the maximum stress,
minimum stress, and zero stress. Figure 6.5.13 illustrates the use of the colors to represent
z stresses. In addition to the normal stresses, shearing stresses, and displacements, the
principal stresses, von Mises stresses, and absolute shearing stresses are presented
visually as well. The definitions of these stresses can be found in the references [96, 98].
The text areas are for displaying current user information and chat messages. The
right text area with white background color is for typing. The middle text area with light
background color is a message board for displaying text from all users. The left text area
is used to display the information associated with the team account and current team
members.
6.5.5 Design of Internet-based Distributed Collaboration
In addition to the theory and implementation of the finite element method, the
design of Internet-based distributed collaboration also plays a vital role in the engineering
analysis module. This is because the module is not a stand-alone application; rather, it is
an application with communication capabilities. The general communication strategy is
to share actions between geographically dispersed users. These actions include importing
geometric files, meshing the objects, applying boundary conditions and forces,
165
conducting computation, rotating the objects, zooming in on or zooming out from the
objects, and viewing the results. When a user initiates one of the actions, that action will
be propagated to the remote users. Therefore, all of the remote users in the same working
team will have the same results, same view, and same object.
To design an efficient application with distributed collaboration, numerous
situations need to be considered. First, the finite element method has to deal with a large
amount of data. Thus, only the action commands are shared, not the generated data. The
generated data are usually a large amount, while the data for commands are small. This
method can minimize the data that need to be transmitted through the Internet; hence it
reduces the traffic imposed on the Internet and increases the responsiveness of the
environment.
Second, multiple copies of information may be sent to the new user when the
existing users detect the ‘join’ action. To avoid this, a unique token is used for the
working team. If one user is holding the token, other users cannot hold it. Therefore, only
the user holding the token can send a copy of information to the new user. Other users
have to ignore the join action even though they have detected it.
Third, a user may leave the working team and rejoin it again. When the user
leaves the working team, that person does not send or receive any message from other
users. The individual can work independently on geometric objects. However, if the
person decides to rejoin the working team, their objects will be lost when he receives the
current copy of the working object from the team. This is important, because only one
copy of information can exist within the team.

166
Fourth, each user may create new objects, such as boundary conditions and
forces. These new objects can be easily identified in the creator’s local machine, though
not in the remote users’ machines. To solve this problem, a globally unique ID is
assigned to the generated object by the creator’s machine and then propagated to the
object generated by remote user’s machines. Hence the generated object in each machine
has the same unique ID. When the user needs to edit or delete the generated objects, the
unique IDs are used to distinguish objects.
Fifth, it is important to find a consistent and convenient approach to retrieve data
due to the large amount of data transmitted through the Internet. Object serialization is an
excellent solution where the sender encapsulates the data into a serializable object and
sends it. The receiver gets the serializable object and casts it back to the original object.
The receiver can then retrieve the data. This is particularly convenient, because the data
items have names associated with them. Shockwave implementation is different from this
approach because it sends an array instead of a serializable object. The receiver needs to
follow the precise order of the array to retrieve the data items. No name is associated with
the data item in Shockwave multi-user implementation, which makes programming more
difficult.
6.5.6 Comparison of Computational Results
It is important to assess whether the results obtained from the engineering analysis
module agree with the results from commercial codes as well as with analytical results.
Assume there is a beam of 10 10 100× × inches (Fig. 6.5.14). One end is fixed, and a 2000
lb point force is applied to the other. The elastic modulus is 29.0E6 psi and the Poison
ratio is 0.3.

167
P = 2000 lbs
100′′
w x h = 10 x 10′′ ′′
z
y
Fig. 6.5.14 A Beam Example Used to Check the Results
Fig. 6.5.15 Stress Results Using Brick Elements in ANSYS

168
If 270 brick elements with 496 nodes are used to analyze the beam in the
engineering analysis module, the maximum displacement is 0.02591 inch and the
maximum stress in z direction is 1396.0 psi. When the same number of elements and
same meshing strategy are used to perform analysis on the beam in ANSYS, the
maximum displacement is 0.02595 and the maximum stress in z direction is 1398.0 psi
(Fig. 6.5.15). The difference between the maximum displacements is 0.15%, which is
small. The difference between the maximum stresses in z direction is 0.14%, which is
also at an acceptable level.
If 1620 tetra elements with 496 nodes are used in the engineering analysis
module, the maximum displacement is 0.01947 inch and the maximum stress in z
direction is 1165.0 psi. While 1646 tetra elements with 509 nodes are used to perform
analysis on the beam in ANSYS, the maximum displacement is 0.02108 inch and the
maximum stress in z direction is 1234.0 psi (Fig. 6.5.16). The difference between the
maximum displacements is 7.63%, and the difference between the maximum z stresses is
5.59%. The differences are larger than using brick elements because the meshing strategy
and number of elements are not the same.
Based on the classic beam theory, the maximum displacement in y direction is
0.02758 inch and the compression stress component along the beam is 1200.0 psi. The
results computed from tetra elements are not as accurate as those from brick elements.
This agrees with basic principles of finite element analysis. In summary, the results
obtained from the collaborative engineering analysis agree with the results from
commercial codes as well as with analytical results.

169
Fig. 6.5.16 Stress Results Using Tetra Elements in ANSYS
6.5.7 Uniqueness
The collaborative engineering analysis module has numerous unique features. It is
the first prototype of the Internet-based distributed collaborative environment for 3D
finite element analysis. It allows users to work collaboratively on the same analysis
object simultaneously. It reads the geometric data from the collaborative geometric
modeling and then seamlessly links both applications together. The user can interact
directly with the geometric model to perform operations, such as applying, editing, and
deleting boundary conditions and forces. The team members share operation commands
instead of results so that the network traffic associated with collaboration is minimized. A

170
database is utilized to manage the geometric files used in the engineering analysis, which
is efficient.
6.5.8 An Analysis Example
As the distributed collaborative engineering analysis is a prototype, not a general-
purpose commercial FEA program, its capability is rather limited. However, it is an
excellent tool for engineering education. It can be downloaded and run on the client
machine without installation.
As an example, a retaining wall under the distributed force was analyzed using
this application. Figure 6.5.17 shows the boundary conditions and applied forces of the
retaining wall. Figure 6.5.18 demonstrates the meshing of the wall. The maximum von
Mises stress is 79.52 psi, and absolute maximum shear stress is 45.52 psi (Fig. 6.5.19).
216
30
52.94 lb / in2
E = 3.2 x 10 psiv = 0.15
6Material Properties:
Length of the Wall= 432 inches
72
′′
′′
′′
Fig. 6.5.17 Retaining Wall with Boundary Conditions and Forces

171
Fig. 6.5.18 Meshes of the Retaining Wall
Fig. 6.5.19 Summary of the Computational Results

172
Chapter 7: Assessment
Because the Virtual City is intended in part for engineering education, it is
important to evaluate its effectiveness. Students were first required to finish an
assignment using the Virtual City, and then they were asked to complete a survey about
the effectiveness of the Virtual City. Three assessments were conducted as described
below, and the results were analyzed statistically.
7.1 Assessments on the Multimedia Modules
7.1.1 Assessment on the Traffic Engineering Module
The first assessment was conducted on the effectiveness of the traffic engineering
module at the University of Oklahoma in the fall of 1998. As a precursor to a corridor
design, students were given the module and traffic flow volume. They were asked to
design a freeway section with an acceptable level of service by adjusting the number of
lanes and acceleration lengths. They were to learn the module "on the fly" through the
learning and simulation environments. The solution to the problem required hand
calculations utilizing the theory provided in the module. Finally, the module was adopted
by each student to design the proper corridor given projected Sooner City traffic volumes.
A post-project survey was conducted to evaluate the module’s effectiveness.
The questions and a compilation of the responses obtained from thirty-six
students are presented in Table 7.1. The means, standard deviations, and other test
statistics describing student responses are illustrated in Table 7.2. The level of
significance about the mean’s difference from the value of 3.0 was tested based on the t-
distribution since the value of 3.0 represents neither ‘true’ nor ‘false’. The assumption is

173
that the data has a normal distribution and that its variance is unknown [100]. The
equation to compute the test statistic ( 0t ) in the table 7.2 is
00 (7.1)
x ut
s n−
=
Table 7.1 Survey Questions and Results about the Traffic Engineering Module
Statements Definitely false
More false than true
Neither More true than false
Definitely true
1. The module helped me understand the principles behind the transportation corridor design
0 4 6 18 8
2. The module helped me to better visualize the transportation corridor design
0 0 1 11 24
3. The module helped me complete the design project faster
1 1 4 9 21
4. The module allowed me to complete the corridor design without understanding the principles.
13 10 4 5 4
The total number of students that responded was 36.
Table 7.2 Test Statistics about the Survey on the Traffic Engineering Module
Statements Mean Standard Deviation Test Statistic ( 0t ) 1 2.1667* 0.91026 -5.4927 2 1.3611 0.54263 -18.131 3 1.6667 0.98561 -8.1166 4 3.6389 1.3970 2.7440
* The mean based on the following scale: 1 = definitely true, 2 = more true than false, 3 = neither, 4 = more false than true, 5 = definitely false.
Though the responses are subjective and do not provide a truly quantitative
indication of the students’ improvement in knowledge, they do provide useful insight.
One of the objectives of the module was to help students visualize the problem. Student
174
responses to question two suggest, at the 0.0005 level of significance, the module was
successful in this regard. The second main objective of the module was to help students
better understand the underlying traffic principles. Student responses to question one
indicate, at the 0.0005 level of significance, this goal was accomplished, although not as
resoundingly as for visualization (see the mean associated with question one). The third
objective was to provide a useful tool for learning basic concepts of traffic engineering.
Student responses to questions three reveal, at the 0.0005 level of significance, that the
module was effective. For question four, it is reasonable to have a mean greater than 3.0.
This is because the module was not designed to allow the students to complete the
corridor design without understanding the principles.
7.1.2 Assessment on the Structural Analysis Module
The second assessment was conducted to determine the effectiveness of the
structural analysis module at the University of Oklahoma in the fall of 2000. The
professor first demonstrated in class how the module could be used to solve frame
problems, and two homework problems were then assigned. The students were offered
five bonus points for using the structural analysis module to check their homework
solutions.
The survey questions and their corresponding results are shown in the Table 7.3.
Twelve students in all responded to the survey. Table 7.4 summarizes the means,
standard deviations, and other test statistics performed on the student responses to the
questions about the module. The level of significance about the mean’s difference from
the value of 3.0 was tested based on the t-distributions since the value of 3.0 represents
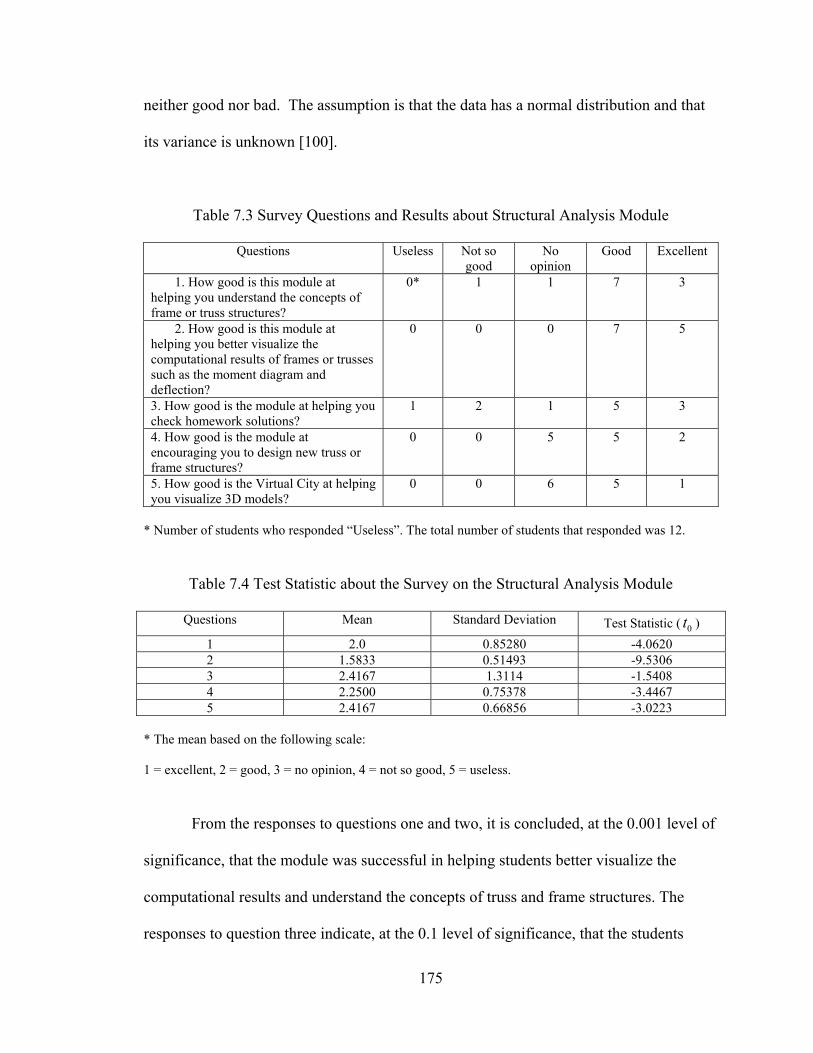
175
neither good nor bad. The assumption is that the data has a normal distribution and that
its variance is unknown [100].
Table 7.3 Survey Questions and Results about Structural Analysis Module
Questions Useless Not so good
No opinion
Good Excellent
1. How good is this module at helping you understand the concepts of frame or truss structures?
0* 1 1 7 3
2. How good is this module at helping you better visualize the computational results of frames or trusses such as the moment diagram and deflection?
0 0 0 7 5
3. How good is the module at helping you check homework solutions?
1 2 1 5 3
4. How good is the module at encouraging you to design new truss or frame structures?
0 0 5 5 2
5. How good is the Virtual City at helping you visualize 3D models?
0 0 6 5 1
* Number of students who responded “Useless”. The total number of students that responded was 12.
Table 7.4 Test Statistic about the Survey on the Structural Analysis Module
Questions Mean Standard Deviation Test Statistic ( 0t ) 1 2.0 0.85280 -4.0620 2 1.5833 0.51493 -9.5306 3 2.4167 1.3114 -1.5408 4 2.2500 0.75378 -3.4467 5 2.4167 0.66856 -3.0223
* The mean based on the following scale: 1 = excellent, 2 = good, 3 = no opinion, 4 = not so good, 5 = useless.
From the responses to questions one and two, it is concluded, at the 0.001 level of
significance, that the module was successful in helping students better visualize the
computational results and understand the concepts of truss and frame structures. The
responses to question three indicate, at the 0.1 level of significance, that the students

176
believed that the module was useful in checking homework solutions. The responses to
questions four and five suggest, at the 0.01 level of significance, that the module
encouraged students to design new structures outside of the assigned homework and
helped visualize 3D models. However, it is interesting to note that half of the respondents
had no opinion in response to question five. This probably means that they did not try to
design a bridge and deposit it into the 3D virtual world.
In addition to answering survey questions, these twelve students also provided
useful comments about the structural analysis module. Examples of positive comments
are, “If I would have learned to use this (module) earlier in this semester I think it would
have helped me tremendously” and “The graphics and bending demonstrations and shear
and moment diagram are great.” Major complaints were that user interface was not user-
friendly and that it was easy to forget to maintain consistency among all units.
7.2 Assessment on the Collaborative Geometric Modeling and Engineering
Analysis Modules
Like industry, academic institutions need tools to help students collaborate on
design objects. To better understand the usefulness of the collaborative modules, an
assessment was conducted at the University of Oklahoma in the spring of 2001. Both the
collaborative geometric modeling and engineering analysis modules were used since they
are similar in concept. The design class, Introduction to Computer Aided Design (CAD),
with seventeen senior and graduate students was selected since the students were also
introduced to general-purpose and non-Internet-based CAD programs.
The survey was conducted in a number of steps. First, a class presentation was
given discussing the purposes of the modules and showing the steps of how to use them.

177
Second, an assignment and a survey form were distributed to the students along with help
documents (Appendix I and J). The students were required to form multiple teams. Team
members were required to work jointly on the assignment. Each team needed to submit
only one copy of the solution. The assignment was graded satisfactory or unsatisfactory.
Team members were required to submit the surveying form individually. The survey
questions and their answers are presented in Table 7.5.
Table 7.5 Surveying Questions and Results on the Collaborative Modules
Questions Strongly disagree
Disagree No opinion
Agree Strongly agree
1. It is helpful if geographically distributed engineers can work in a well-designed collaborative design environment.
0 0 1 9 7
2. The Internet should be used for collaborating engineering design and analysis.
0 1 1 9 6
3. A collaborative design environment encourages spirit of teamwork when it is used to complete homework jointly.
0 1 3 8 5
4. A collaborative design environment encourages collaborative learning of remote users.
0 2 3 9 3
5. The engineering analysis module is good at helping you better visualize stresses and displacements.
0 2 0 9 6
6. The Virtual City is good at presenting the big picture and 3D visualization.
0 1 5 6 5
7. Internet-based engineering education with capabilities of 3D engineering design and analysis will be popular in five years.
0 2 6 5 4
8. It helped to collaborate online using the design environment for the homework.
0 4 6 5 2
9. It was easy to use the distributed collaborative design environment.
1 9 2 5 0
10. It was helpful to see a 3D stress state while designing the beam.
0 1 4 10 2
The total number of students that responded was 17.
The assignment was an optimization problem that required the students to design
a rectangular beam with minimum weight subject to von Mises stress. To finish the
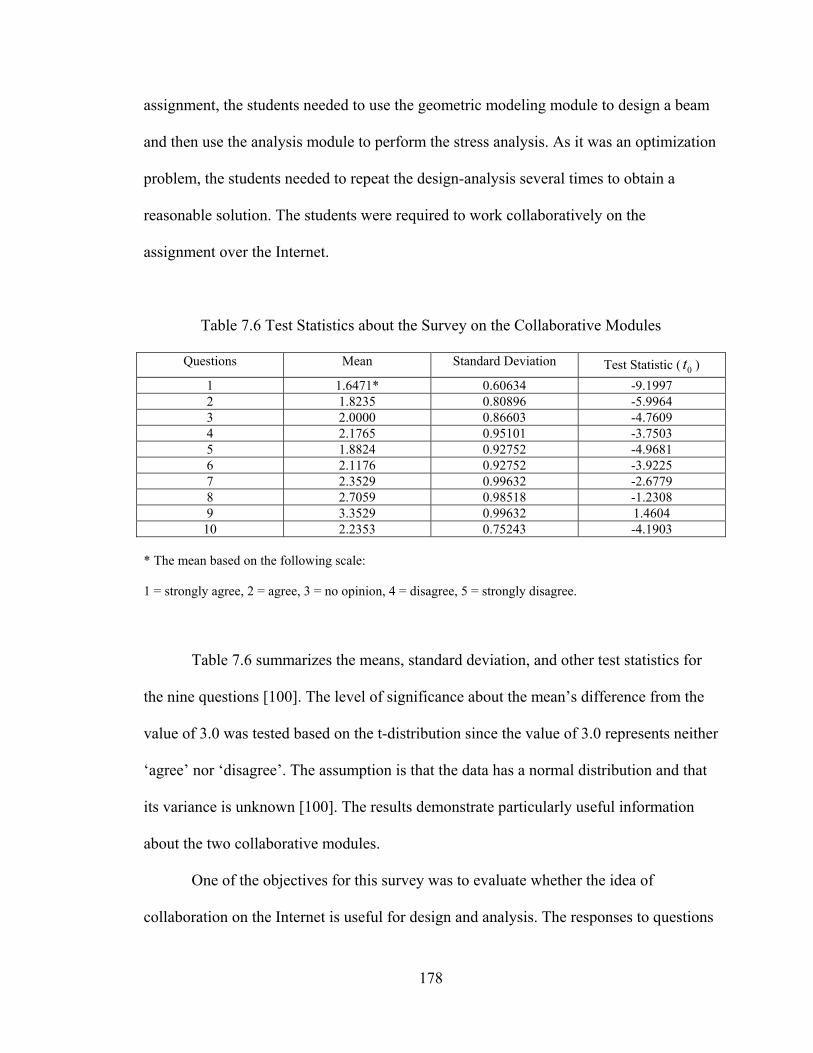
178
assignment, the students needed to use the geometric modeling module to design a beam
and then use the analysis module to perform the stress analysis. As it was an optimization
problem, the students needed to repeat the design-analysis several times to obtain a
reasonable solution. The students were required to work collaboratively on the
assignment over the Internet.
Table 7.6 Test Statistics about the Survey on the Collaborative Modules
Questions Mean Standard Deviation Test Statistic ( 0t ) 1 1.6471* 0.60634 -9.1997 2 1.8235 0.80896 -5.9964 3 2.0000 0.86603 -4.7609 4 2.1765 0.95101 -3.7503 5 1.8824 0.92752 -4.9681 6 2.1176 0.92752 -3.9225 7 2.3529 0.99632 -2.6779 8 2.7059 0.98518 -1.2308 9 3.3529 0.99632 1.4604
10 2.2353 0.75243 -4.1903 * The mean based on the following scale: 1 = strongly agree, 2 = agree, 3 = no opinion, 4 = disagree, 5 = strongly disagree.
Table 7.6 summarizes the means, standard deviation, and other test statistics for
the nine questions [100]. The level of significance about the mean’s difference from the
value of 3.0 was tested based on the t-distribution since the value of 3.0 represents neither
‘agree’ nor ‘disagree’. The assumption is that the data has a normal distribution and that
its variance is unknown [100]. The results demonstrate particularly useful information
about the two collaborative modules.
One of the objectives for this survey was to evaluate whether the idea of
collaboration on the Internet is useful for design and analysis. The responses to questions

179
one, two, three, and four suggest, at the 0.001 level of significance, that the idea is useful
in this regard. Another objective of the survey was to evaluate whether 3D visualization
is useful. The responses to questions five, six, and ten indicate, at the 0.001 level of
significance, that the students enjoyed seeing 3D models. The responses to question eight
reveal that the modules help the students complete their homework with the 0.125 level
of significance. This implies that the environments were only mildly helpful. The
responses to question nine were a surprise. The results demonstrate, with the 0.1 level of
significance, that the students did not think the interface design of these two
environments was easy to use. This suggests that it is always a challenge to design a user-
friendly interface. There are two reasons for this negative response. The first is that the
most students have not taken the finite element method course and they had difficulty in
understanding the concepts of the finite element analysis. The second reason is that the
students are comparing the collaborative environments with large commercial programs,
such as Pro/Engineer and SolidWorks. The responses to question seven show, at the 0.1
level of significance, that the students believed Internet-based engineering education with
3D visualization is the direction of the future.
Some students also gave useful comments about the collaborative modules. The
students expected an interface that can manage concurrent procedures effectively. They
expected an “undo” operation and direct voice communication instead of a chat room.
One of the major complaints was that when two participants initiate actions
simultaneously, their actions could conflict and make it difficult to work efficiently.

180
Chapter 8: Conclusion
8.1 Summary
The main focus of this research was to provide an infrastructure for engineering
education, test the concept of distributed collaborative design and analysis, develop and
implement the Virtual City environment, and assess the environment’s effectiveness in
the real world. A three-tier architecture was adopted in the development of the
environment, which contains an online database server, a Web server as well as multi-
user servers, and client browsers. The environment is composed of five components: a
3D virtual world, multiple Internet-based multimedia modules, an online database, a
collaborative geometric modeling module, and a collaborative engineering analysis
module. The environment is open to the public at www.vcity.ou.edu, and was designed
using multiple Internet-based technologies, such as Shockwave, Java, Java 3D, VRML,
Perl, ASP, SQL, and the database. These various technologies together formed the basis
of the environment and were programmed to communicate smoothly with each other.
The online database was designed to manage the changeable data related to the
environment, because it is an efficient approach to save, delete, retrieve, and search data.
The virtual world was used to implement 3D visualization and tie the multimedia
modules together. Students are allowed to build segments of the 3D virtual world upon
completion of appropriate undergraduate courses in civil engineering. The end result is a
complete virtual world that contains designs from all of their coursework and is viewable
on the Internet. The environment is an educational system with rich content, which can be
used to teach multiple engineering topics with the help of 3D visualization, animations,
181
and simulations. Each multimedia module can be used to teach one specific engineering
topic.
The concept of collaborative design and analysis using the Internet was
investigated and implemented. The key elements of collaboration such as sharing
information, communication, and manipulation of design objects were integrated in the
collaborative modules. Geographically dispersed users can build the same geometric
model simultaneously over the Internet and communicate with each other through a chat
room. Likewise, they can conduct finite element analysis collaboratively on the same
object through the Internet. They can mesh the same object, apply the same boundary
conditions and forces, obtain the same analysis results, and discuss the results through the
Internet.
Three assessments were conducted over a period of three semesters to evaluate
the effectiveness of the environment. Four modules were evaluated in the assessment:
traffic engineering, structural analysis, collaborative geometric modeling, and
collaborative engineering analysis modules. The results were analyzed statistically, which
demonstrates that the Virtual City is helpful in engineering education and design.
There exist also a few limitations in this research. Feature-based and dimension-
driven strategies are not implemented in the collaborative geometric modeling module
while these are standard features in modern CAD packages. The collaborative
engineering analysis module cannot be used to auto-mesh arbitrary geometric shapes. The
client/server strategy utilized in the engineering analysis module cannot be employed to
solve large complex FEA problems due to the limited computing power of the client

182
machines. Voice communication is not implemented in the collaborative environments.
More assessments are necessary to evaluate the effectiveness of the multimedia modules.
8.2 Discussion of the Contributions
This research has led to the development of an Internet-based Virtual City for
engineering education and design. It is the first Internet-based prototype integrating 2D
simulations and 3D visualization in one environment. In addition, it is the first
collaborative framework for engineering education. It is also the first Internet-based
application that can be used to conduct 3D finite element analysis collaboratively with
original considerations of implementation. Numerous Internet technologies were
employed and programmed to talk with each other smoothly. Three assessments were
conducted and analyzed of the effectiveness of the Virtual City.
The four essential elements: interactivity, collaborative learning, 3D visualization,
and encouragement of creativity and teamwork, for Internet-based engineering education
were emphasized in the development of the Virtual City. Interactivity is achieved by
developing multiple multimedia modules that cover numerous engineering topics. The
user can modify multiple parameters, and draw a truss structure, frame structure, or cross
section as input information. The results of the simulations are then presented using
animation, graphics, contours, and tables. An Internet-based 3D virtual world is utilized
for 3D visualization to offer a central location managing various 3D structures created by
different multimedia modules. Structures in the 3D virtual world, such as buildings, steel
structures, bridges, highways, and dams, are generated from different multimedia
modules. The 3D virtual world therefore ties all of simulations together in one
environment. Collaborative learning and teamwork are encouraged when the user uses

183
the collaborative geometric modeling and engineering analysis modules. Generic
modules, such as the structural analysis and piping network modules, with minimizing
the restriction on the user’s input were designed to encourage creativity.
In total, nine multimedia modules with unique features were developed:
1. The traffic engineering module uses various colors to demonstrate different levels
of service. The cars on the highway are moving with significantly different speeds
at different levels of service, which gives a direct impression of the problem to the
students.
2. Using the steel structure module, a complex steel structure can be designed
dynamically in the 3D virtual world through the modification of three parameters.
The user can then view the details of how numerous bays connect with each other.
3. The surveying module is a paradigm that demonstrates the power of using various
Internet technologies to explain complex engineering concepts. The unique
creativity of the module is that it can simultaneously display 2D contours and 3D
surfaces over the Internet.
4. The foundation simulation was found to be the first Shockwave simulation to
implement finite element analysis visually over the Internet. The interface is user-
friendly because the user does not need to prepare the data using other programs.
The user can perform automatic meshing by moving a slider bar. This
tremendously reduces the tedious work of data preparation such as the numbering
of nodes.

184
5. The soil module is a straightforward and intuitive illustration to demonstrate the
superposition method. The user can add, delete, or move the forces to experience
the different combined effects using the contour lines.
6. The consolidation module is an excellent time-based example, which allows the
user to speed up and slow down the consolidation process by changing the value
of the time parameter and then see the details of the process.
7. As for the structural analysis module, no similar Internet-based frame solver was
found during module development. The user can define the truss and frame
structures by drawing individual members, which is an intuitive and convenient
approach. The computational results are visually demonstrated. The structure as
well as the forces and boundary conditions can be saved on the server and
retrieved later using the simulation. The module can help students design simple
truss and frame structures with analytical results.
8. The concrete module illustrates a successful example of using the geometric
object as input by allowing the user to draw the desired geometric objects. It can
recognize the different shapes of the geometric objects and choose appropriate
formulas based on the shapes.
9. Similar to the structural analysis and concrete modules, the piping network
module provides an intuitive way to draw, move, and delete the pipes. The user
can visually define the reservoir and demands. The simulation automatically
records the index of each node and pipe, which minimizes the tedious work of
preparing the network’s configuration. The computational results are graphically
presented, and the user therefore does not need to read the result tables.

185
The importance of essential elements about distributed collaboration was
discussed. The key elements to distributed collaboration, such as sharing information,
communication, and manipulation of design objects, were implemented in the
collaborative modules. The geometric modeling module is the first collaborative
geometric building tool for engineering education when in the investigation stage. Its
collaborative capability encourages team spirit. It was integrated seamlessly with the 3D
virtual world by depositing the generated 3D geometric objects into the virtual world.
The generated geometric objects can be retrieved and analyzed by the collaborative
engineering analysis module. Furthermore, its architecture is different from that of
conventional collaborative geometric modeling applications. Conventional applications
usually have a geometric modeling engine on the server, and a client-side application is
mainly used to display the model. The traffic between the server and client is usually high
in such applications. However, in this research, the multi-user server only manages
communication between team members, and the client-side application takes care of
modeling. Due to the adoption of this architecture, the user can interact directly with the
geometric model to accomplish a variety of operations such as selecting geometric
entities. This architecture also minimizes network traffic, because there is no need to
download the geometric model after each operation.
The collaborative engineering analysis module is the first prototype of the
Internet-based distributed collaborative environment for 3D finite element analysis that
allows users to work collaboratively on the same analysis object simultaneously. It reads
the geometric data from the collaborative geometric modeling and then seamlessly links
both modules together. The user can interact directly with the geometric model to

186
perform operations, such as applying, editing, and deleting boundary conditions and
forces. The team members share operation commands instead of results so that the
network traffic associated with collaboration is minimized. The database is utilized to
manage the geometric files used in the engineering analysis, which is particularly
efficient. The token is employed to avoid sending multiple copies of information to the
new user. The globally unique ID is assigned to the generated object in the creator’s
computer and then propagated to the object generated by remote user’s computers. The
unique IDs are used to distinguish objects in a distributed environment. Object
serialization is utilized to transmit data over the Internet conveniently and efficiently.
Numerous Internet technologies were employed, such as HTML, JavaScript,
Shockwave, VRML, Java, Java 3D, ASP, SQL, Perl, and the SQL online database. They
were utilized together and programmed so that they communicate smoothly with each
other. The customized 3D virtual worlds are generated using ASP, VRML, and the online
database. Shockwave and Perl talk to each other to create new virtual objects. Shockwave
and Java communicate seamlessly to allow the user to design geometric models
collaboratively. In addition to these technologies, numerous multimedia applications,
such as Flash, Premiere, Photoshop, Freehand, and Dreamweaver, were used also to
develop the Virtual City.
A few unique Lingo programming techniques were employed in the development
of the environment. The object-oriented concepts were used extensively to integrate the
vector-based graphic techniques. This significantly increases the readability of the codes.
Standard stack data structures were simulated by the list data structures of Lingo to solve
the management problem of the channels efficiently in Shockwave.

187
Three assessments were conducted over a period of three semesters to evaluate
the effectiveness of the Virtual City because of its use for engineering education. The
results were analyzed statistically, and the analysis shows that the Virtual City is helpful
in engineering education, design, and analysis.
8.3 Recommendations for the Future Work
The Virtual City environment is still at its infancy, however its concepts can
provide the basis of a virtual university for engineering education. Its concepts can be
extended to develop such an environment that allows the students to design virtual parts,
assemble virtual products, and simulate their manufacturing processes in a virtual factory.
In this environment, the user can learn engineering principles by building the products
and testing their manufacturability virtually.
Currently, the multimedia modules in the Virtual City are mainly for civil
engineering, and future research may extend to mechanical engineering, electrical
engineering, and chemical engineering. Additional carefully designed evaluation
strategies are needed to assess the effectiveness of the multimedia modules, 3D virtual
world, and entire environment. Control groups may be used in the assessment.
Agent-based technologies may be used to design multimedia modules in the
future. With agent-based technologies, the modules are not individually separate entities,
but entities that can communicate with each other. For example, when the students design
a highway system with specific traffic flows using the traffic module, the traffic data may
affect the design of the bridge when using the structural module. Employing agent-based
technologies, multiple multimedia modules can form an educational system with smooth

188
communication. The system can then let the students experience the procedure of real-
world designs.
In the Virtual City environment, VRML, Java 3D, and Shockwave were used to
implement 3D visualization. With the recent introduction of Director 8.5, it is possible to
use only Shockwave to implement an Internet-based 3D environment. The automatic
downloading feature of Shockwave can minimize the user’s trouble of finding
appropriate plug-ins.
New features may be added to the distributed collaborative design and analysis,
such as feature-based CAD, dimension-driven strategies, meshing of arbitrary geometric
models, privilege management, and voice communication. The feature-based CAD is a
standard feature in modern commercial CAD packages. These commercial packages also
support dimension-driven strategies when the geometric models are built. Advanced
preprocessing CAE tools allow the user to auto-mesh geometric models with arbitrary
shapes. Privilege management is important, because it can impose multiple security
levels on the system and resolve the action conflicts of distributed users. It is natural to
design voice communication in a collaborative environment, because it offers
convenience by allowing users to exchange ideas quickly.

189
References
[1] Frank J. Derfler, “Infrastructure”, PC Magazine, August 7, 2000
[2] Internet2, http://www.internet2.edu, 2001
[3] Next Generation Internet, http://www.ngi.gov, 2001
[4] Nick Stam, “Computing”, PC Magazine, August 7, 2000
[5] Biren Prasad, “Concurrent Engineering Fundamentals”, Prentice Hall PTR, 1996
[6] Anthony Mills, “Collaborative Engineering and the Internet”, Society of
Manufacturing Engineers, 1998
[7] Dieter Bickel, “3D Real-time Simulation and VR-Tools in the Manufacturing
Industry”, Virtual Reality for Industrial Applications, Springer, 1998
[8] Amy Lacy, “OU Makes Plans to Solve High Enrollment Problems”, The
Oklahoma Daily, Sept. 28, 2000
[9] John S. Mccright, “Cisco’s Chambers: e-learning will help us control our
destinies”, PC Week Online, http://www.zdnet.com/pcweek, Nov. 16, 1999
[10] Debra Donstron, “From the Trenches: Distributed Learning Is High Priority”, PC
Week, November 14, 1999
[11] Gun-Dong F. Pahng, Seockhoon Bae, and David Wallace, “Web-based
Collaborative Design Modeling and Decision Support”, 1998 ASME Design
Engineering Technical Conferences, September 13-16, 1998, Atlanta, Georgia
[12] Gun-Dong F. Pahng, Nicola Senin, and David Wallace, “Modeling and
Evaluation of Product Design Problems in a Distributed Design Environment”,
1997 ASME Design Engineering Technical Conferences, September 14-17, 1997,
Sacramento, California

190
[13] Nicola Senin, David Wallace, and Nicholas Borland, "Object-based Design
Modeling and Optimization with Genetic Algorithms", Proceedings of the
Genetic and Evolutionary Computation Conference, July 13-17, Orlando, FL,
1999
[14] Nicholas Borland, Heiner Kauffman, and David Wallace, "Integrating
Environmental Impact Assessment into Product Design: A collaborative modeling
approach", Proceedings of the ASME DT Conferences, DETC/DFM-5730,
Atlanta, GA 1998
[15] Francis Pahng, Seokhoon Bae, and David Wallace, "A web-based collaborative
design modeling environment", Proceedings of the Seventh IEEE International
Workshops on Enabling Technologies; Infrastructure for Collaborative
Enterprises Conference, Stanford University, pp. 161-167, 1998
[16] Michael P Case, and Stephen C-Y Lu, “Discourse Model for Collaborative
Design”, Computer-Aided Design, Vol. 28, No. 5, pp333-345, 1996, Elsevier
Science Ltd
[17] Jae Yeol Lee, Hyun Kim, and Sung-Bae Han, “Web-enabled Feature-based
Modeling in a Distributed Design Environment”, 1999 ASME Design
Engineering Technical Conference, September 12-15, 1999, Las Vegas, Nevada
[18] Hyun Kim, Jae Yeol Lee, and Sung-Bae Han, “Process-centric Distributed
Collaborative Design Based on the Web”, 1999 ASME Computers in Engineering
Conference, September 12-15, 1999, Las Vegas, Nevada
[19] http://cybercut.berkeley.edu, 2001

191
[20] Charles S. Smith, and Paul K. Wright, “Cybercut: A Networked Manufacturing
Service”, First International Conference on "Managing Enterprises- Stakeholders,
Engineering, Logistics and Achievement", Loughborough University, UK, July
22-24, 1997
[21] Fu-Chung F. Wang, and Paul K. Wright, "Web-based Design Tools for a
Networked Manufacturing Service", 1998 ASME Design Technical Conference,
Atlanta, GA, Sept. 13-16, 1998
[22] Jae H. Kim, Fu-Chung Wang, Carlo H. Sequin, and Paul K. Wright, “Design for
Machining over the Internet”, Proceedings of ASME International Design
Engineering Technical Conference, September 12-15, 1999, Las Vegas, Nevada
[23] Toshiki Mori, and Mark R. Cutkosky, “Agent-based Collaborative Design of
Parts in Assembly”, 1998 ASME Design Engineering Technical Conferences,
September 13-16, 1998, Atlanta, Georgia
[24] http://www.ptc.com, 2001
[25] http://www.enovia.com, 2001
[26] http://www.sdrc.com, 2001
[27] “Airbus Partners Select Web Enterprise Software”, Aviation Week & Space
Technology, August 7, 1998
[28] Raymond E. Chalmers, “Windows and the Web: Leverage CAD Across the
Enterprise”, Integrated Manufacturing Solutions, March 1999
[29] Lisa Kempfer, “Windchill Heats up PDM”, Computer-Aided Engineering, June
1998
[30] http://part.net, 2001

192
[31] http://gssd.mit.edu, 2001
[32] David Cohn, “The Arrival of 3D Components Could Change the Way Designers
Spend Their Time”, Computer Graphics World, July 1998
[33] “Seagate Seeks Virtual Links for creativity”, Daily Oklahoma, May 26, 1999
[34] Louis Thomas, Sean Suchter, and Adam Rifkin, “Developing Peer-to-Peer
Applications on the Internet: the Distributed Editor, SimulEdit”, Dr. Dobb's
Journal, 1997
[35] Philip Isenhour, James “Bo” Begole, Winfield S. Heagy, and Clifford A. Shaffer,
“Sieve: A Java-based Collaborative Visualization Environment”, IEEE
Visualization ’97 Late Breaking Hot Topics Proceedings, Oct. 22-24, 1997,
pp.13-20
[36] D J. McArthur, and M. W. Lewis, “Untangling the Web: Applications of the
Internet and Other Information technologies to Higher Learning”, pp.1-20, 1998
[37] http://www.ecs.ou.edu, 2001
[38] http://wsi-www1.cso.uiuc.edu/courses/vci-help/about.html, 2001
[39] Anne Chen, “Doors Open to the Virtual University”, PC Week, September 20,
1999
[40] http://www.vh.org/Providers/Textbooks/MultimediaTextbooks.html, January
2000
[41] http://www.rwc.uc.edu/koehler/biophys/text.html, 2001
[42] Edward F. Gehringer, “A Web-based Computer Architecture Course Materials”,
1999 ASEE Annual Conference & Exposition, Charlotte, NC, June 20-23, 1999

193
[43] Hugh Jack, and Michael Karlesky, “A Virtual Manufacturing Laboratory”, 1999
ASEE Annual Conference & Exposition, Charlotte, NC, June 20-23, 1999
[44] Justin C. Pniower, Michael Ruane, Bennett B. Goldberg, and M. Selim Unlu,
“Web-based Educational Experiments”, 1999 ASEE Annual Conference &
Exposition, Charlotte, NC, June 20-23, 1999
[45] Charles R. Graham, and Timothy N. Trick, “Java Applets Enhance Learning in a
Freshman ECE Course”, Journal of Engineering Education, Vol.87, No. 4,
October1998, pp.391-397
[46] Robert Desharnais, and Gary Novak, “Virtual Courseware for Science
Education”, Syllabus, Vol. 12, No.1, August 1998
[47] Karthik Ranga, and Kurt Gramoll, “Design Education over the Internet Using
VRML”, 1999 ASEE Annual Conference & Exposition, Charlotte, NC, June 20-
23, 1999
[48] Steen Peterson, “Using Java and VRML in Teaching Machine Kinematics”, Ninth
Annual Conference – Technology-based Engineering Education Consortium,
Nov. 21-22, 1997, Vanderbilt University, Nashville, Tennessee
[49] W.J. Austin, J. Liddle, R.C. Thomas, and P. McAndrew, “Networked Educational
Simulation in Java”, 1998 International Conference on Web-Based Modeling &
Simulation, Simulation Series Vol. 30, No. 1, 1998, pp.105-109
[50] R.C. Thomas, J. Liddle, W.J. Austin, and P. McAndrew, “Multiverse-Lowering
the Barriers to Widespread Use of Web-based Simulations in Education”, 1998
International Conference on Web-Based Modeling & Simulation, Simulation
Series Vol. 30, No. 1, 1998, pp.110-113
194
[51] http://www.ltc.hw.ac.uk/mverse/index.html, 2001
[52] http://www.vu.msu.edu, 2001
[53] Beth Stackpole, “Online Learning Spans the Vast Lands of Utah”, PC Week,
March 14, 1999
[54] Kurt Gramoll, “Teaching Statics Online with only Electronic Media on Laptop
Computers”, 1999 ASEE Annual Conference & Exposition, Charlotte, NC, June
20-23, 1999
[55] A. J. Baker, Z. Chambers, and M. B. Taylor, “Finite Element Analysis for the
Engineering Sciences: A Web-based, Video-streamed Education Environment at a
Distance”, 1999 ASEE Annual Conference & Exposition, Charlotte, NC, June 20-
23, 1999
[56] Terry H. Walker, Z. Chambers, M. B. Taylor, and A. J. Baker, “Finite Element
Analysis for Biological Engineering: A Web-based, Distant Education Venue”,
1999 ASEE Annual Conference & Exposition, Charlotte, NC, June 20-23, 1999
[57] Hai-shuan Lam, and Kurt Gramoll, “ Practical Streaming Video on the Internet
for Engineering Course On- and Off-Campus”, 1999 ASEE Annual Conference &
Exposition, Charlotte, NC, June 20-23, 1999
[58] Z. Chambers, M.B. Taylor, J. Iannelli, and A. J. Bakers, “Production of Digital
Internet Video Material for Streaming Applications”, 1999 ASEE Annual
Conference & Exposition, Charlotte, NC, June 20-23, 1999
[59] Monson H. Hayes, and Lonnie Harvel, “Distance Learning into the 21st Century”,
1999 ASEE Annual Conference & Exposition, Charlotte, NC, June 20-23, 1999
195
[60] Yacob Astatke, “Creating a Distributed Learning Environment using WebCT”,
1999 ASEE Annual Conference & Exposition, Charlotte, NC, June 20-23, 1999
[61] Adrian Ng, and Kurt Gramoll, “Online Review and Practice Tests for the
Fundamentals of Engineering Exam”, 1999ASEE Annual Conference &
Exposition, Charlotte, NC, June 20-23, 1999
[62] David R. Wallace, and Philip Mutton, “A Comparative Evaluation of World Wide
Web-Based and Classroom Teaching”, Journal of Engineering Education, Vol.86,
No. 3, July 1998, pp.211-219
[63] David Wallace, and Suzanne Weiner, “How might classroom be used given
WWW-based lectures? A comparison of a lecture-style second coverage of
materials vs. limited-coverage guided experiential activity”, ASEE Journal of
Engineering Education, volume 87, number 3, 1998, pp. 237-248
[64] Rosemarie M. Evans, Madison Daily, and Susan L. Murry, “The Effectiveness of
an Online Graduate Engineering Management Course: A Preliminary Study”,
1998 ASEE Annual Conference & Exposition, 1998
[65] http://www.vousi.com/intro, 2001
[66] http://www.magellan.edu, 2001
[67] http://www.vu.msu.edu, 2001
[68] Cade Metz, “Collaboration: Work Together”, PC Magazine, June 26, 2000
[69] Tony Pompili, “Microsoft Exchange 2000 Server”, PC Magazine, August 2, 2000
[70] Heath Herel, “Choosing A Digital Workplace”, PC Magazine, August 28, 2000
[71] J. W. Olsen, “CAD Embraces the Internet”, PC Magazine, Oct. 17, 2000
[72] Nelson King, “Alibre Design 1.0”, PC Magazine, July 11, 2000

196
[73] Kian Huat Tan, “A Multimedia Approach to Collaborative Engineering Design on
the Web”, MS thesis, the University of Oklahoma, 1999
[74] Alvaro Vinacua, “Issuses in Distributed CAD”,
http://deslab.mit.edu/DesignLab/dicpm/position/vinacua.html, 2001
[75] William J. MitChell, and Malcolm Mccullough, “Digital Design Media”,
http://www.gsd.harvard.edu/~malcolm/DDM/DDMmain.html, 2001
[76] Jarek Rossignnac, “TeamCAD: The First GVU/NIST Workshop on Collaborative
Design”, http://deslab.mit.edu/DesignLab/dicpm/position/rossignac2.html, 2001
[77] Mark R. Cutkosky, Jay M. Tenenbaum, and Jay Glicksman, “Madefast: an
exercise in collaborative engineering over the Internet”,
http://madefast.standford.edu/ACM_paper.html, 2001
[78] Andres van Dam, Donald Greenberg, Henery Fuchs, and Richard Riesendfeld,
http://www.cs.brown.edu/stc/resea/director/research_dp4.html, 2001
[79] Jarek Rossignnac, “Collaborative Design and Visualization”,
http://deslab.mit.edu/DesignLab/dicpm/position/rossignac.html, 2001
[80] William P. Birmingham, “Essential Issues in Distributed Computational
Systems”, http://deslab.mit.edu/DesignLab/dicpm/position/birmingham.html,
2001
[81] Chris Loosley, “Designing Distributed Applications”, PC Magazine, June 1998
[82] Clifford A. Shaffer, “Collaborative Problem Solving Environments”,
http://deslab.mit.edu/DesignLab/dicpm/position/shaffer.html, 2001
[83] Fillippo A. Salustri, “Issues in Internet-Enabled CAE”, Proc. 1998 CSME Forum,
M. A. Rosen, D. Nayler, and J. G. Kawall, eds., pages 21 – 27, 1998

197
[84] Enno “Ed” Koehn, “Collaborative Learning in Engineering Classrooms”, 2000
ASEE Annual Conference Proceedings, 2000
[85] Enno “Ed” Koehn, “Collaborative Learning in Civil/Construction Classrooms”,
2000 ASEE Annual Conference Proceedings, 2000
[86] Donald Flugrad, Barbara Licklider, Anthony Hron, Kandace Martin, and Justin
Benna, “Active Collaborative Learning in a Live Distance Education Class”, 2000
ASEE Annual Conference Proceedings, 2000
[87] Gary L. Gray, and Francesco Costanzo, “Interactive Dynamics: A Collaborative
Approach to Learning Undergraduate Dynamics”, 1999 ASEE Annual
Conference Proceedings, 1999
[88] Qiuli Sun, and Kurt Gramoll, “Internet-based Simulation and Virtual City for
Engineering Education”, 2000 ASEE Annual Conference Proceedings, 2000
[89] William E. Cole, “Using CAD Analysis Tools to Teach mechanical Engineering
Technology”, 1998 ASEE Annual Conference Proceedings, 1998
[90] John T.Bell, and H. Scott Fogler, “Ten Steps to Developing Virtual Reality
Applications for Engineering Education”, 1997 ASEE Annual Conference
Proceedings, 1997
[91] Ed Gohmann, “Opportunities to Teach Teamwork, Collaboration, and
Interpersonal Communications in Mechanical Engineering”, 2000 ASEE Annual
Conference Proceedings, 2000
[92] David Flangan, “JavaScript – The Definite Guide”, O’Reily & Associate, Inc.,
January 1997
198
[93] Larry L. Peterson, and Bruce S. Davie, “Computer Networks – A Systems
Approach”, Morgan Kaufmann Publsihers, 2000
[94] DaryL L. Logan, “A First Course in the Finite Element Method”, PWS Publishing
Compnay, 1992
[95] C S Krishnamoothy, “Finite Element Analysis – Theory and Programming”, Tata
McGraw-Hill Publishing Company Limited, 1995
[96] Tirupathi R. Chandrupatla, and Ashok D. Belegundu, “Introduction to Finite
Elements in Engineering”, Prentice-Hall, Inc., second edition, 1997
[97] Willian Weaver, Jr., and James M. Gere, “Matrix Analyis of Framed Structures”,
D. Van Nostrand Company, second edition, 1980
[98] Phillip L. Gould, “Introduction to Linear Elasticity”, Spring-Verlag New York,
Inc., 1994
[99] Abraham Silberschatz, Henry F. Koth, and S. Sudarshan, “Database System
Concepts”, The McGraw-Hill Companies, Inc., third edition, 1997
[100] Douglas C. Montgomery, and George C. Runger, “Applied Statistics and
Probability for Engineers”, John Wiley & Sons, Inc, second edition, 1999
[101] OneSpace, http://www.cocreate.com, 2001
[102] DigitalThink, http://www.digitalthink.com, 2001
[103] Mentergy, http://www.mentergy.com, 20
[104] Bill Gates, “Microsoft .NET Today”, eWeek, June 25, 2001, volume 18

199
Appendices
Appendix A HTML Code with JavaScript
Appendix B Lingo Script with the Stack Data Structures
Appendix C ASP Script for the Dynamic VRML
Appendix D Java Multi-user Server
Appendix E Java Multi-user Client
Appendix F Java 3D for the Engineering Analysis
Appendix G Perl Script for the VRML Structure
Appendix H ASP Script as well as SQL statements
Appendix I Homework assignment in the Third Survey
Appendix J Questions of the Third Survey

200
Appendix A: HTML Code With JavaScript
<html> <head> <title>Home of virtual city</title> <meta http-equiv="Content-Type" content="text/html; charset=iso-8859-1"> <script language="JavaScript"> //--------------------------function to get cookie value-------------------------- function getCookieVal (offset) { var endstr = document.cookie.indexOf (";", offset); if (endstr == -1) endstr = document.cookie.length; return unescape(document.cookie.substring(offset, endstr)); } //--------------------------end function to get cookie value---------------------- //--------------------------function to get the cookie---------------------------- function GetCookie (name) { var arg = name + "="; var alen = arg.length; var clen = document.cookie.length; var i = 0; while (i < clen) { var j = i + alen; if (document.cookie.substring(i,j) == arg) return getCookieVal(j); i = document.cookie.indexOf(" ", i) + 1; if (i == 0) break; } return null; } //--------------------------end function to get the cookie------------------------ var data = GetCookie("dir"); if (data == null) { top.location = "error/login_error.htm" } </script> </head> <frameset cols="118,552*" frameborder="NO" border="0" framespacing="0" rows="*"> <frame name="menu" scrolling="NO" src="homeMenu.htm" marginwidth="0" marginheight="0" frameborder="NO"> <frame name="mainFrame" src="introduction.htm">

201
</frameset> <noframes><body bgcolor="#FFFFFF"> </body></noframes> </html>
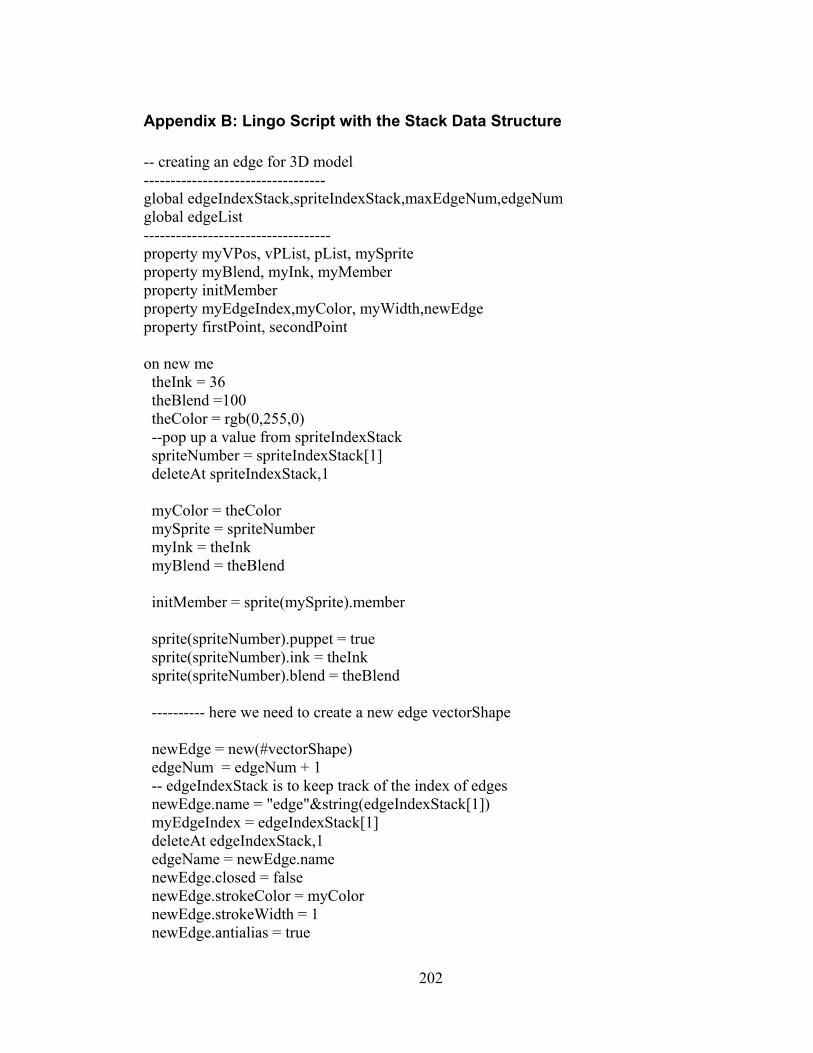
202
Appendix B: Lingo Script with the Stack Data Structure
-- creating an edge for 3D model ---------------------------------- global edgeIndexStack,spriteIndexStack,maxEdgeNum,edgeNum global edgeList ----------------------------------- property myVPos, vPList, pList, mySprite property myBlend, myInk, myMember property initMember property myEdgeIndex,myColor, myWidth,newEdge property firstPoint, secondPoint on new me theInk = 36 theBlend =100 theColor = rgb(0,255,0) --pop up a value from spriteIndexStack spriteNumber = spriteIndexStack[1] deleteAt spriteIndexStack,1 myColor = theColor mySprite = spriteNumber myInk = theInk myBlend = theBlend initMember = sprite(mySprite).member sprite(spriteNumber).puppet = true sprite(spriteNumber).ink = theInk sprite(spriteNumber).blend = theBlend ---------- here we need to create a new edge vectorShape newEdge = new(#vectorShape) edgeNum = edgeNum + 1 -- edgeIndexStack is to keep track of the index of edges newEdge.name = "edge"&string(edgeIndexStack[1]) myEdgeIndex = edgeIndexStack[1] deleteAt edgeIndexStack,1 edgeName = newEdge.name newEdge.closed = false newEdge.strokeColor = myColor newEdge.strokeWidth = 1 newEdge.antialias = true

203
newEdge.regPoint = point(0,0) -- set reg point at left top ---------------------------------------------------- sprite(mySprite).member = member(edgeName) myMember = edgeName sprite(mySprite).visible = true --Here firstPoint is used as a flag firstPoint = -1 return me end on kill me sprite(mySprite).member = initMember ---------------new features-------------- erase member myMember --push the values back into the stack add edgeIndexStack,1,myEdgeIndex edgeNum = edgeNum - 1 add spriteIndexStack,1,mySprite --edgeIndexStack.sort() spriteIndexStack.sort() end on drawMe me,firstLastPoint --update the edge member(myMember).vertexList=[[#vertex:firstLastPoint[1]],[#vertex:firstLastPoint[2]]] firstPoint = firstLastPoint[1] secondPoint = firstLastPoint[2] --updateStage end on moveNodeMe me,locatedPoint,newPointPos sprite(mySprite).visible = true --here we need to know locatedPoint's order if locatedPoint.locH = firstPoint.locH and locatedPoint.locV = firstPoint.locV then member(myMember).vertexList=[] member(myMember).vertexList=[[#vertex:newPointPos],[#vertex:secondPoint]] --firstPoint = newPointPos end if if locatedPoint.locH = secondPoint.locH and locatedPoint.locV = secondPoint.locV then member(myMember).vertexList=[] member(myMember).vertexList=[[#vertex:firstPoint],[#vertex:newPointPos]] --secondPoint = newPointPos end if updateStage

204
end on updateFirstSecondPoint me first = getProp(member(myMember).vertexList[1],#vertex) second = getProp(member(myMember).vertexList[2],#vertex) firstPoint = first secondPoint = second end on setEdgeColor me,theColor newEdge.strokeColor = theColor updateStage end on restoreEdgeColor me newEdge.strokeColor = myColor updateStage end on setEdgeWidth me, theWidth newEdge.strokeWidth = theWidth end on setInk me, theInk sprite(mySprite).ink = theInk myInk = theInk end on setBlend me, theBlend sprite(mysprite).ink = 32 myInk = 32 sprite(mysprite).blend = theBlend myBlend = theBlend end

205
Appendix C: ASP Script for the Dynamic VRML
<%@ LANGUAGE="VBSCRIPT"%> <% Option Explicit Dim fso, MyFile,RootDir,line,viewOrder Dim vpName(12),px(12),py(12),pz(12),ox(12),oy(12),oz(12),rotAngle(12),volume(12) Dim firstViewPoint,i Dim userID, teamID Dim Connect, onAccount,SQL response.Expires = 0 response.Buffer = TRUE response.Clear response.ContentType = "x-world/x-vrml" RootDir = server.MapPath("/vcity") &"\users\ground\" 'RootDir ="F:\www\soonercity\users\ground\" Set fso = CreateObject("Scripting.FileSystemObject") '********************** 'Read in the first part of the ground.wrl '********************** Set MyFile = fso.OpenTextFile(RootDir&"groundfirst.wrl", 1,0) Do line = myFile.ReadLine line = line+vbcr response.Write(line) Loop until MyFile.AtEndOfStream MyFile.close userID=Request.Cookies("dir") if userID ="" then userID = "guestGroup" End if teamID = userID userID = userID&"/" loadModel "ground/landscape.wrl", 0,0,0

206
loadModel userID&"building.wrl", -600, 0, -100 'loadModel userID&"road.wrl", 500, 0, 0 loadModel userID&"steel.wrl",-600, 0, 100 'loadModel userID&"tower.wrl",-800, 0, 100 loadModel userID&"hwy.wrl",-700, 0, 0 loadModel userID&"dam.wrl",0, 0, 0 loadModel userID&"bridge.wrl",340, 0, 0 loadModel userID&"consolLand.wrl",0, 0, 0 loadModel userID&"concrete.wrl",0, 0, 0 loadModel userID&"piping.wrl",0, 0, 0 '''''''''''''''''''''''''''''''''''''''''''''''''''''''''''''''''''''''''''''''''''''''''''' 'Here I retrieve the files in the database for virtual world '''''''''''''''''''''''''''''''''''''''''''''''''''''''''''''''''''''''''''''''''''''''''''' Set Connect = Server.CreateObject("ADODB.Connection") Connect.Open "DSN=vcity","sa","" SQL = "select fileName from teamFolderVRMLFiles where teamID = '"&teamID&"';" Set onAccount = Connect.execute(SQL) 'Loop to report the fileNames if onAccount.EOF = true then 'do nothing Else Do Until onAccount.EOF loadModel userID&onAccount("fileName"),0, 0, 0 onAccount.MoveNext Loop End if '''''''''''''''''''''''''''''''''''''''''''''''''''''''''''''''''' '***************************** 'Read in the last part of the ground.wrl '***************************** Set MyFile = fso.OpenTextFile(RootDir&"groundlast.wrl", 1,0) Do line = myFile.ReadLine line = line+vbcr response.Write(line) Loop until MyFile.AtEndOfStream MyFile.close
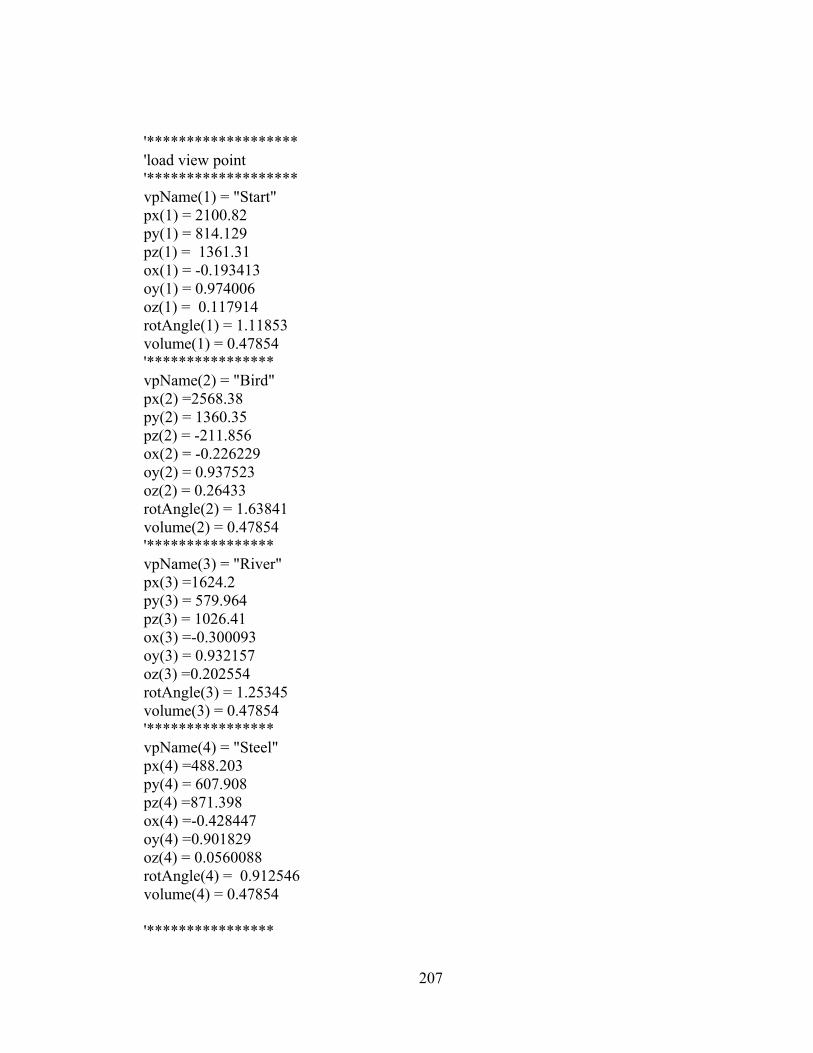
207
'******************* 'load view point '******************* vpName(1) = "Start" px(1) = 2100.82 py(1) = 814.129 pz(1) = 1361.31 ox(1) = -0.193413 oy(1) = 0.974006 oz(1) = 0.117914 rotAngle(1) = 1.11853 volume(1) = 0.47854 '**************** vpName(2) = "Bird" px(2) =2568.38 py(2) = 1360.35 pz(2) = -211.856 ox(2) = -0.226229 oy(2) = 0.937523 oz(2) = 0.26433 rotAngle(2) = 1.63841 volume(2) = 0.47854 '**************** vpName(3) = "River" px(3) =1624.2 py(3) = 579.964 pz(3) = 1026.41 ox(3) =-0.300093 oy(3) = 0.932157 oz(3) =0.202554 rotAngle(3) = 1.25345 volume(3) = 0.47854 '**************** vpName(4) = "Steel" px(4) =488.203 py(4) = 607.908 pz(4) =871.398 ox(4) =-0.428447 oy(4) =0.901829 oz(4) = 0.0560088 rotAngle(4) = 0.912546 volume(4) = 0.47854 '****************

208
vpName(5) = "Tower" px(5) = 301.577 py(5) = 523.342 pz(5) = 463.405 ox(5) = -0.287543 oy(5) =0.945671 oz(5) = 0.151741 rotAngle(5) = 1.32004 volume(5) = 0.47854 '**************** vpName(6) = "Building" px(6) = 14.0581 py(6) = 364.239 pz(6) = 441.587 ox(6) = -0.42273 oy(6) = 0.888205 oz(6) = 0.179974 rotAngle(6) = 1.20197 volume(6) = 0.47854 vpName(7) = "Lake" px(7) = 1577.16 py(7) = 745.407 pz(7) = 356.233 ox(7) = -0.41338 oy(7) = 0.882569 oz(7) = 0.22403 rotAngle(7) = 1.10696 volume(7) = 0.47854 vpName(8) = "Bridge" px(8) = 705.351 py(8) = 120.952 pz(8) = 176.219 ox(8) = -0.351491 oy(8) = 0.921591 oz(8) = 0.164697 rotAngle(8) = 0.929157 volume(8) = 0.47854 vpName(9) = "Concrete" px(9) = -532.531 py(9) = 53.4159 pz(9) = 47.2986 ox(9) = -0.195245

209
oy(9) = 0.970839 oz(9) = 0.139109 rotAngle(9) = 1.26621 volume(9) = 0.47854 vpName(10) = "Piping" px(10) = 2401.2 py(10) = -1239.86 pz(10) = 912.444 ox(10) = 0.26581 oy(10) = 0.943529 oz(10) = -0.197735 rotAngle(10) = 1.33527 volume(10) =0.47854 '**************** '**************** 'Load view point '*************** firstViewpoint = request.cookies("currentViewPoint") if firstViewpoint ="" then firstViewpoint = 2 end if loadViewPoint vpName(firstViewpoint),px(firstViewpoint),py(firstViewpoint),pz(firstViewpoint),_ ox(firstViewpoint),oy(firstViewpoint),oz(firstViewpoint),rotAngle(firstViewpoint),volume(firstViewpoint) For i = 1 To 10 If i <> firstViewpoint Then loadViewPoint vpName(i),px(i),py(i),pz(i),ox(i),oy(i),oz(i),rotAngle(i),volume(i) End If Next '******************** response.end %> <%

210
'********************** 'Use this function, we could save a lot of effort to write codes '********************** Function loadModel(path,x,y,z) response.write("DEF building Transform {"& vbcr) response.write("children Inline {" & vbcr) response.write("url "& chr(34) & path & chr(34) &vbcr) response.write(" }"+vbcr) response.write(" translation "& x &" "& y &" "& z &vbcr) response.write("}"&vbcr&vbcr) End Function '************************** 'loadViewPoint '************************** Function loadViewPoint(vpName,px,py,pz,ox,oy,oz,rotAngle,viewVolume) response.write("DEF "& vpName &" Viewpoint {" & vbcr) response.write("position "& px & " "& py & " " & pz & vbcr) response.write("orientation "& ox & " "& oy & " " & oz & " "& rotAngle & vbcr) response.write("fieldOfView " & viewVolume &vbcr) response.write("jump FALSE" & vbcr) response.write("description "& chr(34) & vpName & chr(34) &vbcr) response.write("}"&vbcr &vbcr) End Function %>
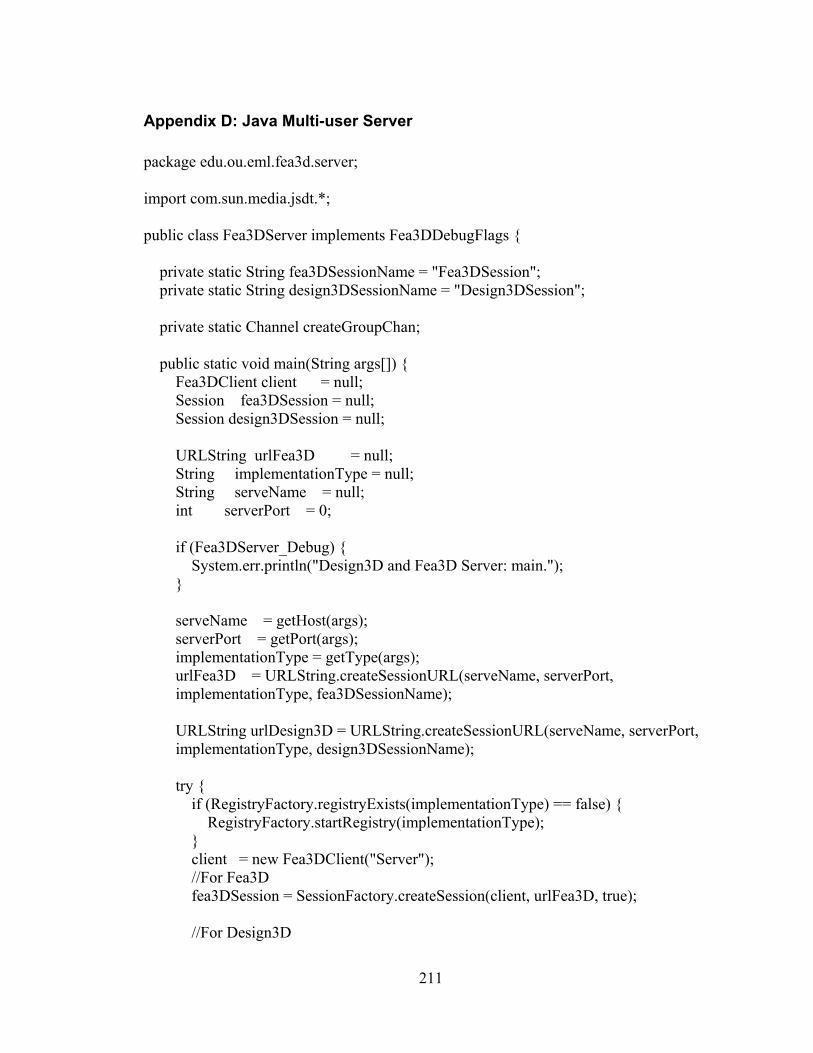
211
Appendix D: Java Multi-user Server
package edu.ou.eml.fea3d.server; import com.sun.media.jsdt.*; public class Fea3DServer implements Fea3DDebugFlags { private static String fea3DSessionName = "Fea3DSession"; private static String design3DSessionName = "Design3DSession"; private static Channel createGroupChan; public static void main(String args[]) { Fea3DClient client = null; Session fea3DSession = null; Session design3DSession = null; URLString urlFea3D = null; String implementationType = null; String serveName = null; int serverPort = 0; if (Fea3DServer_Debug) { System.err.println("Design3D and Fea3D Server: main."); } serveName = getHost(args); serverPort = getPort(args); implementationType = getType(args); urlFea3D = URLString.createSessionURL(serveName, serverPort, implementationType, fea3DSessionName); URLString urlDesign3D = URLString.createSessionURL(serveName, serverPort, implementationType, design3DSessionName); try { if (RegistryFactory.registryExists(implementationType) == false) { RegistryFactory.startRegistry(implementationType); } client = new Fea3DClient("Server"); //For Fea3D fea3DSession = SessionFactory.createSession(client, urlFea3D, true); //For Design3D

212
design3DSession = SessionFactory.createSession(client, urlDesign3D, true); System.err.println("Setup and bound Design3D and Fea3D server."); } catch (JSDTException e) { System.err.println("Design3D and Fea3D Server: main: shared data exception: " + e); if (Fea3DServer_Debug) { e.printStackTrace(); } } } private static String getHost(String args[]) { String defHost = "vcity.ou.edu"; /* Default host name for connections. */ int length = args.length; if (Fea3DServer_Debug) { System.err.println("Design3D and Fea3D Server: getHost."); } for (int i = 0; i < length; i++) { if (args[i].equals("-server")) { if (++i < length) { return(args[i]); } } } return(defHost); } private static int getPort(String args[]) { int defPort = 4461; /* Default port number for connections. */ int length = args.length; if (Fea3DServer_Debug) { System.err.println("Design3D and Fea3D Server: getPort."); } for (int i = 0; i < length; i++) { if (args[i].equals("-port")) { if (++i < length) {

213
return(Integer.parseInt(args[i])); } } } return(defPort); } private static String getType(String args[]) { String defType = "socket"; /* Default Session type. */ int length = args.length; if (Fea3DServer_Debug) { System.err.println("Design3D and Fea3D Server: getType."); } for (int i = 0; i < length; i++) { if (args[i].equals("-type")) { if (++i < length) { return(args[i]); } } } return(defType); } }
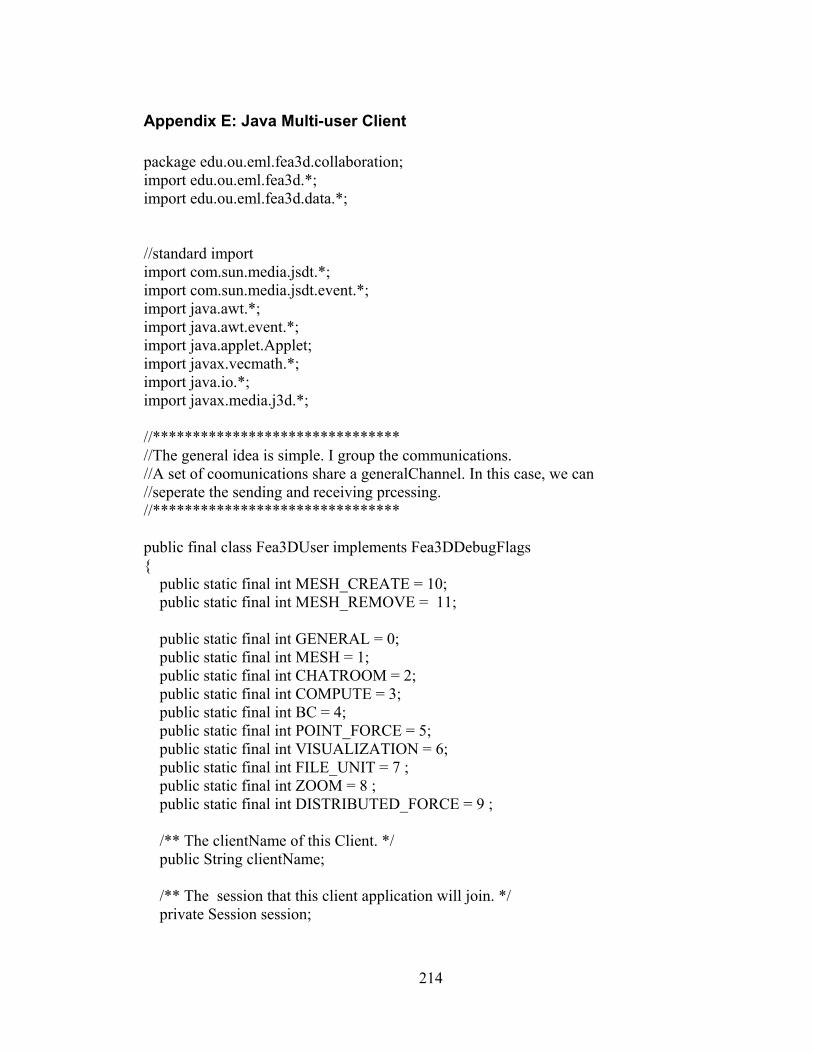
214
Appendix E: Java Multi-user Client
package edu.ou.eml.fea3d.collaboration; import edu.ou.eml.fea3d.*; import edu.ou.eml.fea3d.data.*; //standard import import com.sun.media.jsdt.*; import com.sun.media.jsdt.event.*; import java.awt.*; import java.awt.event.*; import java.applet.Applet; import javax.vecmath.*; import java.io.*; import javax.media.j3d.*; //******************************* //The general idea is simple. I group the communications. //A set of coomunications share a generalChannel. In this case, we can //seperate the sending and receiving prcessing. //******************************* public final class Fea3DUser implements Fea3DDebugFlags { public static final int MESH_CREATE = 10; public static final int MESH_REMOVE = 11; public static final int GENERAL = 0; public static final int MESH = 1; public static final int CHATROOM = 2; public static final int COMPUTE = 3; public static final int BC = 4; public static final int POINT_FORCE = 5; public static final int VISUALIZATION = 6; public static final int FILE_UNIT = 7 ; public static final int ZOOM = 8 ; public static final int DISTRIBUTED_FORCE = 9 ; /** The clientName of this Client. */ public String clientName; /** The session that this client application will join. */ private Session session;

215
/** The client that will be joining the session and generalChannel. */ public static Fea3DClient client; /** The generalChannel that this client application will use to send data. */ private Channel generalChannel, meshChannel, chatChannel, computeChannel; private Channel bcChannel , pointForceChannel, visualizationChannel; private Channel fileUnitChannel, zoomChannel; private Channel distributedChannel; /** The data that will be sent over the generalChannel. */ private Data data; /** Indicates if the client is successfully connected to the server. */ public boolean connected = false; //Mouse token is used to ensure only one user can rotate the object //at some particular time public static Token mouseToken; private String mouseTokenName = null; public static Token newUserToken; private String newUserTokenName = null; //Team name is a base that is used to separate communication between teams private String teamName = null ; private String meshChannelName = null ; private String chatChannelName = null ; private String computeChannelName = null ; private String bcChannelName = null ; private String pointForceChannelName = null ; private String visualizationChannelName = null ; private String fileUnitChannelName = null ; private String zoomChannelName = null ; private String distributedChannelName = null; /* Default setup, will mostly be overriden by attributes. */ String serverName = DataContainer.serverName ; int serverPort = 4461; String sessionImplementationType = "socket"; private ChannelConsumer generalChannelConsumer, meshChannelConsumer, chatChannelConsumer, computeChannelConsumer, bcChannelConsumer, pointForceChannelConsumer, visualizationChannelConsumer, fileUnitChannelConsumer, zoomChannelConsumer, distributedChannelConsumer ;
216
public Fea3DUser() { //Please notice that client should be passed from HTML pages clientName = DataContainer.userName ; teamName = DataContainer.newChannelName; meshChannelName = teamName + "mesh" ; chatChannelName = teamName +"chat" ; computeChannelName = teamName +"compute" ; bcChannelName = teamName +"bc" ; pointForceChannelName = teamName+"pointForce" ; visualizationChannelName = teamName+"visualizatoin"; fileUnitChannelName = teamName + "fileUnit" ; zoomChannelName = teamName + "zoom" ; distributedChannelName = teamName + "distributed" ; mouseTokenName = "mouseToken" ; newUserTokenName = "newUser" ; } final public void connect() { if (teamName == null) { System.out.println("Connection failed since no team Name is provided"); return; } if (connected) { return; } String sessionName = "Fea3DSession"; boolean sessionExists = false; URLString url = null; if (Fea3DUser_Debug) { System.err.println("Fea3DUser: connect."); } try { try { url = URLString.createSessionURL(serverName, serverPort, sessionImplementationType, sessionName); // String string = "jsdt://"+serverName+":"+serverPort+"/" // +sessionImplementationType+"/Session/"+sessionName;
217
//url = new URLString(string); System.out.println("Fea3DUser: connect: checking: url: " + url); int tryTime = 0; boolean isServerAlive = true; while (!sessionExists) { try { if (SessionFactory.sessionExists(url)) { System.out.println("Fea3DUser: connect:" + " found Session."); sessionExists = true; } } catch (NoRegistryException nre) { System.out.println("Fea3DUser: connect:" + " no registry: sleeping."); tryTime++; Thread.sleep(1000); } catch (ConnectionException ce) { System.out.println("Fea3DUser: connect:" + " connection exception: sleeping."); Thread.sleep(1000); tryTime++; } if (tryTime>1) { System.out.println("\nHaving trouble in connecting Fea3DServer !!!!!\n"); isServerAlive = false; break; } } if (isServerAlive == true) { /* Create a client. */ System.err.println("Creating a team member..."); client = new Fea3DClient(clientName); /* Join the session */ session = SessionFactory.createSession(client, url, true); //general channel generalChannel = session.createChannel(client, teamName,true, true, true); //Receive and process data generalChannelConsumer = new GeneralChannelConsumer() ; generalChannel.addConsumer(client, generalChannelConsumer ); //Mesh channel for grouping communications about meshing
218
meshChannel = session.createChannel(client, meshChannelName,true, true, true); meshChannelConsumer = new MeshChannelConsumer() ; meshChannel.addConsumer(client, meshChannelConsumer); //Chat channel for discussions of users chatChannel = session.createChannel(client, chatChannelName,true, true, true); chatChannelConsumer = new ChatChannelConsumer() ; chatChannel.addConsumer(client, chatChannelConsumer ); //compute channel for triggerring other user to perform computation computeChannel = session.createChannel(client, computeChannelName,true, true, true); computeChannelConsumer = new ComputeChannelConsumer() ; computeChannel.addConsumer(client, computeChannelConsumer ); //BC channel for managing the BC bcChannel = session.createChannel(client, bcChannelName,true,true,true); bcChannelConsumer = new BCChannelConsumer() ; bcChannel.addConsumer(client, bcChannelConsumer ); //Point force channel takes care of issues related to point force pointForceChannel = session.createChannel(client, pointForceChannelName,true,true,true); pointForceChannelConsumer = new PointForceChannelConsumer() ; pointForceChannel.addConsumer(client, pointForceChannelConsumer ); //visualization channel takes care of issues about visualization visualizationChannel = session.createChannel(client, visualizationChannelName,true,true,true); visualizationChannelConsumer = new VisualizationChannelConsumer() ; visualizationChannel.addConsumer(client, visualizationChannelConsumer ); //fileUnit channel takes care of issues about input new geometric files and unit problems fileUnitChannel = session.createChannel(client, fileUnitChannelName,true,true,true); fileUnitChannelConsumer = new FileUnitChannelConsumer() ; fileUnitChannel.addConsumer(client, fileUnitChannelConsumer ); //fileUnit channel takes care of issues about input new geometric files and unit problems zoomChannel = session.createChannel(client, zoomChannelName,true,true,true); zoomChannelConsumer = new ZoomChannelConsumer();
219
zoomChannel.addConsumer(client, zoomChannelConsumer ); distributedChannel = session.createChannel(client, distributedChannelName,true,true,true); distributedChannelConsumer = new DistributedChannelConsumer(); distributedChannel.addConsumer(client, distributedChannelConsumer ); //Monitor the behavior of users zoomChannel.addChannelListener(new ChannelConsumerListener() ); //Create a mouse token mouseToken = session.createToken(client, mouseTokenName, true); //Attention the mouseToken is used in MouseRotateNetwork class newUserToken = session.createToken(client, newUserTokenName, true); updateMemberList(); try { //Coonection is a jsdt class Connection.addConnectionListener(serverName, sessionImplementationType, new FailureConnectionListener()); } catch(JSDTException e) { System.out.println("Coundn't add connectionListener"+e); } connected = true; } } catch (Exception e) { System.out.println("Fea3DUser.connect: "+e); } } catch (Throwable th) { System.err.println("Fea3DUser: connect caught: " + th); throw new Error("Fea3DUser.connect failed : " + th); } } //***************************************** final public void disconnect() { if (connected == false) { return; } try {
220
//If this is the last client of the group, we need to destroy the generalChannel //which is created for this patricular group String[] clientList = generalChannel.listClientNames(); if (clientList.length ==1) generalChannel.destroy(client); session.close(true); } catch (Exception e) { System.err.println("Caught exception while trying to " + "disconnect from sun3D server: " + e); if (Fea3DUser_Debug) { e.printStackTrace(); } } connected = false; } //******************************************* //The method is used to send data //****************************************** public final void sendObjects(Object obj, int id) { if ( connected == false | DataContainer.generalToolBar.collaborative == false) { return ; } try { //long start = System.currentTimeMillis(); Data data = new Data(obj); data.setPriority(Channel.HIGH_PRIORITY); switch(id) { case GENERAL: { generalChannel.sendToOthers(client, data); break;} case MESH: { meshChannel.sendToOthers(client, data); break;} case CHATROOM: { chatChannel.sendToAll(client, data); break;} case BC : { bcChannel.sendToOthers(client, data); break ;} case POINT_FORCE : { pointForceChannel.sendToOthers(client, data) ;break ;} case COMPUTE : {computeChannel.sendToOthers(client, data); break ;} case VISUALIZATION :

221
{visualizationChannel.sendToOthers(client,data); break; } case FILE_UNIT: {fileUnitChannel.sendToOthers(client,data);break;} case ZOOM: {zoomChannel.sendToOthers(client,data);break;} case DISTRIBUTED_FORCE: {distributedChannel.sendToOthers(client, data) ; break;} default: {break;} } data = null; //long end = System.currentTimeMillis(); //System.out.println("sending time ="+(end-start) ); } catch (ConnectionException ce) { System.out.println("Fea3DUser: exception: " + ce); disconnect(); } catch (TimedOutException ce) { System.out.println("Fea3DUser: exception: " + ce); disconnect(); } catch (Exception e) { e.printStackTrace(); } }//end of sendObjectToOthers() public void removeConsumers() { try { if ( newUserToken.test() == Token.GRABBED) { newUserToken.release(client); } //mouseToken.release(client); } catch(JSDTException e) { //System.out.println("Failed in releasing token."+e) ; } //disconnect from other users try { generalChannel.removeConsumer(client, generalChannelConsumer ); meshChannel.removeConsumer(client, meshChannelConsumer);

222
chatChannel.removeConsumer(client, chatChannelConsumer ); computeChannel.removeConsumer(client, computeChannelConsumer ); bcChannel.removeConsumer(client, bcChannelConsumer ); pointForceChannel.removeConsumer(client, pointForceChannelConsumer ); visualizationChannel.removeConsumer(client, visualizationChannelConsumer ); fileUnitChannel.removeConsumer(client, fileUnitChannelConsumer ); zoomChannel.removeConsumer(client, zoomChannelConsumer ); distributedChannel.removeConsumer(client, distributedChannelConsumer); } catch (JSDTException e) { e.printStackTrace(); } } public void addConsumers() { //disconnect from other users try { generalChannel.addConsumer(client, generalChannelConsumer ); meshChannel.addConsumer(client, meshChannelConsumer); chatChannel.addConsumer(client, chatChannelConsumer ); computeChannel.addConsumer(client, computeChannelConsumer ); bcChannel.addConsumer(client, bcChannelConsumer ); pointForceChannel.addConsumer(client, pointForceChannelConsumer ); visualizationChannel.addConsumer(client, visualizationChannelConsumer ); fileUnitChannel.addConsumer(client, fileUnitChannelConsumer ); zoomChannel.addConsumer(client, zoomChannelConsumer ); distributedChannel.addConsumer(client, distributedChannelConsumer); } catch (JSDTException e) { e.printStackTrace(); } } //Join again public void join() { try { session.join(client) ; System.out.println("Successful in joining the session") ; } catch(JSDTException e)

223
{ System.out.println("Failed in joining the session"+e) ; } } //******************************************* //The method is used to send data //****************************************** public final void sendToNewClient(String receivingClientName, Object obj, int id) { if ( connected == false | DataContainer.generalToolBar.collaborative == false) { return ; } try { //long start = System.currentTimeMillis(); Data data = new Data(obj); data.setPriority(Channel.HIGH_PRIORITY); switch(id) { case MESH: { meshChannel.sendToClient(client, receivingClientName, data); break;} case BC: { bcChannel.sendToOthers(client, data); break ;} case POINT_FORCE : { pointForceChannel.sendToClient(client, receivingClientName, data) ;break ;} case COMPUTE : {computeChannel.sendToClient(client, receivingClientName, data); break ;} case VISUALIZATION : {visualizationChannel.sendToClient(client, receivingClientName, data); break; } case FILE_UNIT: {fileUnitChannel.sendToClient(client, receivingClientName, data);break;} case DISTRIBUTED_FORCE: {distributedChannel.sendToClient(client, receivingClientName, data) ; break;} default: {break;} } data = null; //long end = System.currentTimeMillis(); //System.out.println("sending time ="+(end-start) ); } catch (ConnectionException ce) { System.out.println("Fea3DUser: exception: " + ce); disconnect(); } catch (TimedOutException ce) { System.out.println("Fea3DUser: exception: " + ce);
224
disconnect(); } catch (Exception e) { e.printStackTrace(); } }//end of sendObjectToOthers() public void updateMemberList() { updateMemberList(null); } public void updateMemberList(String receivingClient) { try { //Here we need to list the client names on the left area String[] clientNames = generalChannel.listClientNames(); String clients = "Team account:\n"+teamName+"\nTeam members:"; for ( int i = 0 ; i < clientNames.length ; i++) { if ( "Server".equals(clientNames[i]) | clientNames[i].equals(receivingClient) ) { //do nothing } else { clients = clients+"\n"+clientNames[i]; } } DataContainer.teamMembersBoard.setText(clients); //++++++++++++++++++++++++++++ } catch(JSDTException e) { System.out.println("Coundn't get the clientNames list"+e); } } public void clearMemberList() { DataContainer.teamMembersBoard.setText(null); } }

225
Appendix F: Java 3D for the Engineering Analysis
//************************** // Copyright Qiuli Sun August 2001 // The University of Oklahoma //************************** /** This is a main program which works as a 3D data viewer. The program runs as an applet. The Java shared Data Toolkit is also integrated in this client application. Another application needs to run on the server in order to communicate between users. */ package edu.ou.eml.fea3d; import edu.ou.eml.fea3d.layout.*; import edu.ou.eml.fea3d.collaboration.*; import edu.ou.eml.fea3d.interaction.*; import edu.ou.eml.fea3d.mesh.*; import edu.ou.eml.fea3d.data.*; import edu.ou.eml.fea3d.force.*; import edu.ou.eml.fea3d.misc.*; import edu.ou.eml.fea3d.solver.*; //****Standard import ********* import java.applet.Applet; import java.awt.*; import java.awt.event.*; import com.sun.j3d.utils.geometry.*; import com.sun.j3d.utils.universe.*; import javax.media.j3d.*; import javax.vecmath.*; import javax.swing.*; import java.net.*; import java.io.*; import java.util.*; import javax.media.j3d.View; import javax.swing.border.*; import javax.swing.Timer; import com.sun.j3d.utils.applet.MainFrame; //------------------------------------------------------------------------------------------ public class Fea3D extends JApplet implements ActionListener, Runnable {

226
private static final float FRONT_RATE = 0.2f; private static final float BACK_RATE = 50.0f ; public static final float EYE_RATE = 1.9f; JButton pStartButton; URL pText3DFile = null; URLConnection conn = null; Thread p3DThread; JFrame baseFrame = null; static ProgressMonitor pMonitor; static int pProgress; SceneGraph pSceneGraph; View pView; Insets pInserts; EtchedBorder pBorder; Appearance pMaterialAppear; WireframeGeometry pWireframeGeometry = null; CoordinateSystem coordSystem ; public ReadGeometryData readTool; public void init() { initializeJava3D(); pInserts = new Insets(0,1,0,1); pBorder = new EtchedBorder(EtchedBorder.LOWERED); pStartButton = new JButton("3D FEA"); pStartButton.setMargin(pInserts); pStartButton.setFont(new Font("SanSerf",Font.PLAIN,13)); pStartButton.addActionListener(this); this.getContentPane().add(pStartButton); try { UIManager.setLookAndFeel(UIManager.getCrossPlatformLookAndFeelClassName()); } catch (Exception e){ System.err.println("Can't set look and feel:"+e); } //It is extremely important to place pMonitor here Component parent = (Component)pStartButton; pMonitor = new ProgressMonitor(parent, "Loading Progress", "Getting Started to render...", 0, 100); pMonitor.setMillisToDecideToPopup(100); setStartProgress(0); //For debugging, please don't delete it

227
pText3DFile = Fea3DFactory.getURL(Fea3D.this, "retainingWall.txt"); //pText3DFile = null; readTool = new ReadGeometryData(); readTool.setURL(pText3DFile); //pass the reference into DataContainer DataContainer.setReadTool(readTool); //JPopupMenu.setDefaultLightWeightPopupEnabled(false); //ToolTipManager.sharedInstance().setLightWeightPopupEnabled(false); //System.out.println("lw="+ToolTipManager.sharedInstance().isLightWeightPopupEnabled()); //initializeNetwork(); } //*************************** private void initializeJava3D() { //Initialize the basic data DataContainer dataContainer = new DataContainer(); p3DThread = new Thread(this); p3DThread.setPriority(Thread.MAX_PRIORITY); pMaterialAppear = new Appearance(); pMaterialAppear.setCapability(Appearance.ALLOW_MATERIAL_WRITE); pMaterialAppear.setMaterial(DataContainer.material); pWireframeGeometry = new WireframeGeometry(); //Manage the hidden lines //Create a DataContainer.hiddenShape3D HiddenLineManager hiddenLineManager = new HiddenLineManager() ; } //****************************** private void initializeNetwork() { DataContainer.serverName = this.getCodeBase().getHost() ; String userName = this.getParameter("userName"); String newChannelName = this.getParameter("NEWCHANNEL"); //===================================== //This is only for testing. They should be redesigned later
228
//====================================== if (newChannelName == null | userName == null ) { newChannelName = "guestGroup"; userName = "guest"+ (Fea3DFactory.randomRange (0, 500) * Fea3DFactory.randomRange (0, 500)) ; } else { //This is to make user everyone log in as guest, the multi-user //still works if ( "guestGroup".equals(newChannelName) & "guest".equals(userName) ) { userName = "guest"+ (Fea3DFactory.randomRange (0, 500) * Fea3DFactory.randomRange (0, 500)) ; } } DataContainer.newChannelName = newChannelName ; DataContainer.userName = userName ; //====================================== System.out.println("team name = "+newChannelName); System.out.println("user name = "+userName); //Fea3D must be initialized here since it needs //DataContainer.newChannelName being set first DataContainer.fea3DUser = new Fea3DUser (); try { DataContainer.fea3DUser.connect(); } catch(Exception e) { System.out.println("Connection failed"); } } //*************** End of initializing ************ public void run() { URL iconURL; Dimension myButtonSize = new Dimension(32,26); pStartButton.setEnabled(false); baseFrame = new JFrame("Collaborative 3D Finite Element Analysis");

229
//Record baseFrame in the DataContainer for easy access of other classes DataContainer.setFrameBase(baseFrame); WindowListener winListener = new FrameWindowAdapter(); baseFrame.addWindowListener(winListener); Container contentPane = baseFrame.getContentPane(); //Layout must be set, otherwise confused contentPane.setLayout(new BorderLayout()); //Create a general tool bar GeneralToolBar generalToolBar = new GeneralToolBar(Fea3D.this); DataContainer.generalToolBar = generalToolBar ; ToggleToolBar toggleToolBar = new ToggleToolBar(Fea3D.this); SouthPane southPane = new SouthPane(Fea3D.this); contentPane.add(generalToolBar, BorderLayout.NORTH); contentPane.add(toggleToolBar, BorderLayout.WEST); contentPane.add(southPane, BorderLayout.SOUTH); baseFrame.setSize(510,590); setStartProgress(20); //Update the Data in the DataContainer if (DataContainer.updateGeometricData() == false) { //InitializeAppletStatus(); } else { DataContainer.geometry = this.getGeometry(); } setStartProgress(40); GraphicsConfiguration config = SimpleUniverse.getPreferredConfiguration(); Canvas3D canvas3D = new Canvas3D(config); DataContainer.canvas3D = canvas3D ; contentPane.add(canvas3D, BorderLayout.CENTER); coordSystem = new CoordinateSystem(); setStartProgress(70);

230
// Create a simple scene and attach it to the virtual universe pSceneGraph = new SceneGraph(true, DataContainer.shape3D, DataContainer.geometry, pMaterialAppear, DataContainer.geometryTG, canvas3D); BranchGroup scene = pSceneGraph.createSceneGraph(); SimpleUniverse u = new SimpleUniverse(canvas3D); DataContainer.universe = u ; initializeNetwork(); setStartProgress(90); // This will move the ViewPlatform back a bit so the // objects in the scene can be viewed. u.setJ3DThreadPriority(Thread.MAX_PRIORITY - 1); u.getViewingPlatform().setNominalViewingTransform(); pView = u.getViewer().getView(); pView.setFrontClipDistance(DataContainer.maxXYZ*FRONT_RATE); pView.setBackClipDistance(DataContainer.maxXYZ*BACK_RATE); zoomInOut(EYE_RATE); u.addBranchGraph(scene); setStartProgress(100); pMonitor.close(); baseFrame.setVisible(true); } // end of run() //******************************************************* private void setStartProgress(int pProgress) { pMonitor.setProgress(pProgress); pMonitor.setNote("loaded "+ pProgress+"%"); } //******************************************************* private void InitializeAppletStatus() { // System.out.println("There is no 3D information in the data files or the file doesn't exist!"); JOptionPane.showMessageDialog( DataContainer.baseFrame, "There is no 3D information in the\n" +"data files or the file doesn't exist!",

231
"Boundary Condition Warning Message", JOptionPane.WARNING_MESSAGE); System.gc(); } //******************************************************* public void actionPerformed(ActionEvent e) { Object source = e.getSource(); if(source==pStartButton && baseFrame==null) { p3DThread.start(); } if(source==pStartButton && baseFrame!=null) { baseFrame.setVisible(true); } } //******************************************************* private synchronized GeometryInfo processGeometryData() { GeometryInfo gi = new GeometryInfo(GeometryInfo.POLYGON_ARRAY); gi.setCoordinates(DataContainer.points); gi.setCoordinateIndices(DataContainer.polyPointsIndex); gi.setStripCounts(DataContainer.pStripCounts); Triangulator tr = new Triangulator(); tr.triangulate(gi); gi.recomputeIndices(); NormalGenerator ng = new NormalGenerator(); ng.setCreaseAngle(2.01*Math.PI/14.0); ng.generateNormals(gi); gi.recomputeIndices(); Stripifier st = new Stripifier(); st.stripify(gi); gi.recomputeIndices(); //release the memory tr = null; ng = null; st = null; return gi; } //***********************
232
public void update() { if (ImportActionListener.pText3DFile ==null) return; System.out.println("Updating ......"); //Release the memory before updating DataContainer.points = null; DataContainer.pStripCounts = null; DataContainer.polyPointsIndex = null; if (DataContainer.updateGeometricData() == false) { InitializeAppletStatus(); } else { DataContainer.geometry = Fea3D.this.getGeometry(); //Always update the view volume pView.setFrontClipDistance(DataContainer.maxXYZ*FRONT_RATE); pView.setBackClipDistance(DataContainer.maxXYZ*BACK_RATE); zoomInOut(EYE_RATE) ; DataContainer.shape3D.setGeometry(DataContainer.geometry); updateCoordSystem() ; //delete everything DeleteActionListener.delete() ; } } //My own WindowAdapter private class FrameWindowAdapter extends WindowAdapter { FrameWindowAdapter() { super(); } public void windowClosing(WindowEvent e){ pStartButton.setEnabled(true); } } //******************************* // We must disconnect the applet //******************************* public void destroy() { DataContainer.fea3DUser.disconnect();
233
} private IndexedGeometryArray getGeometry() { pWireframeGeometry.setGeometryInfo ( DataContainer.points, DataContainer.pIDPT1, DataContainer.pIDPT2 ) ; return pWireframeGeometry.getWireframeGeometry(); } void updateCoordSystem() { //We need to delete the previous one for (int i = 0 ; i < DataContainer.geometryTG.numChildren (); i++) { if ( DataContainer.geometryTG.getChild (i) == coordSystem.coordSystemBG ) { //Remove the coord from the scene graph DataContainer.geometryTG.removeChild (i); break; } }//end of for() //create a new one coordSystem = new CoordinateSystem() ; } //Other class will call these two methods public static void zoomInOut(float zoomRate) { Transform3D pEyePoint = new Transform3D(); pEyePoint.setTranslation(new Vector3f ( 0.0f, 0.0f, DataContainer.maxXYZ * zoomRate ) ); TransformGroup pViewPlatformTG = DataContainer.universe.getViewingPlatform().getViewPlatformTransform(); pViewPlatformTG.setTransform(pEyePoint); } public static void undoZoom() { zoomInOut(EYE_RATE) ; } } //end of Japplet

234
Appendix G: Perl Script for the VRML Structure
#soil.pl read(STDIN, $buffer, $ENV{'CONTENT_LENGTH'}); $mainFolder = "vcity"; # split name and value into pairs @nvpairs = split(/&/, $buffer); # single > writes file (even if existing) >> appends file $pair1 = @nvpairs[0]; ($Dname, $DirVolName) = split(/=/, $pair1); $pair2 = @nvpairs[1]; ($fname, $wrlfilename) = split(/=/, $pair2); # sets dam height $pair3 = @nvpairs[2]; ($bname, $damBottom) = split(/=/, $pair3); # sets dam left $pair4 = @nvpairs[3]; ($bname, $damLeft) = split(/=/, $pair4); # sets dam top $pair5 = @nvpairs[4]; ($bname, $damTop) = split(/=/, $pair5); #sets dam height $pair6 = @nvpairs[5]; ($bname, $damHeight) = split(/=/, $pair6); # to check the value to make sure no strange data if ($damBottom < 20.0) { $damBottom = 20.0;} if ($damLeft < 5.0) {$damLeft = 5.0;} if ($damTop < 5.0) {$damTop = 5.0;} if ($damHeight < 5.0) {$damHeight = 5.0;} $damRight = $damBottom - $damLeft - $damTop; if ($damRight<5.0) {$damRight = 5.0;}

235
################################### $halfBottom = 0.5*$damBottom; $negativeHalfBottom = -1.0*$halfBottom; $halfTop = 0.5*$damTop; $left = $halfBottom - $damLeft; $negativeLeft = -1.0*$left; $right = $halfBottom - $damRight; $negativeRight = -1.0*$right; $FullPathWrl =">".$mainFolder."/users/".$DirVolName."/dam.wrl"; open(INFO, $FullPathWrl); print INFO <<endfile; #VRML V2.0 utf8 #Cosmo Worlds V2.0 Transform { children [ Shape { appearance Appearance { material Material { ambientIntensity 0.162791 diffuseColor 0.35 0.41 0.43 specularColor 0.15 0.17 0.18 emissiveColor 0.14 0.16 0.17 shininess 0.32 transparency 0 } } geometry DEF dam_0 IndexedFaceSet { coord Coordinate { point [ 220 0 $halfBottom, -220 0 $halfBottom, -220 0 $negativeHalfBottom, 220 0 $negativeHalfBottom, 220 $damHeight $negativeRight, 220 $damHeight $left, -220 $damHeight $left, -220 $damHeight $negativeRight ]

236
} color Color { color [ 0 1 0, 0.1 1 0.3, 0 1 0, 0 1 0, 0 1 0, 0.8 1 0 ] } coordIndex [ 0, 1, 2, 3, -1, 0, 3, 4, 5, -1, 3, 2, 7, 4, -1, 2, 1, 6, 7, -1, 0, 5, 6, 1, -1, 4, 7, 6, 5, -1 ] colorPerVertex FALSE solid TRUE normalIndex [ ] texCoordIndex [ ] } } ] translation 420 0 -300 } endfile close(INFO);

237
Appendix H: ASP Script with SQL Statements
<%@Language="VBSCRIPT" %> <% Option Explicit Response.Buffer = true Dim curUserID, curPassword Dim Connect,onAccount,onGroup,SQL,SQL1,StartTime,logSQL Dim teamID, cookieFlag, groupID ' if cookieFlag = 1, we use Personal web server, 'otherwise, cookieFlag = 0 cookieFlag = 0 teamID = Request.Form("teamID") groupID = Request.cookies("groupID") Set Connect = Server.CreateObject("ADODB.Connection") Connect.Open "DSN=vcity","sa","" StartTime = CStr(Now) IF groupID = "" Then Response.Redirect("../error/group_id_error.htm") End if IF teamID="" Then curUserID = Request.Form("userID") curPassword = Request.Form("password") '************************ 'check if the password and userID is correct '************************ Set onAccount = server.CreateObject("ADODB.Recordset") 'Guest can log in any group IF curUserID <> "guest" then SQL = "select * from userAccount where userID = '"&curUserID&_ "'"&" and password ='"&curPassword&"'"&" and groupID = '"&groupID&"';" ELSE SQL = "select * from userAccount where userID = '"&curUserID&_ "'"&" and password ='"&curPassword&"';" END IF onAccount.Open SQL,Connect If onAccount.BOF=true Then Response.Redirect("../error/id_error.htm")

238
'Response.write(curUserID) 'Response.write(curPassword) Else Response.Cookies("dir") = Request.Form("userID") If cookieFlag =1 Then Response.Cookies("dir").Expires = #12/30/2001# End If logSQL = "insert into sessionLogInfo(eventDateTime,eventType,"_ &"userAccountID,sessionID,userIPAddress,numberOfHits,userAgent) values('"_ &startTime&"',"_ &"'New Session',"_ &"'"&curUserID&"',"_ &session.sessionID&","_ &"'"&Request.ServerVariables("REMOTE_ADDR")&"',"_ &"0"&","_ &"'"&Request.ServerVariables("HTTP_USER-Agent")&"')" Response.write(logSQL) insertDatabase(logSQL) Session.Contents("AccountID")=curUserID Response.Redirect("checkCookie.asp") End if Else curUserID = Request.Form("individualID") curPassword = Request.Form("gpassword") IF curUserID <> "guest" THEN SQL = "select * from userAccount where userID = '"&curUserID&_ "'"&" and password ='"&curPassword&"'"&" and groupID = '"&groupID&"';" ELSE SQL = "select * from userAccount where userID = '"&curUserID&_ "'"&" and password ='"&curPassword&"';" END IF Set onAccount = Connect.Execute(SQL) 'We should check if the user has already registered in one group city SQL1= "select * from teamMembers where teamID = '"&teamID&_ "'"&" and memberID ='"&curUserID&"';" Set onGroup = Connect.Execute(SQL1) If onAccount.BOF = true or onGroup.BOF=true Then

239
Response.Redirect("../error/id_error.htm") Else Response.Cookies("dir") = Request.Form("teamID") Response.Cookies("teamMember") =Request.Form("individualID") If cookieFlag =1 then Response.Cookies("dir").Expires = #12/30/2001# Response.Cookies("teamMember").Expires = #12/30/2001# End If logSQL = "insert into sessionLogInfo(eventDateTime,eventType,"_ &"userAccountID,sessionID,userIPAddress,numberOfHits,userAgent) values('"_ &startTime&"',"_ &"'New Session',"_ &"'"&curUserID&"',"_ &session.sessionID&","_ &"'"&Request.ServerVariables("REMOTE_ADDR")&"',"_ &"0"&","_ &"'"&Request.ServerVariables("HTTP_USER-Agent")&"')" Session.Contents("AccountID")=curUserID insertDatabase(logSQL) Response.Redirect("checkCookie.asp") End If End If '************************ 'Set the value of the cookie and check if ' the user supports cookies '************************ ' Set the log information into the database '*********************** '****************** write to the database functions Sub insertDatabase(SQL) Dim Connect Set Connect = Server.CreateObject("ADODB.Connection") Connect.Open "DSN=vcity","sa","" Connect.Execute(SQL) Connect.Close Set Connect = Nothing End Sub %>

240
Appendix I: Homework Assignment of the Third Survey
AME 4193 Spring 2001 Homework assignment
Assigned: Thursday, April 19, 2001 Due: 9:00a.m., Tuesday, May 1, 2001
Requirements: Each group only needs to submit one copy of homework. Each member should submit a copy of the individual surveying form. Group members must work jointly on the homework.
Design a beam with minimum weight using the geometrical modeling module and the engineering analysis module. Material is steel, and its properties are: 629.0 10E psi= × , 0.32v = , unit weight = 30.284 /lb in , yield stress =
336 10 psi× and safety factor = 1.5. The length of the beam, boundary condition, and forces are as follows. 1 1000 /q lb in= − , 2 1500 /q lb in= − .
100
10 20 2020
q1q2
′′ ′′ ′′ ′′
′′
(a) Design a rectangular cross section of the above beam with minimum weight subject to stress using the geometric modeling module.
(b) Conduct FEA using the engineering analysis module and make sure the maximum von Mises stress is less than the allowable stress. Use tetra element and brick element with coarse meshing.
(c) Use tetra element and brick element with fine meshing. (d) Try at least three cross sections and obtain the best valid cross section.
Please note the pressure is used in engineering analysis module. Therefore 1 2q and q should be converted into the pressure.
Qiuli Sun’s office is Room 235, Felgar Hall. He will be available most of the time. Also, he will be in the CAD lab on April 29, 30 from 8:00pm to 11:30pm to help you use his Virtual City.
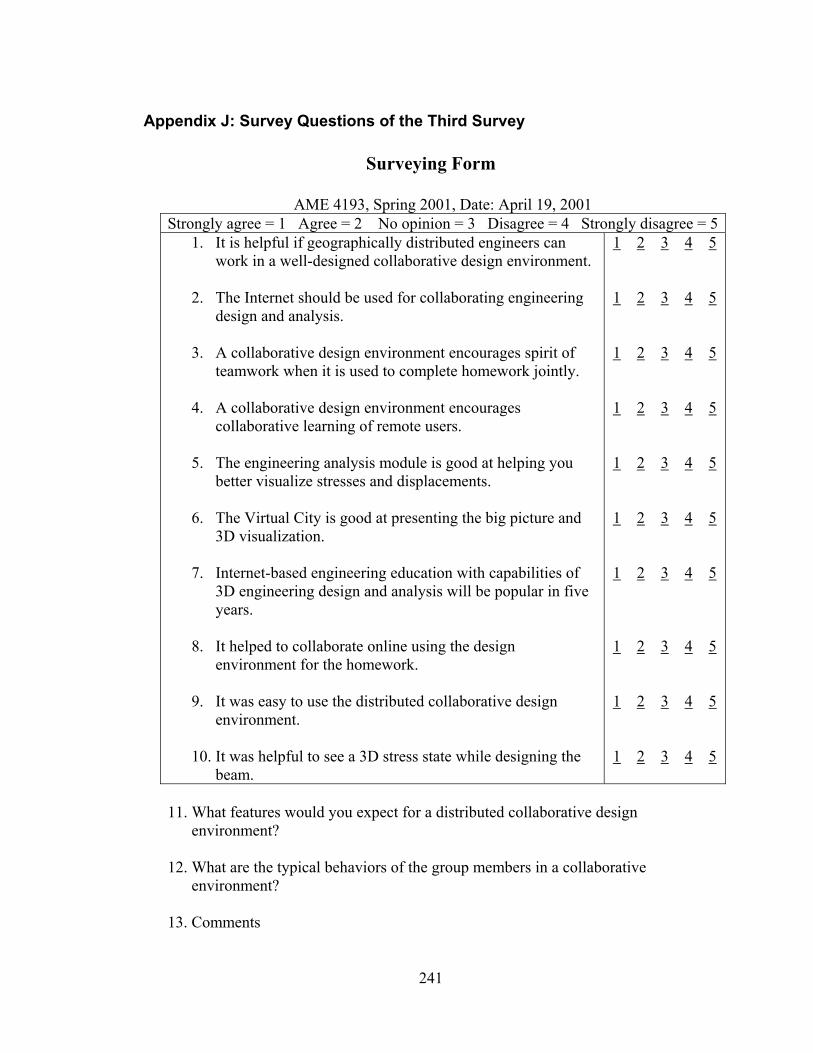
241
Appendix J: Survey Questions of the Third Survey
Surveying Form
AME 4193, Spring 2001, Date: April 19, 2001 Strongly agree = 1 Agree = 2 No opinion = 3 Disagree = 4 Strongly disagree = 5
1. It is helpful if geographically distributed engineers can work in a well-designed collaborative design environment.
2. The Internet should be used for collaborating engineering design and analysis.
3. A collaborative design environment encourages spirit of teamwork when it is used to complete homework jointly.
4. A collaborative design environment encourages collaborative learning of remote users.
5. The engineering analysis module is good at helping you better visualize stresses and displacements.
6. The Virtual City is good at presenting the big picture and 3D visualization.
7. Internet-based engineering education with capabilities of 3D engineering design and analysis will be popular in five years.
8. It helped to collaborate online using the design environment for the homework.
9. It was easy to use the distributed collaborative design
environment.
10. It was helpful to see a 3D stress state while designing the beam.
1 2 3 4 5
1 2 3 4 5
1 2 3 4 5
1 2 3 4 5
1 2 3 4 5
1 2 3 4 5
1 2 3 4 5
1 2 3 4 5 1 2 3 4 5
1 2 3 4 5
11. What features would you expect for a distributed collaborative design
environment?
12. What are the typical behaviors of the group members in a collaborative environment?
13. Comments

242
Appendix K: Opinions about the Implemented Technologies
Multiple Internet technologies were used to conduct the research of the Virtual
City, including HTML, JavaScript, Shockwave, VRML, Java, Java 3D, ASP, SQL, Perl,
and MS SQL Server. These technologies can be grouped into client-side and server-side
technologies. They have different advantages and limitations. With the introduction of
new technologies and the change of the technological trends, initial choices may not be
the best anymore.
The client-side technologies contains HTML, JavaScript, Shockwave, VRML,
Java, Java 3D. HTML is good at formatting texts, and its quality is acceptable. However,
it is difficult to use HTML to display complex mathematical equations. Pixel-based
images are therefore utilized to display these equations, but it particularly difficult to edit
them. In the future research, Extensible Markup Language (XML) may be considered.
JavaScript is useful to add client-side interactivity to HTML pages. For example, a
number of pieces of information can be contained in a cookie, and the cookie allows
information to be transferred from one page to another. But, this strategy will not work if
the user disables the cookie in the browser. In this case, server-side strategies may be
more appropriate. VRML was popular to demo 3D objects over the Internet, and its text-
based file is easy to understand. Few companies, however, are pushing this technology
currently. Hence, it becomes more and more difficult to find the updated plug-in for
VRML. Shockwave can be utilized to program graphic-oriented simulations. It is easy to
learn and there is no plug-in issue since the plug-in can be downloaded automatically
with the permission of the user. It has a built-in scripting language called Lingo, but it is
a challenge to program large complex applications with Lingo since it is not a structured

243
general-purpose programming language. Java is a powerful object-oriented general-
purpose programming language. Its networking capabilities make it a good choice for
collaborative applications. Microsoft has, however, stopped to support Java, and a Java
plug-in is necessary for Web-based Java applets. Also, if extensions of Java are used, the
user needs to download these extensions separately. This is extremely inconvenient for
the user.
The server-side technologies include ASP, SQL, Perl, and MS SQL Server. ASP
is a Microsoft solution to the server-side interactivity. It works seamlessly with Microsoft
Internet Information Server (MS IIS). The biggest concern with MS IIS is its security
since numerous viruses are currently attacking MS IIS. Perl is a free scripting language to
add the server-side interactivity. It can work with any operating systems, such as
Windows, Unix, and Macintosh. One problem with Perl is that it may need some skills to
make it work on the server. SQL is a friendly query language, and it is an international
standard. It can work smoothly with ASP and Perl to access the database. It is a good
choice to employ SQL to manipulate the database. MS SQL Server is a medium-side
relational database, which can store a larger amount of data than Access. But, it is more
difficult to manage the data in MS SQL Server than in Access.
Since each technologies takes time to learn, if similar concepts need to implement
again it may be wise to use only HTML, JavaScript, Shockwave, ASP, SQL, and MS
SQL Server. This is because the latest version of Shockwave has already supported 3D
and there is no need to utilize VRML, Java, and Java 3D to implement 3D visualization.
ASP can perform the same function as Perl so that the user does not need to learn Perl.