internet addressing and the rir system (part 2) 12 february 2004 phnom penh, cambodia paul wilson,...
TRANSCRIPT

Internet Addressing andthe RIR system (part 2)
12 February 2004
Phnom Penh, Cambodia
Paul Wilson, APNIC

Overview – Part 2
• Allocation statistics – Asia Pacific Internet Resource statistics– Global Internet Resource statistics– IPv4 lifetime expectation
• More on Addressing policy– How to participate in open policy
processes

APNIC Internet Resource Allocation

Resource Allocation Statistics
• IP addresses mirror Internet growth– Represent deployed infrastructure– Distributed in consistent fashion– APNIC can provide objective, factual info
• Analysis of trends…– Allocation patterns per country over time– Comparison with other regions– Correlation of IP addresses with...
• Population, GDP, etc

IPv4 addresses allocated - annual
0
4
8
12
16
20
24
28
32
36
40
Pre-1996 1996 1997 1998 1999 2000 2001 2002 2003
Mill
ions
Other
TW
THSG
NZ
MY
KRJP
IN
ID
HKCN
AU

IPv4 addresses allocated - total
2002: 1.60
2001: 1.7
2000: 1.24
1999: 0.54
2003: 1.96
1998: 0.27
0
16
32
48
64
80
96
112
128
144
160
Jan-96 Jan-97 Jan-98 Jan-99 Jan-00 Jan-01 Jan-02 Jan-03 Jan-04
Mill
ions 222
221220219218211210203202061060

IPv4 distribution in Asia Pacific
SG1%
NZ1%
TH1%
TW7%
ID1%
KR19%
CN28%
JP32%
Other8%
Other1%
AU3%
HK3%
IN2%
MY1%

ASNs assigned - cumulative
2003: 358
2001: 449
2000: 634
1999: 342
2002: 614
0
500
1000
1500
2000
2500
3000
3500
Jan-96 Jan-97 Jan-98 Jan-99 Jan-00 Jan-01 Jan-02 Jan-03

ASN distribution in Asia Pacific
KR20%
JP19%
AU17%
HK8%
ID3%
IN3%
SG3%
MY1%
Other13%
Other3%
TH3%
PH3%
CN6%
TW5%
NZ4%
AP1% PK
1%

Global Internet Resource Statistics

IPv4 Address Space Status: /8
Total /8 blocks available: 256
92
16
91
16
16
2
11
12
0 10 20 30 40 50 60 70 80 90 100
Central Registry
Multicast
IANA Reserve
Experimental
ARIN
LACNIC
APNIC
RIPE NCC

IPv4 allocations from RIRs to LIRs/ISPs - Yearly comparison
0.00
0.50
1.00
1.50
2.00
2.50
1999 2000 2001 2002 2003
APNIC
ARIN
LACNIC
RIPE NCC

1 Jan 99 – 31 Dec 03
IPv4 allocations from RIRs to LIRs/ISPs - Cumulative total
RIPE NCC6.82 31%
APNIC7.24 33%
LACNIC0.342%
ARIN7.89 34%

ASN assignments from RIRs to LIRs/ISPs - Yearly comparison
0
500
1,000
1,500
2,000
2,500
3,000
1999 2000 2001 2002 2003
APNIC
ARIN
LACNIC
RIPE NCC

1 Jan 99 – 31 Dec 03
ASN assignments from RIRs to LIRs/ISPs - Cumulative total
ARIN10388 54%
RIPE NCC 563630%
LACNIC5403%
APNIC2371 13%

IPv6 allocations from RIRs to LIRs/ISPs - Yearly comparison
0
20
40
60
80
100
120
140
160
1999 2000 2001 2002 2003
APNICARINLACNICRIPE NCC

IPv6 allocations from RIRs to LIRs/ISPs - Cumulative total
1 Jan 99 – 31 Dec 03
RIPE NCC27956%
ARIN84
16%
LACNIC143% APNIC
12825%

IPv4 Address Lifetime Expectancy
- Are we running out of IPv4 addresses?
Research activityconducted by Geoff Huston
and supported by APNIC

Are We Running Out of IPv4?
• Recent media reports claiming we are running out of IP addresses– Some claim we’ve already run out in some parts
of the world
• But what are the facts?– Is the IPv4 sky falling?
• Geoff Huston, chief scientist in the Internet area at Telstra, has studied the IPv4 consumption rates
http://www.potaroo.net/ispcolumn/2003-07-v4-address-lifetime/ale.pdf

Data Analysed
• Three views to make forward projections:– The rate at which IPv4 number blocks
are passed from IANA to the RIRs– The rate at which RIRs undertake
assignments of IPv4 address blocks to LIRs and end users
– The growth of the number of announced addresses in the BGP routing table

Address Management Process
RIR
ISPA
lloca
tion
ISP
BGP
Ann
ounc
emen
t
IETF
IANA
Del
egat
ion
IANA
RIR
Allo
catio
n

IETF Reserved, 20.1, 8%
Multicast, 16, 6%
IANA Pool, 89, 35%
IANA Allocated, 130.9, 51%
IANA Allocations – Current

IANA Allocations – Historical
0
32
64
96
128
Jan-91 Jan-93 Jan-95 Jan-97 Jan-99 Jan-01 Jan-03

RIR Allocations – Current Status
IETF Reserved, 20.1, 8%
Multicast, 16, 6%
IANA Pool, 89, 35%
RIR Pool, 14, 5%
Assigned, 116.9, 46%Allocated

RIR Allocations – Historical
RIR Assigned IPv4 /8 Address Blocks
0
20
40
60
80
100
120
Jan-83 Jan-85 Jan-87 Jan-89 Jan-91 Jan-93 Jan-95 Jan-97 Jan-99 Jan-01 Jan-03

BGP Routing Table – Current
IETF Reserved, 20.1, 8%
Multicast, 16, 6%
IANA Pool, 89, 35%
RIR Pool, 14, 5%
Assigned, 42.4, 17%
Advertised, 74.5, 29%

BGP Routing Table - AS1221

Another look at that BGP data…Linear Squares Best Fit
58
60
62
64
66
68
70
72
74
Nov-99 Feb-00 May-00 Aug-00 Nov-00 Feb-01 May-01 Aug-01 Nov-01 Feb-02 May-02 Aug-02 Nov-02 Feb-03 May-03 Aug-03

Combined Data (3 years)
0
20
40
60
80
100
120
140
Dec-99 Mar-00 Jun-00 Sep-00 Dec-00 Mar-01 Jun-01 Sep-01 Dec-01 Mar-02 Jun-02 Sep-02 Dec-02 Mar-03 Jun-03
IANARIRBGP

Projection – linear
2047
2031 2037
0
32
64
96
128
160
192
224
Jan-00 Jan-05 Jan-10 Jan-15 Jan-20 Jan-25 Jan-30 Jan-35 Jan-40 Jan-45
IANA
RIR
BGP
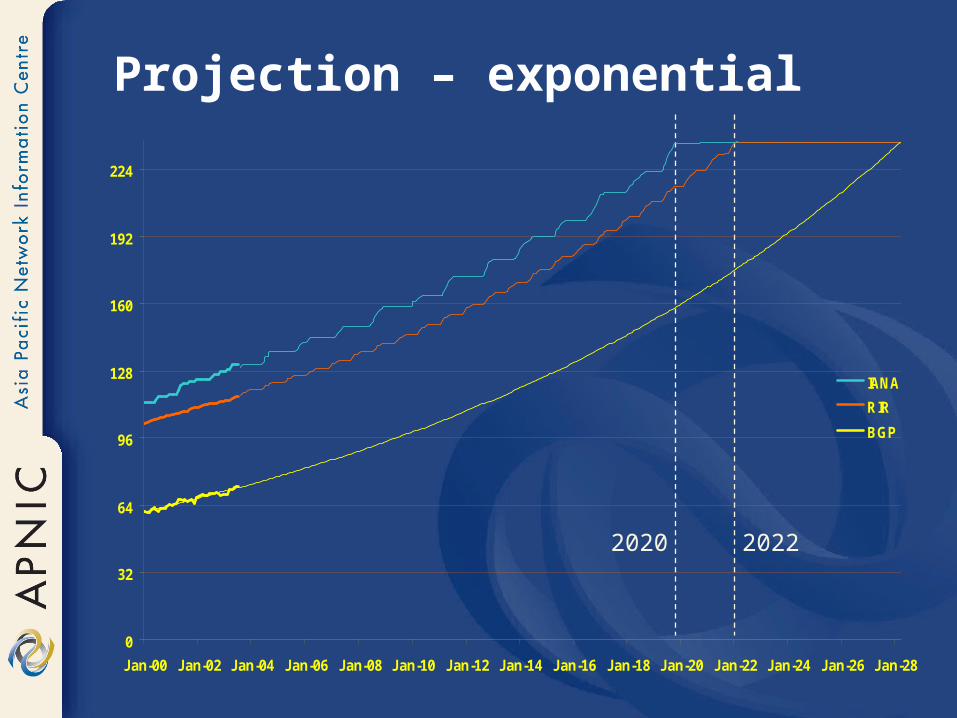
Projection – exponential
2020 2022
0
32
64
96
128
160
192
224
Jan-00 Jan-02 Jan-04 Jan-06 Jan-08 Jan-10 Jan-12 Jan-14 Jan-16 Jan-18 Jan-20 Jan-22 Jan-24 Jan-26 Jan-28
IANA
RIR
BGP

Observations
• Extrapolation of current allocation practices and BGP-based demand model
• Derived from 2000-2003 data• Considering
– IANA/RIR unallocated pool– Total address space including allocated but
unannounced
• Assuming exponential growth– Address space lasts until 2025, or up to 2029
• Assuming linear growth– Address space lasts until 2037 - 2047

Issues
• This is just a model - reality will be different!• Will the BGP routing table continue to
reflect allocation rates? • Is the model of the unadvertised pools and
RIR holding pools appropriate?• Externalities…
– What are the underlying growth drivers (applications) and how are these best modeled?
– What forms of disruptive events would alter this model, and to what extent?
– Should address management policies change as a result of these results?

Questions ?

Policy Development in the Asia Pacific
The APNIC Community
&
the Policy Development Process

What is the APNIC community?
Global Internet Community
APNIC Internet Community
IETF
ISOC
Individuals
APNIC Members
APAN PITA
ISP Associations

Policy Development
• Industry self-regulatory processes– Open to all interested parties– Facilitated by RIR staff and volunteers
• Policy implementation– RIR processes– ISPs and other affected parties

Participation in policy processes
• Why should I bother?– Responsibility as an APNIC member
• To be aware of the current policies for managing address space allocated to you
– Business reasons• Policies affect your business operating
environment and are constantly changing• Ensure your ‘needs’ are met
– Educational• Learn and share experiences• Stay abreast with ‘best practices’ in the
Internet

Policy development cycle
OPEN
TRANSPARENT‘BOTTOM UP’
Anyone can participate
All decisions & policies documented & freely available to anyone
Internet community proposes and approves policy
Need
DiscussEvaluate
Implement Consensus

Elements of the process
MemberMeeting
Working Groups
Birds of a Feather
Special InterestGroups
Open Policy Processes
SIGs: Formal groups which discuss broad areas of policy relevant to the APNIC internet community BOFs: Informal meetings to
exchange ideas eg. CA BOF, Network Abuse BOF, Training Need to hold at least one to form new SIG
WGs: semi formal, volunteer group tasked by a SIG to work on a particular project until completed eg. ‘Broadband’
MM: forum specific to APNIC business eg. fee structure, election of executive council & endorsement of policy decisions

Policy development in practice
New policy or amendment proposed
Endorsement by MM?
Report of consensus in SIG to MM
Consensus?
Implementation 3 months
Posted to SIG ML for discussion
Face to face discussions in public open forum (SIGs)
YES
YES
NO
NO

How to make your voice heard
• Contribute on the public mailing lists– http://www.apnic.net/community/lists
• Attend meetings– Or send a representative– Gather input at forums
• Give feedback– Training or seminar events

Come to the APNIC meeting!
Next meeting in conjunction with
APRICOT 2004Kuala Lumpur, Malaysia, 18-27 February 2004
• Participate in policy development• Attend workshops, tutorials & presentations• Exchange knowledge and information with peers• Stay abreast with developments in the Internet• View multicast online• Provide your input in matters important to you
http://www.apnic.net/meetings/

Questions ?
