internationalization and stock market liquidity⋆ - researchgate
TRANSCRIPT

Review of Finance (2006) 10: 1–35 © Springer 2005
Internationalization and Stock Market Liquidity �
ROSS LEVINE1 and SERGIO L. SCHMUKLER2
1Brown University and the NBER; 2World Bank
Abstract. What is the impact of internationalization (firms raising capital and trading in internationalmarkets) on the liquidity of the remaining firms in domestic markets? To address this question, weassemble a panel database of nearly 2,900 firms from 45 emerging economies over the period 1989–2000, constructed from annual and daily data. First, we find evidence of migration. The domestictrading of firms that cross-list or issue depositary receipts in foreign public exchanges tends to de-crease, while a significant proportion of their trading activity concentrates in international markets.Second, this migration is negatively related to the liquidity of the remaining firms in their homemarket through two separate channels. There are liquidity spillovers within markets: Aggregatedomestic trading activity is positively associated with the liquidity of individual firms in the samemarket. Moreover, the proportion of trading abroad is negatively related to the liquidity of firms inthe domestic market.
1. Introduction
This paper analyzes the impact of firms from emerging economies that internation-alize by issuing depositary receipts, cross-listing, or raising capital in internationalequity markets on the liquidity of the remaining firms in the domestic stock market.Although an extensive literature finds that internationalization helps these “in-ternational firms,” researchers are only beginning to assess the ramifications ofinternationalization on “domestic firms,” those firms that do not internationalize.1
� The paper was revised while Schmukler was visiting the IMF Research Department. We thankTatiana Didier and Juan Carlos Gozzi Valdez for truly outstanding research assistance. We aregrateful to Franklin Allen and Marco Pagano for very useful and detailed comments. We also re-ceived very helpful suggestions from Gordon Alexander, Luca Benzoni, Stijn Claessens, Peter Henry,Eduardo Loyo, Ugo Panizza, Valery Polknichenko, Helene Rey, Michael Schill, Frank Warnock, twoanonymous referees, seminar participants at Dartmouth College, the Econometric Society Meetings(Chile), the NBER IASE Meeting in PUC-Rio (Brazil), the University of Minnesota, the Universityof Virginia (Darden School of Business), the University of Zurich, and the World Bank. For helpwith the data, we thank particularly Florencia Moizeszowicz and also Pamela Dottin, Monica Erpen,Dori Flanagan, Marina Halac, Angela Marshall, Konstantinos Tzioumis, Richard Webster-Smith, andCheryl Workman. Levine is grateful for generous financial support from the BSI Gamma Foundation.Schmukler thanks the World Bank Latin American Regional Studies Program and Research SupportBudget for ample financial support. The findings, interpretations, and conclusions expressed in thispaper are entirely those of the authors and do not necessarily represent the views of the World Bank.
1 Some examine the volume and liquidity of international firms in domestic markets, e.g., seeHargis (1998), Noronha et al. (1996), and Pulatkonak and Sofianos (1999). Others study the impact
2 ROSS LEVINE AND SERGIO L. SCHMUKLER
Similarly, although emerging market policymakers increasingly express concernsthat internationalization is hurting their domestic markets, surprisingly little re-search examines the impact of internationalization on domestic firms.2 To evaluatethe cross-firm distributional effects of internationalization, we first examine therelation between internationalization and the trading of international firms by docu-menting what happens to a firm’s trading activity and location of this trading after itinternationalizes. We then study whether the trading activity of international firmsis associated with the liquidity of domestic firms. Specifically, we examine whetherthere are market externalities: Is aggregate trading activity related to the liquidityof individual firms trading in the same market? We also test whether the locationof trading activity of international firms affects the liquidity of domestic firms.
The literature provides conflicting predictions about the relation between in-ternationalization and the liquidity of domestic firms. Consider first the two-part“migration and spillover” mechanism. “Migration” means that internationalizationinduces a shift in the trading of international firms out of the domestic market andinto international financial centers. This may occur because international marketshave lower information and transaction costs (Chowdhry and Nanda, 1991; Lang etal., 2003), lower settlement risk (Velli, 1994), or more efficient risk pricing (Patro,2000). “Spillover” means that the aggregate trading in a market is related to theliquidity of individual equities. Using data from the U.S., Chordia et al. (2000),Hasbrouck and Seppi (2001), and Coughernour and Saad (2004) find that liquidityis not simply an asset specific attribute; rather, an individual asset’s liquidity co-moves with market liquidity. Beyond the possibility that common factors influencethe liquidity of all firms in a market, there might be spillovers, whereby aggregatemarket activity influences the liquidity of individual firms. Spillovers could occurbecause of fixed costs associated with operating a market, like running brokeragefirms and clearing and settling transactions. With spillovers, therefore, the migra-tion of trading of international firms could increase the per-trade cost of domesticstock transactions and reduce the liquidity of domestic firms. Combined, migra-tion and spillovers imply that cross-listing or issuing depositary receipts in publicinternational stock markets hurts the liquidity of domestic firms.
The internationalization process might affect domestic markets beyond themigration-spillover channel. If it is more desirable to trade securities in majorinternational financial centers and if investors are concerned about country-specificrisk, then as some firms from a country internationalize, investors will shift their
of internationalization on stock prices, e.g., see Alexander et al. (1988), Foerster and Karolyi (1999),and Miller (1999). Still others analyze asset size, growth, financing constraints, and the capital struc-ture of firms, e.g., see Pagano et al. (2002), and Schmukler and Vesperoni (2006). See Karolyi (2006)for a review.
2 For concerns that local markets are becoming illiquid due to internationalization, see Bovespa,(1996), Federation des Bourses de Valeurs (2000), Financial Times (1998), Latin Finance (1999,2004) and The Economist (2000). To overcome the illiquidity of domestic markets, policymakersare trying to come up with new solutions, like the creation of Novo Mercado in Brazil or theestablishment of regional stock exchanges. See World Bank (2004).

INTERNATIONALIZATION AND STOCK MARKET LIQUIDITY 3
trading of that country’s risk (as embodied in both international and domesticfirms) out of domestic firms and into international firms in the international market.Indeed, there is evidence that U.S. investors prefer ADR over non-ADR stocks.3
The resultant shift in investor interest from domestic to international firms couldhurt the liquidity of domestic firms beyond the effect through the reduction inthe domestic trading of international firms. At the firm level, internationalizationmight signal firm quality, which provides an additional mechanism linking inter-nationalization with a drop in domestic firm liquidity (Stulz, 1999). For example,internationalization might allow corporations to alleviate agency and informationalasymmetry problems by “bonding” themselves into markets with greater disclosurerequirements and stronger shareholder protection systems (Doidge et al., 2004;Gozzi et al., 2005; Reese and Weisbach, 2002; Siegel, 2005). Or, internationaliz-ation might reduce firms’ cost of capital, by allowing them to overcome barriersbetween markets. From this perspective, internationalization provides a signalabout firm quality, as the market is better able to distinguish “good” from “bad”firms (those that do not internationalize).4 By signaling firm quality, therefore,internationalization could hurt domestic firm liquidity.
Other papers, however, question the negative effects of internationalizationon domestic liquidity. Hargis (2000) argues that cross-listings can transform asegmented equity market with low liquidity into an integrated market with hightrading activity and liquidity. Alexander et al. (1987) and Domowitz et al. (1998)hold that internationalization stimulates domestic trading of international firmsby increasing market integration. Moreover, Halling et al. (2005) argue that for-eign trading of cross-listed European firms declines after an initial increase, withliquidity returning to the domestic market (the “flow-back” effect). Also, if inter-nationalization improves transparency, this could increase the domestic trading ofinternational firms with positive spillover effects for the rest of the domestic market(Hargis and Ramanlal, 1998). It is also legitimate to question whether the find-ing of spillovers in the U.S. market generalizes to emerging stock exchanges andwhether investors indeed prefer international to domestic firms. Thus, the linkagesbetween internationalization and domestic market liquidity remain open empiricalquestions.
To study the effects of internationalization, we assemble liquidity and tradingindicators on nearly 2,900 firms from across 45 emerging market countries, cov-ering the period 1989–2000. To measure trading activity, we use yearly turnover,which equals the value of a firm’s transactions in a market divided by the firm’smarket capitalization. Turnover, and similar trade-based indicators, are frequentlyused to proxy for liquidity since (i) many countries do not have bid-ask spread
3 See, Aggarwal et al. (2005), Bradshaw et al. (2004), and Edison and Warnock (2004).4 Cantale (1996) and Fuerst (1998) present models with information asymmetry and establish a
signaling equilibrium in which firms with better prospects are able to distinguish themselves fromfirms with lower future profitability by cross-listing in markets with stricter regulatory environments.

4 ROSS LEVINE AND SERGIO L. SCHMUKLER
information (especially time series data),5 (ii) it is difficult to collect the dailydata for such a large panel of firms and countries, and (iii) past research identifiesa strong link between turnover and firm performance, industrial expansion, andnational growth.6 Nevertheless, since turnover does not directly measure tradingcosts or the price impact of transactions, we interpret turnover less as a precisemeasure of liquidity and more as a general index of trading activity.
We also compute two indicators of liquidity, which are constructed from dailydata. First, Amihud’s (2002) illiquidity index, which equals the ratio of a stock’sabsolute returns to its value traded. Hasbrouck (2005) finds that, within the classof price-impact liquidity estimates, Amihud’s (2002) illiquidity index is the mostreliable proxy of trading costs. Second, we compute the proportion of days in ayear when there are no changes in the price of a security. Since researchers haveused liquidity measures based on this zero-return index in recent studies (Lesmond,2005; Lesmond et al., 1999), we use it to further assess the relation betweeninternationalization and the liquidity of domestic firms.
The results are broadly consistent with migration. When a firm cross-lists orissues depositary receipts in a public international exchange (e.g., the New YorkStock Exchange, the London Stock Exchange, or NASDAQ), the domestic tradingof its shares does not rise; rather, trading tends to migrate out of the domesticmarket and into the international market. However, firms that raise capital abroadwithout providing an easy vehicle for having their shares traded internationally,tend to experience an increase, not a decrease, in domestic trading activity.7
Furthermore, an important fraction of the total trading activity of firms that interna-tionalize into a major public exchanges shifts abroad. On average, the percentageof trading in the domestic market falls to less that 60% after internationalization,with no significant flow-back effect in our sample.
5 Also, some research argues that turnover can be a better proxy for liquidity than bid-ask spreadsdue to problems with measuring spreads. From a theoretical perspective, Amihud and Mendelson(1986) and Stoll (1978a) suggest a direct link between trading costs and trading volume and holdingperiods, respectively. Empirically, Atkins and Dyl (1997) and Stoll (1978b) confirm these predic-tions. Petersen and Fialkowski (1994) demonstrate the problems with computing accurate bid-askspreads. Consequently, a large number papers use turnover and volume-based proxies of liquidity(e.g., Brennan et al., 1998; Datar et al., 1998; Haugen and Baker, 1996; Rouwenhorst, 1999).
6 In terms of theory, Levine (1991) models the link between trading activity and both firmand national growth. Empirically, Beck and Levine (2002, 2004), Demirguc-Kunt and Maksimovic(1998), and Levine and Zervos (1998a) demonstrate the importance of turnover for explaining firmperformance, industrial expansion, and economic growth.
7 For instance, firms that raise money through private placements in the U.S. by means of Rule144A can only trade among qualified institutional buyers on the PORTAL system. Firms that issueLevel I ADRs trade on the over-the-counter market (OTC), which is not an organized market orexchange, but rather a network of securities dealers. These markets tend to provide less liquidity thanpublic exchanges and therefore are less likely to generate migration of trading abroad. Therefore,we analyze these types of listings separately from cross-listings and capital raisings in major publicexchanges and confirm that they have different effects on the domestic trading of international firms.

INTERNATIONALIZATION AND STOCK MARKET LIQUIDITY 5
The results are also consistent with spillovers: An individual stock’s liquidity isclosely related to aggregate trading activity in its market. The aggregate domesticturnover of international firms is positively associated with the turnover of domesticfirms and negatively associated with both the Amihud and zero-return illiquidityindexes for domestic firms. Importantly, the positive relation between the liquidityof an individual domestic firm’s stock and the aggregate trading of internationalfirms in the domestic market holds when controlling for many time-varying coun-try traits, country dummy variables, firm-specific characteristics, and the tradingactivity of that country’s firms in international markets. Overall, the results areconsistent with the migration and spillover view. Consistent with migration, cross-listing and issuing depositary receipts are associated with a drop in the turnoverof international firms in their domestic markets and a shift of their trading abroad.Consistent with spillovers, the drop in the turnover of international firms in thedomestic market is associated with a drop in the liquidity of domestic firms.
Another important finding of the paper is that internationalization is negativelyassociated with the liquidity of domestic firms beyond the migration-spilloverchannel. The fraction of total trading of a country’s stocks (domestic and inter-national) occurring in international markets is strongly, negatively related to theliquidity of domestic firms. Thus, not only is there a close connection between theaggregate domestic trading of international firms and a domestic firm’s liquidity,but the share of trading occurring in international markets is independently andnegatively linked to the liquidity of domestic firms.
Our research has both political economy and market microstructure implica-tions. First, we find that international financial integration can have distributionalimplications. Firms that internationalize win: Internationalization boosts the totaltrading of international firms and they grow after internationalizing (Gozzi et al.,2005; Levine and Schmukler, 2003). But, domestic firms lose. The liquidity oftheir shares falls as other firms internationalize their trading activity. Thus, differentfirms are likely to have very different views about public policies related to interna-tionalization. For instance, if there are high fixed costs to internationalizing and acountry lowers legal barrier to internationalization, then its largest firms will tend tobenefit relative to smaller firms for which the fixed costs represent a comparativelylarge barrier. Second, we find evidence of spillovers in stock markets around theworld. This has potentially important implications for markets in an era of glob-alization. The prevalence of spillovers represents a powerful force encouragingliquidity to concentrate in a few major financial centers, domestically or abroad.
This paper’s assessment of the impact of internationalization on the turnoverand liquidity of domestic firms is related to a large literature on internationaliza-tion. First, research analyzes the impact of market integration on economic growthand investment (Bekaert et al., 2005; Henry, 2000; Levine and Zervos, 1998a, b).In this paper, we do not focus on financial integration broadly defined. Rather,we examine the impact of the decision of one set of firms to internationalize onthe liquidity of those firms that do not internationalize. Second, as noted above,

6 ROSS LEVINE AND SERGIO L. SCHMUKLER
an extensive literature studies the effects of internationalization on internationalfirms. Although we contribute to this work by assessing the connection betweeninternationalization and the trading activity of international firms using our newdatabase, the focus of our research is different. We concentrate on examining thelink between internationalization and domestic firms.
Our work builds on two aggregate assessments of financial integration. Moel(2001) and Karolyi (2004) find a negative association between the fraction of acountry’s stocks that issue American Depositary Receipts (ADRs) and domesticmarket turnover. Our research makes several contributions. First, we use firm-leveldata, follow firms through time, and examine what happens to firms when theyinternationalize. Second, by using daily data for each firm, we compute commonlyused proxies of liquidity and assess what happens to the liquidity of individualdomestic firms as other firms internationalize. Third, we disentangle some of thechannels through which internationalization can influence domestic stocks. Fourth,we substantially expand the country coverage. Our data cover 45 countries, whileKarolyi (2004) and Moel (2001) study 12 countries and 28 countries respectively.Fifth, besides examining firms that internationalize by issuing depositary receiptsin New York, we also examine (i) firms that issue depositary receipts in other coun-tries and (ii) firms that cross-list and/or raise capital in New York and other financialcenters. Sixth, we collect and incorporate time-varying data on the internationaltrading activities of international firms. This allows us to identify more confidentlythe independent link between internationalization and domestic firm liquidity.
The rest of the paper is organized as follows. Section 2 describes the data.Section 3 discusses the econometric methodology and presents the results. Section4 concludes.
2. Data
To assess the connection between internationalization and the liquidity of domesticstocks, we construct a novel dataset using (i) firm-level data on trading and liquidityin the domestic market, (ii) data on the international activity of firms, includ-ing stock trading in international markets and dates of cross-listings, depositaryreceipts issuances, and capital raisings in international equity markets, (iii) dataon firm attributes, and (iv) country-level data on turnover, macroeconomic, insti-tutional, and financial conditions. Since the data come from various sources, wematch the firm-level variables on domestic stock market trading and liquidity, thefirm-level balance sheet information, the data on the international equity marketactivities of each firm, and country-level characteristics.
As a measure of trading activity, which is also frequently used by researchersas a proxy for liquidity, we employ turnover, which equals a firm’s value tradeddivided by its market capitalization. The data come from the Standard & Poor’sEmerging Markets Data Base (EMDB), formerly collected by the InternationalFinance Corporation (IFC) of the World Bank. In cross-checking with country

INTERNATIONALIZATION AND STOCK MARKET LIQUIDITY 7
sources, the EMDB is very accurate. For Argentina, however, we discovered thatthe EMDB is inconsistent over time. Thus, unlike previous studies, we circumventthis problem by collecting the data directly from the Buenos Aires Stock Exchange.The EMDB provides data on domestic market capitalization and domestic valuetraded in current U.S. dollars by firm. Although the EMBD is one of the mostcomprehensive databases on firm-level trading of equities around the world, theEMDB focuses on emerging markets and does not include 100% of local firms(i.e., while varying by country, the EMDB typically covers about 70% of marketcapitalization). We have sufficient data to compute turnover for 2,875 firms.
We use daily data from Datastream to construct firm-level measures of annual li-quidity for a broad cross-section of more than 1,000 firms, across 31 countries, over12 years, totaling almost 1,600,000 firm-day observations. To measure firm-level li-quidity, we construct Amihud’s (2002) illiquidity index and the share of zero-returndays. Section 3 defines these two illiquidity variables. After constructing thesemeasures at a daily frequency, we aggregate and calculate the liquidity measureson a yearly basis to match the other data. We require that firms have a minimumof 50 daily observations within a year to compute the illiquidity measures. For theAmihud illiquidity ratio, we eliminate daily observations with absolute returns over50% (following Lesmond, 2005) and remove the top and bottom one percent of thedaily observations (before computing the yearly measure) to control for outliers. Incalculating these illiquidity measures, we only use firms with data on turnover fromthe EMDB to keep results comparable across tables. Since data on returns is moreeasily available than data on trading activity, the number of daily observations usedto compute the zero-return measure is significantly higher than that used to calcu-late Amihud’s illiquidity index, which requires information on value traded. We usenearly 1,600,000 daily observations to compute the zero-return measure and over1,050,000 daily observations to calculate Amihud’s illiquidity index. Despite thesedifferences, we were able to compute both annual liquidity measures for similarsamples in terms of firm and time-series coverage.
Regarding the international equity market activities of firms, we collect moredata than past studies to provide a more accurate categorization of the internation-alization process. While most papers focus only on the ADR market and ignoreinternationalization in equity markets beyond the U.S., we consider a much broaderarray of international equity markets. The data for identifying and dating eachfirm’s international activities come from different sources.
We start with data from the Bank of New York. Besides the bank’s standarddatabase (the Complete Depositary Receipt Directory) that contains informationon current depositary receipt activities, the Bank of New York gave us access totheir historical databases and reports on (i) depositary receipt program initiationdates, (ii) termination dates (if any), (iii) capital raisings, and (iv) trading activ-ity. We complement these data with information from JP Morgan and Citigroupon ADR program initiation dates. The use of these additional sources helps usto cross-check the data, obtain missing information, and correct reporting errors.

8 ROSS LEVINE AND SERGIO L. SCHMUKLER
These data form a comprehensive database on ADR and Global Depositary Receipt(GDR) programs. The historical data start in January 1956, but the vast majority ofprograms begins after 1980.
We augment this information on dating the initiation of international equitymarket activities with data from Euromoney, the London Stock Exchange (LSE),NASDAQ, and the New York Stock Exchange (NYSE). Euromoney provides thedates when firms raise equity capital in international markets, including cross-listings and issuance of global depositary receipts, which substantively enhancesthe accurate categorization of firms as international or domestic. The Euromoneydatabase covers 8,795 cross-border equity issuance and cross-listing operationsfrom 5,665 firms in 86 countries over the period January 1983 - April 2001. LSE,NASDAQ, and NYSE provide information on listing dates by foreign corporations.
Consistent with our objective of assembling a broad database on international-ization, we classify firms as international if they ever (i) issue depositary receipts,(ii) cross-list, or (iii) raise equity capital through private or public placementsabroad. In the time-series dimension, a firm becomes international from the firsttime it issues a depositary receipt, cross-lists, or raises capital abroad. If it then de-lists, it is considered domestic again. Cross-listings, depositary receipts, and capitalraisings on major public exchanges clearly involve ongoing trading of local firmsin foreign countries. However, private capital raisings or cross-listings on over-the-counter (OTC) markets are different because they do not provide firms withan easy vehicle for having their shares traded abroad. Thus, while the issuanceof depositary receipts and cross-listing on public exchanges may involve the twoeffects discussed in the Introduction (migration and spillovers), cross-listings onOTC markets and private capital raisings are less likely to generate migration.Therefore, we analyze these types of listings separately from cross-listings andcapital raisings in public exchanges and confirm that they have a different relationwith the domestic trading of international firms.
We use balance sheet information on each firm to control for firm-specificcharacteristics that may influence liquidity. For simplicity, in the results discussedbelow, we present the regressions controlling for firm size only, but the results arerobust to controlling for other firm traits, e.g., sales growth and industry dummyvariables. We obtain these data from the Worldscope database (Thomson FinancialCompany).
Regarding the country-level trading variables, we compute the aggregate do-mestic turnover of international and domestic firms from firm-level turnover data.Additionally, we compute the share of total trading taking place abroad. To meas-ure total domestic trading, we use aggregate country-level data on value tradeddomestically from the EMDB. To calculate trading abroad, we use data on ADRtrading. The dataset comes from the Bank of New York, providing the value tradedin U.S. dollars at the firm level. We then aggregate these data to obtain country-level measures. Data from the LSE and the Frankfurt Stock Exchange (FSE) onthe trading of depositary receipts and cross-listed firms are not available for our

INTERNATIONALIZATION AND STOCK MARKET LIQUIDITY 9
entire time span and, thus, are not included in our dataset. This underestimates theamount of trading abroad, but it is unlikely to systematically bias the results in anyparticular direction.
We include an assortment of country-level control variables. In particular, weuse gross domestic product (GDP) per capita as a measure of countries’ overalleconomic development. We also control for a country’s stock market developmentby including the aggregate market capitalization as a percentage of GDP. We alsoestimated all the regressions including the law and order index as an independentvariable to control for each country’s legal and institutional environment. The lawand order index rarely enters significantly because it is highly correlated with GDPper capita. Moreover, its inclusion does not affect any of the results reported below.Finally, since we analyze the impact of firms’ decisions to internationalize, it isimportant to control for the stock market openness. Therefore, we include two al-ternative measures of stock market liberalization. The first one is a dummy variablewhich equals one after a country liberalizes its stock market, and zero otherwise.The data for dating the liberalization of stock markets come two sources: Bekaertet al. (2005), who present official liberalization dates, and Vinhas de Souza (2005),who constructs an index of the extent of stock market liberalization for EasternEuropean countries. We combine these two sources to get the widest possiblecoverage. The second stock market liberalization variable comes from Edison andWarnock (2003) and measures the degree of market integration by estimating theavailability of a country’s equities to foreigners. Note that the two liberalizationvariables differ in terms of country coverage. The Edison and Warnock measurecovers 29 countries, while we have data to compute the stock market liberalizationdummy for 39 of the countries included in our sample. As a robustness test, weestimated all the regressions including only firms from those countries that havedata on both liberalization variables (27 countries) and obtained similar results.
The final dataset covers the period 1989 to 2000, with over 9,000 firm-yearobservations, from 45 emerging economies (as classified by the EMDB). To controlfor the effects of possible outliers and data entry errors, we eliminate year obser-vations when the dependent variable in a regression is more than three standarddeviations away from the country mean. Appendix Table I lists the countries in-cluded in the study and the number of domestic and international firms per countryused for the dependent variables and to compute the aggregate turnover measures.8
Appendix Table I also has summary statistics of the liquidity and trading variables.Appendix Table II provides additional information on the data sources.
8 The difference between the number of firms used in the regressions and that used to calculate theaggregate measures is explained by the availability of data on the firm-level characteristics includedin the regressions. Also, note that in the regressions of domestic firms we control for the average do-mestic turnover of firms that cross-listed or raised capital in major international exchanges, thereforethe number of international firms used to calculate the aggregate measure may be lower than the totalnumber of international firms.

10 ROSS LEVINE AND SERGIO L. SCHMUKLER
3. Methodology and Results
This section examines the mechanisms through which firms that access interna-tional equity markets may affect the liquidity of firms that do not internationalize.The first part of this analysis involves testing for migration. Does the trading ofa firm’s stock migrate from the domestic to the international market after it in-ternationalizes? Second, we test for how this migration might affect the liquidityof domestic firms. In particular, are the aggregate domestic trading activity of in-ternational firms and the share of trading abroad associated with the liquidity ofindividual stocks traded in the local market?
3.1. MIGRATION
3.1.1. Migration: Cross-listing and Issuing Depositary Receipts in PublicExchanges
We first examine what happens to the trading of a firm in the domestic market afterit cross-lists, issues a depositary receipt, or raises capital in an international publicexchange. That is, we examine only firms with a mechanism to have their shareseasily traded in a major international financial market. In this way, we restrictthe sample to firms for which substantial migration is feasible. We estimate thefollowing specification,
T Ij,c,t = φ × Aj,c,t + α × IDj,c,t + β × T D
c,t + γ × ST Ic,t + θ × Cc,t
+ δ1 × nc + δ2 × τt + εj,c,t . (1)
The regressions include country and year effects (nc and τt respectively), thoughthese are not reported in the tables. The regressions are estimated using Newey-West standard errors, reported in brackets. These standard errors are robust toheteroskedasticity and autocorrelation within firms. For robustness, the last columnin each table also reports results estimated using standard errors clustered at thefirm level.
T Ij,c,t is the logarithm of one plus the turnover ratio of international firm j from
country c in year t , where the turnover ratio equals the total value traded of firmj ’s stock during year t divided by firm j ’s market capitalization.9 The superscriptI designates that it is an international firm, which is a firm that issues a depositary
9 We use this transformation because the total value traded is sometimes zero. Out of a totalof more than 13,200 firm-year observations with data on turnover in our dataset, there are only273 observations with total value traded equal to zero. We estimated all the regressions excludingthose observations and obtained results similar to those reported below. Furthermore, the fact thatthe dependent variable is the logarithm of one plus turnover constrains the dependent variable to bealways positive. This makes the errors non-normal by construction since the dependent variable cannever be negative. To make sure that the results are not affected by this transformation, we re-ranall the regressions in the paper where the dependent variable is the log (1 + x) using x instead, andobtained the same conclusions.

INTERNATIONALIZATION AND STOCK MARKET LIQUIDITY 11
receipt, cross-lists, or raises capital abroad at some point in the sample. As noted,we further restrict the sample in Table I to firms that cross-list or issue depositaryreceipts in public exchanges.
Aj,c,t equals the logarithm of the total assets (in U.S. dollars) of firm j fromcountry c in year t . Since research suggests that large, liquid firms tend to in-ternationalize and since we want to capture the independent relation betweeninternationalization and local activity, we control for firm size.
IDj,c,t is a dummy variable that equals zero if firm j from country c during yeart has not yet internationalized. It equals one in the year the firm internationalizesand remains one thereafter unless the firm de-lists or ends its depositary receiptprogram. In defining the internationalization dummy, we use the firm’s first inter-nationalization activity. Thus, if a firm first issues a private placement abroad andlater cross-lists in an international public exchange, this firm is not included in theTable I regressions. If the estimated coefficient on IDj,c,t is negative (i.e., if α < 0),then this indicates that when a firm internationalizes its turnover in the local markettends to fall.
T Dc,t is the logarithm of one plus the average turnover of domestic firms in coun-
try c during year t . Since we are testing whether the domestic trading activity ofinternational firms changes when a firm internationalizes, we include the tradingactivity of other firms in the domestic market to control for the myriad of factorsshaping aggregate domestic trading activity. This helps identify the connectionbetween a firm’s decision to internationalize and its domestic trading activity. Fur-thermore, including the average turnover of domestic firms provides informationon the relation between the domestic activity of an individual firm, T I
j,c,t , and ag-gregate market activity. In particular, a positive coefficient on the average turnoverof domestic firms indicates that an individual firm’s domestic trading activity ispositively associated with aggregate trading in the market.
ST Ic,t equals the logarithm of one plus the value traded abroad of country c’s in-
ternational firms in year t divided by the total value traded in all markets of countryc’s international and domestic firms in year t . Including this variable provides anestimate of the relation between the degree to which a country’s firms are tradedabroad and the domestic trading of a firm’s shares. This also provides greater powerin assessing the independent relation between a firm’s decision to internationalizeand the trading of its shares on the local market.
Cc,t is a set of time-varying country characteristics. We include two alternativemeasures of the openness of each country’s stock exchanges. The stock market lib-eralization dummy equals zero before a country liberalizes and one after a countryformally allows foreign investors to invest in domestic equities. The Edison andWarnock (2003) liberalization measure is the ratio of the market capitalization ofthe S&P/IFC Investable Index over the total market capitalization of each coun-try.10 This index provides a quantitative measure of the availability of the country’s
10 Edison and Warnock (2003) calculate a smoothed measure that takes into account asymmetricshocks to investable and non-investable stocks, which would lead to changes in the ratio of market

12 ROSS LEVINE AND SERGIO L. SCHMUKLER
Tabl
eI.
Dom
esti
ctr
adin
gac
tivit
yof
inte
rnat
iona
lfirm
s:Pu
blic
lyli
sted
firm
s
The
depe
nden
tva
riab
leis
the
loga
rith
mof
one
plus
the
turn
over
rati
oin
dom
esti
cm
arke
tsof
firm
sth
atin
tern
atio
nali
zeby
allo
win
gth
eir
shar
esto
betr
aded
ona
maj
orin
tern
atio
nal
exch
ange
.T
hein
tern
atio
nali
zati
onda
tere
pres
ents
the
date
ofth
eir
firs
tin
tern
atio
nal
activ
ity.
The
inte
rnat
iona
liza
tion
dum
my
(ID
j,c
,t)e
qual
son
eon
and
afte
rthe
year
whe
na
firm
beco
mes
inte
rnat
iona
land
zero
othe
rwis
e(i
tbec
omes
zero
ifa
firm
isde
list
ed).
The
regr
essi
ons
incl
ude
coun
try
and
year
dum
mie
s,th
ough
they
are
notr
epor
ted
inth
eta
ble.
Sta
ndar
der
rors
are
inbr
acke
ts.C
olum
ns(1
)to
(5)
repo
rtN
ewey
-Wes
tsta
ndar
der
rors
,whi
char
ero
bust
tohe
tero
sked
asti
city
and
auto
corr
elat
ion
wit
hin
firm
s.C
olum
n(6
)re
port
sst
anda
rder
rors
adju
sted
for
clus
teri
ngat
the
firm
leve
l.*,
**,*
**m
ean
sign
ifica
nce
atte
n,fiv
e,an
don
epe
rcen
t,re
spec
tivel
y.T
hees
tim
ated
equa
tion
isth
efo
llow
ing:
TI j,c
,t=
φ×
Aj,c
,t+
α×
IDj,c
,t+
β×
TD c,t
+γ
×ST
I c,t
+θ
×C
c,t
+δ 1
×nc
+δ 2
×τ t
+εj,c
,t.
Dep
ende
ntV
aria
ble:
Log
(1+
Dom
estic
Tur
nove
r)(1
)(2
)(3
)(4
)(5
)(6
)
Log
ofTo
talA
sset
s j,c
,t−0
.012
−0.0
08−0
.004
−0.0
07−0
.004
−0.0
04[0
.008
][0
.008
][0
.007
][0
.008
][0
.007
][0
.010
]In
tern
atio
naliz
atio
nD
umm
y j,c
,t−0
.053
**−0
.051
**−0
.056
**−0
.056
**−0
.061
**−0
.061
*[0
.025
][0
.025
][0
.025
][0
.026
][0
.025
][0
.033
]L
og(1
+A
vera
geT
urno
ver
ofD
omes
ticFi
rms)
c,t
0.42
3***
0.44
0***
0.43
2***
0.38
8***
0.43
4***
0.43
4***
[0.0
50]
[0.0
51]
[0.0
56]
[0.0
53]
[0.0
54]
[0.0
55]
Stoc
kM
arke
tLib
eral
izat
ion
Dum
my c
,t0.
006
0.00
5−0
.006
−0.0
06[0
.035
][0
.036
][0
.037
][0
.034
]L
ogof
(1+
Val
ueT
rade
dA
broa
d/To
tal
Val
ueT
rade
d)c,t
0.02
6−0
.058
0.01
10.
011
[0.0
97]
[0.1
08]
[0.0
98]
[0.0
97]
Stoc
kM
arke
tLib
eral
izat
ion
0.11
3*E
diso
nan
dW
arno
ck(2
003)
Mea
sure
c,t
[0.0
65]
Log
ofG
DP
per
capi
tac,t
0.00
80.
008
[0.0
54]
[0.0
62]
Mar
ketC
apita
lizat
ion/
GD
P c,t
0.12
5***
0.12
5***
[0.0
40]
[0.0
37]
Cou
ntry
Dum
mie
sY
esY
esY
esY
esY
esY
esY
ear
Dum
mie
sY
esY
esY
esY
esY
esY
esN
umbe
rof
Obs
erva
tions
1,51
61,
419
1,39
01,
385
1,39
01,
390
Num
ber
ofFi
rms
264
236
235
231
235
235
Num
ber
ofC
ount
ries
3632
3225
3232
R-s
quar
ed0.
510.
510.
480.
500.
480.
48

INTERNATIONALIZATION AND STOCK MARKET LIQUIDITY 13
equities to foreigners. We include these indicators in the analyses to control forthe possibility that national policies toward stock market liberalization will affectboth domestic trading activity and internationalization decision. We also controlfor the country’s level of economic and financial development as measured by GDPper capita and domestic stock market capitalization divided by the country’s GDP.Thus, we want to evaluate the relation between a firm’s decision to international-ize and its domestic trading activity while holding constant country and financialdevelopment.
The regressions reported in Table I and throughout the paper use unbalancedpanels. Since the sample of firms for which we have complete sets of dependentand independent variables varies considerably over time, using a balanced samplereduces the overall number of observations significantly. Also, note that withineach table the sample of firms varies across specifications, due to differences in thecoverage of the country-level variables used in the regressions. We also estimatedall the regressions holding the sample size constant across specifications and foundsimilar results.
Table I provides evidence broadly consistent with migration. More specifically,firms that cross-list or issue depositary receipts tend to experience a drop in do-mestic trading activity. Across the different specifications, the internationalizationdummy (IDj,c,t ) enters with a negative coefficient. It enters significantly at the fivepercent level when using Newey-West standard errors that are robust to hetero-skedasticity and autocorrelation at the firm level (regressions 1–5) and at the tenpercent level when using standard errors clustered at the firm level (regression 6).Critically, we find that a firm’s domestic trading activity falls after it cross-listsor issues a depositary receipt in an international public exchange even when con-trolling for aggregate trading activity in the domestic market, liberalization of thedomestic market, firm size, a number of country characteristics, as well as countryand year dummy variables. The size of the coefficient in regression 5 of Table Iindicates that the average firm experiences a fall of its domestic turnover of about17% after cross-listing or issuing a depositary receipt in an international publicexchange. To compute this, note that the dependent variable in these regressionsis the logarithm of one plus the domestic turnover of international firms. Since thecoefficient on the internationalization dummy is −0.06, the estimated relation in-dicates that internationalization is associated with a six percent drop in one plus thedomestic turnover of international firms. Given that the average domestic turnoverfor the sample of international firms included in regression 5 is 0.55, this impliesthat internationalization into a public stock exchange is associated with a drop of0.093 or 17% in the domestic turnover of the average firm.
Furthermore, Table I indicates a strong positive association between the averagelevel of trading activity by domestic firms in the market and the domestic turnover
capitalization. They convert this variable into a capital control measure by taking one less the adjustedratio. To be consistent with the stock market liberalization dummy, we converted their capital controlmeasure into a liberalization index by subtracting one from it.

14 ROSS LEVINE AND SERGIO L. SCHMUKLER
of the firm that internationalizes. Average turnover of domestic firms enters pos-itively and significantly in all of the regressions. This shows that the domestictrading activity of an individual firm is positively linked to aggregate trading inthe market even after controlling for country and year effects, many time-varyingcountry effects, as well as the size of the firm. The effect is also economicallyrelevant. The size of the coefficient in regression 5 of Table I indicates that anindividual international firm’s domestic turnover tends to rise by more than fivepercent when there is an increase in the average turnover of domestic firms of tenpercent. To see this, note that the coefficient in regression 5 in Table I indicatesthat a rise in one plus the average turnover of domestic firms of five percent isassociated with an increase in one plus the domestic turnover of international firmsof 2.2%. Given that the average turnover of domestic firms in these regressions is0.9, this means that an 11% increase in this variable leads to a 6.1% increase inthe domestic turnover of international firms, where the average domestic turnoverof international firms is about 0.55. After controlling for the internationalizationdummy and average turnover, however, the other variables add little explanatorypower. The only exceptions are the size of the stock market (market capitaliza-tion/GDP) and to a lower extent the Edison and Warnock (2003) liberalizationmeasure.11,12
3.1.2. Migration: Private Placements and Level I ADRs
As a robustness check, we examine firms that internationalize in a manner thatdoes not provide a mechanism for their shares to be easily traded on an interna-tional public exchange. Thus, if migration is driving the earlier results in Table I,we should not observe a negative coefficient on the internationalization dummy
11 To estimate whether the variables of interest explain the high R-squared reported in the table,we ran the regressions using only country and year dummies plus assets and compared this R-squared with those of the regressions in the table. In essence, we compute the partial R-squaredof the variables on which we are focusing the analysis. This provides a very conservative estimatebecause it overestimates the explanatory power of the country and year dummies. Specifically, noneof the relation between domestic trading of international firms and the components of the variablesof interest that are associated with the dummy variables and assets is assigned to the variables ofinterest. We find that the Internationalization Dummy and the average turnover of domestic firmsaccount for about 15% of the regression R-squared. Running the regressions only with the variablesof interest yields an R-squared of 0.38.
12 We also examined the degree to which the association between the domestic turnover of eachinternational firm and the average turnover of domestic firms arises from time-series or cross-sectional relations. We computed the within and between R-squared, where the within R-squaredis the R-squared of a regression in deviations from the mean and the between R-squared is the R-squared of a cross-sectional regression using the sample averages of the variables. We estimatedeach of these regressions excluding and including the average turnover of domestic firms, alwaysincluding the other variables in regression. The results indicate that the partial within R-squared ofthe average turnover of domestic firms is around 0.1 and the partial between R-squared is 0.35. Thus,the association between the domestic turnover of each international firm and the average turnover ofdomestic firms arises from both time-series and cross-sectional variation in the data.

INTERNATIONALIZATION AND STOCK MARKET LIQUIDITY 15
when examining this sub-sample of firms, for which migration is less likely. Morespecifically, we examine firms that internationalize (i) through private placementsin international markets or (ii) by cross-listing on the U.S. over-the-counter (OTC)market through Level I ADR programs. Level I ADRs are quoted on the PinkSheets Electronic Quotation Service and/or the OTC Bulletin Board for use bya network of security dealers that make markets in the particular securities. Thisarrangement is much more cumbersome and costly than trading on a major publicexchange. Similarly, while private placements under rule 144A in the U.S. aretraded on the electronic PORTAL system among qualified institutions, internation-alization in this manner does not provide a vehicle for firms to have their sharesas widely and inexpensively traded as in a major public stock market. For com-parison purposes, therefore, we examine this subset of firms for which migrationwill tend to be more difficult than for those that internationalize through cross-listing or issuing depositary receipts in a public exchange. As above, in definingthe date of internationalization, we use the firm’s first internationalization activity.In terms of estimation, we use the same specification and econometric techniquesas in Equation (1).
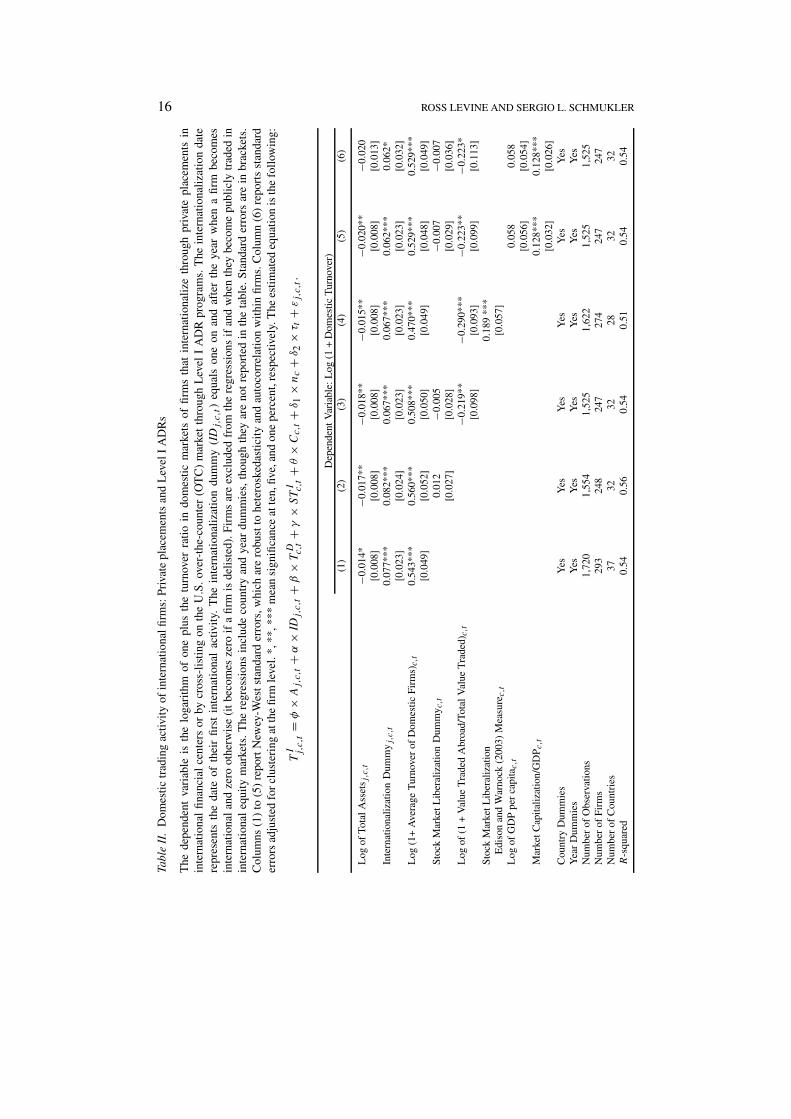
As shown in Table II, internationalization that does not provide a vehicle fortrading shares abroad on organized exchanges is not associated with a reduction inthe turnover of the firm’s shares in the local market. That is, the internationaliza-tion dummy does not enter negatively. Rather, we find that raising capital throughprivate placements abroad or cross-listing on the U.S. OTC market through LevelI ADRs tends to boost the trading of the firm’s shares in the domestic market.This positive effect is significant at the five percent level in regressions 1–5 and atthe ten percent level when using clustering at the firm level. This positive relationcould represent a signaling effect, as investors in emerging markets increase theirtrading of firms that access capital in major financial centers. Although we do notidentify the reasons underlying the positive relation between internationalizationand domestic turnover for these firms, this result highlights our early findings onmigration. When firms from emerging markets internationalize in a way that allowstheir shares to be traded abroad, they tend to experience a drop in trading activityin their own markets.
The Table II regressions suggest that the migration results are not driven byreverse causality, whereby firms internationalize to flee from deteriorating do-mestic markets. First, as already noted, we control for domestic market conditions.Second, the Table II regressions show that firms that internationalize withoutproviding a mechanism to have their shares traded in public markets abroad experi-ence an increase, not a decrease, in domestic trading activity, which runs counter tothe fleeing argument. Lastly, Claessens et al. (2005) show that firms from countrieswith good economic and institutional fundamentals are more likely to access andtrade in international capital markets, which also runs counter to the view that firmsfrom countries with poor local environments are the one that internationalize. Thus,
16 ROSS LEVINE AND SERGIO L. SCHMUKLER
Tabl
eII
.D
omes
tic
trad
ing
activ
ity
ofin
tern
atio
nalfi
rms:
Pri
vate
plac
emen
tsan
dL
evel
IA
DR
s
The
depe
nden
tva
riab
leis
the
loga
rith
mof
one
plus
the
turn
over
rati
oin
dom
esti
cm
arke
tsof
firm
sth
atin
tern
atio
nali
zeth
roug
hpr
ivat
epl
acem
ents
inin
tern
atio
nal
fina
ncia
lce
nter
sor
bycr
oss-
list
ing
onth
eU
.S.o
ver-
the-
coun
ter
(OT
C)
mar
ket
thro
ugh
Lev
elI
AD
Rpr
ogra
ms.
The
inte
rnat
iona
liza
tion
date
repr
esen
tsth
eda
teof
thei
rfi
rst
inte
rnat
iona
lac
tivit
y.T
hein
tern
atio
nali
zati
ondu
mm
y(I
Dj,c
,t)
equa
lson
eon
and
afte
rth
eye
arw
hen
afi
rmbe
com
esin
tern
atio
nal
and
zero
othe
rwis
e(i
tbec
omes
zero
ifa
firm
isde
list
ed).
Fir
ms
are
excl
uded
from
the
regr
essi
ons
ifan
dw
hen
they
beco
me
publ
icly
trad
edin
inte
rnat
iona
leq
uity
mar
kets
.The
regr
essi
ons
incl
ude
coun
try
and
year
dum
mie
s,th
ough
they
are
not
repo
rted
inth
eta
ble.
Sta
ndar
der
rors
are
inbr
acke
ts.
Col
umns
(1)
to(5
)re
port
New
ey-W
ests
tand
ard
erro
rs,w
hich
are
robu
stto
hete
rosk
edas
tici
tyan
dau
toco
rrel
atio
nw
ithi
nfi
rms.
Col
umn
(6)
repo
rts
stan
dard
erro
rsad
just
edfo
rcl
uste
ring
atth
efi
rmle
vel.
*,**
,***
mea
nsi
gnifi
canc
eat
ten,
five,
and
one
perc
ent,
resp
ectiv
ely.
The
esti
mat
edeq
uati
onis
the
foll
owin
g:
TI j,c
,t=
φ×
Aj,c
,t+
α×
IDj,c
,t+
β×
TD c,t
+γ
×ST
I c,t
+θ
×C
c,t
+δ 1
×nc
+δ 2
×τ t
+εj,c
,t.
Dep
ende
ntV
aria
ble:
Log
(1+
Dom
estic
Tur
nove
r)(1
)(2
)(3
)(4
)(5
)(6
)
Log
ofTo
talA
sset
s j,c
,t−0
.014
*−0
.017
**−0
.018
**−0
.015
**−0
.020
**−0
.020
[0.0
08]
[0.0
08]
[0.0
08]
[0.0
08]
[0.0
08]
[0.0
13]
Inte
rnat
iona
lizat
ion
Dum
my j
,c,t
0.07
7***
0.08
2***
0.06
7***
0.06
7***
0.06
2***
0.06
2*[0
.023
][0
.024
][0
.023
][0
.023
][0
.023
][0
.032
]L
og(1
+A
vera
geT
urno
ver
ofD
omes
ticFi
rms)
c,t
0.54
3***
0.56
0***
0.50
8***
0.47
0***
0.52
9***
0.52
9***
[0.0
49]
[0.0
52]
[0.0
50]
[0.0
49]
[0.0
48]
[0.0
49]
Stoc
kM
arke
tLib
eral
izat
ion
Dum
my c
,t0.
012
−0.0
05−0
.007
−0.0
07[0
.027
][0
.028
][0
.029
][0
.036
]L
ogof
(1+
Val
ueT
rade
dA
broa
d/To
tal
Val
ueT
rade
d)c,t
−0.2
19**
−0.2
90**
*−0
.223
**−0
.223
*[0
.098
][0
.093
][0
.099
][0
.113
]St
ock
Mar
ketL
iber
aliz
atio
n0.
189
***
Edi
son
and
War
nock
(200
3)M
easu
rec,t
[0.0
57]
Log
ofG
DP
per
capi
tac,t
0.05
80.
058
[0.0
56]
[0.0
54]
Mar
ketC
apita
lizat
ion/
GD
P c,t
0.12
8***
0.12
8***
[0.0
32]
[0.0
26]
Cou
ntry
Dum
mie
sY
esY
esY
esY
esY
esY
esY
ear
Dum
mie
sY
esY
esY
esY
esY
esY
esN
umbe
rof
Obs
erva
tions
1,72
01,
554
1,52
51,
622
1,52
51,
525
Num
ber
ofFi
rms
293
248
247
274
247
247
Num
ber
ofC
ount
ries
3732
3228
3232
R-s
quar
ed0.
540.
560.
540.
510.
540.
54

INTERNATIONALIZATION AND STOCK MARKET LIQUIDITY 17
these robustness tests and related findings provide further support to the migrationchannel.
3.1.3. Migration: Additional Evidence and Comments
We provide additional evidence on the size of the migration effect and on the totaltrading activity of firms that internationalize by examining a subset of firms withdetailed trading data in both domestic and international markets. Specifically, forfirms that internationalize by issuing Level II and III American Depositary Re-ceipts, we have data on the trading of their shares in both their local market andin New York. For these firms, we assess the degree to which trading actually shiftsabroad after internationalization and what happens to the total trading of a firm’sshares. We use the same basic specification provided in Equation (1), except thatthe dependent variable in Table III is total turnover of international firm j fromcountry c in year t (TT I
j,c,t ), defined as the sum of its value traded domesticallyand abroad divided by its market capitalization, and the dependent variable inTable IV is the relative domestic turnover, that is the fraction of total turnover ofinternational firm j from country c in year t that takes place in the domestic market(
RDT Ij,c,t = T I
j,c,t
TT I
j,c,t
).
Tables III and IV show that (i) the total turnover of a firm soars after it inter-nationalizes and (ii) the proportion of total trading that occurs in the local marketplummets.13 Specifically, the coefficients in Table III show that the total turnover ofinternational firms increases by around 38% following internationalization.14 Re-call from Table I that the domestic turnover of international firms tends to fall afterinternationalization. Indeed, the estimated coefficients on the internationalizationdummy in Table IV indicate that one plus the proportion of domestic trading ofan international firm falls by about 21% following internationalization. Since thisratio equals two before internationalization (by definition), these estimates implythat the percentage of domestic trading of international firms falls to about 58%after a firm issues a Level II or III ADR.
The shift of trading to international market endures. That is, in our sample ofemerging market firms there is no significant flow-back effect. In particular, weestimated the regressions from Table IV using a series of dummy variables thattrace out annual patterns following internationalization. We found that the share oftrading in international markets does not decrease over time.
13 Eun and Sabherwal (2003) find that the higher the fraction of trading occurring in internationalfinancial centers, the higher is the contribution of these international markets to price discovery.
14 Following the same method as above for illustrating the economic magnitudes of these estimatedrelations, the estimated coefficient indicates that one plus the total turnover ratio of firm j fromcountry c in year t rises by about 18% following internationalization. This increase is large given thatthe average value of the total turnover of international firms included in these regressions is about0.89, which means that for the average firm, total turnover rises by 38% after it internationalizes.

18 ROSS LEVINE AND SERGIO L. SCHMUKLER
Tabl
eII
I.To
talt
radi
ngac
tivit
yof
inte
rnat
iona
lfirm
s:F
irm
sw
ith
Lev
elII
and
III
AD
Rs
The
depe
nden
tva
riab
leis
the
loga
rith
mof
one
plus
the
tota
ltu
rnov
erra
tio
ofin
tern
atio
nal
firm
sw
ith
Lev
elII
and
III
AD
Rpr
ogra
ms,
whi
chtr
ade
ona
maj
orU
.S.
exch
ange
(Am
ex,
NA
SD
AQ
,or
NY
SE
).T
hein
tern
atio
nali
zati
ondu
mm
y(I
Dj,c
,t)
equa
lson
eon
and
afte
rth
eye
arw
hen
afi
rmst
arts
trad
ing
inth
ese
mar
kets
and
zero
othe
rwis
e(i
tbe
com
esze
roif
afi
rmis
deli
sted
).T
here
gres
sion
sin
clud
eco
untr
yan
dye
ardu
mm
ies,
thou
ghth
eyar
eno
tre
port
edin
the
tabl
e.S
tand
ard
erro
rsar
ein
brac
kets
.C
olum
ns(1
)to
(5)
repo
rtN
ewey
-Wes
tst
anda
rder
rors
,w
hich
are
robu
stto
hete
rosk
edas
tici
tyan
dau
toco
rrel
atio
nw
ithi
nfi
rms.
Col
umn
(6)
repo
rts
stan
dard
erro
rsad
just
edfo
rcl
uste
ring
atth
efi
rmle
vel.
*,**
,***
mea
nsi
gnifi
canc
eat
ten,
five,
and
one
perc
ent,
resp
ectiv
ely.
The
esti
mat
edeq
uati
onis
the
foll
owin
g:
TT
I j,c
,t=
φ×
Aj,c
,t+
α×
IDj,c
,t+
β×
TD c,t
+γ
×ST
I c,t
+θ
×C
c,t
+δ 1
×nc
+δ 2
×τ t
+εj,c
,t.
Dep
ende
ntV
aria
ble:
Log
(1+
Tota
lTur
nove
r)(1
)(2
)(3
)(4
)(5
)(6
)
Log
ofTo
talA
sset
s j,c
,t−0
.046
***
−0.0
39**
−0.0
30**
−0.0
39**
*−0
.026
**−0
.026
[0.0
15]
[0.0
16]
[0.0
14]
[0.0
14]
[0.0
13]
[0.0
16]
Inte
rnat
iona
lizat
ion
Dum
my j
,c,t
0.19
6***
0.19
1***
0.16
4***
0.16
9***
0.16
4***
0.16
4***
[0.0
38]
[0.0
38]
[0.0
38]
[0.0
39]
[0.0
40]
[0.0
44]
Log
(1+
Ave
rage
Tur
nove
rof
Dom
estic
Firm
s)c,t
0.39
5***
0.41
0***
0.38
3***
0.36
1***
0.38
7***
0.38
7***
[0.0
84]
[0.0
88]
[0.0
84]
[0.0
84]
[0.0
84]
[0.0
58]
Stoc
kM
arke
tLib
eral
izat
ion
Dum
my c
,t−0
.010
−0.0
17−0
.002
−0.0
02[0
.047
][0
.049
][0
.048
][0
.046
]L
ogof
(1+
Val
ueT
rade
dA
broa
d/To
tal
Val
ueT
rade
d)c,t
0.36
1***
0.32
7**
0.40
4***
0.40
4***
[0.1
29]
[0.1
42]
[0.1
32]
[0.1
36]
Stoc
kM
arke
tLib
eral
izat
ion
0.02
5E
diso
nan
dW
arno
ck(2
003)
Mea
sure
c,t
[0.1
01]
Log
ofG
DP
per
capi
tac,t
−0.2
20**
*−0
.220
***
[0.0
81]
[0.0
69]
Mar
ketC
apita
lizat
ion/
GD
P c,t
−0.0
44−0
.044
[0.0
76]
[0.0
77]
Cou
ntry
Dum
mie
sY
esY
esY
esY
esY
esY
esY
ear
Dum
mie
sY
esY
esY
esY
esY
esY
esN
umbe
rof
Obs
erva
tions
696
655
645
658
645
645
Num
ber
ofFi
rms
119
106
105
110
105
105
Num
ber
ofC
ount
ries
2018
1818
1818
R-s
quar
ed0.
540.
520.
500.
530.
510.
51

INTERNATIONALIZATION AND STOCK MARKET LIQUIDITY 19
Tabl
eIV
.M
igra
tion
:Fir
ms
wit
hL
evel
IIan
dII
IA
DR
s
The
depe
nden
tva
riab
leis
the
loga
rith
mof
one
plus
the
rati
oof
turn
over
indo
mes
tic
mar
kets
over
the
tota
ltu
rnov
erof
inte
rnat
iona
lfi
rms
wit
hL
evel
IIan
dII
IA
DR
prog
ram
s,w
hich
trad
eon
am
ajor
U.S
.exc
hang
e(A
mex
,NA
SD
AQ
,or
NY
SE
).T
hein
tern
atio
nali
zati
ondu
mm
y(I
Dj,c
,t)
equa
lson
eon
and
afte
rth
eye
arw
hen
afi
rmst
arts
trad
ing
inth
ese
mar
kets
and
zero
othe
rwis
e(i
tbe
com
esze
roif
afi
rmis
deli
sted
).T
here
gres
sion
sin
clud
eco
untr
yan
dye
ardu
mm
ies,
thou
ghth
eyar
eno
tre
port
edin
the
tabl
e.S
tand
ard
erro
rsar
ein
brac
kets
.Col
umns
(1)
to(5
)re
port
New
ey-W
est
stan
dard
erro
rs,w
hich
are
robu
stto
hete
rosk
edas
tici
tyan
dau
toco
rrel
atio
nw
ithi
nfi
rms.
Col
umn
(6)
repo
rts
stan
dard
erro
rsad
just
edfo
rcl
uste
ring
atth
efi
rmle
vel.
*,**
,***
mea
nsi
gnifi
canc
eat
ten,
five,
and
one
perc
ent,
resp
ectiv
ely.
The
esti
mat
edeq
uati
onis
the
foll
owin
g:
RD
TI j,c
,t=
φ×
Aj,c
,t+
α×
IDj,c
,t+
β×
TD c,t
+γ
×ST
I c,t
+θ
×C
c,t
+δ 1
×nc
+δ 2
×τ t
+εj,c
,t.
Dep
ende
ntV
aria
ble:
Log
(1+
Tur
nove
rin
Dom
estic
Mar
ket/T
otal
Tur
nove
r)(1
)(2
)(3
)(4
)(5
)(6
)
Log
ofTo
talA
sset
s j,c
,t0.
013*
*0.
016*
**0.
017*
**0.
013*
*0.
014*
*0.
014
[0.0
06]
[0.0
06]
[0.0
06]
[0.0
06]
[0.0
06]
[0.0
11]
Inte
rnat
iona
lizat
ion
Dum
my j
,c,t
−0.2
27**
*−0
.223
***
−0.2
06**
*−0
.208
***
−0.2
14**
*−0
.214
***
[0.0
17]
[0.0
17]
[0.0
19]
[0.0
19]
[0.0
19]
[0.0
29]
Log
(1+
Ave
rage
Tur
nove
rof
Dom
estic
Firm
s)c,t
0.07
7***
0.08
8***
0.05
8**
0.04
20.
050*
0.05
0*[0
.025
][0
.025
][0
.026
][0
.027
][0
.027
][0
.024
]St
ock
Mar
ketL
iber
aliz
atio
nD
umm
y c,t
−0.0
43−0
.037
−0.0
50**
−0.0
50*
[0.0
27]
[0.0
23]
[0.0
24]
[0.0
28]
Log
of(1
+V
alue
Tra
ded
Abr
oad/
Tota
lV
alue
Tra
ded)
c,t
−0.3
41**
*−0
.373
***
−0.3
77**
*−0
.377
***
[0.0
81]
[0.0
81]
[0.0
78]
[0.1
01]
Stoc
kM
arke
tLib
eral
izat
ion
0.04
6E
diso
nan
dW
arno
ck(2
003)
Mea
sure
c,t
[0.0
38]
Log
ofG
DP
per
capi
tac,t
0.10
1**
0.10
1**
[0.0
44]
[0.0
43]
Mar
ketC
apita
lizat
ion/
GD
P c,t
0.11
4***
0.11
4***
[0.0
32]
[0.0
28]
Cou
ntry
Dum
mie
sY
esY
esY
esY
esY
esY
esY
ear
Dum
mie
sY
esY
esY
esY
esY
esY
esN
umbe
rof
Obs
erva
tions
705
663
653
660
653
653
Num
ber
ofFi
rms
120
107
106
110
106
106
Num
ber
ofC
ount
ries
2018
1818
1818
R-s
quar
ed0.
540.
550.
570.
560.
570.
57

20 ROSS LEVINE AND SERGIO L. SCHMUKLER
These findings are consistent with migration. After controlling for many factors,we find that firms that internationalize by allowing their shares to be traded inmajor financial centers tend to experience a drop in the domestic market tradingactivity of their shares and a rise in total trading activity, as trading migrates abroad.Also consistent with migration, firms that internationalize without establishing avehicle to have their shares traded internationally in major public exchanges do notexperience a drop in their domestic market trading.
In these analyses, we focused on trading activity, not liquidity, for two reasons.First, we want to assess a possible two-step mechanism linking internationalizationwith the liquidity of domestic firms. The first step involves migration: Does a firm’sdomestic trading activity shift out of the domestic market and into internationalfinancial centers after it internationalizes? Consequently, we examine trading, notliquidity. Second, it is conceptually difficult to measure the liquidity of a stockthat is traded in more than one market. The majority of the trading could occur inNew York, for example, where the price is established. In this case, there mightbe no link between trading and prices in the local market. Therefore, it would beinappropriate to conclude that the local market is more or less liquid based on price-impact liquidity measures. We now turn to a different issue: the relation betweenmigration and the liquidity of domestic firms. Does the domestic trading of firmsthat have internationalized influence the liquidity of domestic firms as suggestedby the migration-spillover view? Is there a connection between internationalizationand domestic market liquidity beyond the migration-spillover effect? In particular,is the location of trading activity of international firms associated with the liquidityof domestic firms?
3.2. SPILLOVERS AND THE INTERNATIONAL MARKET
This section evaluates whether the aggregate trading of international firms in thedomestic market and the share of trading activity taking place abroad affect thetrading activity and liquidity of individual domestic firms. To conduct this test, webegin by examining whether the trading activity of a domestic equity varies withthe aggregate domestic trading activity of international firms. Then, we use twospecific measures of liquidity to assess whether the liquidity of a domestic equityvaries with the aggregate domestic trading activity of international firms. Findingthat trading activity and liquidity of individual domestic firms are positively asso-ciated with the aggregate trading activity of international firms in the local marketafter controlling for firm, country, and time-specific factors would constitute evid-ence of spillovers. We also analyze whether the share of a country’s total tradingtaking place abroad affects the turnover and liquidity of individual domestic firms.Finding a negative relation between the share of trading occurring in internationalmarkets and the liquidity of domestic equities, would show that internationalizationhas a negative impact on domestic markets beyond the migration-spillover channel.

INTERNATIONALIZATION AND STOCK MARKET LIQUIDITY 21
3.2.1. Spillovers and the International Market: Trading Activity
In Table V, we assess whether the turnover ratio of domestic firm j from country c
in year t (T Dj,c,t ) is related to the average domestic turnover of public international
firms from country c in year t (T Ic,t ). In testing for spillovers, we only control for
the domestic trading activity of international firms that are traded in public marketsabroad, as the evidence presented above shows that the domestic turnover of thesefirms tends to fall following internationalization. Thus, T I
c,t does not include thedomestic trading activity of firms that internationalized through private placementsor through the OTC market.15 The following specification is estimated:
T Dj,c,t = φ × Aj,c,t + β × T I
c,t + γ × ST Ic,t + θ × Cc,t
+ δ1 × nc + δ2 × τt + εj,c,t . (2)
As in the migration regressions, we estimate Newey-West standard errors, whichare robust to heteroskedasticity and autocorrelation within firms, and also reportfirm-level clustered standard errors. We include country and year dummy variablesas well. Furthermore, we incorporate the same time-varying firm and country char-acteristics discussed and defined in the subsection on migration. By conditioningon these variables, the goal is to identify the independent relation between thetrading of international firms in the local market and the trading activity (and laterliquidity) of individual domestic firms.
The results are consistent with large spillovers. The coefficient on T Ic,t enters
positively and significantly at the one percent level in all of the specifications inTable V. The spillover effects are economically relevant. The size of the coefficientin regression 5 of Table V implies that the average domestic firm will experi-ence a five percent reduction in its turnover when the average domestic turnoverof international firms falls by 12%.16 Thus, the estimated coefficients suggest aneconomically large relation between the trading of an individual domestic firm andthe aggregate trading of international firms on the local market.
We find these spillover effects when controlling for many country and firmscharacteristics. In particular, after conditioning on country and year dummy vari-ables, the size of the domestic firm, the level of economic development, the sizeof the local stock market, and indicators of stock market liberalization, we findevidence consistent with spillovers. Furthermore, the estimated size of the spillover
15 The results hold when using the domestic turnover of all international firms. This supports thebasic principle of spillovers: The aggregate activity of a market influences the liquidity of individualshares.
16 The coefficient shows that a five percent increase in one plus the average domestic turnoverof international firms leads to an increase of three percent in one plus the turnover of domesticfirms. Given that the average domestic turnover of international firms (in this regression) is 0.68 andthe average turnover of domestic firms is 1.35, these implies that that the average domestic firm’sstock will experience a five percent reduction in its turnover when the average domestic turnover ofinternational firms falls by 12%.

22 ROSS LEVINE AND SERGIO L. SCHMUKLER
Tabl
eV.
Tra
ding
activ
ity
ofdo
mes
tic
firm
s
The
depe
nden
tva
riab
leis
the
loga
rith
mof
one
plus
the
turn
over
rati
oof
dom
esti
cfi
rms.
The
regr
esso
rT
I c,t
equa
lsth
elo
gari
thm
ofon
epl
usth
eav
erag
edo
mes
tic
turn
over
ofin
tern
atio
nal
firm
sth
atar
etr
aded
inm
ajor
publ
icex
chan
ges
abro
ad.
The
regr
essi
ons
incl
ude
coun
try
and
year
dum
mie
s,th
ough
they
are
not
repo
rted
inth
eta
ble.
Sta
ndar
der
rors
are
inbr
acke
ts.
Col
umns
(1)
to(5
)re
port
New
ey-W
est
stan
dard
erro
rs,
whi
char
ero
bust
tohe
tero
sked
asti
city
and
auto
corr
elat
ion
wit
hin
firm
s.C
olum
n(6
)re
port
sst
anda
rder
rors
adju
sted
for
clus
teri
ngat
the
firm
leve
l.*,
**,*
**m
ean
sign
ifica
nce
atte
n,fiv
e,an
don
epe
rcen
t,re
spec
tivel
y.T
hees
tim
ated
equa
tion
isth
efo
llow
ing:
TD j,c
,t=
φ×
Aj,c
,t+
β×
TI c,t
+γ
×ST
I c,t
+θ
×C
c,t
+δ 1
×nc+
δ 2×
τ t+
εj,c
,t.
Dep
ende
ntV
aria
ble:
Log
(1+
Dom
estic
Tur
nove
r)(1
)(2
)(3
)(4
)(5
)(6
)
Log
ofTo
talA
sset
s j,c
,t−0
.074
***
−0.0
72**
*−0
.072
***
−0.0
77**
*−0
.072
***
−0.0
72**
*[0
.004
][0
.004
][0
.004
][0
.005
][0
.004
][0
.007
]L
og(1
+A
vera
geT
urno
ver
ofPu
blic
Inte
rnat
iona
l0.
500*
**0.
580*
**0.
567*
**0.
438*
**0.
596*
**0.
596*
**Fi
rms
inth
eD
omes
ticM
arke
t)c,t
[0.0
33]
[0.0
35]
[0.0
38]
[0.0
39]
[0.0
38]
[0.0
38]
Stoc
kM
arke
tLib
eral
izat
ion
Dum
my c
,t−0
.022
−0.0
05−0
.004
−0.0
04[0
.027
][0
.025
][0
.026
][0
.026
]L
ogof
(1+
Val
ueT
rade
dA
broa
d/To
tal
Val
ueT
rade
d)c,t
−0.4
66**
*−0
.526
***
−0.4
97**
*−0
.497
***
[0.0
63]
[0.0
66]
[0.0
65]
[0.0
68]
Stoc
kM
arke
tLib
eral
izat
ion
0.15
9***
Edi
son
and
War
nock
(200
3)M
easu
rec,t
[0.0
30]
Log
ofG
DP
per
capi
tac,t
0.31
9***
0.31
9***
[0.0
45]
[0.0
43]
Mar
ketC
apita
lizat
ion/
GD
P c,t
−0.1
08**
*−0
.108
***
[0.0
19]
[0.0
19]
Cou
ntry
Dum
mie
sY
esY
esY
esY
esY
esY
esY
ear
Dum
mie
sY
esY
esY
esY
esY
esY
esN
umbe
rof
Obs
erva
tions
6,48
06,
157
5,97
15,
938
5,97
15,
971
Num
ber
ofFi
rms
1,31
81,
213
1,19
51,
167
1,19
51,
195
Num
ber
ofC
ount
ries
3632
3225
3232
R-s
quar
ed0.
530.
540.
520.
500.
530.
53
INTERNATIONALIZATION AND STOCK MARKET LIQUIDITY 23
effect does not vary much when using various combinations of these controlvariables.
The fraction of trading that occurs in international financial centers enters neg-atively and significantly. Even when controlling for many country traits and whilecontrolling for the domestic trading of international firms, we find that the fractionof trading activity that occurs abroad is negatively associated with the domestictrading activity of domestic firms. While it is impossible to pin one interpretationto the coefficient on this variable, the results suggest that something beyond themigration and spillover channel links internationalization and domestic markets.For example, the results indicate that as New York becomes a more importanttrading place for Mexican stocks (relative to the total trading of Mexican stocks),the turnover of domestic Mexican stocks declines. Thus, according to this measure,internationalization is associated with a drop in the trading of domestic firms, evenafter controlling for local market conditions.
Finally, note that the logarithm of total assets enters negatively in these regres-sions. This is because assets are very highly correlated with market capitalization,and the dependent variable (turnover) has market capitalization in its denominator.In the tables below where we examine specific measures of illiquidity, we find anegative relation between firm size and illiquidity.
3.2.2. Spillovers and the International Market: Amihud Illiquidity Index
Next, we examine the impact of internationalization on the liquidity of domesticequities, using daily data to compute Amihud’s (2002) illiquidity index. Liquidityis a complex concept that is not observed directly. While many authors use turnoveras a proxy for liquidity, turnover does not directly measure trading costs or the priceimpact of transactions. Bid-ask spread measures of trading costs do not exist forthe bulk of our sample, so we compute a price-impact measure. Since Hasbrouck(2005) finds that, within the class of price-impact liquidity estimates, Amihud’s(2002) illiquidity index is the most reliable proxy of trading costs, we start withthis measure.
Amihud’s (2002) illiquidity index is defined as the average ratio of absolutereturn to trading value. Based on daily data, the illiquidity ratio is defined as follows
Ij,c,t = 1
Dj,c,t
Dj,c,t∑d=1
|�Pj,c,d,t |Vj,c,d,t
. (3)
Where Ij,c,t is the illiquidity ratio of firm j from country c in year t , �Pj,c,d,t isthe percent change in the stock price of firm j from country c on day d of yeart , Vj,c,d,t is the value traded of firms’ j stock from country c on day d of year t ,and Dj,c,t is the number of days for which the ratio can be calculated for firm j
from country c in year t . The ratio is multiplied by 106 so the results are easier toread. This index relates the absolute value of price movement to the value of equity

24 ROSS LEVINE AND SERGIO L. SCHMUKLER
transactions. This measure follows Kyle’s (1985) concept of liquidity, the responseof price to order flow.
We compute this illiquidity index using daily data on share prices in dollars, sothat it can be interpreted as the percent price response to one dollar worth of trading,allowing for comparison across countries. As an alternative, we also followed themethodology used by Lesmond (2005), estimating the illiquidity index using dailyprices in local currency and then converting the annual index into dollars using theaverage exchange rate over the year to allow for a comparison across countries. Weobtained very similar results to those reported below. We use the same specifica-tion as in Equation (2), except now the dependent variable is Amihud’s illiquidityindex (ID
j,c,t ). In our sample, this illiquidity measure is negatively correlated withturnover. For domestic firms, the simple correlation coefficient is −0.33 (significantat the one percent level), that is, as turnover increases illiquidity decreases.
The results presented in Table VI provide additional evidence of liquidityspillovers. Average turnover of public international firms in the domestic market(measured in logarithms) enters negatively and significantly at the one percentlevel in all of the illiquidity regressions. This suggests that less domestic tradingof international firms is associated with a drop in the liquidity (higher Amihudilliquidity index) of domestic firm shares. Again, these results hold when condi-tioning on a wide assortment of information. Furthermore, the spillover effectsfrom the domestic trading of international firms to the liquidity of domestic stocksare relevant, though not enormous. The size of the coefficient in regression 5 ofTable VI suggests that the illiquidity index of the typical domestic firm will jumpby about two percent when the domestic turnover of international firms falls byten percent.17 Since internationalization is associated with a drop in the domesticturnover of the average internationalizing firm of about 17% (Table I), these estim-ates suggest a non-negligible link between internationalization and the liquidity ofdomestic firms.
We also find that the illiquidity of a domestic stock is positively associated withthe share of trading occurring in international markets. This holds even when con-trolling for local market conditions, including the domestic trading of internationalfirms. Thus, while the results in Table VI support the hypothesis of spillovers, theresults also indicate that as trading abroad increases in relative terms, the liquidityof domestic firms falls. This effect is independent of spillover effects.
17 Following the illustrative examples above, the regression estimates suggest that a five percentdecrease in one plus the average domestic turnover of international firms is associated with anincrease of one percent in one plus the Amihud illiquidity ratio of domestic firms. Given that theaverage domestic turnover of international firms for the sample included in this specification is 0.71and the average illiquidity index for domestic firms is 0.81, this means that the illiquidity of domesticfirms tends to rise by two percent when there is a 12% decrease in domestic trading of internationalfirms.

INTERNATIONALIZATION AND STOCK MARKET LIQUIDITY 25
Tabl
eV
I.L
iqui
dity
ofdo
mes
tic
firm
s:A
mih
udil
liqu
idit
yra
tio
The
depe
nden
tva
riab
leis
the
loga
rith
mof
one
plus
the
Am
ihud
illi
quid
ity
rati
oof
dom
esti
cco
mpa
nies
.T
here
gres
sor
TI c,t
equa
lsth
elo
gari
thm
ofon
epl
usth
eav
erag
edo
mes
tic
turn
over
ofin
tern
atio
nal
firm
sth
atar
etr
aded
inm
ajor
publ
icex
chan
ges
abro
ad.
The
regr
essi
ons
incl
ude
coun
try
and
year
dum
mie
s,th
ough
they
are
not
repo
rted
inth
eta
ble.
Sta
ndar
der
rors
are
inbr
acke
ts.
Col
umns
(1)
to(5
)re
port
New
ey-W
est
stan
dard
erro
rs,
whi
char
ero
bust
tohe
tero
sked
asti
city
and
auto
corr
elat
ion
wit
hin
firm
s.C
olum
n(6
)re
port
sst
anda
rder
rors
adju
sted
for
clus
teri
ngat
the
firm
leve
l.*,
**,
***
mea
nsi
gnifi
canc
eat
ten,
five,
and
one
perc
ent,
resp
ectiv
ely.
The
esti
mat
edeq
uati
onis
the
foll
owin
g:
ID j,c
,t=
φ×
Aj,c
,t+
β×
TI c,t
+γ
×ST
I c,t
+θ
×C
c,t
+δ 1
×nc
+δ 2
×τ t
+εj,c
,t.
Dep
ende
ntV
aria
ble:
Log
(1+
Am
ihud
Illiq
uidi
tyR
atio
)(1
)(2
)(3
)(4
)(5
)(6
)
Log
ofTo
talA
sset
s j,c
,t−0
.097
***
−0.0
96**
*−0
.098
***
−0.1
00**
*−0
.095
***
−0.0
95**
*[0
.004
][0
.004
][0
.004
][0
.004
][0
.004
][0
.007
]L
og(1
+A
vera
geT
urno
ver
ofPu
blic
Inte
rnat
iona
l−0
.179
***
−0.2
20**
*−0
.267
***
−0.1
68**
*−0
.180
***
−0.1
80**
*Fi
rms
inth
eD
omes
ticM
arke
t)c,t
[0.0
23]
[0.0
24]
[0.0
32]
[0.0
32]
[0.0
32]
[0.0
33]
Stoc
kM
arke
tLib
eral
izat
ion
Dum
my c
,t0.
046
0.03
1−0
.066
−0.0
66[0
.040
][0
.041
][0
.042
][0
.051
]L
ogof
(1+
Val
ueT
rade
dA
broa
d/To
tal
Val
ueT
rade
d)c,t
0.28
2**
0.41
0***
0.44
0***
0.44
0***
[0.1
16]
[0.1
17]
[0.1
17]
[0.1
49]
Stoc
kM
arke
tLib
eral
izat
ion
−0.1
90**
*E
diso
nan
dW
arno
ck(2
003)
Mea
sure
c,t
[0.0
29]
Log
ofG
DP
per
capi
tac,t
−0.1
84**
*−0
.184
***
[0.0
53]
[0.0
59]
Mar
ketC
apita
lizat
ion/
GD
P c,t
−0.1
79**
*−0
.179
***
[0.0
14]
[0.0
17]
Cou
ntry
Dum
mie
sY
esY
esY
esY
esY
esY
esY
ear
Dum
mie
sY
esY
esY
esY
esY
esY
esN
umbe
rof
Obs
erva
tions
5,87
95,
573
5,37
35,
510
5,37
35,
373
Num
ber
ofFi
rms
989
915
909
910
909
909
Num
ber
ofC
ount
ries
3129
2924
2929
R-s
quar
ed0.
390.
400.
400.
380.
420.
42

26 ROSS LEVINE AND SERGIO L. SCHMUKLER
3.2.3. Spillovers and the International Market: Zero-Return Illiquidity Measures
We finally consider an additional measure of the illiquidity of domestic stocks.ZRD
j,c,t equals the fraction of trading days in a year t when a firm’s stock (firmj from country c) experienced zero returns. As mentioned in the Introduction,the literature has recently used illiquidity measures based on the proportion ofzero-return days. Lesmond et al. (1999) argue that if the value of information isinsufficient to outweigh the costs associated with transacting, then market parti-cipants will choose not to trade, resulting in an observed zero return. Therefore,the proportion of zero returns is associated with transaction costs. In our data,the proportion of zero-return days is positively correlated with the Amihud meas-ure and negatively correlated with turnover, with the correlations being 0.42 and−0.33, respectively, and in both cases significant at the one percent level. Althoughthere is greater theoretical appeal to using price-impact liquidity measures, such asthe Amihud ratio employed above, we use this additional measure of liquidity asa robustness check. We also created an additional indicator of liquidity, equal tothe fraction of trading days in year t when a firm’s stock (firm j from countryc) experienced zero trading, that is zero returns and no trading activity. Holdingother things constant, more days with no trading suggests less liquidity. When weuse this as the dependent variable, we find very similar results. We compute thismeasure using daily price data in domestic currency, as returns calculated usingdata in foreign currency may be affected by exchange rate fluctuations.
The results in Table VII are consistent with spillovers. The domestic trading ofinternational firms is negatively associated with illiquidity. In particular, there is anegative and significant (at the one percent level) relation between the proportionof days with zero returns and the logarithm of one plus the average turnover ofpublic international firms in the domestic market. Thus, a reduction in the domestictrading of international firms is associated with an increase in the number daysthat domestic firms experience zero returns. Moreover, confirming previous results,when trading abroad as a share of total trading increases, the proportion of zero-return days by domestic firms increases, i.e. domestic firms become more illiquid.
4. Conclusion
In this paper, we find evidence that supports the view that internationalization hasa negative impact on domestic stock market liquidity. First, the evidence is broadlyconsistent with the two-part migration-spillover view of internationalization. Whena firm cross-lists or issues depositary receipts in an international public exchange(e.g., the NYSE), we find that the trading of the firm’s shares tends to migrate out ofthe domestic market and into the international market. Furthermore, there is strongevidence of spillovers in stock markets. The liquidity of individual domestic firmsis positively associated with the aggregate domestic trading activity of internationalfirms even when controlling for domestic market conditions, country characterist-ics, and firm traits. Thus, there is some evidence for policymakers concerns that
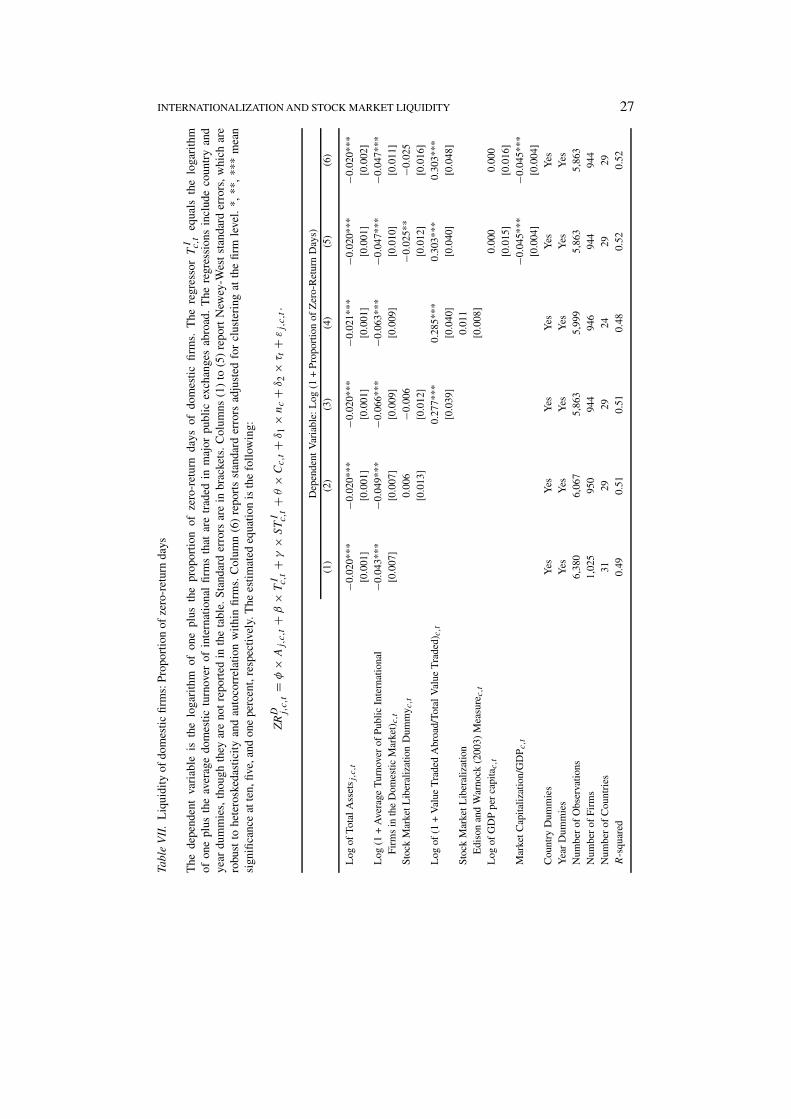
INTERNATIONALIZATION AND STOCK MARKET LIQUIDITY 27
Tabl
eV
II.
Liq
uidi
tyof
dom
esti
cfi
rms:
Pro
port
ion
ofze
ro-r
etur
nda
ys
The
depe
nden
tva
riab
leis
the
loga
rith
mof
one
plus
the
prop
orti
onof
zero
-ret
urn
days
ofdo
mes
tic
firm
s.T
here
gres
sor
TI c,t
equa
lsth
elo
gari
thm
ofon
epl
usth
eav
erag
edo
mes
tic
turn
over
ofin
tern
atio
nal
firm
sth
atar
etr
aded
inm
ajor
publ
icex
chan
ges
abro
ad.
The
regr
essi
ons
incl
ude
coun
try
and
year
dum
mie
s,th
ough
they
are
not
repo
rted
inth
eta
ble.
Sta
ndar
der
rors
are
inbr
acke
ts.
Col
umns
(1)
to(5
)re
port
New
ey-W
est
stan
dard
erro
rs,w
hich
are
robu
stto
hete
rosk
edas
tici
tyan
dau
toco
rrel
atio
nw
ithi
nfi
rms.
Col
umn
(6)
repo
rts
stan
dard
erro
rsad
just
edfo
rcl
uste
ring
atth
efi
rmle
vel.
*,**
,**
*m
ean
sign
ifica
nce
atte
n,fiv
e,an
don
epe
rcen
t,re
spec
tivel
y.T
hees
tim
ated
equa
tion
isth
efo
llow
ing:
ZR
D j,c
,t=
φ×
Aj,c
,t+
β×
TI c,t
+γ
×ST
I c,t
+θ
×C
c,t
+δ 1
×nc
+δ 2
×τ t
+εj,c
,t.
Dep
ende
ntV
aria
ble:
Log
(1+
Prop
ortio
nof
Zer
o-R
etur
nD
ays)
(1)
(2)
(3)
(4)
(5)
(6)
Log
ofTo
talA
sset
s j,c
,t−0
.020
***
−0.0
20**
*−0
.020
***
−0.0
21**
*−0
.020
***
−0.0
20**
*[0
.001
][0
.001
][0
.001
][0
.001
][0
.001
][0
.002
]L
og(1
+A
vera
geT
urno
ver
ofPu
blic
Inte
rnat
iona
l−0
.043
***
−0.0
49**
*−0
.066
***
−0.0
63**
*−0
.047
***
−0.0
47**
*Fi
rms
inth
eD
omes
ticM
arke
t)c,t
[0.0
07]
[0.0
07]
[0.0
09]
[0.0
09]
[0.0
10]
[0.0
11]
Stoc
kM
arke
tLib
eral
izat
ion
Dum
my c
,t0.
006
−0.0
06−0
.025
**−0
.025
[0.0
13]
[0.0
12]
[0.0
12]
[0.0
16]
Log
of(1
+V
alue
Tra
ded
Abr
oad/
Tota
lV
alue
Tra
ded)
c,t
0.27
7***
0.28
5***
0.30
3***
0.30
3***
[0.0
39]
[0.0
40]
[0.0
40]
[0.0
48]
Stoc
kM
arke
tLib
eral
izat
ion
0.01
1E
diso
nan
dW
arno
ck(2
003)
Mea
sure
c,t
[0.0
08]
Log
ofG
DP
per
capi
tac,t
0.00
00.
000
[0.0
15]
[0.0
16]
Mar
ketC
apita
lizat
ion/
GD
P c,t
−0.0
45**
*−0
.045
***
[0.0
04]
[0.0
04]
Cou
ntry
Dum
mie
sY
esY
esY
esY
esY
esY
esY
ear
Dum
mie
sY
esY
esY
esY
esY
esY
esN
umbe
rof
Obs
erva
tions
6,38
06,
067
5,86
35,
999
5,86
35,
863
Num
ber
ofFi
rms
1,02
595
094
494
694
494
4N
umbe
rof
Cou
ntri
es31
2929
2429
29R
-squ
ared
0.49
0.51
0.51
0.48
0.52
0.52

28 ROSS LEVINE AND SERGIO L. SCHMUKLER
firms that cross-list or issue depositary receipts in major public exchanges facilitatethe migration of trading out of the domestic market, which hurts the liquidity ofdomestic firms.
Second, we find that migration and spillovers are not the only links betweeninternationalization and the liquidity of domestic firms. In particular, the aggregateshare of trading abroad is negatively associated with the liquidity of domesticfirms. Therefore, even when controlling for the migration-spillover channel anddomestic market conditions, a domestic firm’s liquidity is negatively linked withthe proportion of trading from the same country that takes place aboard. The find-ings are consistent with arguments that investors seeking to hold country-specificrisk shift their trading of a country’s stocks to lower cost, lower risk internationalmarkets when firms from that country internationalize. This reduces their tradingof domestic firms in the local market, with negative repercussions on the liquidityof these firms. The findings are also consistent with arguments that international-ization signals that a firm is of comparatively high quality, which might then haveadverse implications on the liquidity of domestic firms. Therefore, substantiallymore research is needed into decomposing the relation between internationalizationand the drop in domestic firm liquidity.
The estimated effects suggest that internationalization is associated with im-portant distributional effects. Firms that internationalize experience a substantialincrease in the total (domestic plus international) trading of their shares. However,the migration of their trading out of the domestic market and into internationalmarkets is tied to a substantive drop in the liquidity of domestic firms. Thus, in-ternationalization is associated with large distributional changes to liquidity acrossfirms. These effects are relevant because, as shown by Amihud and Mendelson(1986), firm liquidity influences the cost of capital. It would be valuable for futureresearch to explore more fully the country, industry, and firm characteristics thatdrive corporate internationalization decisions and to investigate whether domesticfirms receive countervailing benefits from the internationalization process.
The liquidity spillovers in markets around the world documented in this pa-per are important by themselves, even beyond the migration of trading out oflocal markets. These spillover effects suggest that there is a powerful force forthe consolidation of trading within a few markets. This consolidation may occurboth within a country and across international markets. This paper has shown thatfor international firms from emerging economies the relevant market might existoutside the borders of their home markets. On the other hand, Halling et al. (2005)find that for European cross-listed firms the relevant market is within their homecountry. These differences suggest that markets of different sizes and quality mayhave different “gravitational pulls” on the trading activity of cross-listed firms.More research is needed to understand the determinants and implications of thesedifferent equilibria.

INTERNATIONALIZATION AND STOCK MARKET LIQUIDITY 29
App
endi
xTa
ble
I.B
asic
stat
isti
csan
dm
eans
Thi
sta
ble
repo
rts
sum
mar
yst
atis
tics
byco
untr
y.It
disp
lays
the
tota
lnu
mbe
rof
firm
s,th
enu
mbe
rof
inte
rnat
iona
lfi
rms,
the
num
ber
ofdo
mes
tic
firm
s,th
esa
mpl
eco
vera
ge,a
ndth
esa
mpl
eav
erag
eof
the
trad
ing
and
liqu
idit
yva
riab
les
used
inth
ere
gres
sion
s.In
tern
atio
nal
com
pani
esar
eth
eon
esth
atis
sue
ade
posi
tary
rece
ipt,
cros
s-li
st,o
rra
ise
capi
tali
nin
tern
atio
nale
quit
ym
arke
ts.
Dom
esti
cFi
rms
Inte
rnat
iona
lFir
ms
No.
ofF
irm
sN
o.of
Fir
ms
inT
urno
ver
Am
ihut
Pro
port
ion
ofT
urno
ver
Tur
nove
rin
inth
eth
eA
ggre
gate
Tota
lNo.
inD
omes
tic
Illi
quid
ity
Zer
oR
etur
nin
Dom
esti
cD
omes
tic
Mar
ket/
Tota
l
Reg
ress
ion
Mea
sure
sof
Firm
sM
arke
tR
atio
Day
sM
arke
tTo
talT
urno
ver
Tur
nove
rIn
t’l.
Dom
.In
t’l.
Dom
.In
t’l.
Dom
.S
ampl
eS
td.
Std
.S
td.
Std
.S
td.
Std
.
Cou
ntry
Firm
sF
irm
sFi
rms
Fir
ms
Firm
sF
irm
sPe
riod
Mea
nD
ev.
Mea
nD
ev.
Mea
nD
ev.
Mea
nD
ev.
Mea
nD
ev.
Mea
nD
ev.
1A
rgen
tina
89
189
2210
1990
–200
00.
400.
291.
671.
570.
480.
260.
270.
270.
440.
400.
450.
31
2B
ahra
in1
141
121
1419
99–2
000
0.11
0.13
––
––
0.05
––
––
–3
Bra
zil
4947
2952
5252
1989
–200
00.
330.
390.
611.
300.
400.
270.
410.
380.
780.
300.
470.
45
4B
ulga
ria
10
016
116
1998
–200
0–
––
––
–0.
030.
02–
––
–
5C
hile
2133
2236
2436
1989
–200
00.
090.
101.
120.
880.
500.
250.
130.
110.
450.
320.
420.
31
6C
hina
5078
2720
054
200
1992
–200
01.
591.
970.
750.
800.
410.
261.
401.
470.
740.
232.
151.
387
Col
ombi
a7
213
287
2819
89–2
000
0.10
0.08
1.31
1.00
0.63
0.24
0.12
0.08
––
––
8C
roat
ia2
51
72
719
97–2
000
0.04
0.05
––
––
0.04
0.04
––
––
9C
zech
Rep
ubli
c5
453
715
7119
95–2
000
0.21
0.49
3.08
2.60
0.37
0.21
0.40
0.42
––
––
10E
gypt
614
772
772
1997
–200
00.
300.
411.
181.
300.
200.
150.
410.
29–
––
–
11E
ston
ia2
81
112
1119
97–2
000
0.26
0.29
2.55
2.10
0.47
0.25
0.30
0.47
––
––
12G
hana
110
110
110
1996
–200
00.
090.
12–
––
–0.
000.
000.
000.
000.
490.
18
13G
reec
e8
679
7711
7719
89–2
000
0.60
0.55
1.02
1.71
0.23
0.20
0.41
0.39
0.98
0.05
0.35
0.25
14H
unga
ry15
89
1015
1019
92–2
000
0.65
0.50
1.21
1.63
0.28
0.26
0.86
1.20
0.75
0.16
0.47
0.33
15In
dia
4910
828
130
5213
019
90–2
000
0.34
1.02
2.07
2.11
0.23
0.15
0.62
1.10
0.90
0.15
1.14
1.83
16In
done
sia
897
512
910
129
1990
–200
00.
961.
671.
001.
300.
550.
220.
490.
380.
500.
190.
680.
25
17Is
rael
1828
1734
2034
1997
–200
00.
260.
140.
270.
330.
150.
060.
450.
330.
580.
330.
740.
4618
Jam
aica
20
017
217
1999
–200
0–
––
––
–0.
070.
06–
––
–
19Jo
rdan
34
141
341
1997
–200
00.
130.
08–
––
–0.
070.
05–
––
–
20K
orea
3217
618
195
3319
619
89–2
000
3.87
6.75
0.24
0.59
0.17
0.06
2.25
4.22
0.88
0.15
1.57
3.85
21L
atvi
a2
122
142
1419
97–2
000
0.45
0.71
4.12
1.23
0.47
0.19
0.40
0.40
––
––
22L
eban
on2
00
32
319
99–2
000
––
––
––
0.08
0.11
––
––
23L
ithu
ania
48
140
440
1996
–200
00.
110.
183.
642.
060.
660.
210.
230.
26–
––
–

30 ROSS LEVINE AND SERGIO L. SCHMUKLER
App
endi
xTa
ble
I.B
asic
stat
isti
csan
dm
eans
(con
tinu
ed)
Dom
esti
cFi
rms
Inte
rnat
iona
lFir
ms
No.
ofF
irm
sN
o.of
Fir
ms
inT
urno
ver
Am
ihut
Pro
port
ion
ofT
urno
ver
Tur
nove
rin
inth
eth
eA
ggre
gate
Tota
lNo.
inD
omes
tic
Illi
quid
ity
Zer
oR
etur
nin
Dom
esti
cD
omes
tic
Mar
ket/
Tota
l
Reg
ress
ion
Mea
sure
sof
Firm
sM
arke
tR
atio
Day
sM
arke
tTo
talT
urno
ver
Tur
nove
r
Int’
l.D
om.
Int’
l.D
om.
Int’
l.D
om.
Sam
ple
Std
.S
td.
Std
.S
td.
Std
.S
td.
Cou
ntry
Firm
sF
irm
sFi
rms
Fir
ms
Firm
sF
irm
sPe
riod
Mea
nD
ev.
Mea
nD
ev.
Mea
nD
ev.
Mea
nD
ev.
Mea
nD
ev.
Mea
nD
ev.
24M
alay
sia
1317
43
183
1318
819
89–2
000
1.29
4.24
0.57
0.85
0.25
0.10
0.30
0.41
––
––
25M
exic
o51
1341
3861
3819
89–2
000
0.32
0.32
0.26
0.48
0.27
0.18
0.46
0.38
0.52
0.33
1.17
0.91
26M
oroc
co1
111
201
2019
97–2
000
0.11
0.07
0.09
0.05
0.33
0.11
0.21
0.11
––
––
27N
iger
ia1
00
271
2719
99–2
000
––
––
––
0.05
0.03
––
––
28Pa
kist
an4
00
564
5619
97–2
000
––
––
––
3.32
3.17
––
––
29Pe
ru8
225
348
3419
92–2
000
0.75
0.70
1.33
1.10
0.51
0.25
0.32
0.28
0.60
0.30
0.49
0.35
30Ph
ilip
pine
s15
586
6316
6319
89–2
000
0.71
1.06
1.41
1.52
0.46
0.22
0.28
0.23
0.69
0.30
0.62
0.45
31Po
land
1723
827
1827
1992
–200
00.
780.
751.
211.
210.
270.
210.
770.
88–
––
–32
Port
ugal
828
339
839
1989
–199
80.
270.
211.
191.
260.
430.
200.
610.
520.
840.
160.
530.
43
33R
oman
ia1
121
321
3419
99–2
000
0.24
0.18
1.26
1.43
0.75
0.21
0.05
––
––
–
34R
ussi
a14
115
2316
2319
96–2
000
0.28
0.37
1.67
1.49
0.69
0.26
0.33
0.48
0.63
0.30
0.88
0.84
35Sl
ovak
Rep
ubli
c2
00
182
1819
97–2
000
––
––
––
0.21
0.27
––
––
36Sl
oven
ia2
142
152
1619
96–2
000
0.34
0.30
0.52
0.87
0.14
0.10
0.39
0.22
––
––
37So
uth
Afr
ica
4637
2541
4841
1992
–200
00.
220.
320.
440.
650.
370.
250.
230.
280.
910.
240.
460.
35
38S
riL
anka
10
065
165
1994
–200
0–
––
––
–0.
240.
08–
––
–
39Ta
iwan
2911
513
113
2911
819
89–2
000
3.85
3.69
0.04
0.10
0.17
0.04
3.15
3.36
0.96
0.08
4.06
3.13
40T
hail
and
130
011
213
112
1989
–200
0–
––
––
–0.
650.
87–
––
–
41T
unis
ia1
111
171
1719
96–2
000
0.09
0.08
––
––
0.15
0.07
––
––
42T
urke
y13
556
6414
6419
90–2
000
2.09
3.21
0.30
0.52
0.42
0.26
1.98
4.10
0.64
–0.
38–
43U
krai
ne4
00
144
1419
97–2
000
––
––
––
0.16
0.14
––
––
44V
enez
uela
137
410
1310
1989
–200
00.
130.
100.
780.
640.
520.
300.
320.
340.
490.
390.
630.
71
45Z
imba
bwe
48
321
423
1993
–200
00.
130.
121.
210.
780.
560.
140.
220.
18–
––
–
Tota
l55
71,
391
330
2,24
661
02,
265
1.51
3.73
0.79
1.31
0.31
0.22
0.79
1.85
0.63
0.34
0.89
1.43
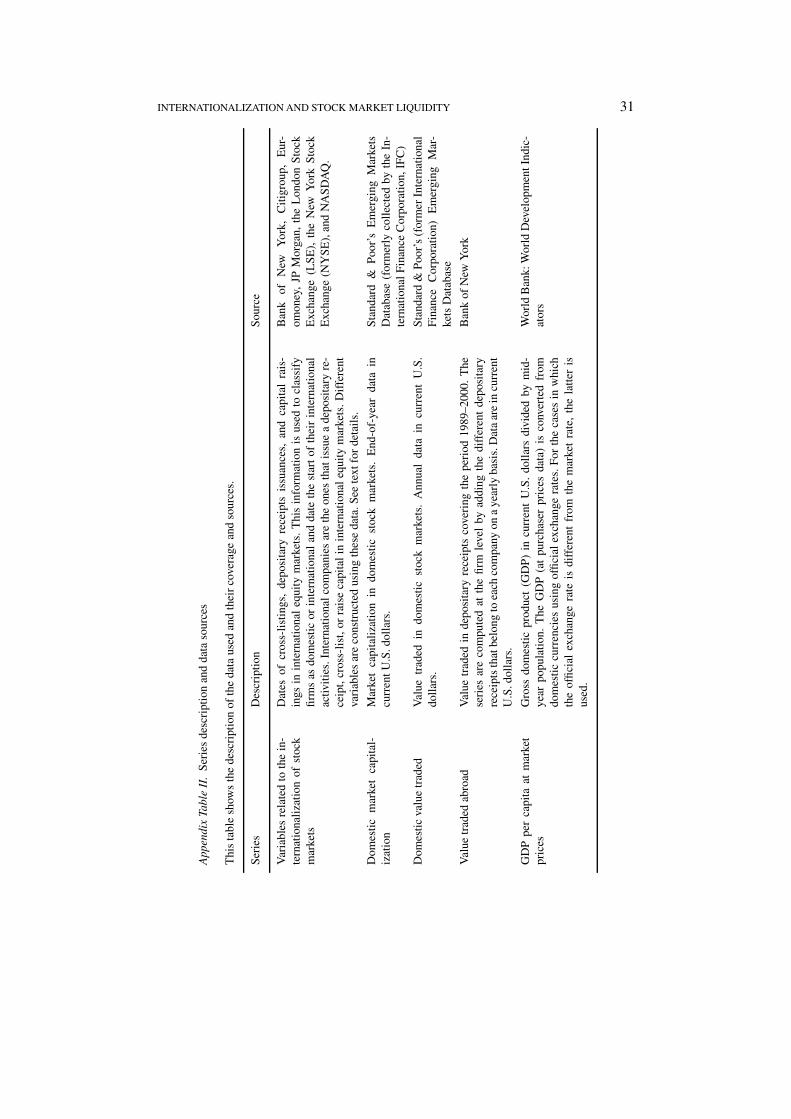
INTERNATIONALIZATION AND STOCK MARKET LIQUIDITY 31
App
endi
xTa
ble
II.
Ser
ies
desc
ript
ion
and
data
sour
ces
Thi
sta
ble
show
sth
ede
scri
ptio
nof
the
data
used
and
thei
rco
vera
gean
dso
urce
s.
Seri
esD
escr
iptio
nS
ourc
e
Var
iabl
esre
late
dto
the
in-
tern
atio
nali
zati
onof
stoc
km
arke
ts
Dat
esof
cros
s-li
stin
gs,
depo
sita
ryre
ceip
tsis
suan
ces,
and
capi
tal
rais
-in
gsin
inte
rnat
iona
leq
uity
mar
kets
.T
his
info
rmat
ion
isus
edto
clas
sify
firm
sas
dom
esti
cor
inte
rnat
iona
lan
dda
teth
est
art
ofth
eir
inte
rnat
iona
lac
tivit
ies.
Inte
rnat
iona
lcom
pani
esar
eth
eon
esth
atis
sue
ade
posi
tary
re-
ceip
t,cr
oss-
list
,or
rais
eca
pita
lin
inte
rnat
iona
leq
uity
mar
kets
.Dif
fere
ntva
riab
les
are
cons
truc
ted
usin
gth
ese
data
.See
text
for
deta
ils.
Ban
kof
New
Yor
k,C
itigr
oup,
Eur
-om
oney
,JP
Mor
gan,
the
Lon
don
Sto
ckE
xcha
nge
(LS
E),
the
New
Yor
kS
tock
Exc
hang
e(N
YS
E),
and
NA
SD
AQ
.
Dom
esti
cm
arke
tca
pita
l-iz
atio
nM
arke
tca
pita
liza
tion
indo
mes
tic
stoc
km
arke
ts.
End
-of-
year
data
incu
rren
tU.S
.dol
lars
.S
tand
ard
&P
oor’
sE
mer
ging
Mar
kets
Dat
abas
e(f
orm
erly
coll
ecte
dby
the
In-
tern
atio
nalF
inan
ceC
orpo
rati
on,I
FC
)
Dom
esti
cva
lue
trad
edV
alue
trad
edin
dom
esti
cst
ock
mar
kets
.A
nnua
lda
tain
curr
ent
U.S
.do
llar
s.St
anda
rd&
Poo
r’s
(for
mer
Inte
rnat
iona
lF
inan
ceC
orpo
rati
on)
Em
ergi
ngM
ar-
kets
Dat
abas
e
Val
uetr
aded
abro
adV
alue
trad
edin
depo
sita
ryre
ceip
tsco
veri
ngth
epe
riod
1989
–200
0.T
hese
ries
are
com
pute
dat
the
firm
leve
lby
addi
ngth
edi
ffer
ent
depo
sita
ryre
ceip
tsth
atbe
long
toea
chco
mpa
nyon
aye
arly
basi
s.D
ata
are
incu
rren
tU
.S.d
olla
rs.
Ban
kof
New
Yor
k
GD
Ppe
rca
pita
atm
arke
tpr
ices
Gro
ssdo
mes
tic
prod
uct
(GD
P)
incu
rren
tU
.S.
doll
ars
divi
ded
bym
id-
year
popu
lati
on.
The
GD
P(a
tpu
rcha
ser
pric
esda
ta)
isco
nver
ted
from
dom
esti
ccu
rren
cies
usin
gof
fici
alex
chan
gera
tes.
For
the
case
sin
whi
chth
eof
fici
alex
chan
gera
teis
diff
eren
tfr
omth
em
arke
tra
te,
the
latt
eris
used
.
Wor
ldB
ank:
Wor
ldD
evel
opm
entI
ndic
-at
ors
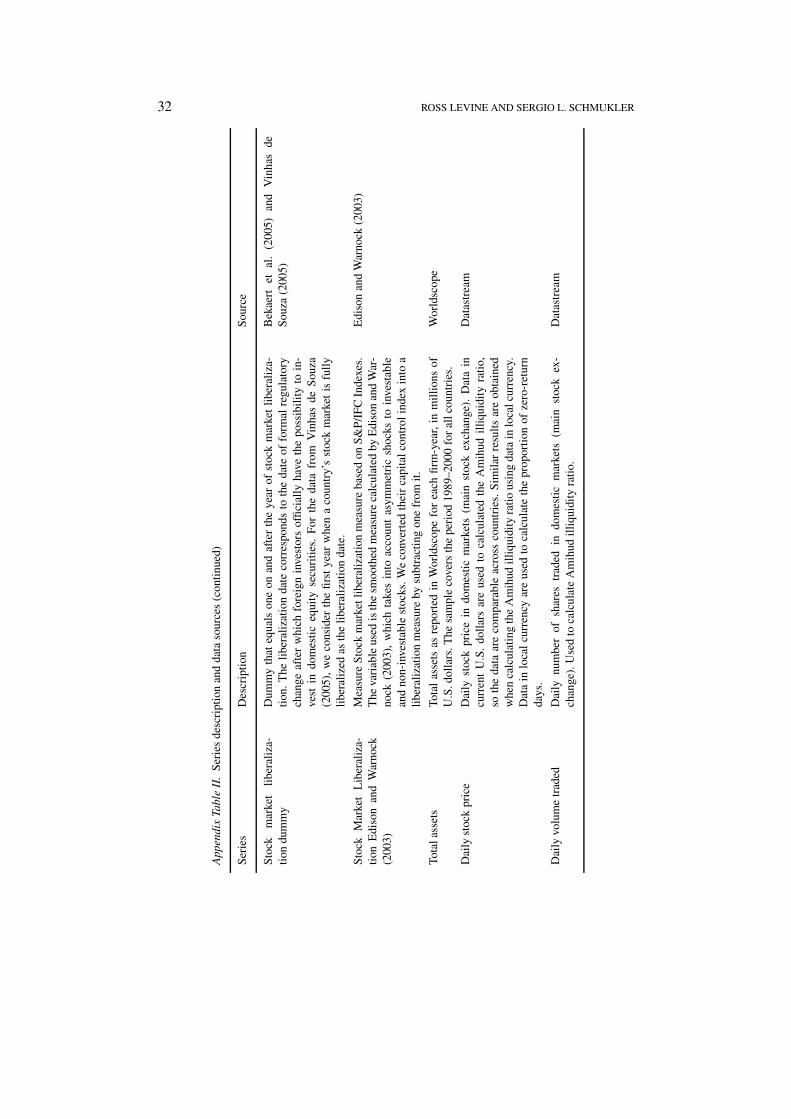
32 ROSS LEVINE AND SERGIO L. SCHMUKLER
App
endi
xTa
ble
II.
Ser
ies
desc
ript
ion
and
data
sour
ces
(con
tinu
ed)
Seri
esD
escr
iptio
nS
ourc
e
Sto
ckm
arke
tli
bera
liza
-tio
ndu
mm
yD
umm
yth
ateq
uals
one
onan
daf
ter
the
year
ofst
ock
mar
ket
libe
rali
za-
tion
.The
libe
rali
zati
onda
teco
rres
pond
sto
the
date
offo
rmal
regu
lato
rych
ange
afte
rw
hich
fore
ign
inve
stor
sof
fici
ally
have
the
poss
ibil
ity
toin
-ve
stin
dom
esti
ceq
uity
secu
riti
es.
For
the
data
from
Vin
has
deS
ouza
(200
5),
we
cons
ider
the
firs
tye
arw
hen
aco
untr
y’s
stoc
km
arke
tis
full
yli
bera
lize
das
the
libe
rali
zati
onda
te.
Bek
aert
etal
.(2
005)
and
Vin
has
deS
ouza
(200
5)
Sto
ckM
arke
tL
iber
aliz
a-ti
onE
diso
nan
dW
arno
ck(2
003)
Mea
sure
Sto
ckm
arke
tlib
eral
izat
ion
mea
sure
base
don
S&
P/I
FC
Inde
xes.
The
vari
able
used
isth
esm
ooth
edm
easu
reca
lcul
ated
byE
diso
nan
dW
ar-
nock
(200
3),
whi
chta
kes
into
acco
unt
asym
met
ric
shoc
ksto
inve
stab
lean
dno
n-in
vest
able
stoc
ks.W
eco
nver
ted
thei
rca
pita
lcon
trol
inde
xin
toa
libe
rali
zati
onm
easu
reby
subt
ract
ing
one
from
it.
Edi
son
and
War
nock
(200
3)
Tota
lass
ets
Tota
las
sets
asre
port
edin
Wor
ldsc
ope
for
each
firm
-yea
r,in
mill
ions
ofU
.S.d
olla
rs.T
hesa
mpl
eco
vers
the
peri
od19
89–2
000
for
allc
ount
ries
.W
orld
scop
e
Dai
lyst
ock
pric
eD
aily
stoc
kpr
ice
indo
mes
tic
mar
kets
(mai
nst
ock
exch
ange
).D
ata
incu
rren
tU
.S.
doll
ars
are
used
toca
lcul
ated
the
Am
ihud
illi
quid
ity
rati
o,so
the
data
are
com
para
ble
acro
ssco
untr
ies.
Sim
ilar
resu
lts
are
obta
ined
whe
nca
lcul
atin
gth
eA
mih
udil
liqu
idit
yra
tio
usin
gda
tain
loca
lcur
renc
y.D
ata
inlo
cal
curr
ency
are
used
toca
lcul
ate
the
prop
orti
onof
zero
-ret
urn
days
.
Dat
astr
eam
Dai
lyvo
lum
etr
aded
Dai
lynu
mbe
rof
shar
estr
aded
indo
mes
tic
mar
kets
(mai
nst
ock
ex-
chan
ge).
Use
dto
calc
ulat
eA
mih
udil
liqu
idit
yra
tio.
Dat
astr
eam
INTERNATIONALIZATION AND STOCK MARKET LIQUIDITY 33
References
Aggarwal, R., Klapper, L., and Wysocki, P. (2005) Portfolio preferences of foreign institutionalinvestors, Journal of Banking and Finance 29, 2919–2946.
Alexander, G., Eun, C., and Janakiramanan, S. (1988) International listings and stock returns: Someempirical evidence, Journal of Financial and Quantitative Analysis 23, 135–151.
Alexander, G., Eun, C., and Janakiramanan, S. (1987) Asset pricing and dual listing on foreign capitalmarkets: A note, Journal of Finance 42, 151–158.
Amihud, Y. (2002) Illiquidity and stock returns: Cross-section and time-series effects, Journal ofFinancial Markets 5, 31–56.
Amihud, Y. and Mendelson, H. (1986) Asset pricing and the bid-ask spread, Journal of FinancialEconomics 17, 223–249.
Atkins, A. B. and Dyl, E. A. (1997) Transactions costs and holding periods for common stocks,Journal of Finance 52, 309–325.
Beck, T. and Levine, R. (2004) Stock markets, banks, and economic growth: Panel evidence, Journalof Banking and Finance 28, 423–442.
Beck, T. and Levine, R. (2002) Industry growth and capital allocation: Does having a market- orbank-based system matter?, Journal of Financial Economics 64, 147–180.
Bekaert, G., Harvey, C. R., and Lundblad, C. (2005) Does financial liberalization spur growth?,Journal of Financial Economics 77, 3-55.
Bovespa (1996) Nova York ataca e os mercados reagem, Revista Bovespa, May.Bradshaw, M. T., Bushee, B. J., and Miller, G. S. (2004) Accounting choice, home bias, and U.S.
investment in non-U.S. firms, Journal of Accounting Research 42, 795–841.Brennan, M. J., Chordia, T., and Subrahmanyam, A. (1998) Alternative factor specifications, security
characteristics and the cross-section of expected stock returns, Journal of Financial Economics49, 345–373.
Cantale, S. (1996) The choice of a foreign market as a signal, unpublished working paper, TulaneUniversity.
Chordia, T., Roll, R., and Subrahmanyam, A. (2000) Commonality in liquidity, Journal of FinancialEconomics 56, 3–28.
Chowdhry, B. and Nanda, V. (1991) Multimarket trading and market liquidity, Review of FinancialStudies 4, 483–511.
Claessens, S., Klingebiel, D., and Schmukler, S. (2005) Stock market development and interna-tionalization: Do economic fundamentals spur both similarly?, Journal of Empirical Financeforthcoming.
Coughenour, J. F. and Saad, M. M. (2004) Common market makers and commonality in liquidity,Journal of Financial Economics 73, 37–69.
Datar, V. T., Naik, N. Y., and Radcliffe, R. (1998) Liquidity and stock returns: An alternative test,Journal of Financial Markets 1, 205–219.
Demirguc-Kunt, A. and Maksimovic, V. (1998) Law, finance, and firm growth, Journal of Finance53, 2107–2137.
Doidge, C. A., Karolyi, A., and Stulz, R. M. (2004) Why are firms that list in the U.S. worth more?,Journal of Financial Economics 71, 205–238.
Domowitz, I., Glen, J., and Madhavan, A. (1998) International cross-listing and order flow migration:Evidence from an emerging market, Journal of Finance 53, 2001–2027.
Edison, H. and Warnock, F. (2004) U.S. investors’ emerging market equity portfolios: A security-level analysis, Review of Economics and Statistics 86, 691–704.
Edison, H. and Warnock, F. (2003) A Simple measure of the intensity of capital controls, Journal ofEmpirical Finance 10, 81–103.
Eun, C. and Sabherwal, S. (2003) Cross-border listings and price discovery: Evidence from US-listedCanadian stocks, Journal of Finance 58, 549–574.

34 ROSS LEVINE AND SERGIO L. SCHMUKLER
Federation des Bourses de Valeurs (2000) Price discovery and the competitiveness of trading systems.Financial Times (1998) ADRs prove a double-edged sword, April 6.Foerster, S. and Karolyi, A. (1999) The effects of market segmentation and investor recognition on
asset prices: Evidence from foreign stocks listing in the United States, Journal of Finance 54,981–1013.
Fuerst, O. (1998) A theoretical analysis of the investor protection regulations argument for globallisting of stocks, unpublished working paper, Yale University.
Gozzi, J. C., Levine, R., and Schmukler, S. (2005) Internationalization and the evolution of corporatevaluation, unpublished working paper, Brown University, previously released as NBER WorkingPaper No. 11023.
Halling, M., Pagano, M., Randl, O., and Zechner, J. (2005) Where is the market? Evidence fromcross-listings, CEPR Discussion Paper No. 4987.
Hargis, K. (2000) International cross-listing and stock market development in emerging economies,International Review of Economics and Finance 9, 101–122.
Hargis, K. (1998) When does multimarket trading improve the quality of the primary market?Evidence from international cross-listings, unpublished working paper, Goldman, Sachs and Co.
Hargis, K. and Ramanlal, P. (1998) When does internationalization enhance the development ofdomestic stock markets?, Journal of Financial Intermediation 7, 263–292.
Hasbrouck, J. (2005) Trading costs and returns for U.S. equities: The evidence from daily data,unpublished working paper, New York University Stern School of Business Department ofFinance.
Hasbrouck, J. and Seppi, D. J. (2004) Common factors in prices, order flows, and liquidity, Journalof Financial Economics 59, 383–411.
Haugen, R. A. and Baker, N. L. (1996) Commonality in the determinants of expected stock returns,Journal of Financial Economics 41, 401–439.
Henry, P. (2000) Stock market liberalization, economic reform, and emerging market equity prices,Journal of Finance 55, 529–564.
Karolyi, A. (2006) The world of cross-listings and cross-listings of the world: Challengingconventional wisdom, Review of Finance 10, 000–000.
Karolyi, A. (2004) The role of ADRs in the development and integration of emerging equity markets,Review of Economics and Statistics 86, 670–690.
Kyle, A. S. (1985) Continuous auctions and insider trading, Econometrica 53, 1315–1335.Lang, M., Lins, V., and Miller, D. (2003) ADRs, analysts, and accuracy. Does cross listing in the
United States improve a firm’s information environment and increase market value?, Journal ofAccounting Research 41, 317–345.
Latin Finance (2004) Beware of the bull, December.Latin Finance (1999) The incredible shrinking markets, September.Lesmond, D. A. (2005) Liquidity of emerging markets, Journal of Financial Economics 77, 411–452.Lesmond, D. A., Ogden, J. P., and Trzcinka, C. A. (1999) A new estimate of transaction costs, Review
of Financial Studies 12, 1113–1141.Levine, R. (1991) Stock markets, growth, and tax policy, Journal of Finance 46, 1445–1465.Levine, R. and Schmukler, S. (2003) Migration, spillover, and trade diversion: The impact of
internationalization on domestic stock market activity, NBER Working Paper No. 9614.Levine, R. and Zervos, S. (1998a) Stock markets, banks, and economic growth, American Economic
Review 88, 537–558.Levine, R. and Zervos, S. (1998b) Capital control liberalization and stock market development, World
Development 26, 1169–1184.Miller, D. (1999) The market reaction to international cross-listings: Evidence from depositary
receipts, Journal of Financial Economics 51, 103–123.Moel, A. (2001) The role of American Depositary Receipts in the development of emerging markets,
Economia 2, 209–273.

INTERNATIONALIZATION AND STOCK MARKET LIQUIDITY 35
Noronha, G., Sarin, A., and Saudagaran, S. (1996) Testing for microstructure effects of internationaldual listings using intraday data, Journal of Banking and Finance 20, 965–983.
Pagano, M., Roell, A., and Zechner, J. (2002) The geography of equity listing: Why do Europeancompanies list abroad?, Journal of Finance 57, 2651–2694.
Patro, D. (2000) Return behavior and pricing of American Depositary Receipts, Journal ofInternational Financial Markets, Institutions and Money 10, 43–67.
Petersen, M. and Fialkowski, D. (1994) Posted versus effective spreads: Good prices or bad quotes,Journal of Financial Economics 35, 269–292.
Pulatkonak, M. and Sofianos, G. (1999) The distribution of global trading in NYSE-listed non-U.S.stocks, NYSE Working Paper 99-03.
Reese, W. A. and Weisbach, M. S. (2002) Protection of minority shareholder interest, cross-listings inthe United States, and subsequent equity offerings, Journal of Financial Economics 66, 65–104.
Rouwenhorst, K.G. (1999) Local return factors and turnover in emerging stock markets, Journal ofFinance 54, 1439–1463.
Schmukler, S. and Vesperoni, E. (2006) Financial globalization and debt maturity in emergingeconomies, Journal of Development Economics 79, 183–207.
Siegel. J. (2005) Can foreign firms bond themselves effectively by submitting to U.S. law?, Journalof Financial Economics 75, 319–360.
Stoll, H. R. (1978a) The supply of dealer services in securities markets, Journal of Finance 33,1133–1151.
Stoll, H. R. (1978b) The pricing of security dealers services: An empirical study of NASDAQ Stocks,Journal of Finance 33, 1153–1172.
Stulz, R. M. (1999) Globalization, corporate finance, and the cost of capital, Journal of AppliedCorporate Finance 12, 8–25.
The Economist (2000) Latin America’s stock markets: High and dry, February 19.Velli, J. (1994) American depositary receipts: An overview, Fordham International Law Journal 17,
38–57.Vinhas de Souza, L. (2005) Financial liberalization and business cycles: The experience of the new
EU member states, in J. Batten and C. Kearney (eds.), Emerging European Financial Markets:Independence and Integration Post-enlargement, Elsevier, Netherlands.
World Bank (2004) Whither Latin American capital markets?,www.worldbank.org/laccapitalmarkets.
