international women's day · pwc figure 2: pwc women in work index, longer term trends rank...
TRANSCRIPT
International Women's Day
PwC Women in Work Index
www.pwc.co.uk
March 2015
PwC
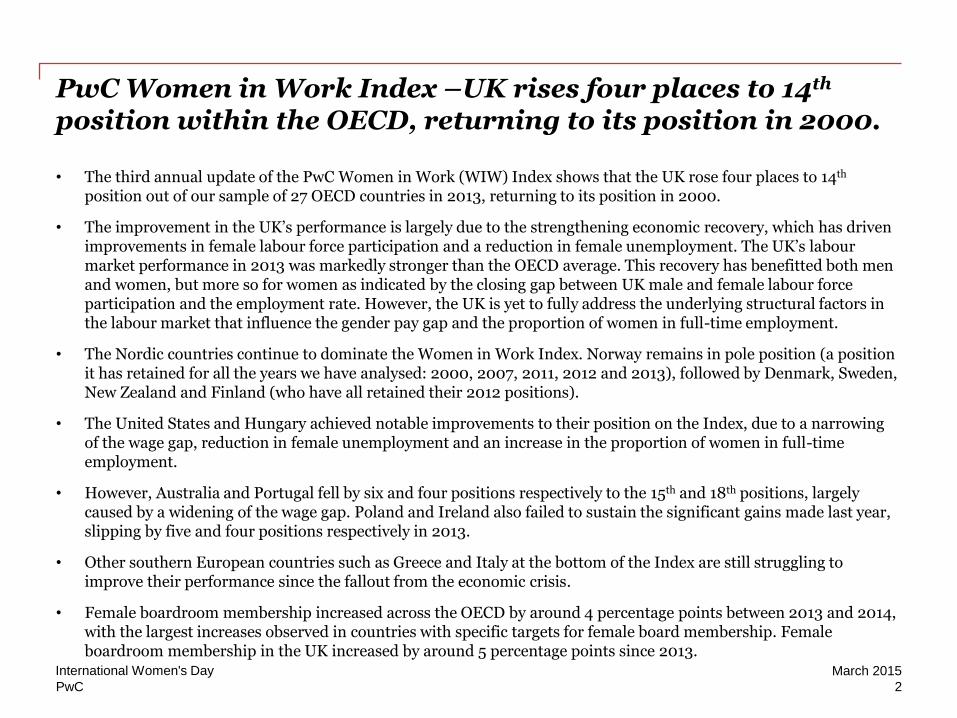
PwC Women in Work Index –UK rises four places to 14th position within the OECD, returning to its position in 2000.
• The third annual update of the PwC Women in Work (WIW) Index shows that the UK rose four places to 14th position out of our sample of 27 OECD countries in 2013, returning to its position in 2000.
• The improvement in the UK’s performance is largely due to the strengthening economic recovery, which has driven improvements in female labour force participation and a reduction in female unemployment. The UK’s labour market performance in 2013 was markedly stronger than the OECD average. This recovery has benefitted both men and women, but more so for women as indicated by the closing gap between UK male and female labour force participation and the employment rate. However, the UK is yet to fully address the underlying structural factors in the labour market that influence the gender pay gap and the proportion of women in full-time employment.
• The Nordic countries continue to dominate the Women in Work Index. Norway remains in pole position (a position it has retained for all the years we have analysed: 2000, 2007, 2011, 2012 and 2013), followed by Denmark, Sweden, New Zealand and Finland (who have all retained their 2012 positions).
• The United States and Hungary achieved notable improvements to their position on the Index, due to a narrowing of the wage gap, reduction in female unemployment and an increase in the proportion of women in full-time employment.
• However, Australia and Portugal fell by six and four positions respectively to the 15th and 18th positions, largely caused by a widening of the wage gap. Poland and Ireland also failed to sustain the significant gains made last year, slipping by five and four positions respectively in 2013.
• Other southern European countries such as Greece and Italy at the bottom of the Index are still struggling to improve their performance since the fallout from the economic crisis.
• Female boardroom membership increased across the OECD by around 4 percentage points between 2013 and 2014, with the largest increases observed in countries with specific targets for female board membership. Female boardroom membership in the UK increased by around 5 percentage points since 2013.
2
March 2015 International Women's Day

PwC
Figure 1: PwC Women in Work Index, 2013 vs 2012 Rank (2012) Rank (2013)
1 = 1 Norway
2 = 2 Denmark
3 = 3 Sweden
4 = 4 New Zealand
5 = 5 Finland
6 = 6 Canada
8 ↑ 7 Germany
7 ↓ 8 Switzerland
10 ↑ 9 Belgium
11 ↑ 10 Austria
13 ↑ 11 France
12 = 12 Netherlands
16 ↑ 13 United States
18 ↑ 14 United Kingdom
9 ↓ 15 Australia
21 ↑ 16 Hungary
19 ↑ 17 Israel
14 ↓ 18 Portugal
20 ↑ 19 Czech Republic
15 ↓ 20 Poland
17 ↓ 21 Ireland
22 = 22 Slovak Republic
23 = 23 Spain
24 = 24 Japan
25 = 25 Italy
26 = 26 Greece
27 = 27 Korea
Source: PwC analysis using data from OECD and Eurostat 0 10 20 30 40 50 60 70 80 90
201320122013: 59.1 2012: 58.6 OECD average
Australia’s deteriorating
performance is due to a
significant increase in the
gender wage gap and a
smaller increase in female
unemployment.
Hungary has moved up 6
positions due to an
improvement in the wage
gap, female labour force
participation and reduction
in female unemployment.
Germany’s improvement is
due to the reduction in the
wage gap and a smaller
increase in female labour
force participation.
Between 2012 and 2013,
Poland experienced a
significant widening of the
wage gap which accounts
for its deteriorating
performance on the Index.
Ireland fell by 4 positions,
due to a 4 percentage point
increase in the wage gap,
and a small increase in
female unemployment.
3
March 2015 International Women's Day
PwC
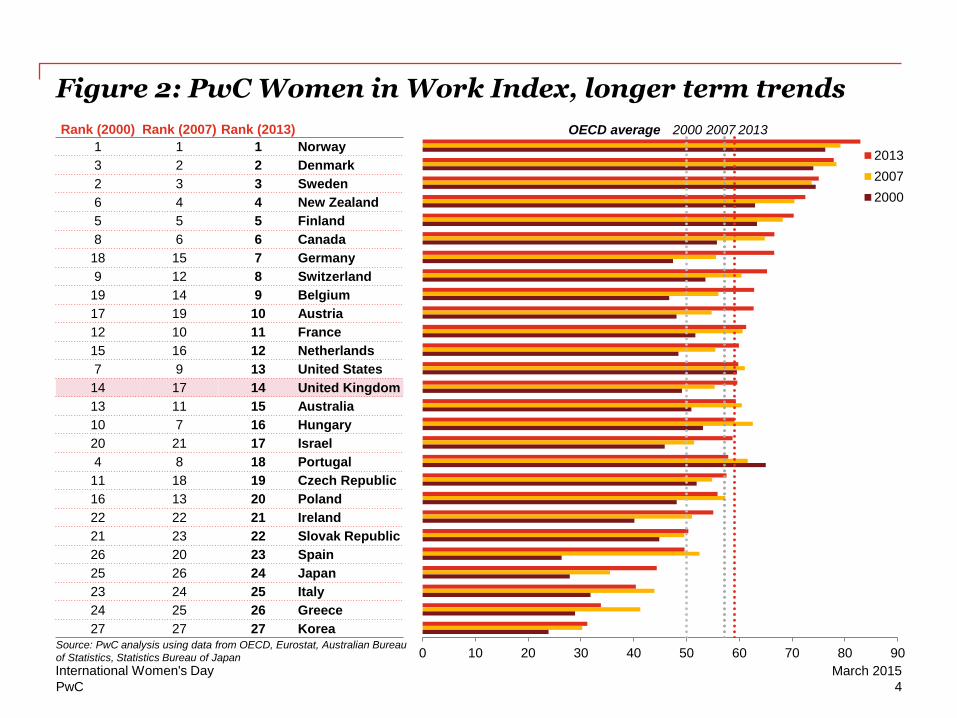
Figure 2: PwC Women in Work Index, longer term trends
Rank (2000) Rank (2007) Rank (2013)
1 1 1 Norway
3 2 2 Denmark
2 3 3 Sweden
6 4 4 New Zealand
5 5 5 Finland
8 6 6 Canada
18 15 7 Germany
9 12 8 Switzerland
19 14 9 Belgium
17 19 10 Austria
12 10 11 France
15 16 12 Netherlands
7 9 13 United States
14 17 14 United Kingdom
13 11 15 Australia
10 7 16 Hungary
20 21 17 Israel
4 8 18 Portugal
11 18 19 Czech Republic
16 13 20 Poland
22 22 21 Ireland
21 23 22 Slovak Republic
26 20 23 Spain
25 26 24 Japan
23 24 25 Italy
24 25 26 Greece
27 27 27 Korea
0 10 20 30 40 50 60 70 80 90
2013
2007
2000
2013 2007 OECD average 2000
Source: PwC analysis using data from OECD, Eurostat, Australian Bureau
of Statistics, Statistics Bureau of Japan
4
March 2015 International Women's Day
PwC
UK
0%
5%
10%
15%
20%
25%
30%
35%
40%
45%
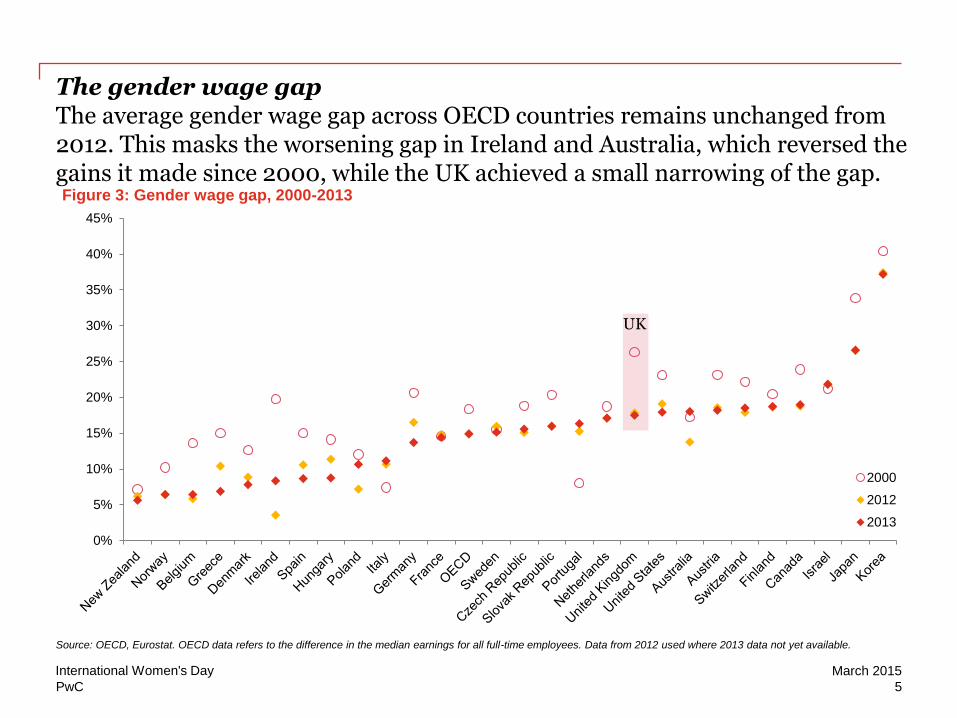
Figure 3: Gender wage gap, 2000-2013
2000
2012
2013
The gender wage gap The average gender wage gap across OECD countries remains unchanged from 2012. This masks the worsening gap in Ireland and Australia, which reversed the gains it made since 2000, while the UK achieved a small narrowing of the gap.
Source: OECD, Eurostat. OECD data refers to the difference in the median earnings for all full-time employees. Data from 2012 used where 2013 data not yet available.
5
March 2015 International Women's Day
PwC
UK
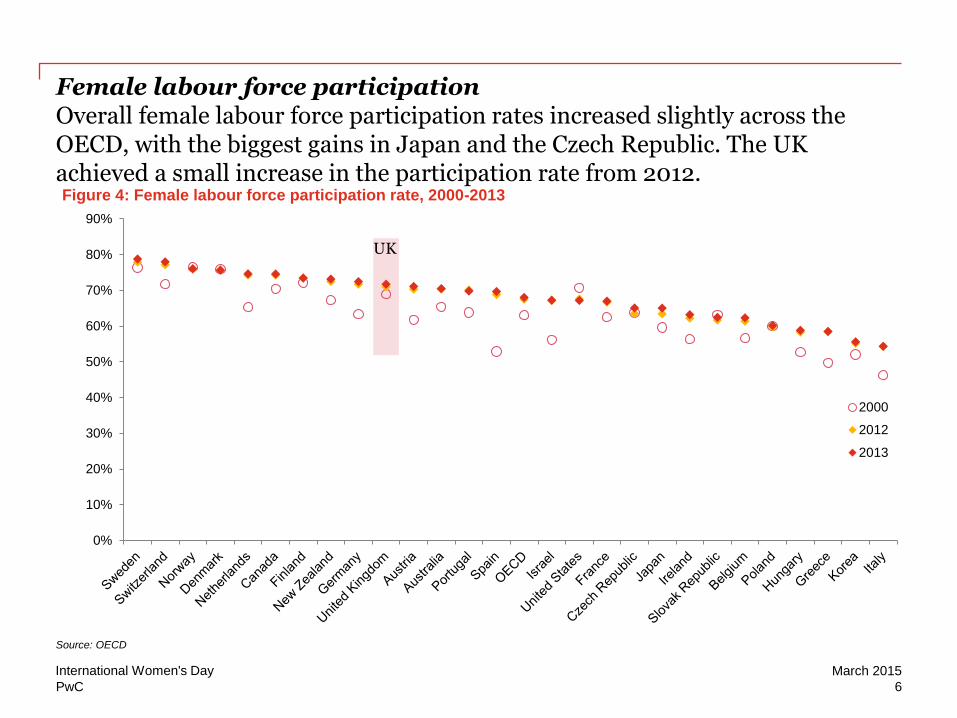
Female labour force participation Overall female labour force participation rates increased slightly across the OECD, with the biggest gains in Japan and the Czech Republic. The UK achieved a small increase in the participation rate from 2012.
0%
10%
20%
30%
40%
50%
60%
70%
80%
90%
Figure 4: Female labour force participation rate, 2000-2013
2000
2012
2013
Source: OECD
6
March 2015 International Women's Day
PwC
UK
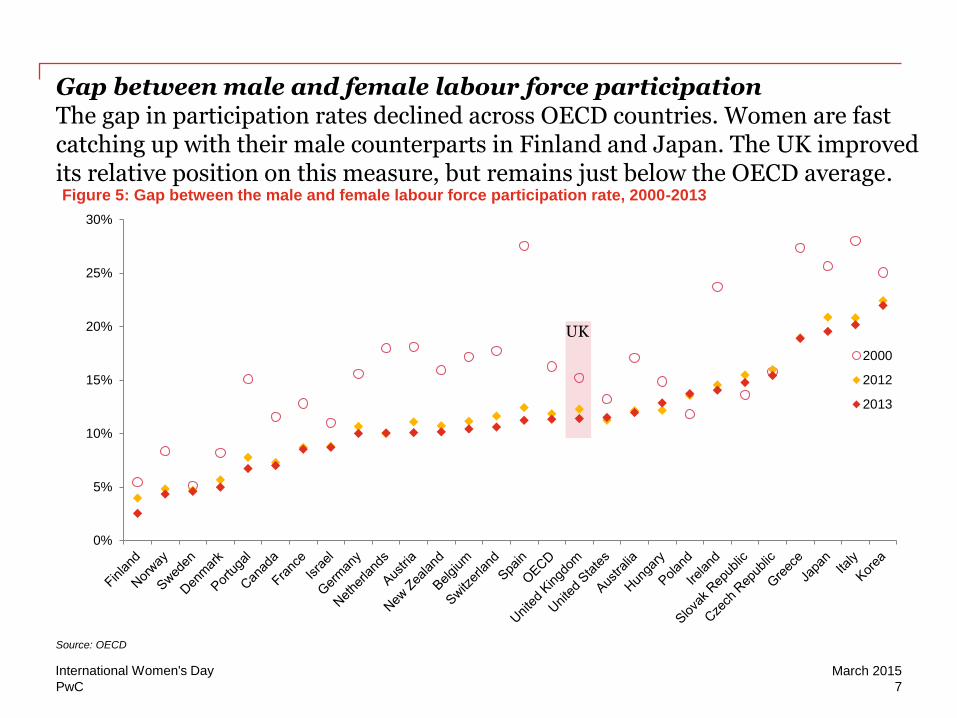
Gap between male and female labour force participation The gap in participation rates declined across OECD countries. Women are fast catching up with their male counterparts in Finland and Japan. The UK improved its relative position on this measure, but remains just below the OECD average.
0%
5%
10%
15%
20%
25%
30%
Figure 5: Gap between the male and female labour force participation rate, 2000-2013
2000
2012
2013
Source: OECD
7
March 2015 International Women's Day
PwC
UK
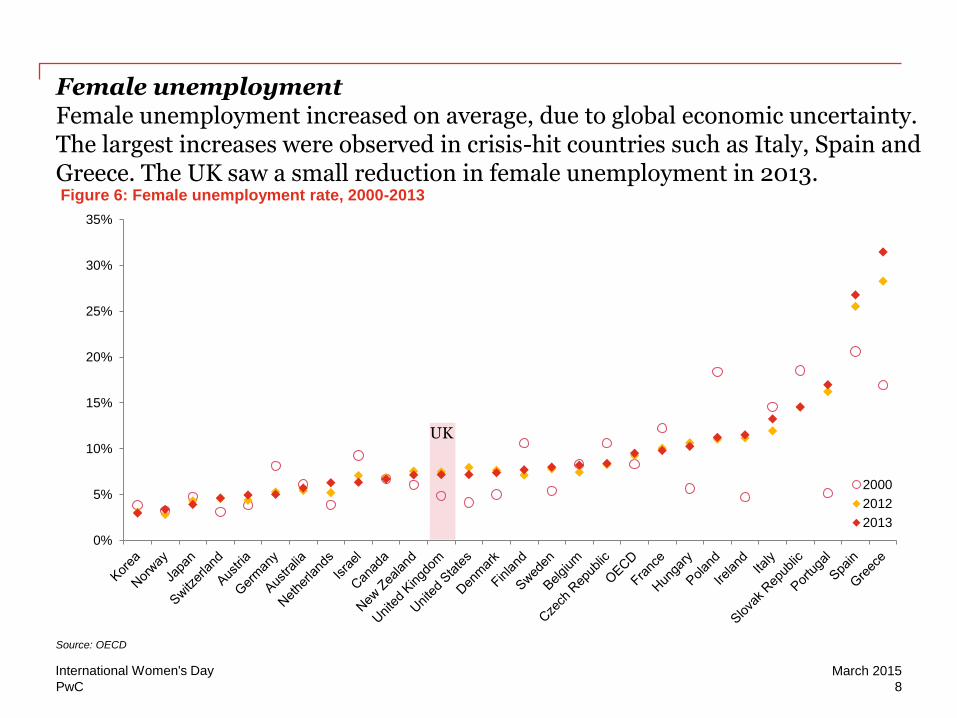
Female unemployment Female unemployment increased on average, due to global economic uncertainty. The largest increases were observed in crisis-hit countries such as Italy, Spain and Greece. The UK saw a small reduction in female unemployment in 2013.
0%
5%
10%
15%
20%
25%
30%
35%
Figure 6: Female unemployment rate, 2000-2013
2000
2012
2013
Source: OECD
8
March 2015 International Women's Day
PwC
UK
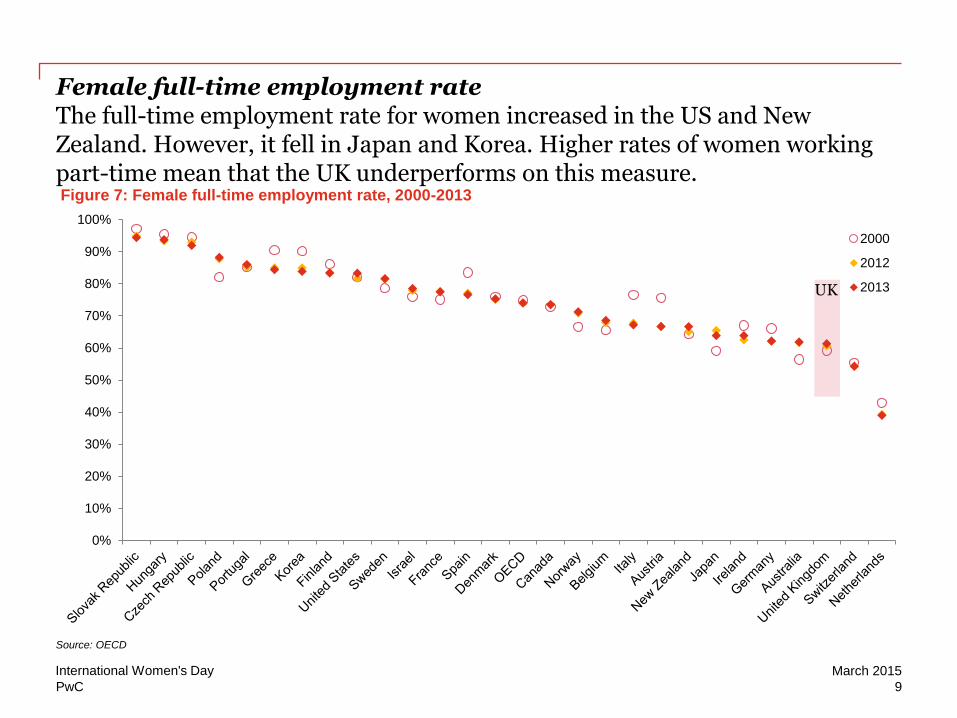
Female full-time employment rate The full-time employment rate for women increased in the US and New Zealand. However, it fell in Japan and Korea. Higher rates of women working part-time mean that the UK underperforms on this measure.
0%
10%
20%
30%
40%
50%
60%
70%
80%
90%
100%
Figure 7: Female full-time employment rate, 2000-2013
2000
2012
2013
Source: OECD
9
March 2015 International Women's Day
PwC
Comparisons with other measures
10
March 2015 International Women's Day
PwC
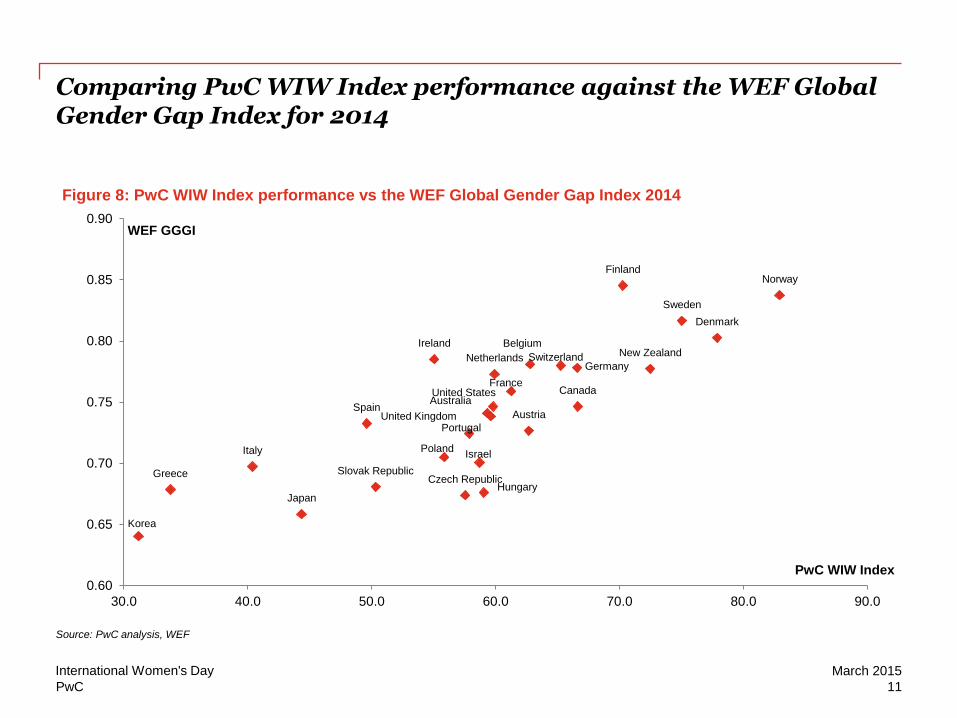
Comparing PwC WIW Index performance against the WEF Global Gender Gap Index for 2014
Australia
Austria
Belgium
Canada
Czech Republic
Denmark
Finland
France
Germany
Greece
Hungary
Ireland
Israel Italy
Japan
Korea
Netherlands New Zealand
Norway
Poland
Portugal
Slovak Republic
Spain
Sweden
Switzerland
United Kingdom
United States
0.60
0.65
0.70
0.75
0.80
0.85
0.90
30.0 40.0 50.0 60.0 70.0 80.0 90.0
WEF GGGI
PwC WIW Index
Figure 8: PwC WIW Index performance vs the WEF Global Gender Gap Index 2014
Source: PwC analysis, WEF
11
March 2015 International Women's Day

PwC
WEF Global Gender Gap Index 2014 The average performance of OECD countries on the Global Gender Gap Index has improved between 2013 and 2014, with the biggest gains made in France, Denmark and Germany. The Nordic countries remain in the lead.
0.60
0.65
0.70
0.75
0.80
0.85
0.90
Figure 9: WEF Global Gender Gap Index, 2014 vs 2013
2014
2013
Source: WEF Global Gender Gap report 2014
12
March 2015 International Women's Day
PwC
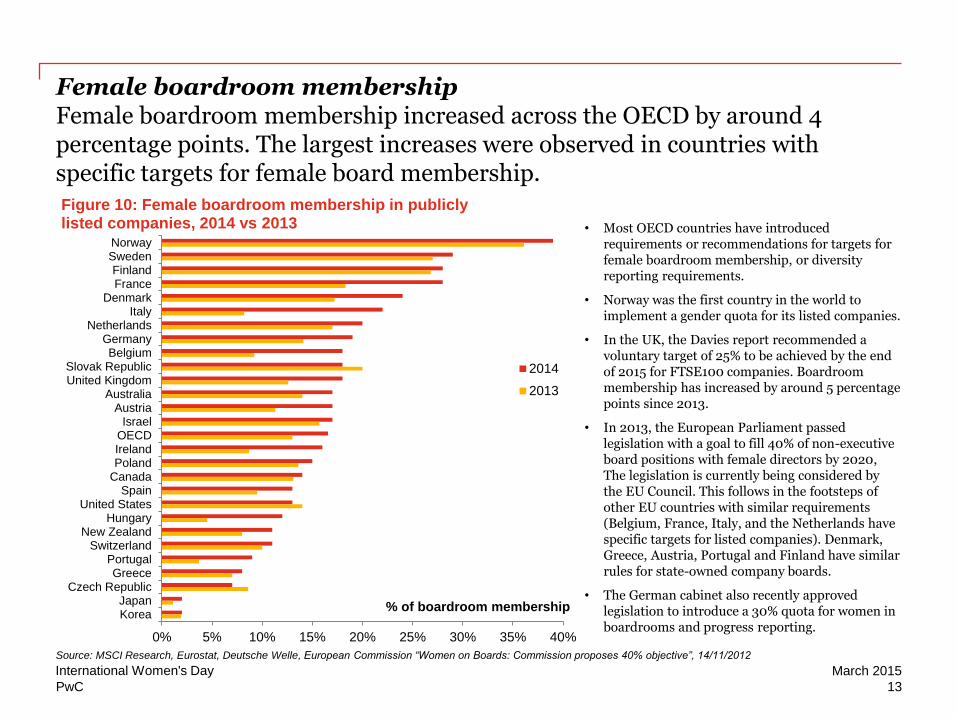
Female boardroom membership Female boardroom membership increased across the OECD by around 4 percentage points. The largest increases were observed in countries with specific targets for female board membership.
0% 5% 10% 15% 20% 25% 30% 35% 40%
NorwaySwedenFinlandFrance
DenmarkItaly
NetherlandsGermanyBelgium
Slovak RepublicUnited Kingdom
AustraliaAustria
IsraelOECDIrelandPoland
CanadaSpain
United StatesHungary
New ZealandSwitzerland
PortugalGreece
Czech RepublicJapanKorea
% of boardroom membership
Figure 10: Female boardroom membership in publicly listed companies, 2014 vs 2013
2014
2013
• Most OECD countries have introduced requirements or recommendations for targets for female boardroom membership, or diversity reporting requirements.
• Norway was the first country in the world to implement a gender quota for its listed companies.
• In the UK, the Davies report recommended a voluntary target of 25% to be achieved by the end of 2015 for FTSE100 companies. Boardroom membership has increased by around 5 percentage points since 2013.
• In 2013, the European Parliament passed legislation with a goal to fill 40% of non-executive board positions with female directors by 2020, The legislation is currently being considered by the EU Council. This follows in the footsteps of other EU countries with similar requirements (Belgium, France, Italy, and the Netherlands have specific targets for listed companies). Denmark, Greece, Austria, Portugal and Finland have similar rules for state-owned company boards.
• The German cabinet also recently approved legislation to introduce a 30% quota for women in boardrooms and progress reporting.
Source: MSCI Research, Eurostat, Deutsche Welle, European Commission “Women on Boards: Commission proposes 40% objective”, 14/11/2012
13
March 2015 International Women's Day
PwC
Technical appendix: Data and methodology
14
March 2015 International Women's Day
PwC
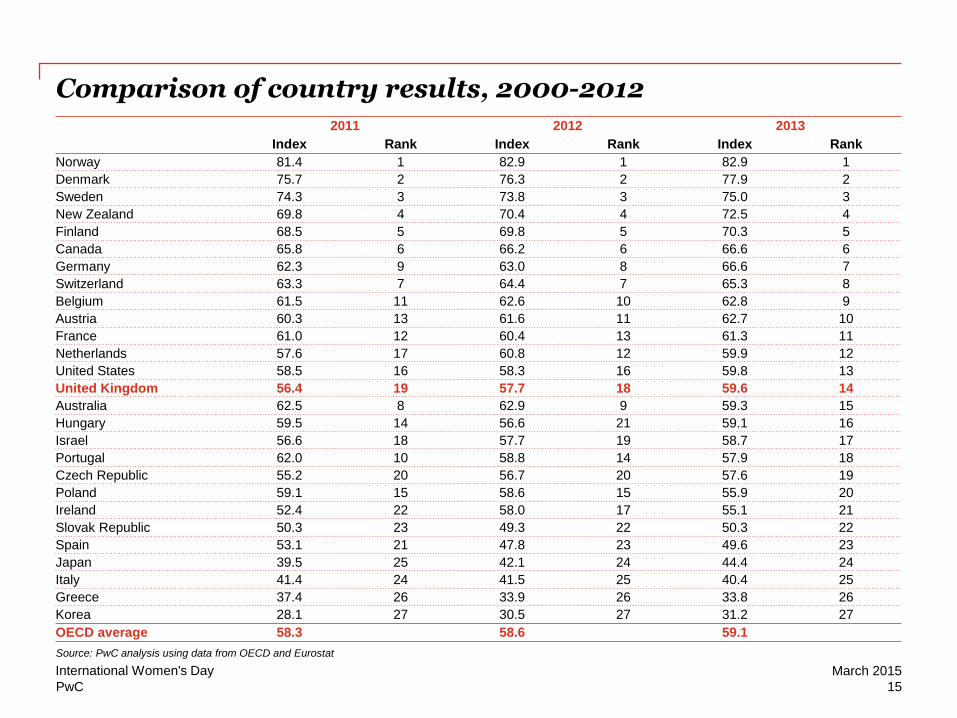
Comparison of country results, 2000-2012
2011 2012 2013
Index Rank Index Rank Index Rank
Norway 81.4 1 82.9 1 82.9 1
Denmark 75.7 2 76.3 2 77.9 2
Sweden 74.3 3 73.8 3 75.0 3
New Zealand 69.8 4 70.4 4 72.5 4
Finland 68.5 5 69.8 5 70.3 5
Canada 65.8 6 66.2 6 66.6 6
Germany 62.3 9 63.0 8 66.6 7
Switzerland 63.3 7 64.4 7 65.3 8
Belgium 61.5 11 62.6 10 62.8 9
Austria 60.3 13 61.6 11 62.7 10
France 61.0 12 60.4 13 61.3 11
Netherlands 57.6 17 60.8 12 59.9 12
United States 58.5 16 58.3 16 59.8 13
United Kingdom 56.4 19 57.7 18 59.6 14
Australia 62.5 8 62.9 9 59.3 15
Hungary 59.5 14 56.6 21 59.1 16
Israel 56.6 18 57.7 19 58.7 17
Portugal 62.0 10 58.8 14 57.9 18
Czech Republic 55.2 20 56.7 20 57.6 19
Poland 59.1 15 58.6 15 55.9 20
Ireland 52.4 22 58.0 17 55.1 21
Slovak Republic 50.3 23 49.3 22 50.3 22
Spain 53.1 21 47.8 23 49.6 23
Japan 39.5 25 42.1 24 44.4 24
Italy 41.4 24 41.5 25 40.4 25
Greece 37.4 26 33.9 26 33.8 26
Korea 28.1 27 30.5 27 31.2 27
OECD average 58.3 58.6 59.1
Source: PwC analysis using data from OECD and Eurostat
15
March 2015 International Women's Day
PwC
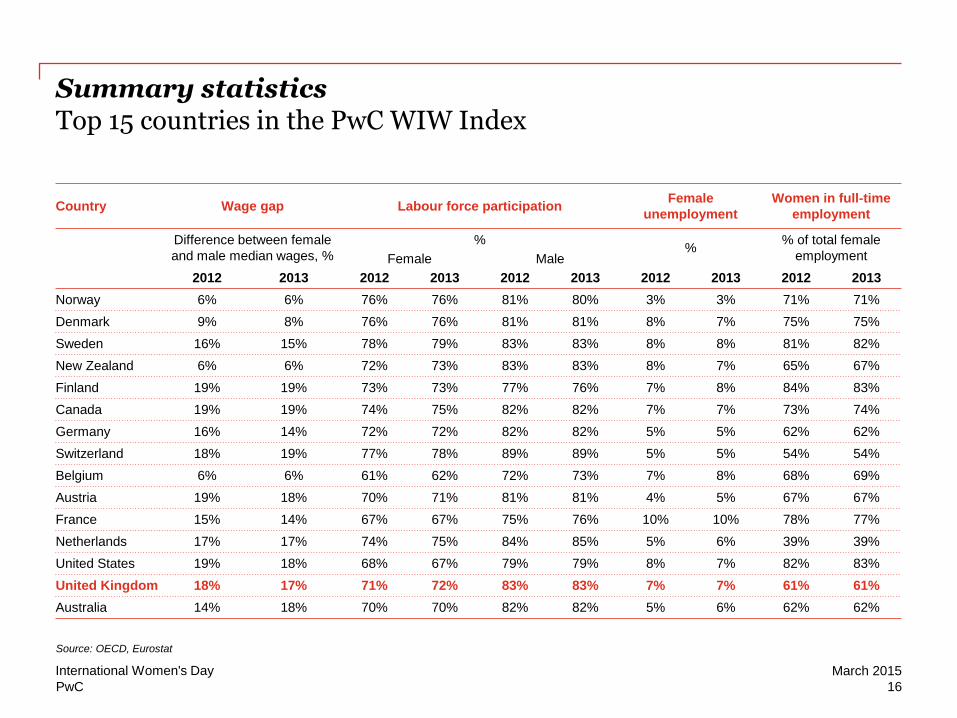
Summary statistics Top 15 countries in the PwC WIW Index
Country Wage gap Labour force participation Female
unemployment
Women in full-time
employment
Difference between female
and male median wages, %
% %
% of total female
employment Female Male
2012 2013 2012 2013 2012 2013 2012 2013 2012 2013
Norway 6% 6% 76% 76% 81% 80% 3% 3% 71% 71%
Denmark 9% 8% 76% 76% 81% 81% 8% 7% 75% 75%
Sweden 16% 15% 78% 79% 83% 83% 8% 8% 81% 82%
New Zealand 6% 6% 72% 73% 83% 83% 8% 7% 65% 67%
Finland 19% 19% 73% 73% 77% 76% 7% 8% 84% 83%
Canada 19% 19% 74% 75% 82% 82% 7% 7% 73% 74%
Germany 16% 14% 72% 72% 82% 82% 5% 5% 62% 62%
Switzerland 18% 19% 77% 78% 89% 89% 5% 5% 54% 54%
Belgium 6% 6% 61% 62% 72% 73% 7% 8% 68% 69%
Austria 19% 18% 70% 71% 81% 81% 4% 5% 67% 67%
France 15% 14% 67% 67% 75% 76% 10% 10% 78% 77%
Netherlands 17% 17% 74% 75% 84% 85% 5% 6% 39% 39%
United States 19% 18% 68% 67% 79% 79% 8% 7% 82% 83%
United Kingdom 18% 17% 71% 72% 83% 83% 7% 7% 61% 61%
Australia 14% 18% 70% 70% 82% 82% 5% 6% 62% 62%
Source: OECD, Eurostat
16
March 2015 International Women's Day
PwC
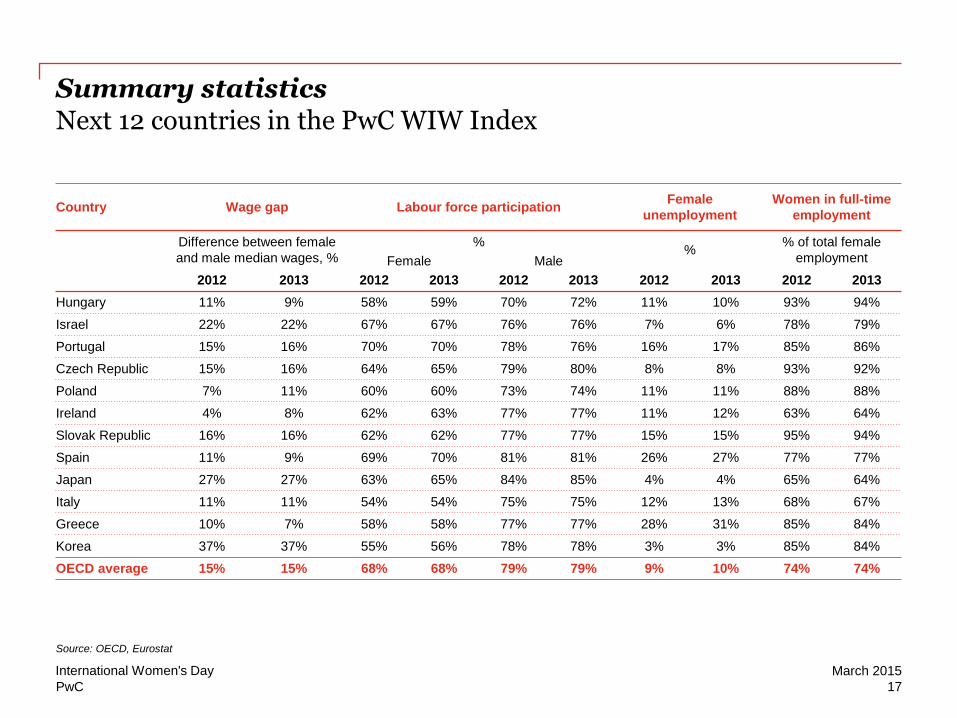
Summary statistics Next 12 countries in the PwC WIW Index
Country Wage gap Labour force participation Female
unemployment
Women in full-time
employment
Difference between female
and male median wages, %
% %
% of total female
employment Female Male
2012 2013 2012 2013 2012 2013 2012 2013 2012 2013
Hungary 11% 9% 58% 59% 70% 72% 11% 10% 93% 94%
Israel 22% 22% 67% 67% 76% 76% 7% 6% 78% 79%
Portugal 15% 16% 70% 70% 78% 76% 16% 17% 85% 86%
Czech Republic 15% 16% 64% 65% 79% 80% 8% 8% 93% 92%
Poland 7% 11% 60% 60% 73% 74% 11% 11% 88% 88%
Ireland 4% 8% 62% 63% 77% 77% 11% 12% 63% 64%
Slovak Republic 16% 16% 62% 62% 77% 77% 15% 15% 95% 94%
Spain 11% 9% 69% 70% 81% 81% 26% 27% 77% 77%
Japan 27% 27% 63% 65% 84% 85% 4% 4% 65% 64%
Italy 11% 11% 54% 54% 75% 75% 12% 13% 68% 67%
Greece 10% 7% 58% 58% 77% 77% 28% 31% 85% 84%
Korea 37% 37% 55% 56% 78% 78% 3% 3% 85% 84%
OECD average 15% 15% 68% 68% 79% 79% 9% 10% 74% 74%
Source: OECD, Eurostat
17
March 2015 International Women's Day
PwC
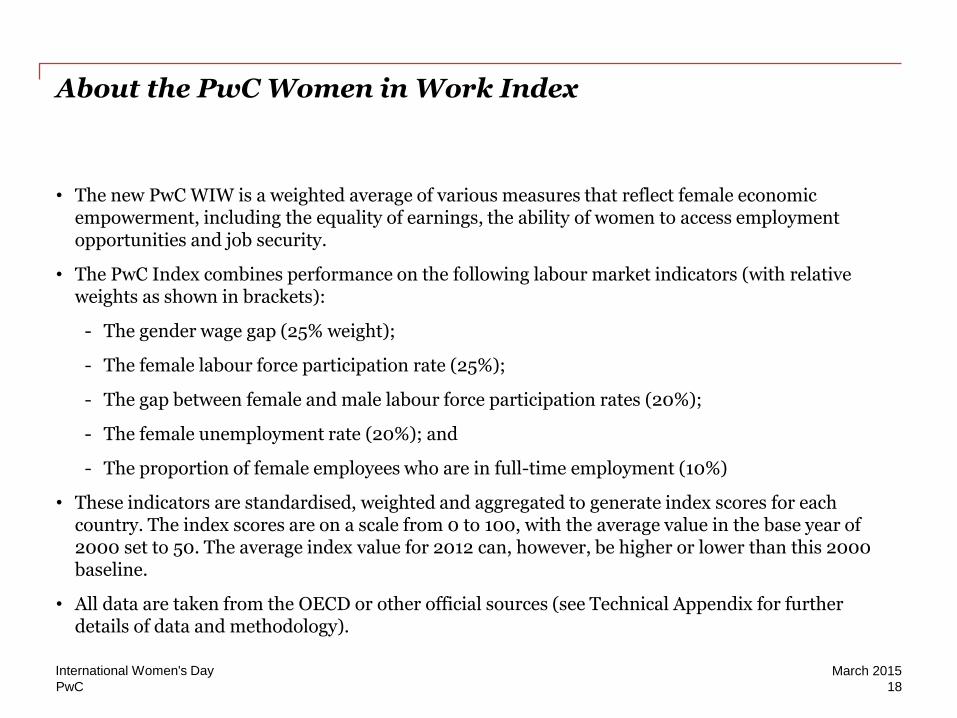
About the PwC Women in Work Index
• The new PwC WIW is a weighted average of various measures that reflect female economic empowerment, including the equality of earnings, the ability of women to access employment opportunities and job security.
• The PwC Index combines performance on the following labour market indicators (with relative weights as shown in brackets):
- The gender wage gap (25% weight);
- The female labour force participation rate (25%);
- The gap between female and male labour force participation rates (20%);
- The female unemployment rate (20%); and
- The proportion of female employees who are in full-time employment (10%)
• These indicators are standardised, weighted and aggregated to generate index scores for each country. The index scores are on a scale from 0 to 100, with the average value in the base year of 2000 set to 50. The average index value for 2012 can, however, be higher or lower than this 2000 baseline.
• All data are taken from the OECD or other official sources (see Technical Appendix for further details of data and methodology).
18
March 2015 International Women's Day

PwC
PwC WIW Index methodology Variables included in scoring
Variable Weight Factor Rationale
Gap between female
and male earnings 25%
Wider wage gap
penalised
Earnings equality underpins the fundamental principle of equal
pay for equal work.
Female labour force
participation rate 25%
Higher participation
rates given higher score
Female economic participation is the cornerstone of economic
empowerment, which is a factor of the level of skills and
education of women and conducive workplace conditions, and
broader cultural attitudes outside the workplace (e.g. towards
shared childcare and distribution of labour at home) .
Gap between female
and male labour
force participation
rates
20%
Higher female
participation rate relative
to male participation rate
given higher score
Equality in participation rates reflect equal opportunities to seek
and access employment opportunities in the workplace.
Female
unemployment rate 20%
Higher unemployment
penalised
The female unemployment rate reflects the economic
vulnerability of women. Being unemployed can have longer-
term impacts in the form of skills erosion, declining pension
contributions and increased reliance on benefits.
Share of female
employees in full-
time employment
10%
Higher share of full-time
employment given
higher score
The tendency for part-time employment may adversely affect
earnings, pensions and job security. But given a lower weight in
the index since some women may prefer part-time jobs to fit
flexibly with caring roles.
19
March 2015 International Women's Day

PwC
PwC WIW Index methodology
Data sources
Labour market data obtained for 2013, except where specified. All data provided by the OECD with the exception of comparable data on the wage gap, which were obtained from Eurostat for the following countries: France, Netherlands and Switzerland.
Methodological differences account for differences between data on the gender wage gap reported by the OECD and by other sources, notably Eurostat. The OECD wage gap (used in our analysis) measures the difference in median earnings for all male and female full-time employees in all sectors, whereas the headline Eurostat wage gap measures the difference in mean hourly earnings for all male and female employees for all sectors except agriculture and public administration.
Scoring methodology
• Indicators are standardised using the z-score method, based on the mean and standard deviation of the sample of 27 countries in 2000, to allow for comparisons across countries and across time for each country. This is a standard method used by PwC and others for many other such indices.
• Positive/negative factors were applied for each variable based on the table on the previous slide.
• The scores are constructed as a weighted average of normalised labour market indicator scores.
• Finally, the scores are rescaled to form the PwC Index with values between 0 and 100 and an average value across all 27 countries set by definition to 50 in 2000.
20
March 2015 International Women's Day
Contacts
This publication has been prepared for general guidance on matters of interest only, and does
not constitute professional advice. You should not act upon the information contained in this
publication without obtaining specific professional advice. No representation or warranty
(express or implied) is given as to the accuracy or completeness of the information contained
in this publication, and, to the extent permitted by law, PricewaterhouseCoopers LLP, its
members, employees and agents do not accept or assume any liability, responsibility or duty of
care for any consequences of you or anyone else acting, or refraining to act, in reliance on the
information contained in this publication or for any decision based on it.
© 2015 PricewaterhouseCoopers LLP. All rights reserved. In this document, "PwC" refers to
the UK member firm, and may sometimes refer to the PwC network. Each member firm is a
separate legal entity. Please see www.pwc.com/structure for further details.
For more information about this report please contact:
Yong Jing Teow ([email protected])
John Hawksworth ([email protected])
Our Economics and Policy practice offers a wide range of services covering: market reform in a range of industry sectors (including energy, water, media and telecoms, financial services, health and government services); competition policy, disputes and other investigations; economic, social and environmental impact analysis; financial economics; fiscal policy and macroeconomics.
For more information about these services please visit our website: www.pwc.co.uk/economics
Our other published economic research is available from: http://www.pwc.co.uk/the-economy/index.jhtml