international trade in parts, components, and final goods ... · pdf fileical seals, sewing...
TRANSCRIPT

International Trade in Parts, Components, and FinalGoods: Who Trades What with Whom?
Martin Bresslein∗ Stephan Huber†
WORK IN PROGRESSNovember 2016
Abstract
We explore globally fragmented trade patterns of European countries using a novelscheme that permits the categorization of manufactured trade into parts, componentsand final goods. We find among others that income differences between exporter andimporter can explain patterns of fragmented trade.
Keywords: International Trade; Fragmentation of Production; Parts and Components.
Acknowledgments The authors would like to thank the Institute for East and SoutheastEuropean Studies for generously sharing the VDMA data.
1 IntroductionInternational vertical integration is an essential characteristic of modern world trade. Theproduction of a final good follows in a sequential process that is increasingly broken downinto different stages and distributed globally.1 Thus, the reasons and consequences of thenew nature of trade were discussed intensively in the literature by using different buzzwords,such as Slicing the value chain (Krugman et al., 1995), outsourcing (Feenstra and Hanson,1996), disintegration of production (Feenstra, 1998), vertical specialization (Hummels et al.,1998, 2001), fragmentation (Jones and Kierzkowski, 2001; Arndt and Kierzkowski, 2001),production sharing (Yeats, 2001), it’s not wine for cloth anymore, trading tasks (Grossmanand Rossi-Hansberg, 2008, 2006), new global division of labor (Marin, 2006), offshoring(Blinder, 2006), the intensive and extensive margins of international trade (Helpman et al.,2008; Chaney, 2008), or global value chains (Gereffi et al., 2005).∗Bundesnetzagentur for Electricity, Gas, Telecommunications, Post and Railway, mar-
[email protected]. Research was performed while at the University of Trier.†Corresponding Author; University of Regensburg, [email protected] and Menon (2010) report nearly a triplication of worldwide trade in parts and components
from $527 billion in 1992/3 to $1652 billion in 2004/5. This corresponds to an increase of trade in parts andcomponents as a share of total manufacturing trade from 20.9% to 24.2%.
1

Despite their differences, these studies describe a globalizing world in terms of marketliberalization, political integration, and less trade impediments. However, the rise in interna-tional vertical fragmentation of the production process is usually documented by consideringmanufactured goods to be either parts and components, or final goods. In this paper, wetake a step forward by further subdividing trade of parts and components into trade in partsand trade in components using a scheme that was exclusively provided to us by expertsfrom the German Engineering Association (VDMA). Their scheme permits the declarationof goods at the Combined Nomenclature trade categorization scheme at the 8-digit level.We use Eurostat’s COMEXT database to look on bilateral export and import flows over theperiod from 2000 to 2014. This scheme was only used once by Huber and Nguyen Than(2016) who found that imports of parts and components are causal for the export of finalgoods.
Three questions lead our empirical analysis: Are countries specialized in parts, compo-nents, and final goods? With whom do countries trade parts, components, and final goods?And, do income differences between exporting and importing countries play a role in ex-plaining trade in parts, components, and final goods? Although disputable, most theorypapers predict more developed countries to specialize in later stages of the supply chain(Costinot et al., 2013; Fieler, 2011; Fajgelbaum et al., 2011, see). Empirically this questionwas only raised by Hallak (2006, 2010) by looking on the quality of traded goods findingthat more developed countries provide higher-quality goods and that rich and poor countriesmostly trade among themselves. However, to our best knowledge we were are the first thatdistinguishes a trisection of goods at different production stages.
After characterizing the development of trade in parts, components, and final goodsfor the EU member countries, we examine these features in two ways: First, we apply asimple measure to the data which relates the average gross domestic product per capita of acountry’s trading partners to its own GDP per capita. Calculating this measure for differentkinds of products allows us to examine with whom countries trade at different stages of thesupply chain. Second, we introduce income difference as an explanatory variable into gravityestimations.
In a nutshell, our four main result are as follows: First, intermediate products are animportant part of manufacturing trade. Second, we document that all EU member countriesare active at all stages of the supply chain. Third, we find that while rich EU countries dotrade mostly with similarly developed countries, poorer EU countries trade with countriesconsiderably richer than they are. Fourth, these patterns differ for parts, components, andfinal goods.
The remainder is structured as follows. In section 2, we describe the novelty of thedataset and the development of the EU countries’ trade in parts, components and finalgoods. Section 3 introduces the measure to capture the level of development of a country’strading partners as well as the hypotheses examined. Section 4 shows the results from theTPD calculations as well as from the gravity estimations. Section 5 concludes.
2

2 Trade Composition and its DevelopmentClassify trade into parts, components, and final goods In order to classify inter-national trade flows into a trisection of parts, components, and final goods, we use a novelclassification scheme provided exclusively by experts from the German Engineering Asso-ciation (VDMA). This scheme allows to distinguish manufacturing goods at the CombinedNomenclature (CN) 8-digit level. We identify 225 parts, 301 components, and 965 finalgoods. All 14055 goods not classified according to this scheme are labeled as “other goods”.The class of goods classified as parts contains, for example, electronic instruments, mechan-ical seals, sewing machine needles, or spinning rings. Goods that belong to the class ofcomponents are, for example, engines and motors, air conditioning machines, temperatureregulators, or articulated shafts. Goods that are classified as final goods are, for example,gas turbines, diggers, lifts, or mobile cranes.
The classification into a trisection of goods requires a high level of disaggregation. Theonly trade data set that records (European) trade at the CN 8-digit level is Eurostat’sCOMEXT database from the year 2000 forward2. It is important to note that not allcountries export and import the same share of their total exports and imports in parts,components, and final goods. Exports of parts, components, and final goods, as a sharetotal exports, range from under three percent in Greece to almost 20 percent in Italy in theyear 2014. The import share of parts, components, and final goods ranges from about fourpercent in Greece to about 13 percent in Hungary. Changes in import and export shares ofparts, components, and final goods in total trade are rather small, although, for example,the share of exports of parts, components, and final goods in total trade has increased bymore than six percent in Finland and Lithuania from 2000 to 2014. In contrast, the shareof imports of parts, components, and final goods in total imports decreased by about fourpercent in Greece, Cyprus and Malta. Interestingly, only five countries have recorded adecrease in exports of parts, components, and final goodsas a share of total exports - andonly for Cyprus the decrease exceeded 1.5% - while 14 countries display a decrease of importsof parts, components, and final goodsas a share of total imports.3
To start our descriptive exercise, we first sketch some facts about the development ofoverall trade for the EU-27 countries. Afterwards, we look more closely at trade in parts,components and final goods according to the VDMA scheme.
Trade has been growing at healthy rates for most of the EU member countries overthe period covered here, with only Malta displaying a negative growth rate for exports.4Overall, total exports of the EU 27 countries have been growing at just above 4%, whileimports have been growing at 3.74%. There are large discrepancies with respect to growthrates between the "old" and the "new" member states. In absolute values, exports as wellas imports of the EU 15 countries have increased more than those of the CEECs. However,relative growth of CEEC trade has exceeded growth of EU 15 trade considerably. Generally,
2Note that due to a lack of data early on, we are not able to include Croatia in our analysis.3A table displaying the share of exports and imports of parts, components, and final goodsas a share of
total exports and imports in 2014, as well as the respective changes from 2000 to 2014 can be found in theappendix.
4Table A2 of the appendix shows export and import values for the years 2000, 2014 and average annualgrowth rates.
3

exports have increased slightly more than imports. The difference in growth rates is muchmore pronounced for the CEECs, while it is almost negligible for the EU 15. Interestingly,no CEEC has seen imports grow at rates higher than exports, while this has been the casefor 6 states of the EU 15. Most of the CEECs have experienced average growth rates inexports above 10%, with only Hungary (7.45%) and Slovenia (7.89%) showing growth ratessignificantly below 10%. Lithuania, Latvia and Slovakia have had the highest growth rateswith more than 12%. For the EU 15, the picture is more uneven. While the Netherlands,Spain, Germany and Austria have seen their imports grow at rates above 4%, Finland andIreland have hardly had any growth in exports at all. With respect to imports, Lithuania,Slovakia, Romania and Bulgaria have experienced the highest growth rates of the CEECs atover 10%, while again, Hungary and Slovenia display the lowest rates at around 6%. TheNetherlands, Belgium and Austria have had the highest import growth rates of the EU 15at around 4%, while only Ireland has not had a growth rate of more than 2%.
Figure 2 depicts the export and import composition and its development for the EU-27countries. The share of trade for country i in parts, components, and final goodsis definedas follows:
Sgi =
(T g
i
(T •i − T oi ) · 100
)∀g ∈ {p, c, f} ,
where T gi denotes either the exports, Xg
i , or the imports, M gi , of country i in the good
category g. T •i denotes the total sum of trade, ∑g Tgi . The change from the year 2000 to
2014 is marked by an arrow.5Here, a more nuanced picture emerges.6 Overall, the share of final goods in exports
as well as imports is considerably larger for all EU countries than the shares of parts andcomponents. The shares have not changed much over the 15 years of data for the EU 27aggregates, with changes below 2% in either direction. However, the aggregate values seemto be largely driven by the EU 15, and there are some interesting differences when lookingat individual countries. For example, parts made up only 10% of Cyprus’ exports, whereasthey made up 35% of Czech Republic’s exports in 2000. Components made up only 2%of Cyprus’ exports and 6% of Greece’s exports, whereas they made up 37% of Portugal’sexports and 32% of Slovakia’s exports in 2000. Furthermore, the share of parts was only15% in Slovenia’s imports, while it was 30% in Slovakia’s imports.
When looking at the changes in relative importance, we can also observe large differencesbetween the countries. For example, whereas for countries such as Bulgaria, Poland orFrance, there was no change in the importance of exports in parts, exports in parts made up9 percentage points less for the Czech Republic and the Netherlands in 2014 than in 2000.In contrast, the share of parts in exports increased by 8 percentage points in Latvia and by7 percentage points in Belgium. When looking at components, the changes are even larger.Only for Belgium there has been almost no change in the share of components in exports,whereas the share decreased by 14 percentage points in Latvia and by 9 percentage pointsin Bulgaria, while it increased by 9 percentage points in Romania and Finland. There havealso been equally large changes with respect to the shares of final goods in exports.
5The corresponding numbers can be found in table A5 in the appendix.6We neglect Cyprus and Malta in the analysis to a certain degree, since they are quite small in terms of
importance for EU trade and the global value chain and changes are disproportionately pronounced.
4

(a) Exports
AUTBELBGRCYPCZEDEUDNKESPESTFIN
FRAGBRGRCHUN
IRLITA
LTULUXLVAMLTNLDPOLPRTROUSVKSVNSWE
0 50 100 0 50 100 0 50 100
Part Component Final Good
(b) Imports
AUTBELBGRCYPCZEDEUDNKESPESTFIN
FRAGBRGRCHUN
IRLITA
LTULUXLVAMLTNLDPOLPRTROUSVKSVNSWE
0 20 40 60 80 0 20 40 60 80 0 20 40 60 80
Part Component Final Good
Figure 1: Shares of Exports and Imports in Parts, Components and Final GoodsShare of parts, components, and final goods is defined for each country i as follows:
(X
gi
(X•i
−Xoi
) · 100)∀g ∈ {p, c, f}. The
change from the year 2000 to 2014 is marked by the arrow.
5

Looking at imports, a picture of similar differences emerges. In contrast to exports, theshare of parts in imports increased for most EU countries. While it has hardly changed forFrance and Bulgaria, it decreased considerably only for the UK and Lithuania, while increas-ing hugely for Romania, Hungary and Slovenia, and also quite robustly for Portugal, Finlandand Poland. Changes in the share of components in imports were much less pronounced atmostly below 2 percentage points in either direction. There have only been considerableincreases for Portugal, Spain, Denmark and Slovenia and significant decreases for Slovakia,the Netherlands and Luxembourg.
Overall, these figures show that, while no clear pattern emerges, separating intermediategoods into parts and components allows for a much more nuanced description of interna-tional trade which might allow for a better analysis of the global value chain. We observeconsiderable differences in the relative importance of different product groups for the differ-ent EU member countries. One key feature of the data is that all countries appear to beactive at all stages of value chains, exporting and importing intermediate and final productsto a large degree. In the next section, we will have a closer look at the degree of developmentof the countries’ trading partners.
3 Who Trades What, and With Whom?Apart from sketching how trade in parts, components and final goods developed in the EU,we aim to answer a more interesting question: With whom do countries trade parts, com-ponents, and final goods? As outlined in section 1, our analysis is based on the premisethat parts, components and final goods are traded within fragmented global supply chains(Hummels et al., 1998). The literature also documents the importance of vertical specializa-tion and, consequently, that the extent of fragmentation has been growing (see Hummels etal., 2001; Feenstra and Hanson, 1996; Hanson et al., 2005). Several facts of the theoreticaland empirical literature on fragmentation are worth noting. Firstly, rich countries tend tospecialize in later stages of the supply chain. Costinot et al. (2013) imply that consequently,rich countries also trade more among themselves, importing inputs from and exporting out-puts to other rich countries. Accordingly, poor countries also trade more with each other(Hallak, 2010). Secondly, rich countries have preferences for higher-quality goods. This isthe basic starting point of several models on fragmented international production such asFieler (2011) or Fajgelbaum et al. (2011). They also assume that rich countries are betterat producing high-quality goods, rationalized for example by a ‘home-market’ effect (Fajgel-baum et al., 2011). These assumptions are based on empirical findings, e.g. by Hallak (2006).However, the question remains how the different stages within the supply chain and thuscountries’ trade links come together. With our novel classified trade data, we can examinethese patterns for the EU member countries and answer several related questions.
However, we need a measure to capture the stage of development of a countries’ tradingpartners. We thus develop a simple measure that combines trade flows categorized into parts,components and final goods with GDP per capita to reveal the average level of developmentof a country i’s trade partners (j) relative to a country’s own level of development. We callthis measure the Average Relative Trading Partner Development Level (TPD):
6

TPDT,gi =
J∑j=1
T gij
T gi•
Yj
Yi
, (1)
where Yi and Yj denote the real GDP per capita of exporting country i and importing countryj. T g
ij denotes either the exports of country i to country j in good category g, Xgij, or the
imports of country i from country j in good category g,M gij. T
gi• abbreviates, either the total
exports of country i, ∑j Xij, or the total imports of country i, ∑j Mij. The trade category,g, represents trade in parts (p), components (c), final goods (f), other goods (o), or totaltrade (pcfo).
By construction, the ratio increases with the average level of development of a country’strading partners, given a certain level of one’s own development.7 A value smaller than onemeans that, on average, the country trades more with countries less developed than itself,while a value higher than one means that, on average, a country trades more with countriesmore developed than itself.
Armed with this measure, we aim to explore descriptive evidence on how countries arepositioned within the global supply chain. As already indicated, there are several hypothesesthat can be investigated. Firstly, if countries tend to trade mostly with other countries at asimilar stage of development, we should observe TPD values close to one for each categoryof goods.
However, there is more that we can examine with the data and measure at hand. Everycountry produces goods with a certain quality level. The theoretical models mentionedabove imply that richer countries produce at higher quality levels than poorer countries. Inorder to produce high-quality goods, they need inputs of a certain quality level, combinedwith a certain production technology. This, in turn, implies that the number of possibleinput providers is limited and TPD values for imports are expected to be high. However,although if rich countries’ preferences are skewed towards high-quality goods, we shouldobserve similarly high TPD values for exports, higher-quality goods might also be sold topoorer countries - since there also is a part of the population with the income to demandthem. This would imply a bigger variety of export destinations in terms of income fromwhich our first proposition follows:
• Proposition:TPDx,g < TPDm,g ∀g ∈ {p, c, f}
At every stage of production, a country imports from richer countries compared to those itexports to. Again, while a country needs inputs of a certain quality level that matches itsproduction technology to attain a certain quality level of output, there is no such limit withrespect to the destinations where the goods are demanded.
Further assuming that parts are used to produce components and final goods, whilecomponents are also used to produce final goods, this line of argument implies the followingfurther propositions:
7Unfortunately, we were not able to find a suitable normalization. Given a certain level of GDP per capitaof country i and its trading partners, the ratio decreases if all countries experience an increase in GDP percapita.
7

• Proposition:TPDx,p > TPDx,c > TPDx,f
• Proposition:TPDm,p > TPDm,c > TPDm,f
.
The further the stage of the production process, the less rich a country’s trading partnersare, on average. High-quality parts have to be sourced from countries able to produce them.Goods at a subsequent stage of the production process are then exported to a larger varietyof countries. We expect the difference between parts and final goods as well as componentsand final goods to be more clear-cut than between parts and components. For imports,the picture should be similar. Final goods are sourced from a greater variety of tradingpartners at a greater variety of quality levels than imported parts and components used toassemble final goods of a certain quality level. However, since parts are also used to producecomponents, there should also be a difference between the level of development of a country’ssources for parts and components, respectively. These propositions are in line with Hallak(2010) and Costinot et al. (2013), but add a layer due to the more nuanced classification ofgoods at hand.
GDP Data Data on GDP per capita as well as the appropriate deflators are sourced fromthe IMF’s World Economic Outlook database.
4 ResultsOur propositions are largely confirmed by the results displayed in tables 1 and 2, with aslight exception when comparing TPD values for the exports of parts and components.Table 1 shows the actual values for our TPD measure. It is interesting to note that thenotion of countries with similar levels of development trading more among each other canonly be partially confirmed by the data. Looking at EU15 countries, they indeed mostlydisplay TPD values close to one except for Luxembourg. However, a lot of the CEECsdisplay TPD values considerably higher than one (and none of them values below one).These values indicate that, on average, the CEECs trade with countries considerably richerthan they are, which holds for both exports and imports. On the one hand, this findingmight speak against earlier findings and the theoretical model of Costinot et al. (2013). Onthe other hand, and possibly more likely, it documents the degree of integration among EUmember countries and may suggest that within highly integrated regions, the notion mightnot hold per se.8 However, due to a lack of data for non-EU countries, we cannot explorethis issue further.
To facilitate relating the TPD values to our propositions, table 2 displays whether theconditions from the propositions are fulfilled. Columns (7)-(9) refer to proposition (1),columns (1)-(3) to proposition (2) and columns (4)-(6) to proposition (3). A value of one in
8The latter interpretation is supported by results displayed in table A6, which shows TPD values calcu-lated for intra-EU trade only.
8

Table 1: Trade Partner Development (mean over 2000-2014)
(1) (2) (3) (4) (5) (6) (7) (8) (9)i T P Dpcfo,•
i T P Dp,xi T P Dp,m
i T P Dc,xi T P Dc,m
i T P Df,xi T P Df,m
i T P Do,xi T P Do,m
i
AUT .824 .735 .813 .76 .871 .717 .858 .762 .796BEL .984 .804 .919 .849 .901 .834 .896 .896 .893BGR 6.58 6.304 7.326 7.245 7.034 5.38 7.231 6.396 5.394CYP 1.159 .645 1.271 .982 1.207 .929 1.155 1.006 1.082CZE 2.196 2.264 2.428 2.097 2.332 2.045 2.319 2.071 1.937DEU .841 .79 .881 .8 .898 .765 .892 .855 .819DNK .727 .638 .708 .665 .666 .667 .704 .711 .687ESP 1.328 1.09 1.314 1.157 1.251 1.014 1.222 1.169 1.093EST 2.928 3.135 3.144 2.101 3.035 2.415 3.028 2.8 2.454FIN .864 .694 .846 .7 .895 .638 .882 .751 .743FRA .928 .774 .928 .809 .922 .772 .906 .836 .839GBR 1.004 .846 .947 .865 .892 .833 .89 .93 .868GRC 1.583 1.046 1.606 1.05 1.461 1.016 1.451 1.329 1.239HUN 2.694 3.204 3.272 2.798 3.06 2.968 3.135 2.753 2.482IRL .756 .741 .781 .737 .768 .712 .769 .777 .752ITA 1.053 .871 1.047 .945 1.037 .861 1.033 .991 .888LTU 3.238 2.164 3.838 2.032 3.273 2.429 3.512 2.806 2.41LUX .355 .338 .413 .351 .402 .372 .425 .407 .377LVA 3.107 2.738 3.618 2.419 3.321 2.774 3.521 2.982 2.648MLT 1.99 1.881 1.961 2.214 1.909 1.797 1.785 1.868 1.825NLD .818 .701 .816 .746 .805 .71 .746 .766 .664POL 3.582 3.598 3.781 3.428 3.524 3.257 3.666 3.231 3.063PRT 1.758 1.595 1.7 1.66 1.64 1.446 1.617 1.628 1.489ROU 5.918 6.148 6.694 6.229 6.413 5.994 6.703 5.88 5.223SVK 2.551 3.203 2.942 3.004 2.856 2.563 2.843 2.603 2.238SVN 1.213 1.609 1.469 1.503 1.678 1.258 1.684 1.352 1.514SWE .818 .707 .774 .748 .764 .724 .768 .777 .766
Trade Partner Development is defined as described in equation 1 on page 7. The dot (•) in T P Dpcfo,•i indicates that the TPD
is calculated for the sum of trade, which is exports plus imports.
9

Table 2: Truth Table
(1) (2) (3) (4) (5) (6) (7) (8) (9)T P Dp,x >T P Dc,x
T P Dp,x >T P Df,x
T P Dc,x >T P Df,x
T P Dp,m >T P Dc,m
T P Dp,m >T P Df,m
T P Dc,m >T P Df,m
T P Dp,x <T P Dp,m
T P Dc,x <T P Dc,m
T P Df,x <T P Df,m
AUT 0 1 1 0 0 1 1 1 1BEL 0 0 1 1 1 1 1 1 1BGR 0 1 1 1 1 0 1 0 1CYP 0 0 1 1 1 1 1 1 1CZE 1 1 1 1 1 1 1 1 1DEU 0 1 1 0 0 1 1 1 1DNK 0 0 0 1 1 0 1 1 1ESP 0 1 1 1 1 1 1 1 1EST 1 1 0 1 1 1 1 1 1FIN 0 1 1 0 0 1 1 1 1FRA 0 1 1 1 1 1 1 1 1GBR 0 1 1 1 1 1 1 1 1GRC 0 1 1 1 1 1 1 1 1HUN 1 1 0 1 1 0 1 1 1IRL 1 1 1 1 1 0 1 1 1ITA 0 1 1 1 1 1 1 1 1LTU 1 0 0 1 1 0 1 1 1LUX 0 0 0 1 0 0 1 1 1LVA 1 0 0 1 1 0 1 1 1MLT 0 1 1 1 1 1 1 0 0NLD 0 0 1 1 1 1 1 1 1POL 1 1 1 1 1 0 1 1 1PRT 0 1 1 1 1 1 1 0 1ROU 0 1 1 1 0 0 1 1 1SVK 1 1 1 1 1 1 0 0 1SVN 1 1 1 0 0 0 0 1 1SWE 0 0 1 1 1 0 1 1 1
10

a certain cell means that the TPD values in table 1 fulfill the conditions, a value of zero meansthat the condition is not fulfilled. Overall, the results are quite encouraging. Support forproposition (1), that at every stage of production, import suppliers are, on average, richerthan export destinations, is especially strong. 22 countries fulfill the condition at everyproduction stage, while the other five countries do not fulfill the conditions only partially.These findings indeed suggest that countries need a certain quality of inputs to producegoods of an associated quality level, while also producing and exporting goods of the samestage that are sold to poorer countries - of either the same or a lower level of quality.
Looking at the results for conditions implied by propositions (2) and (3), the evidence isa bit more mixed. However, for most countries the conditions hold that, on average, exportdestinations as well as import sources are richer for production stages further up the valuechain. This certainly supports the view that there seems to be a step-wise relationship withinthe value chain between countries of different income levels. Rich countries need high-qualityinputs to produce final goods (but also components) of a certain quality level, thus tradinginputs mostly among themselves. In contrast, final goods also appear to be demanded byless-developed countries. A similar pattern, only at a lower level, can then be observed forless developed countries. The Czech Republic is a prime example where every condition fromour propositions is fulfilled, while only one condition is not fulfilled for a further 8 countriesand only two conditions are not fulfilled for 6 countries. For Poland, our propositions alsohold almost completely. This is especially interesting, since Poland and the Czech Republicare prime recipient countries of foreign direct investment, and our results would confirm astory that companies from richer source countries produce inputs there, e.g. for cost-savingreasons. There are also examples where our suggested patterns do not hold. For example,Latvia and Lithuania seem to export final goods to richer countries than they export partsand components to. As expected, this finding suggests that there is not one clear-cut storyand that the picture is much more complex. The only part of our propositions that doesnot seem to hold well is that countries to which parts are exported are, on average, richerthan those countries to which components are exported. Since both, parts and components,can be seen as inputs for final goods, this is not such a surprising result and we explore thisissue further below.
As described in section 3, one of the basic premises from the theoretical literature also isthat richer countries tend to specialize at later stages of the supply chain. If this is indeedthe case, it should be visible in the data. In order to examine this feature, we calculateproduct sophistication (PRODY ) indices for all goods (see Hausmann et al., 2007). Thisprocedure assigns an income/productivity level to each traded good. If more advancedcountries specialize at later stages of the supply chain, the distribution of PRODY valuesfor final goods should be centered at a visibly higher level than the distribution of PRODYvalues for parts and components. As figure 2 reveals, the picture is rather blurred. There isno clear pattern, which leads us to conclude that most countries participate at all stages ofthe global supply chain providing various levels of sophistication.
We can now go a step further in our analysis of fragmentation and global supply chains.In the preceding part, we were able to establish that average trading partners of a countryare richer the further up the supply chain goods are traded. We were also able to establishthat at a certain level of the supply chain, the average import sources are richer than theaverage export destinations. However, we are also interested in examining the directions of
11

Parts
Components
Final goods
Others
0 20000 40000 60000 80000 100000Product sophistication
Figure 2: Distributional Strip Plots of Product Sophistication by Category of GoodsIn the distributional strip-plots, each • denotes one good and a boxplot is shown below each distribution. Two goods are stackedwithin a band of 1000 in the product sophistication indicator.
12

trade within the supply chain more closely. To this end, we estimate a simple gravity modelakin to Kimura et al. (2007) introducing the difference between exporter- and importer-GDPper capita as an explanatory variable:
xgij = FEi + FEj + γ1ldistij + γ2Adjij + γ3ComLangij
+ β1(Yi − Yj) ∗D(=1 if (Yi−Yj)>0) + β2(Yi − Yj) ∗D(=1 if (Yi−Yj)<0) + ε (2)
mgij = FEi + FEj + γ1ldistij + γ2Adjij + γ3ComLangij
+ β1(Yi − Yj) ∗D(=1 if (Yi−Yj)>0) + β2(Yi − Yj) ∗D(=1 if (Yi−Yj)<0) + ε (3)
xgij (mg
ij) denotes country i’s exports to (imports from) country j in each category ofgoods g. FEi (FEj) are exporter (importer) fixed effects to capture all country-specificfactors influencing bilateral trade. Trade costs are captured by bilateral distance (ldistij),a dummy variable indicating if two countries share a border (Adjij) and a dummy variableindicating if two countries share a common language (ComLangij).9 The difference betweenthe degree of development of a country pair, is modeled as an interaction, once with a dummyvariable indicating a positive difference, (Yi−Yj) ∗D(=1 if (Yi−Yj)>0), and once with a dummyindicating a negative difference, (Yi − Yj) ∗ D(=1 if (Yi−Yj)<0). We use exports (imports) ineach category of goods g (parts, components, final goods and other goods) as well as totalexports (imports) as the dependent variable in turn. We also perform the same estimationsusing only the absolute income difference |Yi − Yj| as an explanatory variable instead of thetwo interactions.
To start with, these estimations allow us to further examine the assertion that countriesat similar stages of development mostly trade among themselves. If this is the case, we shouldnot observe any significant impact of the interaction terms. In contrast, if production pro-cesses are indeed fragmented internationally as, e.g., the literature on vertical FDI suggests,we expect to observe significant impacts. If we only used the absolute income difference asKimura et al. (2007) do, we would not be able to conclude the direction of trade. However,since this is a very interesting aspect of global production chains, our method appears tobe better-suited to catch these directions. There are also other testable hypotheses: Firstly,there is ample evidence for the presence of production chains and vertically motivated for-eign direct investment in the EU and globally, not least related also to "factory Asia" (seee.g., Baldwin and Lopez-Gonzalez, 2015). Combined with the notion that richer countriestend to specialize at later stages of the supply chain, we would expect that final goods aretraded disproportionately from higher-income countries to lower-income countries, and thusa positive and significant coefficient for the positive income difference between exporter andimporter for final good exports. If, in addition, we do not find significant differences for theimports of final goods, this would support proposition (1) as well. Secondly, if lower-incomecountries are specialized as suppliers of parts and/or components within the global supplychain, we would also expect reverse signs for exports in this category.10
9Data for all three variables are sourced from CEPII.10Note that, since there is no theoretical model from which our estimation equation is derived and we only
13
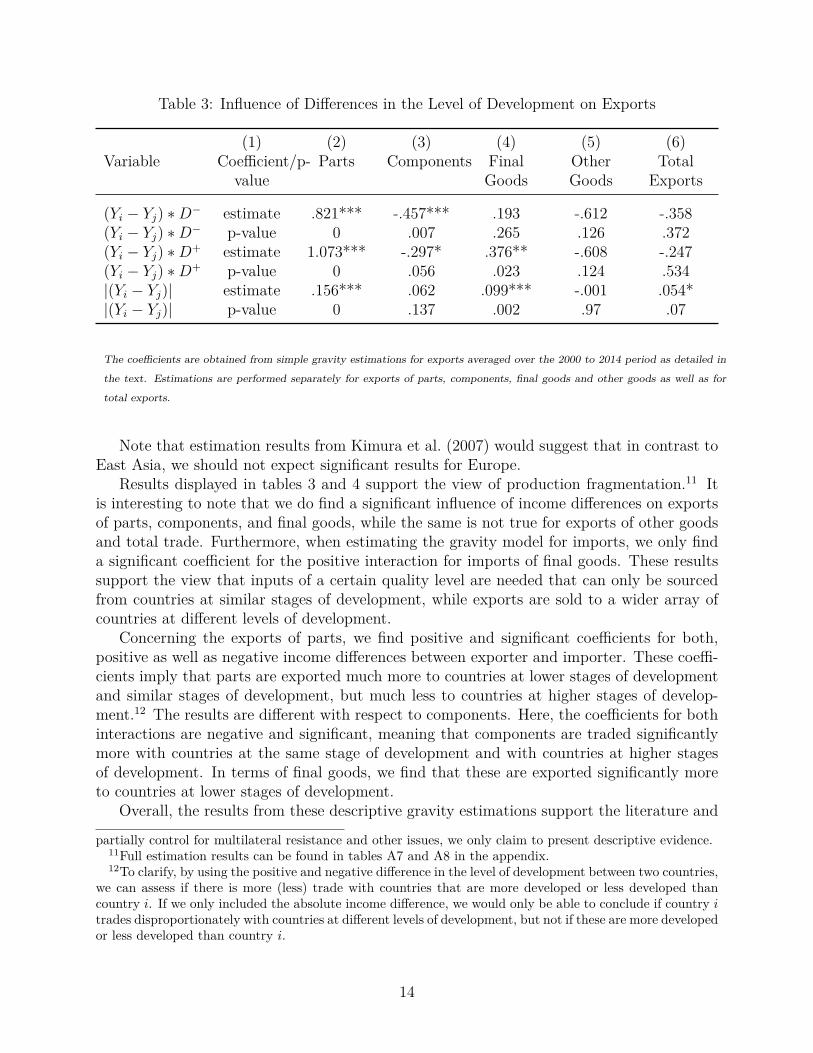
Table 3: Influence of Differences in the Level of Development on Exports
(1) (2) (3) (4) (5) (6)Variable Coefficient/p-
valueParts Components Final
GoodsOtherGoods
TotalExports
(Yi − Yj) ∗D− estimate .821*** -.457*** .193 -.612 -.358(Yi − Yj) ∗D− p-value 0 .007 .265 .126 .372(Yi − Yj) ∗D+ estimate 1.073*** -.297* .376** -.608 -.247(Yi − Yj) ∗D+ p-value 0 .056 .023 .124 .534|(Yi − Yj)| estimate .156*** .062 .099*** -.001 .054*|(Yi − Yj)| p-value 0 .137 .002 .97 .07
The coefficients are obtained from simple gravity estimations for exports averaged over the 2000 to 2014 period as detailed in
the text. Estimations are performed separately for exports of parts, components, final goods and other goods as well as for
total exports.
Note that estimation results from Kimura et al. (2007) would suggest that in contrast toEast Asia, we should not expect significant results for Europe.
Results displayed in tables 3 and 4 support the view of production fragmentation.11 Itis interesting to note that we do find a significant influence of income differences on exportsof parts, components, and final goods, while the same is not true for exports of other goodsand total trade. Furthermore, when estimating the gravity model for imports, we only finda significant coefficient for the positive interaction for imports of final goods. These resultssupport the view that inputs of a certain quality level are needed that can only be sourcedfrom countries at similar stages of development, while exports are sold to a wider array ofcountries at different levels of development.
Concerning the exports of parts, we find positive and significant coefficients for both,positive as well as negative income differences between exporter and importer. These coeffi-cients imply that parts are exported much more to countries at lower stages of developmentand similar stages of development, but much less to countries at higher stages of develop-ment.12 The results are different with respect to components. Here, the coefficients for bothinteractions are negative and significant, meaning that components are traded significantlymore with countries at the same stage of development and with countries at higher stagesof development. In terms of final goods, we find that these are exported significantly moreto countries at lower stages of development.
Overall, the results from these descriptive gravity estimations support the literature and
partially control for multilateral resistance and other issues, we only claim to present descriptive evidence.11Full estimation results can be found in tables A7 and A8 in the appendix.12To clarify, by using the positive and negative difference in the level of development between two countries,
we can assess if there is more (less) trade with countries that are more developed or less developed thancountry i. If we only included the absolute income difference, we would only be able to conclude if country itrades disproportionately with countries at different levels of development, but not if these are more developedor less developed than country i.
14

Table 4: Influence of Differences in the Level of Development on Imports
(1) (2) (3) (4) (5) (6)Variable Coefficient/p-
valueParts Components Final
GoodsOtherGoods
TotalImports
(Yi − Yj) ∗D− estimate .176 .137 .241 .388 .383(Yi − Yj) ∗D− p-value .516 .621 .394 .505 .53(Yi − Yj) ∗D+ estimate .485* .284 .616** .562 .626(Yi − Yj) ∗D+ p-value .061 .285 .025 .328 .298|(Yi − Yj)| estimate .162*** .078 .193*** .09** .125***|(Yi − Yj)| p-value .001 .124 0 .039 .006
The coefficients are obtained from simple gravity estimations for imports averaged over the 2000 to 2014 period as detailed in
the text. Estimations are performed separately for imports of parts, components, final goods and other goods as well as for
total imports.
and our results from the TPD calculations that imports seem to be sourced from countries atsimilar stages of development. While final goods appear to be also imported to a significantdegree from countries at lower stages of development, this would suggest that there is alsodemand for cheaper or lower-quality goods among final consumers in richer countries. Thepicture is more complex with respect to exports. It is interesting to note that componentsappear to be exported significantly more to countries at higher stages of development, whichwould certainly support the literature on vertical FDI. However, in our view, the most impor-tant findings are that results for trade in parts and trade in components are quite differentand that we do not find significant coefficients for differences in income when using othergoods and total trade as dependent variables. We conclude that our novel classification oftrade data is an important step towards a better understanding of production fragmentationand global value chains. Indeed, while there is a lot of scope for further analysis, we havealready obtained a much more nuanced picture of trade within value chains of EU countries,differentiating intermediate inputs into parts and components, than if we had not been ableto separate these categories.
5 Concluding RemarksThe purpose of this descriptive study was to obtain a more nuanced view on trade of theEuropean Union member countries in the light of fragmentation of production and globalvalue chains. As trade theory is often preceded by empirical findings, we present somenew stylized facts on international trade by EU countries. Using a novel data set overthe period 2000 to 2014 based on a classification provided by the German EngineeringAssociation (VDMA) which classifies manufacturing products from the 8-digit CombinedNomenclature according to their nature as either part, component or final good, we providetwo contributions.
15

Firstly, we describe the development of trade in parts, components, final goods and othergoods for the EU 27 which presents a step forward as intermediate goods are subdivided intoparts and components. We show that these subcategories develop quite differently over timeand are not equally important to individual countries. Therefore, this further division ofintermediate goods should be an important part of subsequent research on fragmentation ofproduction. Secondly, we develop a simple measure that captures the average relative levelof development of a country’s trading partners in order to shed some light on the directionof trade within the global value chain. Here, we present descriptive evidence that countriesact as bazar-like economies within the global value chain. We find that, at every stage ofproduction, import sources are richer than export destinations. Furthermore, for exportsas well as for imports, trade partners are richer at earlier stages of the value chain. Thesefindings suggest that while inputs of a certain quality are necessary in order to produce, acountry sells its exports to a larger array of partners in terms of income levels. Interestingly,especially for poorer EU countries, we do not find convincing evidence that these countriestrade largely with other countries at similar levels of income. We support these findingsby simple gravity estimations introducing the difference in income as explanatory variables.The results suggest that imports are sourced mostly from countries at similar income levels,while exports are sold significantly more to countries at different, and mostly lower levels ofincome. Overall, our findings show the importance of differentiating by the nature of tradedgoods in order to analyze global value chains. Firstly, we are able to test more nuancedhypotheses. Secondly, we obtain quite different results for trade in parts versus trade incomponents. Thirdly, we find significant influences of income differences for trade in parts,components, and final goods, while income differences do not play a role when looking attrade in other goods or overall trade, highlighting the importance of a more finely-grainedanalysis.
While we are confident that our results present a significant improvement in analyzingfragmentation of production, there is a lot of scope for future research. Firstly, since thenovel classification only applies to parts of goods that are traded internationally, furtherwork on the classification would enhance data quality and the possibilities for generalizationof analysis. Secondly, a further refinement of the classification in terms of sophistication ofthe products (akin to the PRODY indicator) would allow for a much more nuanced analysisof trade links for different kinds of products within the global production networks. Thirdly,as more years of data become available, it should become possible to analyze medium- tolong-term developments. It would also be interesting to be able to conduct this exercise formore than just the EU member countries. On the one hand, even the CEECs are relativelydeveloped compared to a lot of other countries in the world. On the other hand, we missa large part of the global supply chain by not being able to include "factory Asia". Theseadditions would allow for a much more thorough and complete picture.
16

ReferencesArndt, Sven W. and Henryk Kierzkowski, Fragmentation: New Production Patternsin the World Economy, Oxford University Press, USA, 2001.
Athukorala, Prema-Chandra and Jayant Menon, “Global Production Sharing, TradePatterns, and Determinants of Trade Flows in East Asia,” Working Papers on RegionalEconomic Integration 41, Asian Development Bank January 2010.
Baldwin, Richard and Javier Lopez-Gonzalez, “Supply-chain Trade: A Portrait ofGlobal Patterns and Several Testable Hypotheses,” The World Economy, 2015, 38 (11),1682–1721.
Blinder, A.S., “Offshoring: The Next Industrial Revolution,” Foreign affairs, 2006, 85 (2),113–128.
Chaney, Thomas, “Distorted Gravity: the Intensive and Extensive Margins of Interna-tional Trade,” American Economic Review, 2008, 98 (4), 1707–1721.
Costinot, Arnaud, Jonathan Vogel, and Su Wang, “An Elementary Theory of GlobalSupply Chains,” The Review of Economic Studies, 2013, 80 (1), 109–144.
Fajgelbaum, Pablo D., Gene M. Grossman, and Elhanan Helpman, “Income Dis-tribution, Product Quality, and International Trade,” Journal of Political Economy, 2011,119, 721–765.
Feenstra, Robert C., “Integration of Trade and Disintegration of Production in the GlobalEconomy,” The Journal of Economic Perspectives, 1998, pp. 31–50.
and Gordon H. Hanson, “Globalization, Outsourcing, and Wage Inequality,” AmericanEconomic Review, 1996, 86 (2), 240–245.
Fieler, Ana Cecília, “Nonhomotheticity and Bilateral Trade: Evidence and a QuantitativeExplanation,” Econometrica, 2011, 79 (4), 1069–1101.
Gereffi, Gary, John Humphrey, and Timothy Sturgeon, “The Governance of GlobalValue Chains,” Review of International Political Economy, 2005, 12 (1), 78–104.
Grossman, Gene M. and Esteban Rossi-Hansberg, “Trading Tasks: A Simple Theoryof Offshoring.,” American Economic Review, Feb 2008, 98 (5), 1978 – 1997.
Grossman, GM and E Rossi-Hansberg, “The Rise of Offshoring: It’s Not Wine forCloth Anymore,” in “The New Economic Geography: Effects and Policy Implications,”Federal Reserve Bank of Kansas City, 2006, pp. 59–102.
Hallak, Juan Carlos, “Product Quality and the Direction of Trade,” Journal of Interna-tional Economics, 2006, 68 (1), 238 – 265.
, “A Product-Quality View of the Linder Hypothesis,” Review of Economics and Statistics,2010, 92 (3), 453–466.
17

Hanson, Gordon H., Raymond J. Mataloni, and Matthew J. Slaughter, “VerticalProduction Networks in Multinational Firms,” Review of Economics and Statistics, 2005,87 (4), 664–678.
Hausmann, Ricardo, Jason Hwang, and Dani Rodrik, “What You Export Matters,”Journal of Economic Growth, 2007, 12 (1), 1–25.
Helpman, Elhanan, Marc Melitz, and Yona Rubinstein, “Estimating Trade Flows:Trading Partners and Trading Volumes*,” The Quarterly Journal of Economics, 2008, 123(2), 441–487.
Huber, Stephan and Binh Nguyen Than, “Vertical Specialization in the EU and theCausality of Trade,” Applied Economics Letters, 2016, 24, 329–333.
Hummels, David, Dana Rapoport, and Kei-Mu Yi, “Vertical Specialization and theChanging Nature of World Trade,” Economic Policy Review, 1998, 4 (2), 79–99.
, Jun Ishii, and Kei-Mu Yi, “The Nature and Growth of Vertical Specialization inWorld Trade,” Journal of international Economics, 2001, 54 (1), 75–96.
Jones, Ronald W. and Henryk Kierzkowski, “A Framework for Fragmentation,” Frag-mentation: New Production Patterns in the World Economy, 2001, pp. 17–34.
Kimura, Fukunari, Yuya Takahashi, and Kazunobu Hayakawa, “Fragmentation andParts and Components Trade: Comparison Between East Asia and Europe,” The NorthAmerican Journal of Economics and Finance, 2007, 18 (1), 23–40.
Krugman, Paul R., Richard N Cooper, and TN Srinivasan, “Growing World Trade:Causes and Consequences,” Brookings Papers on Economic Activity, 1995, pp. 327–377.
Marin, D., “A New International Division of Labor in Europe: Outsourcing and Offshoringto Eastern Europe,” Journal of the European Economic Association, 2006, 4 (2-3), 612–622.
Yeats, Alexander J., “Just How Big is Global Product Sharing?,” in Sven W. Arndtand henryk Kierzkowski, eds., Fragmentation: New Production Patterns in the WorldEconomy, Oxford University Press, 2001, pp. 108–143.
18

A Appendix
Table A1: Development of real GDP per capita and real GDP of EU 27
(1) (2) (3) (4) (5) (6)GDPpc2000
GDPpc2014
GrowthRate
GDP 2000 GDP 2014 GrowthRate
AUT 24024 45045 4.59 192629.6 385275.8 5.08BEL 22164.6 42372 4.74 227541.3 473185.8 5.37BGR 1339.6 8520.2 14.13 11059.66 61713.43 13.07CYP 12255.1 23575 4.78 8526.293 20132.24 6.33CZE 4619 17992.8 10.2 47499.19 189400.2 10.38DEU 23605.2 39789.6 3.8 1941030 3277191 3.81DNK 28957.5 54611.5 4.64 154675.6 308015 5.04ESP 12682.8 25239.6 5.04 512114.4 1171725 6.09EST 3496.5 23195.2 14.47 4791.759 30463.08 14.12FIN 24378 45270.4 4.52 126378.4 247034.3 4.9FRA 21495.9 36160.6 3.78 1305721 2394740 4.43GBR 27610 35914.5 1.9 1626120 2314052 2.55GRC 10974.6 18027.8 3.61 120136.6 198063.1 3.64HUN 3405.5 11497.5 9.08 34982.62 113022.1 8.74IRL 22879.4 39975 4.07 86944.68 184319.8 5.51ITA 18396 30590 3.7 1049704 1858692 4.17LTU 3110.4 17260.8 13.02 10756.2 50541.99 11.69LUX 43559.8 115935 7.24 19050.62 64751.07 9.13LVA 3484.8 18246.8 12.55 8163.725 36282.03 11.24MLT 10595.2 23361.6 5.81 4141.399 9974.272 6.48NLD 22854.7 44330.4 4.85 363207.3 747604.6 5.29POL 4331.6 12786.5 8.04 164171 493695 8.18PRT 10750 18774.6 4.06 109492.5 195714.5 4.24ROU 1211.4 11242.5 17.25 27358.32 224877.7 16.24SVK 2984.8 19543.4 14.36 16050.14 105752.1 14.42SVN 9666 21231.3 5.78 19272.39 43756.65 6.03SWE 31015.4 53191.2 3.93 275495.4 515900.3 4.58
Data sourced from Eurostat, base year = 2005. GDP in million Euro, GDP per capita in Euro.
19

Table A2: Development of Exports and Imports of EU 27 (in Mio Euro)
(1) (2) (3) (4) (5) (6)Exports2000
Exports2014
GrowthRate
Imports2000
Imports2014
GrowthRate
AUT 70831 130127 4.44 76671 132469 3.98BEL 202614 348650 3.95 192022 340326 4.17BGR 4622 21411 11.57 6802 26046 10.07CYP 431 1110 6.99 3386 4887 2.66CZE 31340 129942 10.69 34555 113252 8.85DEU 583885 1117794 4.75 524385 879681 3.76DNK 49616 81320 3.59 48078 74082 3.14ESP 119766 232285 4.85 168396 268643 3.39EST 3443 11988 9.32 4601 13612 8.06FIN 49522 51745 .31 36368 54732 2.96FRA 346837 428650 1.52 362591 507154 2.43GBR 303733 366353 1.35 359855 497948 2.35GRC 12359 24915 5.13 36072 47736 2.02HUN 30317 82944 7.45 34766 78106 5.95IRL 80838 87656 .58 51958 52017 .01ITA 254904 389281 3.07 248026 352302 2.54LTU 3849 24320 14.07 5587 26443 11.74LUX 8959 14083 3.28 11796 19436 3.63LVA 2016 10895 12.81 3448 13258 10.1MLT 2513 2035 -1.5 3695 4680 1.7NLD 233808 469613 5.11 218834 420838 4.78POL 34241 162469 11.76 52980 164682 8.44PRT 26132 46660 4.23 43206 58498 2.19ROU 11020 52053 11.73 13634 58357 10.94SVK 12769 65079 12.34 13734 61742 11.33SVN 9328 27008 7.89 10931 25158 6.13SWE 89609 119491 2.08 74972 122116 3.55
Data sourced from Eurostat.
Table A3: Number of CN08 Products Classified
(1)Product Category Number of Products
Parts 225Components 301Final Goods 965Other Goods 14055Total 15546
Classification based on 8-digit data according to the Combined Nomenclature.
20

Table A4: Development of Exports and Imports of Parts, Components and Final Goods asa Share of Total Exports/Imports
(1) (2) (3) (4)Exports share of PCF in
t=2014Change from 2000 to 2014 Import share of PCF in
t=2014Change from 2000 to 2014
AUT 17.13 2.34 13.78 1.03BEL 6.98 -.26 7.08 -.87BGR 8.85 1.62 9.47 .54CYP 4.07 -2.57 4.83 -4.13CZE 14.11 1.11 12.49 -.01DEU 18.23 1.58 10.08 1.6DNK 17.72 3.61 11.01 .41ESP 7.75 .43 6.96 -2.54EST 9.71 5.09 8.56 .76FIN 18.28 6.01 10.32 .18FRA 9.61 1.06 8.84 -.13GBR 10.52 .52 8.16 .29GRC 3.02 -.57 4.49 -4.48HUN 11.05 4.31 15.2 1.2IRL 3.36 .91 8.53 2.33ITA 21.79 2.38 8.49 -.44LTU 9.88 6.52 9.11 1.86LUX 8.18 -1.02 6.56 -.68LVA 6.52 1.53 7.79 -2.67MLT 7.31 4.54 5.23 -3.86NLD 8.28 2.99 6.78 1.4POL 10.01 -1.38 10.86 -1.59PRT 8.19 2.52 7.46 -1.65ROU 10.49 3.69 12.14 2.32SVK 10.07 2.28 10.73 -.91SVN 12.95 .62 9.46 -.97SWE 15.47 1.79 10.9 -.42
The export and import share of PCF, which abbreviates parts, components, and final goods, is defined by(
1− T oi
T •i
)· 100,
where T oi denotes the total exports or the total imports of country i, and T •
i is the sum of all exports or imports over all goodsg:∑
gT g
i . The change from the year 2000 to 2014 is the difference of the share in 2000 and 2014.
21

Table A5: Export composition and its development
(1) (2) (3) (4) (5) (6) (7) (8)Share ofparts int=2014
Changefrom 2000to 2014
Share ofcompo-nents int=2014
Changefrom 2000to 2014
Share offinal
goodsint=2014
Changefrom 2000to 2014
Share ofexportsPCF int=2104
Changefrom 2000to 2014
AUT 21.24 .22 16.59 -.26 62.17 .05 17.13 2.34BEL 30.61 10.74 19.51 -1.07 49.88 -9.68 6.98 -.26BGR 19.23 -.25 19.22 -9.72 61.56 9.97 8.85 1.62CYP 9.8 .35 2.81 .56 87.39 -.91 4.07 -2.57CZE 28.59 -5.77 16.2 1.65 55.21 4.13 14.11 1.11DEU 19.41 -.72 17.14 1.95 63.45 -1.23 18.23 1.58DNK 26.72 2.53 14.44 2.2 58.83 -4.74 17.72 3.61ESP 22.54 2.32 16.09 -.13 61.37 -2.19 7.75 .43EST 22.83 -8.86 6.54 -4.42 70.62 13.28 9.71 5.09FIN 20.4 -2.33 16.03 5.47 63.56 -3.14 18.28 6.01FRA 24.16 .87 21.31 2.27 54.53 -3.14 9.61 1.06GBR 24.22 -3.31 18.59 2.6 57.19 .71 10.52 .52GRC 21.32 6.95 7.55 1.44 71.13 -8.39 3.02 -.57HUN 28.38 -.28 19.78 9.32 51.84 -9.05 11.05 4.31IRL 39.08 6.1 12.8 5.27 48.13 -11.37 3.36 .91ITA 23.16 2.47 18.27 1.63 58.57 -4.1 21.79 2.38LTU 14.55 -.53 11.07 2.04 74.38 -1.51 9.88 6.52LUX 40.91 8.13 25.33 -7.04 33.76 -1.09 8.18 -1.02LVA 18.44 8.06 8.86 -15.08 72.69 7.02 6.52 1.53MLT 20.22 .94 4.63 -26.99 75.16 26.05 7.31 4.54NLD 32.18 2.01 11.66 -2.33 56.16 .32 8.28 2.99POL 19.01 .76 15.66 6.34 65.33 -7.1 10.01 -1.38PRT 17.2 5.83 26.95 -10.36 55.85 4.54 8.19 2.52ROU 24.42 .5 28.46 6.87 47.12 -7.37 10.49 3.69SVK 25.49 -3.36 25.02 -6.91 49.49 10.27 10.07 2.28SVN 27.85 4.78 15.42 2.93 56.73 -7.72 12.95 .62SWE 28.33 3.65 19.51 -.03 52.16 -3.62 15.47 1.79
Share of parts, components, and final goods is defined for each country i as follows:(
Xgi
(X•i
−Xoi
) · 100)∀g ∈ {p, c, f}. Share of
PCF, which abbreviates parts, components, and final goods, is defined by(
1− Xoi
X•i
)· 100 . The Change from the year 2000 to
2014 is the difference of the share in 2000 and 2014. The countries are sorted by the real GDP per capita in 2013.
22

Table A6: Trade Partner Development, Intra-EU Trade only (mean over 2000-2014)
(1) (2) (3) (4) (5) (6) (7) (8)TPDp,x
i TPDc,xi TPDf,x
i TPDo,xi TPDp,m
i TPDc,mi TPDf,m
i TPDo,mi
AUT .769 .782 .75 .743 .778 .84 .83 .794BEL .877 .89 .893 .939 .897 .918 .912 .964BGR 7.14 7.675 6.154 6.299 7.384 7.312 7.208 6.304CYP .912 1.144 1.105 1.14 1.277 1.234 1.254 1.183CZE 2.343 2.205 2.133 2.089 2.426 2.329 2.311 2.135DEU .819 .843 .812 .852 .765 .832 .839 .869DNK .663 .665 .675 .698 .686 .678 .708 .699ESP 1.185 1.203 1.14 1.204 1.303 1.281 1.284 1.285EST 3.231 2.684 2.823 2.925 3.185 3.082 3.068 2.767FIN .81 .806 .79 .824 .838 .885 .89 .874FRA .851 .869 .841 .872 .894 .905 .911 .905GBR .899 .925 .904 .938 .914 .895 .914 .919GRC 1.036 1.099 1.089 1.288 1.568 1.512 1.532 1.496HUN 3.228 2.893 3.073 2.846 3.238 3.073 3.199 2.889IRL .707 .736 .775 .737 .747 .747 .744 .751ITA .964 1.003 .937 .977 1.046 1.081 1.062 1.034LTU 3.211 2.866 3.151 3.02 3.929 3.585 3.609 3.197LUX .38 .375 .392 .398 .405 .396 .421 .411LVA 3.53 2.956 3.225 3.155 3.67 3.478 3.605 2.929MLT 1.907 1.987 1.913 1.896 1.868 1.915 1.846 1.85NLD .763 .766 .763 .783 .788 .808 .806 .789POL 3.725 3.687 3.404 3.412 3.733 3.585 3.667 3.553PRT 1.737 1.687 1.593 1.659 1.68 1.642 1.636 1.613ROU 6.647 6.274 6.354 6.007 6.555 6.519 6.427 5.853SVK 3.229 3.011 2.66 2.6 2.917 2.952 2.851 2.564SVN 1.722 1.782 1.614 1.575 1.728 1.76 1.751 1.629SWE .733 .771 .745 .758 .748 .753 .762 .773
Trade Partner Development is defined as described in equation 3.1 on page 64.
23

TableA7:
Gravity
Estim
ations
forEx
ports
(1)
(2)
(3)
(4)
(5)
(6)
(7)
(8)
(9)
(10)
Part
sC
om
ponents
Fin
al G
oods
Oth
er
Goods
Tota
l E
xport
sP
art
sC
om
ponents
Fin
al G
oods
Oth
er
Goods
Tota
l E
xport
s
Dis
tance
-1.7
41**
*-1
.578**
*-1
.687**
*-1
.782**
*-1
.783**
*-1
.754**
*-1
.574**
*-1
.691**
*-1
.780**
*-1
.782**
*
(0.0
85)
(0.0
91)
(0.0
72)
(0.0
65)
(0.0
65)
(0.0
85)
(0.0
91)
(0.0
72)
(0.0
65)
(0.0
65)
Contiguity
0.0
60
0.1
83
0.1
21
0.1
28
0.1
11
0.0
60
0.1
81
0.1
19
0.1
27
0.1
10
(0.1
75)
(0.1
85)
(0.1
49)
(0.1
37)
(0.1
36)
(0.1
75)
(0.1
85)
(0.1
49)
(0.1
37)
(0.1
36)
Com
mon L
anguage
0.8
59**
*0.8
80**
*0.8
36**
*0.8
10**
*0.8
00**
*0.8
61**
*0.8
84**
*0.8
38**
*0.8
10**
*0.8
00**
*
(0.0
98)
(0.1
06)
(0.0
82)
(0.0
74)
(0.0
74)
(0.0
98)
(0.1
06)
(0.0
82)
(0.0
74)
(0.0
74)
(Y(i)-
Y(j))
*D(̂+
)1.0
73**
*-0
.297*
0.3
76**
-0.6
08
-0.2
47
(0.1
92)
(0.1
56)
(0.1
65)
(0.3
96)
(0.3
98)
(Y(i)-
Y(j))
*D(̂-
)0.8
21**
*-0
.457**
*0.1
93
-0.6
12
-0.3
58
(0.2
04)
(0.1
71)
(0.1
73)
(0.4
00)
(0.4
02)
|Y(i)-
Y(j)|
0.1
56**
*0.0
62
0.0
99**
*-0
.001
0.0
54*
(0.0
39)
(0.0
41)
(0.0
33)
(0.0
30)
(0.0
30)
Consta
nt
20.2
30**
*20.2
86**
*21.7
19**
*26.4
85**
*26.0
27**
*22.0
63**
*19.5
85**
*22.2
88**
*25.2
75**
*25.4
27**
*
(0.8
15)
(0.8
24)
(0.6
95)
(0.9
65)
(0.9
67)
(0.7
25)
(0.7
71)
(0.6
12)
(0.5
60)
(0.5
58)
Observ
ations
4,3
81
4,1
94
4,5
97
4,8
43
4,8
51
4,3
81
4,1
94
4,5
97
4,8
43
4,8
51
R-s
quare
d0.8
53
0.8
33
0.8
80
0.9
08
0.9
11
0.8
52
0.8
32
0.8
80
0.9
08
0.9
11
Sta
ndard
err
ors
in p
are
nth
eses;
***
p<
0.0
1,
** p
<0.0
5,
* p<
0.1
; estim
ations p
erform
ed a
s d
eta
iled in t
he t
ext.
24

TableA8:
Gravity
Estim
ations
forIm
ports
(1)
(2)
(3)
(4)
(5)
(6)
(7)
(8)
(9)
(10)
Part
sC
om
ponents
Fin
al G
oods
Oth
er
Goods
Tota
l Im
port
sP
art
sC
om
ponents
Fin
al G
oods
Oth
er
Goods
Tota
l Im
port
s
Dis
tance
-1.4
67**
*-1
.463**
*-1
.593**
*-1
.802**
*-1
.826**
*-1
.471**
*-1
.465**
*-1
.597**
*-1
.802**
*-1
.826**
*
(0.1
00)
(0.1
01)
(0.0
94)
(0.0
95)
(0.0
99)
(0.1
00)
(0.1
01)
(0.0
94)
(0.0
95)
(0.0
99)
Contiguity
0.4
16**
0.4
16**
0.3
42*
0.0
11
-0.0
63
0.4
18**
0.4
15**
0.3
41*
0.0
12
-0.0
62
(0.2
02)
(0.2
00)
(0.1
92)
(0.2
00)
(0.2
09)
(0.2
02)
(0.2
00)
(0.1
92)
(0.2
00)
(0.2
09)
Com
mon L
anguage
0.5
19**
*0.4
12**
*0.5
91**
*0.8
07**
*0.8
69**
*0.5
16**
*0.4
11**
*0.5
94**
*0.8
07**
*0.8
69**
*
(0.1
19)
(0.1
26)
(0.1
12)
(0.1
08)
(0.1
13)
(0.1
19)
(0.1
26)
(0.1
12)
(0.1
08)
(0.1
13)
(Y(i)-
Y(j))
*D(̂+
)0.4
85*
0.2
84
0.6
16**
0.5
62
0.6
26
(0.2
59)
(0.2
66)
(0.2
75)
(0.5
75)
(0.6
02)
(Y(i)-
Y(j))
*D(̂-
)0.1
76
0.1
37
0.2
41
0.3
88
0.3
83
(0.2
71)
(0.2
77)
(0.2
83)
(0.5
82)
(0.6
10)
|Y(i)-
Y(j)|
0.1
62**
*0.0
78
0.1
93**
*0.0
90**
0.1
25**
*
(0.0
49)
(0.0
51)
(0.0
44)
(0.0
43)
(0.0
45)
Consta
nt
16.8
87**
*16.3
57**
*17.6
08**
*22.9
95**
*23.1
02**
*17.4
79**
*16.7
15**
*18.3
98**
*23.9
28**
*24.0
92**
*
(0.9
65)
(0.9
60)
(0.9
44)
(1.3
95)
(1.4
60)
(0.8
45)
(0.8
46)
(0.7
95)
(0.8
14)
(0.8
52)
Observ
ations
3,7
52
3,4
07
4,0
37
4,8
13
4,8
17
3,7
52
3,4
07
4,0
37
4,8
13
4,8
17
R-s
quare
d0.8
54
0.8
47
0.8
74
0.8
71
0.8
71
0.8
54
0.8
47
0.8
74
0.8
71
0.8
71
Sta
ndard
err
ors
in p
are
nth
eses;
***
p<
0.0
1,
** p
<0.0
5,
* p<
0.1
; estim
ations p
erform
ed a
s d
eta
iled in t
he t
ext.
25