international tourists perceptions towards lesotho’s tourist attractions
DESCRIPTION
Major factors that influence tourism in Lesotho and its impact on GDPTRANSCRIPT
1
EXECUTIVE SUMMARY
The purpose of this study is to find the international tourists perceptions towards Lesotho’s tourist attractions. Previous studies have found that tourism has the potential to become the major contributor into a country’s GDP. Lesotho has many tourist attractions which are not exploited resulting in the industry’s contribution to the GDP being less than it could be.
The study was conducted using the quantitative research design. The population was all international tourists coming to Lesotho. The sample of 25 respondents was selected using the convenience sampling. The questionnaire was used to collect data and it was analysed using the SPSS 16.
Although there are many factors that influence tourists to visit a destination, only twelve factors were selected for this study. It was found that almost all factors that were selected influenced the tourist to visit Lesotho except for three factors.
The implication of these findings is that, in order to attract more tourists, more emphasis should be put on those factors that seem to attract tourist to Lesotho.

2
CHAPTER 1
1.0 INTRODUCTION
Tourism is one of the most important inputs into the country’s GNP and it is considered
to be the world’s largest trade. The World travel and Tourism Council Report (1995:7-8)
indicated that tourism generates more than US$3 trillion to governments in direct and
indirect taxes or 11 percent of the total tax payments. According to Tsiotsou and Ratten
(2010), as the global population ages and travelling becomes cheaper and quicker,
tourism will continue to be a cornerstone of the global economy. Lockorish and Jemkins
(1997:33) and Chadwick (1994:65), defined tourism as basically the movement of
people away from their place of permanent residence for a temporary stay in a different
location either for leisure or business and it is either domestic or international travel.
In tourism industry, destination image plays a major role when tourists decide where to
go. Image is perhaps the prime importance to underpin the marketing effort (Lockorish
& Jemkins 1997:173). Alcaniz, Sanchez & Blas (2009) found that destination image
positively influenced tourism behavioural intentions towards a resort vacation. The
image of the destination is an important factor in determining the destination’s popularity
with visitors (Hsu, Wofle & Kang 2004). According to Hunt (1975) destination image is
defined as an individual’s overall perception or total set of impressions of a place while
(Kotler et al 1993) defined it as a mental portrayal of a destination. Destination image is
composed of various attributes that can be divided into controllable attributes
(destination product, price, place and promotion) and uncontrollable ones (personal
characteristics). A destination has to create an image which is attractive, realistic and
attempts to differentiate it from other destinations. Image reflects the status of and
identity of a destination (Lockorish & Jenkins 1997:173). Image and expectations of
travel experiences are closely linked in a prospective customers’ minds and the ultimate
objective of a destination marketing is to; sustain, alter, or develop images in order to
influence buyers’ (tourists) expectations (Middleton & Clarke 2001:127). There are
many factors that influence people to travel to different places which still need to be

3
studied further, and this study will only focus on the destination image. According to
Kotler and Keller (2006:321), image is the way the public perceives the company and its
products.
Lesotho is a beautiful and challenging destination with variety of tourist attractions and a
very interesting history and it was founded by King Moshoeshoe I. Its remote and
rugged countryside is spectacular in all its appearances and gives the visitor that primal
thrill of discovering the unknown and the scenic beauty is overwhelming. According to
Ministry of Trade, Industry, Cooperatives and Marketing (MTICM) (2008:64) Lesotho
has tourism products focusing on the country’s rich heritage in paleontology (dinosaur
footprints) and archaeology (San paintings). These pictures drawn on the rocks have
important information for the historian, depicting tradition, hunting methods and
techniques and a way of living that is long forgotten.
1.1 PROBLEM STATEMENT
According to Euromonitor International (2010), Lesotho has inherent physical and
cultural qualities that make it suitable for tourism development. However, according to
(Musi: 2010) Lesotho has experienced limited growth in tourist arrivals in recent years.
Teye (1991:288) adds that the primary vacation or leisure tourism sector is
underdeveloped in most Southern African countries. (Musi: 2010) noted that Lesotho
has not been able to benefit from the general global tourism growth.
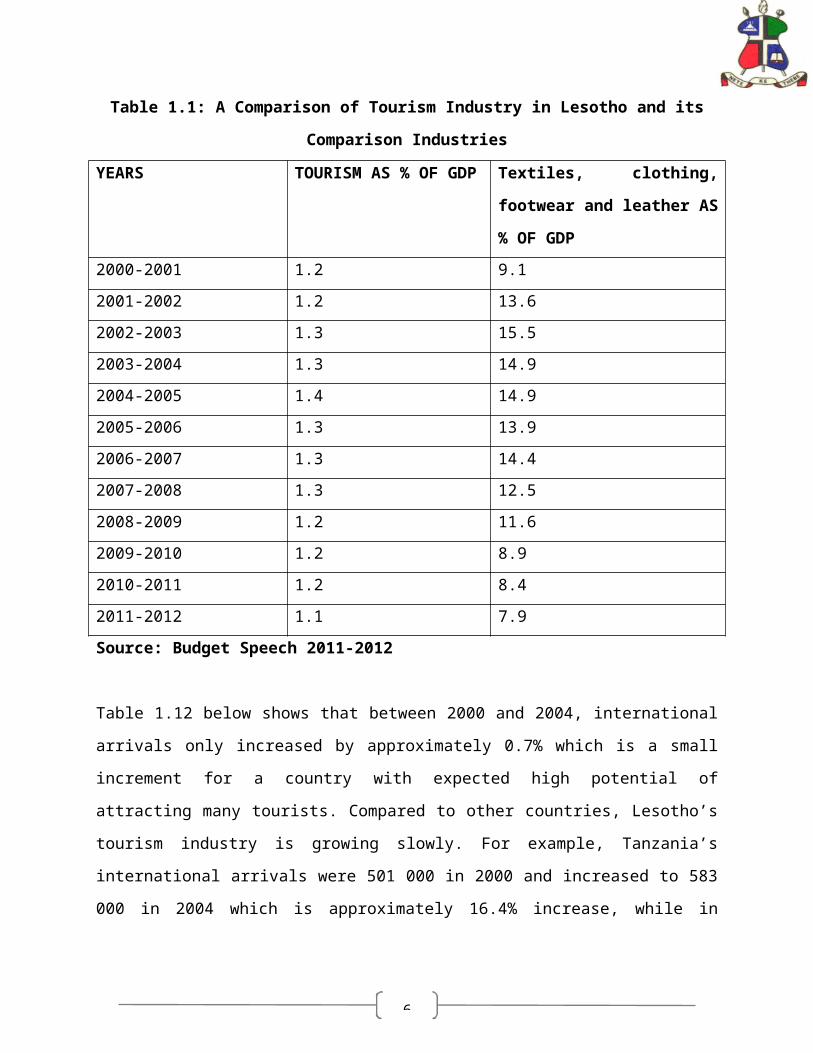
According to statistics, tourism in Lesotho is still a small industry that directly contributes
marginally to Lesotho’s GDP. (See table 1.1). The table compares tourism industry with
the contribution of textiles, clothing, footwear and leather industry. The tourism
industry’s contribution to Lesotho’s GDP from year 2000 to year 2012 ranges from as
little as 1.1% to 1.4% while Textiles, clothing, footwear and leather industry’s
contribution ranges from 7.9% to 15.5%. This shows that although Mitchell and Faal
(2008:5) say that tourism has a potential of becoming a large sector in many poor
countries, it is not performing in that way in Lesotho.
4

5
Table 1.1: A Comparison of Tourism Industry in Lesotho and its Comparison
Industries
YEARS TOURISM AS % OF GDP Textiles, clothing, footwear
and leather AS % OF GDP
2000-2001 1.2 9.1
2001-2002 1.2 13.6
2002-2003 1.3 15.5
2003-2004 1.3 14.9
2004-2005 1.4 14.9
2005-2006 1.3 13.9
2006-2007 1.3 14.4
2007-2008 1.3 12.5
2008-2009 1.2 11.6
2009-2010 1.2 8.9
2010-2011 1.2 8.4
2011-2012 1.1 7.9
Source: Budget Speech 2011-2012
Table 1.12 below shows that between 2000 and 2004, international arrivals only
increased by approximately 0.7% which is a small increment for a country with expected
high potential of attracting many tourists. Compared to other countries, Lesotho’s
tourism industry is growing slowly. For example, Tanzania’s international arrivals were
501 000 in 2000 and increased to 583 000 in 2004 which is approximately 16.4%
increase, while in Lesotho international arrivals were 302 000 in 2000 and increased to
304 000 in 2004.
6
Table 1.12: International Arrivals of Different Countries
Country International
Arrivals 2000
(‘000s)
Internationa
l Arrivals
2004 (‘000s)
% Growth of
international
arrivals
Benin 1,068 845 -20.9%
Cambodia 466 1,055 126.4%
Cape Verde 115 157 36.5%
Ethiopia 136 210 54.4%
Gambia 79 90 13.9
Lao PDR 737 895 21.4
Lesotho 302 304 0.7%
Malawi 228 471 106.6%
Mali 86 113 31.4%
Nepal 464 385 -17%
Senegal 400 373 -6.8%
Uganda 193 512 165.3%
Tanzania 501 583 16.4%
Vanuatu 106 99 -6.6%
Source: WTO (2006) Compendium of Tourism Statistics, 2006 Edition
Strategic Development Consultants (2008: 26) claims that foreign arrivals to Lesotho
have not changed significantly and have in fact declined from a total of 329 000
international tourist arrivals in 2003 to only 300 000 international tourist arrivals in 2007.
The tables above therefore indicate that tourism industry is not performing well hence
the study intends to investigate the perceptions of tourists towards tourist attractions in
Lesotho.

7
1.2 JUSTIFICATION
It is important to undertake this study as it will give all stakeholders information into
factors that influence that influence international tourists to visit Lesotho. Knowledge
about the perceptions of these tourists will help in designing and developing tourist
destinations so that they become appealing to tourists. The study will also help address
challenges that tourist destinations face

8
CHAPTER 2
LITERATURE REVIEW
2.0 INTRODUCTION
This chapter will review the relevant literature and explore in detail what other
researchers and scholars have written about the tourism demand and development,
perceptions of tourism and challenges that tourism industry faces.
2.1 LITERATURE REVIEW
According to (Sindiga, 1999), the case for tourism development is somewhat different
from other sectors of the economy because it does not produce goods and its
contribution to development is indirect through generating revenues. Tourism
development involves the creation of an infrastructure of attractions, accommodation
facilities, travel and transport, and communications which allow visitors to go to the
source of an attraction. According to Ministry of Trade, Industry, Cooperatives and
Marketing (MTICM) (2008:65) tourism development is constrained by inadequate
infrastructure, transport and tourism facilities, and confusion in the respective roles of
tourism support institutions. Mitchell and Faal (2008:52) suggest that developing a
portfolio of different tourism products can increase the appeal of a destination to a range
of clientele as well as a potential increase in volume of numbers. Okech (2010:2)
suggest that tourism in most sub-Saharan African countries is hardly an industry since
the tourism infrastructure is weak, tourism organisation is poor, and net revenue is little.
Okech (2010:2) further adds that almost all tourist arrivals consist of African nationals
residing abroad returning to visit friends and relatives, business visitors, and those
visiting expatriate residents.
Minister Ramaili says that the biggest challenge in Lesotho’s tourism is the diversity of
tourism industry (Kheleli, 2010-2011:8). Furthermore, the Minister adds that there are
no activities and facilities in Lesotho as well as infrastructure. The economic

9
infrastructure for tourism is very poor in Lesotho which slows down the expansion of
tourism in two different ways. First, the absence of some types of infrastructure such as
roads provides an effective block to tourist development. Second, the absence of other
types of infrastructure does not prevent tourism, but makes achieving and maintaining
service standards more difficult and expensive. These are not favourable conditions in
which to develop a conventional tourist destination. According to Thola quoted by
Motsoeli and Maama (2010:4), most of Lesotho’s accommodation establishments are
not graded resulting in most of them failing to attract any business during the 2010 FIFA
world cup in South Africa. Okech (2010:5) maintains that, in existing destinations,
hoteliers and tour operators, local government and local communities all need to be
empowered to take control of their destination within the context of the domestic and
international tourism market.
There is a wide range of factors that can influence the demand for tourism. Page
(2007:84) maintains that major element in the decision to select a specific destination is
the image of the place. Often, people will look at options, re-evaluate them and
reconsider specific places based on their knowledge, the images portrayed in the media
and the positions of individual(s) and group members. Page (2007:84) maintains that
the image of a destination elicit tourism demand. Increase in tourism demand may result
in growth of tourism industry. According to Sindiga (1999), tourism is an unstable luxury
export and it is dependent on external demand which in turn is affected by many factors
beyond the control of the planners. Page and Connell (2006:48) identified four factors
influencing tourism demand.
Promotional efforts of the destination:
Health, safety and security issues:
Time and cost considerations:
Seasonal variations:
Tourists are conceived of as individuals that act rather rationally and evaluate options in
the pursuit of maximal benefits (Bargeman & Val de Poel (2006) quoted by Prayag
2009:464). Cooper et al. (1993:20) suggest that no two individuals are alike, and

10
differences in attitudes, perceptions and motivation have an important influence on
travel decisions where attitudes depend on an individual’s perception of the world.
Mountinho (1987:16) defined motivation as a state of need, a condition that exerts a
push on the individual towards certain types of action that are seen as likely to bring
satisfaction.
According to Bonn et al (2005) destination Image has direct impact on travel behavior
and plays a crucial role in destination selection process because tourists usually choose
the destination with the most favourable image. Before people go to any destination,
they develop the image and a set of expectations based on previous experience, word
of mouth, press reports, advertising and common beliefs (Chon 1992; Baloglou and
Bringmerg 1997; cited in Buhalis 2000). Image can be a powerful process where
destinations (such as London and Paris) have memorable elements in the landscape
which feature as icons to promote awareness and travel to the destination (e.g. the
Eiffel Tower in Paris), leading to tourist associating positive reasons to travel to well
known icons that are safe and popular (Page (2007:85), furthermore, the image of a
destination is not concerned with the tangible elements, since tourism is a combination
of tangible perception of a place and emotional feelings about locations. Lockorish and
Jenkins (1997:173) argue that the question of image is particularly difficult in many
developing countries where potential visitors have little or no knowledge of the
destination, or have distorted image which needs to be corrected and changed.
According to Gunn (1972), there are three types of images that individuals hold for a
particular destination. These images include organic image, induced image and
complex image which are based on individual’s experience with a particular image.
Gunn (1972) defined these images as follows:
An organic image arises from non-tourism information such as geography books,
television reports, or magazine articles;
An induced image can arise from tourism specific information such as a
destination brochure or vacation website, which is a product of a destination
marketing efforts;

11
Complex image can be derived as a result of direct experience of the destination.
Mayo (1973) examined regional images and regional travel behavior and he concluded
that the image of a destination is a critical factor when choosing a destination.
Furthermore, Mayo (1973) adds that it does not matter whether the image portrayed is
true or false, the important thing is the image that exists in the mind of the vacationer.
Phillips and Jang (2008) also studied how destination image was related to tourist
attitude as a determinant of behavioural intentions and confirmed that destination image
substantially explained the tourist attitude towards a destination.
According to MTICM (2008:65), marketing of Lesotho’s tourism resources is very under-
developed, and there are very few links between tourism operators in Lesotho and
South Africa. Strategic Development Consultants (2008: 38) adds that Lesotho fails to
take the initiative and does not embark on a significant marketing campaign and fails to
attract the South African adventure leisure market. Destinations have to create images
of their tourism offerings and locality that help to differentiate them from the competition.
The Minister of Tourism, Environment and Culture, Mrs. Mannete Ramaili argue that the
beauty of the country is not enough to attract tourism, thus lack of commitment from all
stakeholders such as the locals, government and private sector have a negative impact
on tourism growth (Kheleli, 2010-2011:8).
All destinations according to Holloway and Taylor (2006:14), require adequate
attractions which build up its image. The more attraction a destination can offer, and the
easier it becomes to market such destination to the tourist. Taylor (2006:14) further
adds that most of the attractions of a destination depend upon its physical features,
including the beauty of the mountains, the fresh air of the seaside resort, and the
qualities of a particular beach, the historical architecture, shopping and entertainment
opportunities and atmosphere of the great city. According to UNECA (2011:1),
competitive advantage of tourism destinations all over the world is no longer natural, but
increasingly man-made, that is, it is driven by science, technology, information and
innovation. UNECA (2011:1) adds that it is not simply the stock of natural resources of
the sub-region that will determine its competitiveness in tourism, but rather how these
12
resources are managed and to what extent they are complemented with man-made
innovations. Okech (2010:5) adds that the development of appropriate complementary
products will increase the attractiveness of the destination and increase tourist spending
in the local economy.
13
CHAPTER 3
METHODOLOGY
3.0 INTRODUCTION
The chapter outlines the ways in which the study is going to be carried out. The chapter
will discuss the research instrument and design, population and sampling techniques
and data collection and analysis.
3.1 Instrument and Design
According to Burns and Bush (2006:234) data collection refers to gathering information
using various types of methods. Collins et al. (2000:168) adds that data can be
collected through measuring, questioning and observation. Prayag (2010) used a mixed
method of inquiry being the quantitative method which used unstructured methods of
data collection and semi-structured methods of data collection for quantification
purposes. Qualitative inquiry involved personal interviews while quantitative inquiry
employed a combination of open and close-ended questioning. Siriphanich (2010)
conducted a survey using questionnaire form to collect primary data from tourists. Lee
and Chartfield (2010) used a web-based survey design using a self administered
questionnaire. This study will be conducted using a mixture of both closed and open
ended questions.
3.2 Population and Sampling
Burns and Bush (2006:330) define population as the entire group under study as
specified by the objectives of the research project and a sample as a subset of the
population that suitably represents that entire group. Siriphanich (2010) identified the
population as the tourists who travelled to Songkhla of Thailand in 2006 and the sample
was based on the simple random sampling as well as the quota sampling to limit the
number of respondents at each location in order to obtain the sample that is
14
representative of the whole population. In Prayag’s study, population was identified as
international tourists visiting Cape Town and used a systematic random sampling
selecting every 2nd international tourist at different locations. Lee and Chartfield used the
entire 2600 students enrolled in Hotel College undergraduate program in 2006. The
population in this study will be international visitors to Lesotho entering Maseru Bridge.
The sample will be selected using the convenience sampling. According to Burns and
Bush (2006:345), convenience samples are samples drawn at the convenience of the
interviewer, that is, the interviewer uses busy pedestrian locations such as shopping
malls.
3.3 Data Analysis
Collins et al. (2000:234) defines data analysis as the process of using specific
procedures to interpret data collected. Many researchers use statistical tools to analyse
quantitative data. Lee and Chartfield (2010) used Statistical Package for the Social
Sciences (SPSS) 18 for data analysis. Siriphanich (2010) used statistical techniques to
find out demographic profiles of the respondents and descriptive statistics such as the
mean score and standard variation to understand factors that influence the tourist’s
decisions. The SPSS 16 will be used to analyse data for this research.

15
CHAPTER 4
DATA ANALYSIS AND INTERPRETATION OF THE RESULTS
4.0 INTRODUCTION
The chapter presents analysis of the results which will also be interpreted. The first part will focus on the demographic data and then the second part shows the results of the tourist’s perceptions towards Lesotho’s tourist attractions. Finally, the chapter presents the cross tabulated results whereby a relationship between demographic data and perceptions is revealed and interpreted. 4.1. DEMOGRAPHIC DATA
TABLE 4.1.1 RESPONDENT'S COUNTRY OF ORIGIN
Frequency Percent
South Africa 11 44.0
Botswana 4 16.0
Namibia 1 4.0
Swaziland 2 8.0
Poland 1 4.0
Angola 1 4.0
England 1 4.0
Scotland 1 4.0
Zimbabwe 3 12.0
Total 25 100.0
The total respondents were 25 people from 9 countries. As shown by table 4.1.1, 11 respondents were from South Africa, 4 were from Botswana, 2 from Swaziland, 3 from Zimbabwe and Poland, Angola, Namibia, England and Scotland each had 1 respondent.
TABLE 4.1.2 RESPONDENT'S GENDER
Frequency Percent
Male 15 60.0
Female 10 40.0
Total 25 100.0
Table 4.1.2 shows that the respondents fell into 2 categories made up of 60% male and 40% female.
16
TABLE 4.1.3 RESPONDENT'S AGE
Frequency Percent
between 18 and 25 6 24.0
between 25 and 35 14 56.0
above 35 5 20.0
Total 25 100.0
As shown by table 4.1.3, the respondents’ age range was divided into 4 categories with non below the age of 18, ages between 18 and 25 (24%), ages between 25 and 35 (56%) and above age 35 (20%)
TABLE 4.1.4 RESPONDENT'S QUALIFICATION
Frequency Percent
Secondary 6 24.0
Tertiary 19 76.0
Total 25 100.0
Table 4.1.4 represents the qualifications which ranged between secondary (24%) and tertiary (76%).
TABLE 4.1.5 RESPONDENT'S SALARY
Frequency Percent
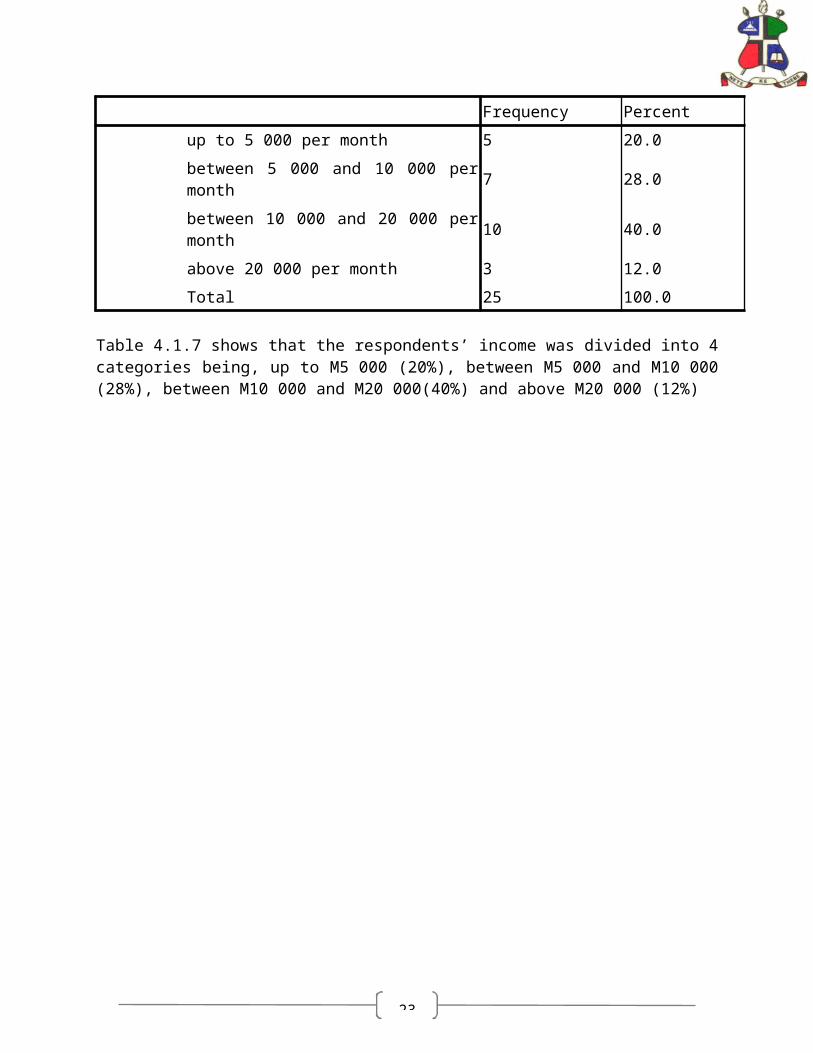
up to 5 000 per month 5 20.0
between 5 000 and 10 000 per month 7 28.0
between 10 000 and 20 000 per month 10 40.0
above 20 000 per month 3 12.0
Total 25 100.0
Table 4.1.7 shows that the respondents’ income was divided into 4 categories being, up to M5 000 (20%), between M5 000 and M10 000 (28%), between M10 000 and M20 000(40%) and above M20 000 (12%)

17
TABLE 4.1.6 RESPONDENT'S MARITAL STATUS
Frequency Percent
Single 12 48.0
Married 7 28.0
Divorced 3 12.0
Widowed 2 8.0
Cohabiting 1 4.0
Total 25 100.0
Table 4.1.6 shows that 48% of the respondents were single, 28% were married, 12% were divorced 8% were widowed and 4% of the respondents were cohabiting.
TABLE 4.1.7 RESPONDENT'S PURPOSE OF VISITING LESOTHO
Frequency Percent
Business 8 32.0
Leisure 14 56.0
School 2 8.0
Sports 1 4.0
Total 25 100.0
The respondents came to Lesotho for a variety of reasons. Table 4.1.7 shows that 32% came for business, 56% came for leisure, 4% came for sporting activities and 8% came for educational purposes.
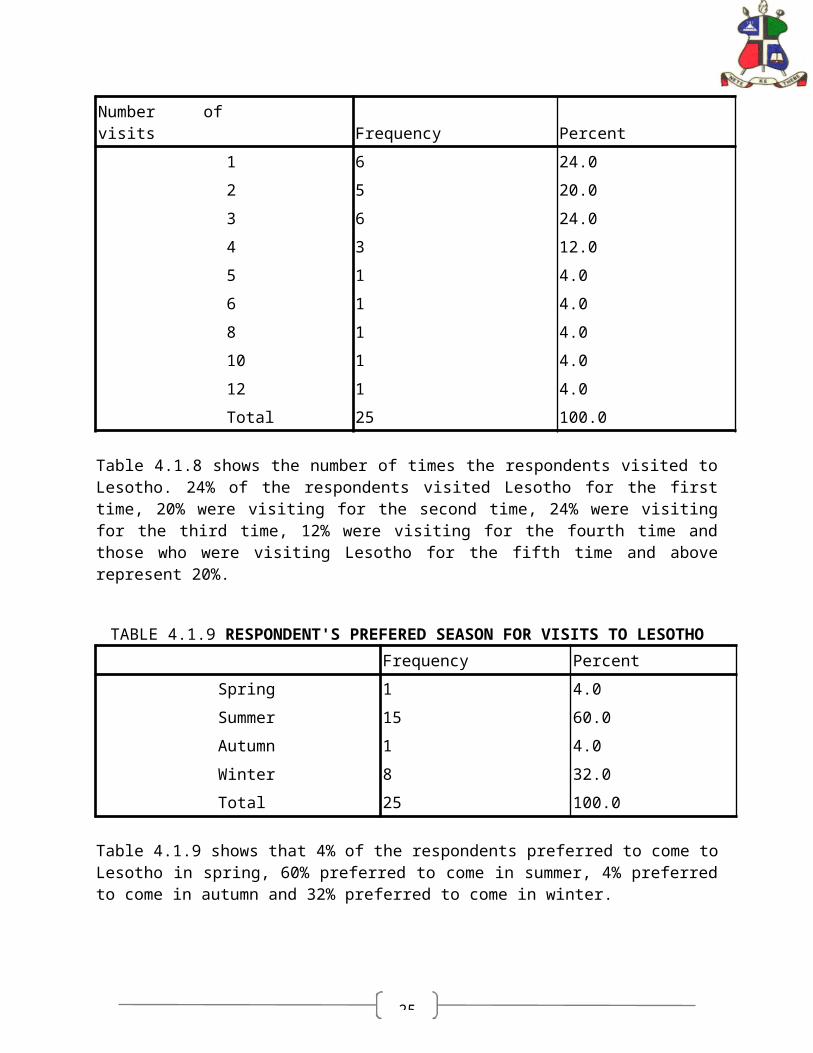
TABLE 4.1.8 RESPONDENT'S NUMBER OF VISITS
Number of visits Frequency Percent
1 6 24.0
2 5 20.0
3 6 24.0
4 3 12.0
5 1 4.0
6 1 4.0
8 1 4.0
10 1 4.0
12 1 4.0
Total 25 100.0
18
Table 4.1.8 shows the number of times the respondents visited to Lesotho. 24% of the respondents visited Lesotho for the first time, 20% were visiting for the second time, 24% were visiting for the third time, 12% were visiting for the fourth time and those who were visiting Lesotho for the fifth time and above represent 20%.
TABLE 4.1.9 RESPONDENT'S PREFERED SEASON FOR VISITS TO LESOTHO
Frequency Percent
Spring 1 4.0
Summer 15 60.0
Autumn 1 4.0
Winter 8 32.0
Total 25 100.0
Table 4.1.9 shows that 4% of the respondents preferred to come to Lesotho in spring, 60% preferred to come in summer, 4% preferred to come in autumn and 32% preferred to come in winter.
TABLE 4.1.10 RESPONDENT'S SOURCES OF INFORMATION REGARDING
LESOTHO
Frequency Percent
Business associates 4 16.0
Internet 9 36.0
Friends 8 32.0
Family 4 16.0
Total 25 100.0
There are many sources of information about Lesotho but the respondents used only 4 sources. 16% got information from business associates, 36% got information from the internet, 32% got information from friends and 16% got information from family.
4.2. FACTORS INFLUENCING TOURISTS TO VISIT LESOTHO
Literature guided the research to factors that can be selected for the purpose of this study. In addition, the instrument was pre-tested and some elements were eliminated as they seem to be unclear to the respondents. A total of 12 elements were retained. These factors were ranked using a 1-5 likert-point scale, 1 representing the least influential factor and 5 representing most influential factor influencing the tourists.

19
Table 4.2.1FACTORS INFLUENCING TOURIST TO VISIT LESOTHO Mean
Scores1 Attractive and unique physical features of Lesotho e.g. mountains,
rivers and snow in winter 4.48
2 Ease of access of Lesotho because of good roads and border control 2.923 Attractive places of accommodation and places to eat and drink such as
hotels 3.68
4 The culture and heritage of Basotho 4.165 The warmth of people of Lesotho 4.86 The safety and security in Lesotho 3.367 The service delivery standards of the country’s institutions. e.g. Banks,
Cellular network Companies3.4
8 The unique products found in Lesotho such as seshoeshoe, aloe, etc. 3.72
9 The quality of information on things to do in the destination 3.7610 The set of activities offered by a tourist attraction (entertainment) 4.1211 The value for money in Lesotho, i.e. one can be able to get a lot of
things at a reasonable price3.96
12 The standard of transport services to the destination 3.8
The mean scores were calculated from the responses for each factor. Using the
average of the likert-point scale of 1-5, it is revealed that almost all factors influence
tourists to visit Lesotho except for Ease of access of Lesotho because of good roads
and border control which has a mean of 2.92 which is below average. In addition, the
safety and security in Lesotho which has a mean score of 3.36 and the service delivery
standards of the country’s institutions, e.g. banks, cellular network companies which has
a mean score of 3.4 is almost equal to the average. It means that eight out of twelve
factors namely attractive and unique physical features of Lesotho e.g. mountains, rivers
and snow in winter, Attractive places of accommodation and places to eat and drink
such as hotels, the culture and heritage of Basotho, the warmth of people of Lesotho,
The unique products found in Lesotho such as seshoeshoe, aloe, etc. the quality of
information on things to do in the destination, the set of activities offered by a tourist
attraction (entertainment), the value for money in Lesotho, i.e. one can be able to get a
lot of things at a reasonable price and the standard of transport services to the
destination are factors that attract and influence tourists to Lesotho.

20
According to MTEC (2008:23) most foreign tourists to Lesotho are South Africans. The
findings reveal that they are inline with the findings of the study carried out by the
Ministry of Trade and Industry as stated in Page 65 of their study that, tourism
development is constrained by inadequate infrastructure, transport and tourism facilities,
and confusion in the respective roles of tourism support institutions and not much
marketing is done to enhance Lesotho’s tourist attractions.

21
CHAPTER 5
CONCLUTION AND RECOMENDATIONS
5.0 INTRODUCTION
This chapter will look at the findings of the study and make conclusions from the key
findings of the study. The recommendations will also be made to bridge the gaps found
by the study and also ways to improve the tourist attractions so as to increase tourism
demand in Lesotho.
5.1 LITERATURE
No two individuals are alike and their decision making is influenced by many factors
such as perceptions, attitudes and motivation. Tourists are rational individuals who
evaluate options for maximal benefits. Literature reveals that tourism industry provides
both tangible and intangible product benefits. Tourism development involves the
creation of attractions that may influence tourists to visit Lesotho. A destination image
also plays a major role in tourist’s decision making process. The literature also shows
that there are no activities and facilities in Lesotho as well as infrastructure such as
roads and the absence of these infrastructures provide a block to tourism development
and difficulty in achieving and maintaining the service standards.
5.2 FINDINGS
The study shows that majority of Lesotho’s international tourists are from Republic of
South Africa (44%). The study reveals that almost all Lesotho’s tourist attractions seem
to influence international tourists to Lesotho except for ease of access to Lesotho
because of good roads and border control that had a mean score of 2.92 which is below
average.

22
RECOMMENDATIONS
It is recommended that tourism development be given enhanced priority within national
development planning and policy making (UNECC, 2005:15). ECIAfrica (2006:157)
suggest that to grow the potential of tourism business in Lesotho, there is a need to
encourage linkages between Lesotho and Republic of South Africa tourism
development strategies. This linkage will help position Lesotho as an ideal tourist
destination so as to increase international tourist arrivals to Lesotho.
Development of complementary products will increase the attractiveness of a tourist
destination. In the existing tourist destinations, hoteliers and tour operators, local
government and local communities all need to be empowered to take control of
destination within the context of the domestic and international tourism market. Various
modes of transport need to be improved together with tourism related infrastructure to
facilitate access to tourist destinations and attractions because some areas in the
country are still difficult to reach.
23
REFERENCES
Acaniz, E.B., Sanchez, I.S. and Blas, S.S. 2009, The functional-psychological
continuum in the cognitive image of a destination: a confirmatory analysis,
30:715-23
Collins, K.J., du Plooy, G.M, Grobbelaar, M.M., Puttergill, C.H, Terre Blanche, M.J., van
Eeden, R., van Rensburg, G.H & Wigston D.J. 2000. Research in the social
sciences, Pretoria: University of South Africa. 284 p.
Cooper, C.F., Fletcher, J., Gilbert, D.G. and Wanhill, S. 1993. Tourism: Principles and
Practice, London: Pitman.
ECIAfrica, May 2006, Capacity Building Action Plan for the Private Sector Lesotho
Euromonitor International, 2010: Travel and Tourism in Lesotho.
www.euromonitor.com/travel-and-tourism-in-lesotho/report Date of access: 7
Feb. 2012.
Government of Lesotho, The State of Small Enterprise in Lesotho: Ministry of Trade and
Industry, Cooperatives and Marketing Final Report October 2008.
Gunn, C. 1972. Vacationscape: Designing Tourist Regions, Texas: University of Texas
Press Austine,
Holloway, J.C., & Taylor, N. 2006. The Business of Tourism, 7 th Ed, England: Prentice
Hall, 716 p.
Hsu, C.H.C., Wofle, K. & Kang, S.K. 2004. Image assessment for a destination with
limited comparative advantages, Tourism management, 25:121-6

24
Hunt, J.D. 1975. Image as a factor in tourism development, Journal of travel Research,
13( 2):1-7
Kheleli, M. (2010-2011, December-February). the growth of tourism as an industry.
visions magazine , pp. 7-9.
Lickorish, L.J and Jenkins, C.L. 1997. An Introduction to Tourism: Factors influencing
demand for tourism, Oxford, Reed Educational and Professional publishing
Middleton, V. and Clarke, J. 2001. Marketing in Travel and Tourism, 3 rd Ed, Oxford,
Butterworth-Heineman
Mitchel, J., & Faal, J. 2008. The Gambian Tourist Value Chain and Prospects for Pro-
Poor Tourism. London: Oversea Development Institute.
Motsoeli, N., & Maama, (2010, July 15). Lesotho loses out on World Cup extravaganza.
Lesotho Times, p. 4.
Mountinho, L1987. Consumer Behaviour in Tourism. European Journal of Marketing,
Vol. 21 No. 10: 3-44
Musi, R., 2010. Travel in Lesotho. Visitlesotho.travel/invest/about.aspx Date of access:
7 Feb 2012.
Okech, R.N. 2010.The Journal of Tourism and Peace Research, Tourism Development
in Africa: Focus on Poverty Alleviation,1(1) p1-8
Page, S.J., 2007. Tourism management: managing the change, 2nd Ed, Oxford: Elsevier
ltd, p474.
25
Page, S.J., & Connell, J. 2006. Tourism: A modern Synthesis, 2nd Ed, London:
Thomson, p546
Phillips, W. & Jang, S. 2008. Destination Image and Tourist Attitude: Tourism analysis,
Vol. 13, pp401-11.
Prayag, G. 2010. Brand image assessment: International visitors’ perceptions of Cape
Town. Marketing Intelligence and Planning, 20(4): 462-485.
Sindiga, I. 1999. Tourism and African Development: Change and Challenge of Tourism
in Kenya. African Studies Centre Research Series.
Strategic Development Consultants, 20 May 2008. SEHLABATHEBE NATIONAL PARK
TOURISM BUSINESS PLAN, Ministry of Tourism Environment & Culture, Maloti
Drakensberg Transfrontier Project, SNP Report 1: 02
Teye, V.B. 1991. Prospects for Regional Tourism Cooperation in Africa: Managing
Tourism, In S. Medlik (Ed.). (pp. 286-296) Oxford: Butterworth-Heinemann.
The World travel and Tourism Council, 1995. Travel and Tourism Progress and
Priorities.
UNECA, 2011. Towards a Sustainable Tourism Industry Development in Eastern Africa.
15th Meeting of the Intergovernmental Committee of Experts (pp. 1-11). Djibouti:
Sub Regional Office for Eastern Africa
WTO, 2006. Compendium of Tourism Statistics, 2006 Edition