international st. croix river watershed...
TRANSCRIPT

INTERNATIONAL ST. CROIX RIVER
WATERSHED BOARD
ANNUAL REPORT
2014
ST. CROIX RIVER MAINE AND NEW BRUNSWICK


2014 ANNUAL REPORT
OF THE
INTERNATIONAL ST. CROIX RIVER WATERSHED BOARD
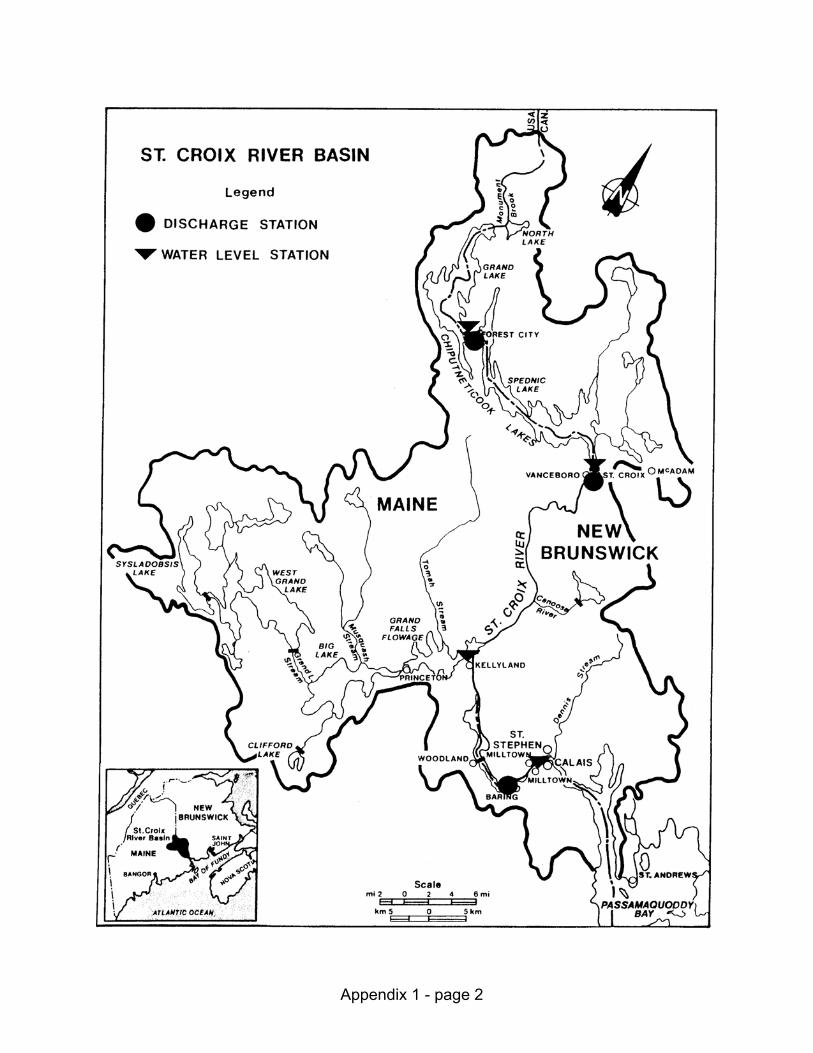
Covering The Orders of Approval with respect to the control of the discharge of the St. Croix River
at Forest City, Vanceboro, and the water levels of East Grand Lake, Spednic Lake, Grand Falls Flowage and Milltown Dam Forebay
&
The Water Quality and Aquatic Ecosystem Health of the
St. Croix River Boundary Waters
SUBMITTED TO
THE INTERNATIONAL JOINT COMMISSION
BY
THE INTERNATIONAL ST. CROIX RIVER WATERSHED BOARD
Prepared March 2015


TABLE OF CONTENTS
1.0 GENERAL ............................................................................................................................... 1
1.1 Synopsis for 2014 .................................................................................................................. 1
1.2 Board Membership................................................................................................................ 2
1.3 Annual Public Meeting in Basin ........................................................................................... 3
1.4 Annual Site Visit of Facilities in the Basin ........................................................................... 4
1.5 Policy of the Board Regarding Dam Regulation .................................................................. 5
2.0 MANAGEMENT OF WATER LEVELS AND FLOWS ................................................... 6
2.1 Summary ............................................................................................................................... 6
2.2 East Grand Lake Reservoir and Discharges Below Forest City Dam.................................. 6
2.3 Spednic Lake Reservoir and Discharges below Vanceboro Dam ........................................ 7
2.4 Water Levels above Grand Falls Dam .................................................................................. 7
2.5 Discharges at Baring, Maine ................................................................................................ 8
2.6 Headwater Elevations above Milltown Dam ........................................................................ 8
3.0 WATER QUALITY ................................................................................................................ 9
3.1 USGS Milltown Monitor ....................................................................................................... 9
3.2 Environment Canada Monitoring Stations – Forest City and Milltown ............................. 10
3.3 Water Quality Index ............................................................................................................ 15
4.0 STATUS OF POLLUTION ABATEMENT ....................................................................... 18
4.1 Maine .................................................................................................................................. 18
4.2 New Brunswick.................................................................................................................... 19
5.0 FISHERIES ........................................................................................................................... 21
5.1 Anadromous Fisheries ........................................................................................................ 21
5.2 Shellfish Harvesting ............................................................................................................ 23
6.0 IJC INTERNATIONAL WATERSHED INITIATIVES .................................................. 24
6.1 On-going Aquatic Food-Web Study .................................................................................... 24
6.2 USGS Spednic Lake Study ................................................................................................. 24
6.3 Sustaining the St. Croix Watershed : Research, Partnerships and Action ........................ 25
6.4 Alewife Count at Milltown ................................................................................................. 25
7.0 Additional Items to Report .................................................................................................. 26
7.1 Alewife Restoration Next Steps Group ............................................................................... 26
7.2 FERC Dam Relicensing ...................................................................................................... 26
ACKNOWLEDGEMENTS ....................................................................................................... 28
APPENDIX 1 Summary Orders of Approval and Basin Map
APPENDIX 2 Milltown, Grand Falls, Vanceboro, and Forest City Dams
APPENDIX 3 Water Levels and Flows
APPENDIX 4 Hydrographs
APPENDIX 5 Water Quality Data
APPENDIX 6 Milltown Fish Trap Data

1
1.0 GENERAL 1.1 Synopsis for 2014 In 2014, water quality in the system remained in good to excellent condition with respect to aquatic life. 2014 was an above average year for water levels on the St. Croix River system. During most of the year, reservoir levels and flows were operated within prescribed levels. Reservoir levels and flows in the river provided satisfactory conditions for power generation, canoeing and kayaking, and support of aquatic life. Water levels at reservoir stations were above average with annual mean levels slightly higher than their respective long term means. Higher river flows were also evident with gaging stations in the basin reporting flows to be about 30% higher than their respective long term mean values. In April 2014, during high spring river flows, an obstruction at one of the gates at Grand Falls Dam resulted in the water level at Grand Falls reservoir exceeding the IJC order of of 62.106 meters (203.76 feet). The exceedances occurred from April 16 at 09:15 EST to April 19 at 06:30 EST. During the event, Woodland Pulp LLC (dam owner-operator) took action to remove the obstruction at the gate and no impacts related to the higher water level were reported. The Board held its annual public meeting on the evening of June 3, 2014 in Calais, Maine. The Board also partnered with the St. Croix International Waterway Commission to hold a St. Croix watershed forum, a two-day workshop in November 2014 in St. Andrews, New Brunswick. This forum brought together multiple levels of government, aboriginal communities, community and environmental organizations, academia and students, and citizens to discuss current science and information on the state of the St. Croix watershed, share perspectives and concerns, and collectively look at efforts and needs for planning and management of the watershed. The Board continued to support scientific research in the St. Croix watershed that monitored restoration of alewife (gaspereau) and investigated environmental conditions affecting aquatic species.

2
1.2 Board Membership The International St. Croix River Watershed Board (Board) was established to assist the International Joint Commission. The International Joint Commission (IJC) is a bi-national United States-Canada organization established under the Boundary Waters Treaty of 1909. The Board has ten members with an equal number of members from the United States and Canada. Board members are appointed by the IJC and serve the Commission in their personal and professional capacity and not as representatives of their agencies. Current Board membership is shown below. In 2014 Colonel Charles Samaris, US Army Corps of Engineers completed his term as Co-Chair US Section and Colonel Christopher Barron was appointed by the IJC to the Board as the new Co-Chair US Section for three years.
International St. Croix River Watershed Board - Membership
Canadian Section
U.S. Section
Bill Appleby, Canadian Co-Chair Director, Prediction Services Operations East, Meteorological Service of Canada Environment Canada Dartmouth, Nova Scotia
Colonel Christopher Barron, U.S. Co-Chair District Engineer U.S. Army Corps of Engineers New England District Concord, Massachusetts
Darryl Pupek Director, State of the Environment Branch New Brunswick Dept. of the Environment and Local Government Fredericton, New Brunswick
Ralph Abele Chief Water Quality Branch EPA New England, Region 1 Boston, Massachusetts
Jessie Davies 4 O'Neill Farm Road St. Andrews, New Brunswick
Susanne Miller Regional Director, Eastern Maine Office, Department of Environmental Protection Bangor, Maine
Mr. Geoff Mercer Associate Regional Director General Atlantic and Québec Regions Environment Canada
Oliver Cox Director, Division of Sea Run Fisheries and Habitat Maine Department of Marine Resources
Dartmouth, Nova Scotia Bangor, Maine

3
International St. Croix River Watershed Board – Membership (continued) Canadian Section U.S. Section Robert Stephenson, Ph.D. Principal Investigator Canadian Capture Fisheries Research Network Visiting Research Professor University of New Brunswick Research Scientist, St. Andrews Biological Station St. Andrews, New Brunswick
Robert Lent, Ph.D. Maine District Chief United States Geology Survey Augusta, Maine
Secretariat Kathryn Parlee Senior Analyst, Regional Analysis & Relations – Atlantic & Quebec Regions Environment Canada Dartmouth, Nova Scotia
Barbara Blumeris U.S. Army Corps of Engineers New England District Concord, Massachusetts
1.3 Annual Public Meeting in Basin The Board’s annual public meeting was held in Calais, Maine on the evening of June 3, 2014 at the Washington County Community College. The meeting began at about 6:00 pm. There were about 20 people in attendance. Colonel Samaris, Board Co-Chair and IJC Commissioner Dereth Glance welcomed attendees and provided brief opening remarks. Following opening remarks, the Board Co-Chairs, provided a PowerPoint presentation that summarized Board activities in calendar year 2013 and early 2014. Next Ms. Abby Pond with the St. Croix International Waterway Commission provided information on the St. Croix watershed forum planned for November 2014. Mr. Bob Lent, Board member and Maine District Chief, United States Geology Survey was next with an informational presentation on recent Spednic Lake studies. The presentation included a summary of the data and methods used to estimate historical daily mean lake surface-water temperatures from early spring through late autumn at Spednic Lake. (See Section 6.2 for link to published report.) Following the presentations, there was an opportunity for public questions and comments. Mr. Ed Bassett with the Passamaquoddy Tribe noted that the Tribe is working on the restoration of the alewife to the St. Croix River. Mr. Bassett noted that the development of the dams on the river for hydropower and the past lumber industry have had an impact on the river ecosystem. The public meeting concluded at about 8:00 pm.

4
Figure 1. Annual Public Meeting in Calais, Maine, June 2014
1.4 Annual Site Visit of Facilities in the Basin Board members met with New Brunswick Power Corporation officials on the morning of June 4, 2014 to tour the Milltown Dam operations in New Brunswick. On the same day, Board members also met with Woodland Pulp, LLC officials in the Woodland Mill at Baileyville, Maine and then toured the Grand Falls, Forest City and Vanceboro dam sites. (Visit notes and information describing the dams is provided in Appendix 2.) It is the responsibility of the dam owners, operators and appropriate jurisdictional agencies to conduct the necessary dam inspections and maintenance to ensure the safety and security of the dams.
5
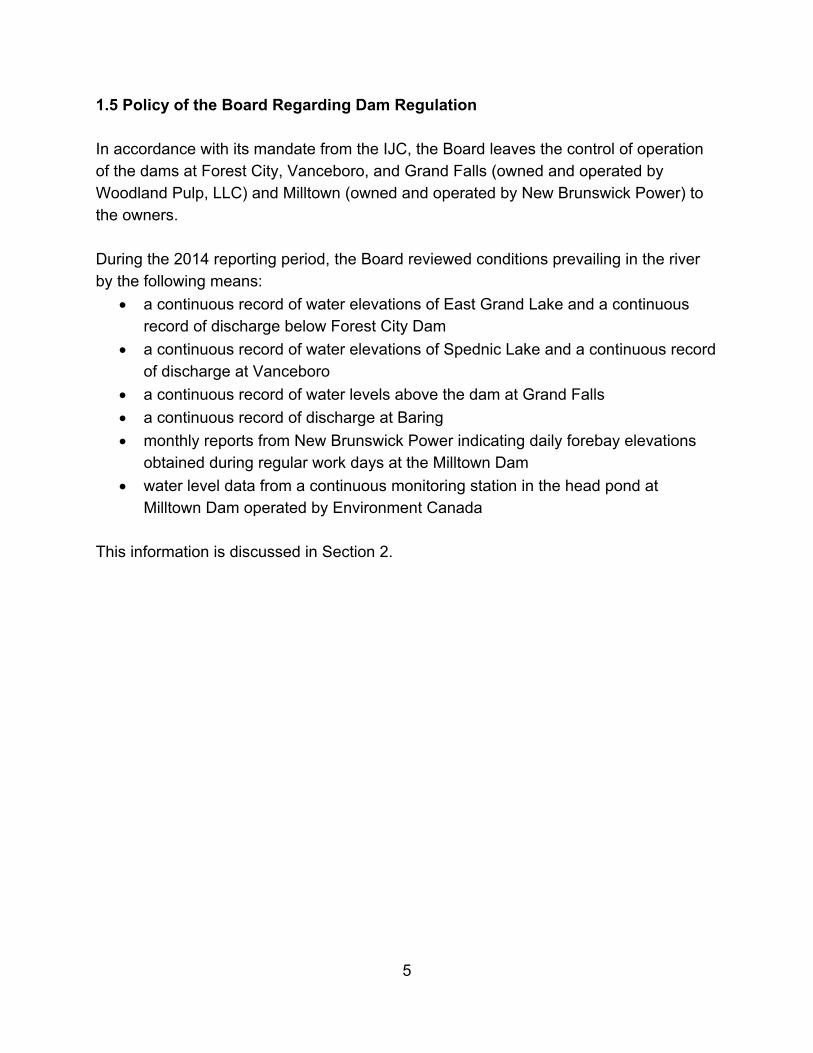
1.5 Policy of the Board Regarding Dam Regulation In accordance with its mandate from the IJC, the Board leaves the control of operation of the dams at Forest City, Vanceboro, and Grand Falls (owned and operated by Woodland Pulp, LLC) and Milltown (owned and operated by New Brunswick Power) to the owners. During the 2014 reporting period, the Board reviewed conditions prevailing in the river by the following means:
a continuous record of water elevations of East Grand Lake and a continuous record of discharge below Forest City Dam
a continuous record of water elevations of Spednic Lake and a continuous record of discharge at Vanceboro
a continuous record of water levels above the dam at Grand Falls a continuous record of discharge at Baring monthly reports from New Brunswick Power indicating daily forebay elevations
obtained during regular work days at the Milltown Dam water level data from a continuous monitoring station in the head pond at
Milltown Dam operated by Environment Canada This information is discussed in Section 2.

6
2.0 MANAGEMENT OF WATER LEVELS AND FLOWS 2.1 Summary In 2014, the annual mean water level at East Grand Lake was 131.996 meters (433.06 feet), which is higher than the long term mean value of 131.822 meters (432.49 feet). The annual mean flow from the lake at Forest City Stream was 9.43 m3/s (333 cfs), 30% higher than the long term mean value of 6.59 m3/s (233 cfs). The annual mean water level for the year at Spednic Lake was 116.554 meters (382.40 feet), higher than the long term mean value of 116.325 meters (381.64 feet). The annual mean flow as recorded at Vanceboro was 33.3 m3/s (1080 cfs), 37% higher than the long term mean value of 20.9 m3/s (738 cfs). The annual mean water level for the year at Grand Falls Flowage was 61.795 meters (202.74), which is higher than the long term mean value of 61.763 meters (202.63 feet). The annual mean flow at Baring was 109 m3/s (3850 cfs), which is 31% higher than the long term mean value at Baring of 75 m3/s (2650 cfs). 2.2 East Grand Lake Reservoir and Discharges Below Forest City Dam During the period from January 1 to December 31, East Grand Lake reservoir was operated between a maximum daily mean water level of 132.445 meters (434.53 feet) on April 25 and a minimum daily mean of 131.454 meters (431.28 feet) on October 16. The maximum water level as prescribed by the Commission’s Order is 132.571 meters (434.94 feet); the minimum is 130.436 meters (427.94 feet). The Order was maintained throughout the year. The daily mean water levels are presented in Table I and depicted in Figure I in Appendix 3 and 4. Table II and Figure II in Appendix 3 and 4 present the daily mean discharges below the Forest City Dam at the outlet of East Grand Lake for 2014. The maximum daily mean for the reporting period was 35.4 m3/s (1250 cfs) on April 25 and the minimum daily mean was 2.42 m3/s (85.5 cfs) on March 27. The mean discharge for the year was 9.43 m3/s (333 cfs). The Commission’s Order of 2.12 (75 cfs) as a minimum flow was maintained throughout the year

7
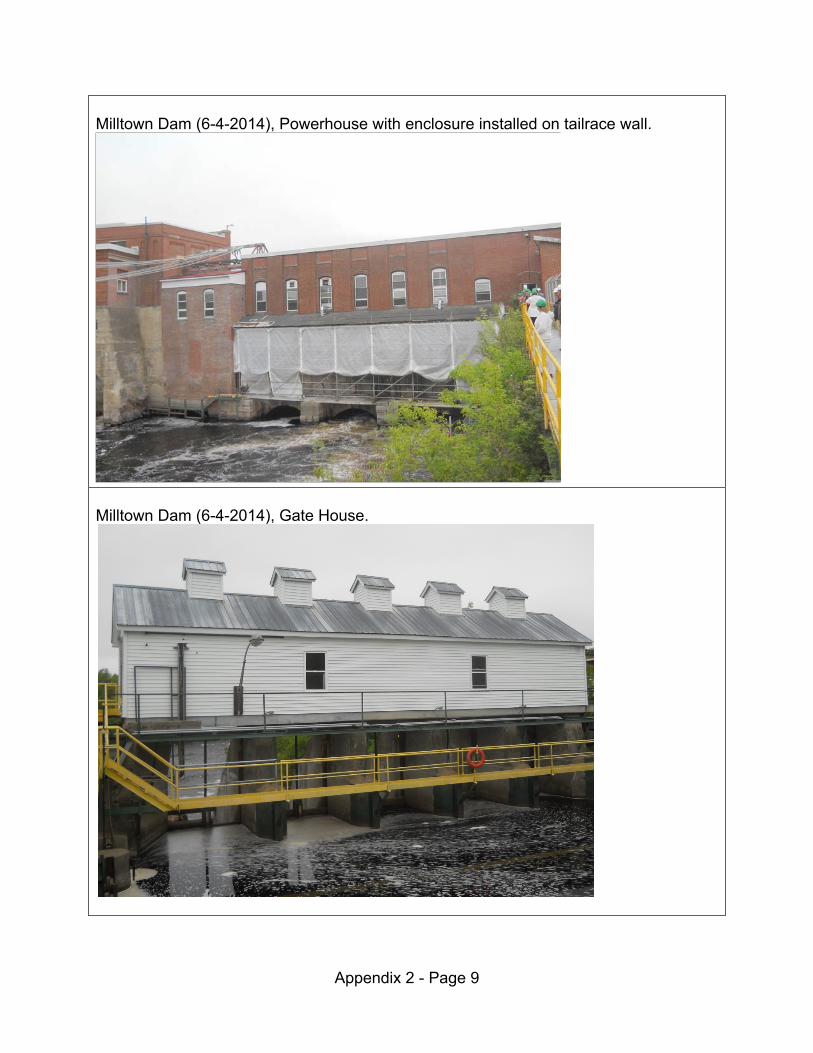
2.3 Spednic Lake Reservoir and Discharges below Vanceboro Dam During the year, levels in the Spednic Lake reservoir, ranged from a maximum daily mean water level of 117.389 meters (385.13 feet) on July 8, to a minimum daily mean water level of 115.269 meters (378.18 feet) on October 16. The maximum limit specified in the Commission’s Order is 117.610 meters (385.86 feet). The allowable minimum level is 113.233 meters (371.50 feet) for the period January 1 to April 30 and October 1 to December 31 inclusive, and 114.757 meters (376.50 feet) for the period May 1 to September 30 inclusive. These orders were maintained throughout the year. The daily mean elevations for the Spednic Lake Reservoir during the year are presented in Table III and depicted in Figure III in Appendix 3 and 4. The maximum daily mean discharge recorded from the outflow at the reservoir at Vanceboro was 151 m3/s (5330 cfs) on April 26 and the minimum daily mean discharge recorded was 8.16 m3/s (288) on October 14. The Commission’s Order of a minimum flow of 5.66 m3/s (200 cfs) was maintained throughout the year. Daily mean discharges are presented in Table IV and Figure IV in Appendix 3 and 4. 2.4 Water Levels above Grand Falls Dam Table V and Figure V in Appendix 3 and 4 include water level elevations of the headpond above the Grand Falls Dam. The recorded maximum daily mean elevation was 62.246 meters (204.22 feet) on April 17 and the minimum recorded elevation was 61.464 meters (201.65 feet) on April 2. The maximum prescribed elevation of 62.106 meters (203.76 feet), as set by the Commission, was maintained throughout the year except when it was exceeded for the period April 16 at 09:15 EST to April 19 at 06:30 EST. This occurrence of exceedance is referenced in Appendix 3 of Water levels and Flows for April 16-18 and depicted in Figures V (Daily Mean Values) and Figure VIII of Appendix 4 (15 Minute Values). The high flow was discussed at the Board site visit in June 2014 and Woodland Pulp reported that the high flow incident at Grand Falls was due to high flows in the river and reduction in capacity at one of gates caused by an obstruction. Woodland reported that all gates were open and passing high river flow when the log boom became disconnected and lodged in one of the gates. Woodland staff took action to remediate the situation and there were no impacts reported due to the water level exceeding the prescribed elevation in the IJC order.

8
2.5 Discharges at Baring, Maine Table VI and Figure VI in Appendix 3 and 4 present the daily mean discharges of the St. Croix River at Baring, Maine. The mean discharge for the report period was 109 m3/s (3850 cfs). The maximum daily mean was 473 m3/s (1670 cfs) on April 17. The minimum daily mean was 24.3 m3/s (858 cfs) on October 4. Woodland Pulp LLC met the minimum flow requirements set at 21.2 m3/s (750 cfs); this is the minimum flow requirement as considered by the Maine Department of Environmental Protection. 2.6 Headwater Elevations above Milltown Dam Table VII and Figure VII in Appendix 3 and 4 present and depict daily water elevations in the forebay of the New Brunswick Power Corporation plant at Milltown, New Brunswick. These elevations refer to mean sea level datum. In 2009, Environment Canada established a continuous water-level and water quality monitoring station. The supplied data for 2014 was extracted from this gauging station located on the headpond.
9
3.0 WATER QUALITY
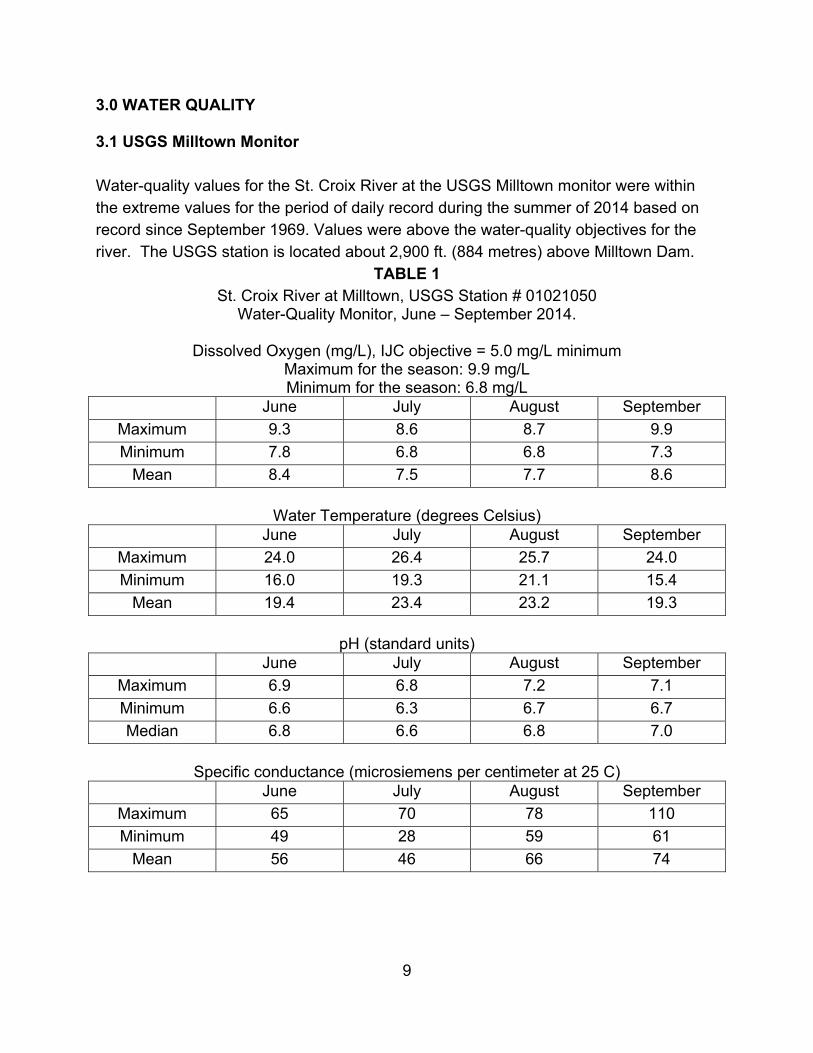
3.1 USGS Milltown Monitor Water-quality values for the St. Croix River at the USGS Milltown monitor were within the extreme values for the period of daily record during the summer of 2014 based on record since September 1969. Values were above the water-quality objectives for the river. The USGS station is located about 2,900 ft. (884 metres) above Milltown Dam.
TABLE 1 St. Croix River at Milltown, USGS Station # 01021050
Water-Quality Monitor, June – September 2014.
Dissolved Oxygen (mg/L), IJC objective = 5.0 mg/L minimum Maximum for the season: 9.9 mg/L Minimum for the season: 6.8 mg/L
June July August September Maximum 9.3 8.6 8.7 9.9 Minimum 7.8 6.8 6.8 7.3
Mean 8.4 7.5 7.7 8.6
Water Temperature (degrees Celsius) June July August September
Maximum 24.0 26.4 25.7 24.0 Minimum 16.0 19.3 21.1 15.4
Mean 19.4 23.4 23.2 19.3
pH (standard units) June July August September
Maximum 6.9 6.8 7.2 7.1 Minimum 6.6 6.3 6.7 6.7 Median 6.8 6.6 6.8 7.0
Specific conductance (microsiemens per centimeter at 25 C)
June July August September Maximum 65 70 78 110 Minimum 49 28 59 61
Mean 56 46 66 74
10
3.2 Environment Canada Monitoring Stations – Forest City and Milltown Environment Canada, in partnership with the New Brunswick Department of Environment and Local Government, maintains two automated real-time water quality monitoring stations on the St. Croix River system. The first station is located at the Milltown Dam in Milltown (St. Stephen), New Brunswick and the second station is located in Forest City, Maine. The Milltown station records hourly measurements of temperature, dissolved oxygen, pH, specific conductance and turbidity while the Forest City station records hourly measurements of temperature and conductivity. In order to re-calibrate the measuring devices and to collect a grab sample for water quality analysis, the sites were visited every 5 to 6 weeks during the warmer months and less frequently during the colder months when fouling of the sensors is less problematic. Real time monitoring allows an observer to assess several river water quality parameters quickly at any particular instant in time. This can alert managers to sudden changes in the characteristics of the river and relate them to particular events such as rapid spilling of water, accidental discharges from industry, severe weather events or remote introduction of atmospheric or other pollutants which might threaten the health of aquatic organisms or humans using the river. It could also allow responsible agencies to take rapid intervention to correct the problem.
3.2.1 Interpretation of Real-Time Monitoring Data 3.2.1.1 Milltown Station Monthly summaries of the real-time data and annual charts showing daily means from the Milltown station for each parameter are presented in Appendix 5. This station, operated by Environment Canada (EC), is located just above the Milltown dam at a depth of 1.8 to 3.0 metres depending on head pond elevation. This station and the USGS station reported in Section 3.1 monitor water quality in the “urban” area below Baileyville but generally above St. Stephen/Calais. The real-time water quality station at Milltown was operational for the 2014 year except for a two week period at the end of January. Temperature Water temperature at the site increased gradually until it reached its maximum of 26.5◦C on July 24. The lowest temperature registered was -0.01◦C in January.
11
The daily mean water temperature stayed over 20◦C for 77 consecutive days between June 27 and September 12 which is very similar to the 2012 and 2013 data. Water temperature was below 5◦C for 153 days in 2014. Water temperature at this station averaged 10.4◦C which is 1.3 degree less than in 2013. A small gap in data is present in early September. Dissolved Oxygen Dissolved oxygen readings followed a similar, but inverse, trend to water temperature, reaching the lowest concentration of 7.75 mg/L on July 24, and the highest concentration of 14.87 mg/L on December 8. Dissolved oxygen averaged 11.32 mg/L in 2014. All dissolved oxygen values measured in 2014 were above the minimum Canadian Council of Ministers of the Environment (CCME) Guideline for the Protection of Aquatic Life of 6.5 mg/L with very few values below 8 mg/L. Diurnal changes can be observed at a daily range of values. pH As in 2010 to 2013, measurements of pH in 2014 stayed around the CCME guideline of 6.5 pH units during the coldest half of the year as well as in November. However, pH was slightly below the minimum guideline for a period of 64 days, while it stabilized between 6.5 and 7.1 pH units during the warmer months. The minimum pH measurement was 5.85 pH units, recorded on November 4; and the maximum pH was 7.26, recorded on June 25. Average pH at this station was 6.73 for the year of 2014. The deployment of a new sonde in early September produced a sharp decrease. When the sonde was replaced in early November there was a sharp increase, indicating that the pH sensor for this sonde may have been under reporting pH levels. Corrections for sensor fouling and calibration drift did not help to mitigate these drastic changes. Specific Conductance Specific conductance readings fluctuated moderately between 22 and 120 μS/cm and averaged 49.5 µS/cm during 2014. The lower values were similar to those in 2012-2013, although the maximum was 40uS/cm higher than previous maximum measurements. Measurements of specific conductance reached their highest of 120 μS/cm on October 6, and their lowest of 22 μS/cm on April 18. A sharp drop in specific conductance is usually associated with a rise in stream height or volume.

12
Turbidity Daily mean turbidity values stayed below 1 NTU over 50% of measurements, although turbid events (spikes) occurred once or twice per month (for the period of the record). Turbidity did not record correctly for the deployment period from November to the end of December, thus there is a gap in the figure for that period. 3.2.1.2 Forest City Station Monthly summaries of the real-time data and annual charts showing daily means for conductivity and temperature from the Forest City station for each parameter are presented in Appendix 5. This station, operated by Environment Canada (EC), is located immediately downstream of the dam in Forest City. The real-time water quality station at Forest City was operational for the whole 2014 year. Specific conductance The highest conductivity reading of 50.0 µS/cm was recorded on July 20 while the lowest of 19 µS/cm was recorded on October 17. An average of 23 µS/cm was recorded for the year which is a decrease of almost 10 uS/cm from last year. The general trend of the specific conductance data is an increasing trend towards the summer months and a decreasing trend in the fall months. Temperature Water temperature at the site increased gradually until it reached its maximum of 25.9°C on August 5th. Water temperatures above 20°C were recorded on 73 days, between June 28 and September 11th. There were 169 days when water temperature was below 5°C.

13
3.2.2 Interpretation of Grab Samples Results Six grab samples at the Milltown station and at the Forest City station were collected in 2014. Samples were analysed at Environment Canada’s Atlantic Laboratory for Environmental Testing located in Moncton, NB. That laboratory is accredited by the Canadian Association for Laboratory Accreditation (CALA) for all the parameters reported here. 3.2.2.1 St. Croix River at Milltown, NB Results for each sample taken at Milltown are shown in Appendix 5, along with the applicable CCME guideline for the protection of aquatic life. Where no CCME guideline exists for a parameter, the most pertinent guidelines from another province were used as reference. Missing results reported as “VNA” indicate the results were still pending at the time of this report. A summary of the parameters analyzed is included below.
Total aluminum exceeded the CCME guideline of 100 micrograms per litre (µg/L) in four out of six samples in 2014. Elevated levels of aluminum are fairly common in areas of Atlantic Canada although the aquatic life seems to be in good health. This is believed to be because most of the aluminum in Atlantic Canada rivers is complexed with organic compounds and therefore not bio-available to aquatic life. Dennis and Clair (2012) produced data which supported that theory and developed an algorithm for calculating the amount of complexed aluminum based on measured total organic carbon (TOC) in Atlantic rivers. With TOC values ranging from 6.4 to 11.4 the calculated complexed aluminum concentrations made up a large proportion of the measured total aluminum (at least 75%).
One of the samples exceeded the calculated CCME guideline for cadmium, which ranged from 0.029-0.031 ug/L based on the water hardness, while the other measured values were very near the guideline. Cadmium values at Forest City station were all below the detection limit of the laboratory, indicating that a natural or anthropogenic source of cadmium is located between the two water quality stations. Major pathways for cadmium to enter the aquatic environment are atmospheric fallout and in effluents from smelting and refining industries (CCME 1999). No smelting or refining facilities are located between the two sites.

14
On one occasion, iron was measured slightly above the CCME guideline for iron of 0.3 mg/L. Iron is not considered to pose a risk to aquatic life as a small proportion of it is likely available for uptake by aquatic life.
The CCME guidelines for copper, nickel and lead are all based on a formula which uses water hardness to determine guideline concentration and also has a minimum regardless of water hardness. Based on the range of water hardness at the Milltown station, we used the minimum values stated in the CCME guidelines for these metals (Appendix 5). No values exceeded those guidelines.
No total phosphorous concentrations were above the Ontario Ministry of the Environment (OMOE, 1994) phosphorous guideline of 0.03 mg/L indicating no eutrophic conditions in the river.
pH values were not measured outside the 6.5 to 9 range, recommended by the CCME.
3.2.2.2 St. Croix River at Forest City, ME Results for the sample taken at Forest City are shown in Appendix 5, along with the applicable guideline for the protection of aquatic life. Where no CCME guideline exists for a parameter, the most pertinent guidelines from another province were used as reference. No parameters exceeded applicable guidelines in 2014.

15
3.3 Water Quality Index The CCME water quality index (WQI) is a useful tool to summarize water quality at monitoring sites visited regularly. It measures the frequency and extent to which selected parameters exceed water quality guidelines and reports the results as a single score. This allows for a quick assessment of the status of the water body and can be used as an indicator of overall aquatic health. Further analysis should always be completed on individual parameters in addition to other assessments (e.g. biological) for a full evaluation of aquatic health. More information on the CCME WQI is available at: http://www.ccme.ca/ourwork/water.html?category_id=102. The WQI ratings were calculated each year using samples from the current year and those from the previous two years. Three-year rolling scores dampens strong fluctuations that may result from having small sample sizes and provides a more accurate representation of overall water quality. The parameters and guidelines used in the index are included in Table 2. These are consistent with parameters used by New Brunswick Department of Environment and Local Government in the Canadian Environmental Sustainability Indicators (CESI) project with the exception of ammonia as this is not part of the laboratory analysis at these two sites. Guidelines used are for the protection of aquatic life and thus, the WQI scores will reflect this intended water use only.
Table 2. Parameters and Guidelines used in the WQI Calculations
Parameter Units Lower Guideline
Upper Guideline
Guideline Source
Arsenic µg/L 5 CCME, 2005 Chloride mg/L 120 BC MOE, 2001 Copper µg/L 2 CCME, 2005 Iron mg/L 0.3 CCME, 2005 Nitrate mg/L as Nitrogen 3 CCME, 2005 Dissolved Oxygen mg/L 6.5 CCME, 2005 Phosphorous mg/L 0.03 OMOE, 1994 pH pH units 6.5 9.0 CCME, 2005 Turbidity NTU 10 CCME, 2005 Zinc µg/L calculated BC MOE, 2001
Notes: µg/L – micrograms per Litre; mg/L – milligrams per Litre; NTU – nephelometric turbidity units

16
WQI ratings rank from 0 to 100, with higher scores indicating better water quality. Forest City was only sampled once in 2011, rather than the typical 6 to 8 per year, as a result of flooding resulting in stoppage of the stream gauge and water quality sonde for part of the year. The WQI scores for both stations were very consistent over the 2007 to 2014 period. Scores varied between 82.5 and 82.9, or “good”, at Milltown and stayed at 100, or “excellent”, at Forest City. Over the eight-year period, exceedances of water quality guidelines at Milltown were observed for zinc for 15% of samples, 8% for total phosphorus, and 4% for iron. Increased levels of zinc, phosphorus and iron between the two stations are indicative of wastewater discharge from municipal and industrial sources.
Figure 2. Water Quality Index Scores for the St. Croix River, 2007-2014
References: [BC MOE] British Columbia Ministry of the Environment, 2001. BC Approved Water Quality Guidelines (criteria) 1998 edition. Environmental Protection Division, British Columbia Ministry of Environment, Victoria, British Columbia. Updated August 24, 2001 (http://www.env.gov.bc.ca/wat/wq/wq_guidelines.html). [CCME] Canadian Council of Ministers of the Environment. 2005. Canadian Environmental Quality Guidelines. Update 5.0. Canadian Council of Ministers of the
0
20
40
60
80
100
2007‐09 2008‐10 2009‐11 2010‐12 2011‐13 2012‐2014
WQI score
Milltown
Forest City
Excellent
Good
Fair
Marginal
Poor

17
Environment, Winnipeg, Manitoba (www.ccme.ca/publications/ceqg_rcqe.html). Dennis IF and Clair TA. 2012. The distribution of dissolved aluminum in Atlantic salmon (Salmo salar) rivers of Atlantic Canada and its potential effect on aquatic populations. Can J Aquat Sci 69:1174-1183. [OMOE] Ontario Ministry of the Environment. 1994. Water Management Policies, Guidelines, Provincial Water Quality Objectives of the Ministry of Environment [reprinted February 1999]. Ontario Ministry of the Environment. 67 pp.

18
4.0 STATUS OF POLLUTION ABATEMENT
4.1 Maine
Baileyville: The Baileyville Wastewater Treatment Facility was in compliance with its wastewater discharge permit except for the following incidents: a monthly average flow violation for April 2014 and one settleable solids violation in July 2014. The monthly average flow violation in April was attributed to snow melt and rain. The settleable solids violation in July was due to significant influent flows from high rains attributed to Tropical Storm Arthur. Calais: The Calais Wastewater Treatment Facility continues to be in compliance with their wastewater discharge permit. The facility is part of the Maine Department of Environmental Protection’s Combined Sewer Overflow (CSO) program and has a Department approved CSO Master Plan which was updated in December 2014. The updated CSO Master Plan lists the many projects that have been completed as well as a tentative schedule for completing the projects that remain. The tentative schedule lists projects out to the year 2019. Woodland Pulp LLC: The Woodland Pulp Mill in Baileyville (Woodland Pulp) was in compliance with its wastewater discharge permit except for the following incidents. Woodland Pulp had three months with zinc violations in 2014: February, March and April. During this time the mill was still implementing corrective actions that were initiated in 2013. Additionally, the mill's Wastewater Discharge Permit was renewed in June 2014 and concentration limits for zinc are no longer applicable for this facility. The mill does have a daily maximum pound limitation for zinc and has reported compliance with that limitation in 2014.The mill reported two silver violations during April 2014. The mill reported that this result was out of the ordinary but could be attributed to a period of time when a greater amount of bark was being added to the process. Woodland Pulp reported a <500 gallon spill of dilute leachate from its landfill collection pond in January. This was attributed to a leaking weir plate that was repaired upon discovery. In July the mill identified a sink hole adjacent to a catch basin in the courtyard area. An unknown quantity of process wastewater was discharged to the ground. A temporary repair was made immediately and a more permanent repair was made during a mill shutdown in early September. In November the mill reported a <10,000 gallon discharge of filtrate and stock from the knot bunker area to the ground adjacent to a paved containment area. The compromised berm was repaired immediately after discovery.

19
In accordance with permit requirements the mill submitted a Site Specific Criteria Development Plan to seek alternative water quality criteria for cadmium, copper, lead and zinc. In addition, a report was submitted to the Department summarizing source reduction opportunities for mitigating the discharge of total cadmium. Both documents are being reviewed by Maine Department of Environmental Protection staff. 4.2 New Brunswick On January 1, 2013, the Government of Canada, through the Canadian Council of the Ministers of the Environment (CCME), launched the Wastewater System Effluent Regulation (WSER), a new regulation aimed at the management and improvement of Municipal wastewater effluent. This regulation, coupled with the Canada Wide Strategy for the Management of Municipal Effluent from the CCME, works to help to regulate and improve wastewater systems across New Brunswick. Among other requirements under the strategy, all Municipal Systems will have to undertake an Environmental Risk Assessment (ERA) to identify any potential discharge objectives associated with their facilities. These assessments typically take up to three years to complete and are partially funded by the NB Environmental Trust Fund. Beginning in 2013, the New Brunswick Department of Environment and Local Government began a partnership with Environment Canada under an agreement to administer both the WSER and Provincial regulations for Municipal systems. Under this agreement, each system will receive an Approval to Operate containing all appropriate regulatory requirements with the single point of contact being the Province. This method will ensure a seamless transition to the WSER regulation while safeguarding that all systems are aware and in compliance with the complete suite of applicable regulations. McAdam: The McAdam wastewater treatment facility continues to meet the effluent requirements of the Province of New Brunswick. The McAdam wastewater treatment facility is an oxidation type system that uses an activated sludge process. The Village has submitted the completed ERA for their system. The collection system upgrades in 2012/2013 have shown a noticeable reduction in influent to the Municipal Wastewater Plant. Pending upgrades also include a dechlorination chamber to meet WSER requirements.

20
St. Stephen: The Wastewater lagoon system along Dennis Stream continues to meet the effluent requirements of the Province of New Brunswick. By 2016 the Town of St. Stephen will have to identify all Combined Sewer Overflow (CSO) points and adhere to their developed CSO plan. The St. Croix Estuary Project (SCEP) has received funds from Environment Canada to conduct outfall sampling beginning in 2012 and continuing through 2014. As results become available, the Town and SCEP will evaluate this data to verify the effectiveness of upgrades undertaken to the collection system. Starting in 2015, SCEP will begin to shift their focus to pathogenic issues in the St. Croix River system as well as include an outfall sampling project. Champlain Industrial Park: The extended aeration facility treats the domestic wastewater of its employees as well as the industrial inputs from the industrial park. Current loadings on this facility suggest that there is a reduction of activity within the Industrial Park which will lead to improved effluent standards though the effluent currently meets the limits set in the Certificate of Approval to Operate. St. Croix Ventures Mobile Home Park: The facultative lagoon treats the domestic wastewater of the 58 mobile homes in the park. The facility discharges treated effluent to the marshy headwaters of Meadow Brook. In 2012, a new owner purchased this facility. Prior to taking ownership, the purchaser enquired with the Province as to what permits and responsibilities they would have to undertake and are thus fully cognizant of their Wastewater Approval compliance obligations to the Province. In 2014 another new owner has purchased this property and began upgrades to both the potable and domestic systems. Oak Bay Park: The Oak Bay Campground uses a trickling filter system to treat the domestic wastewater from 110 campsites prior to discharging the treated, disinfected effluent to Oak Bay. The Department of Environment and Local Government, Regional Office in Saint John is responsible for this file and maintains regular contact with the system proprietor. A discussion was held in 2014 to ensure the proprietor was aware that prior to an expansion of sites, a wastewater upgrade would be required.

21
5.0 FISHERIES
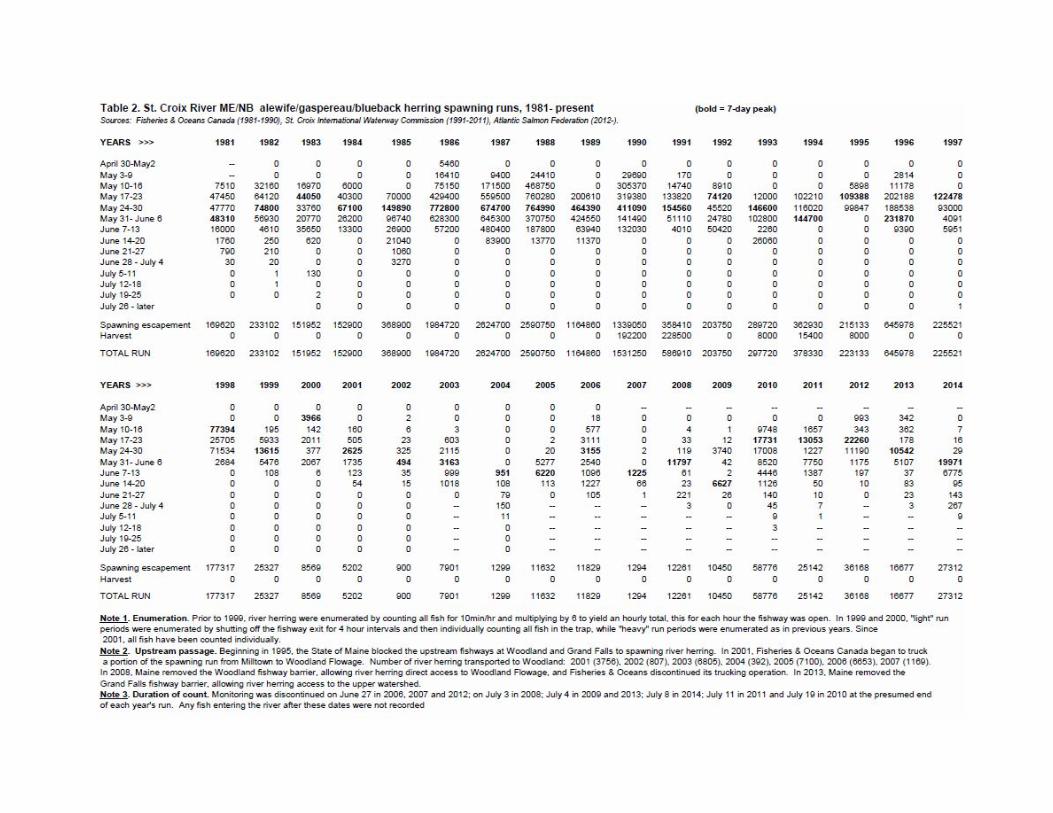
5.1 Anadromous Fisheries Summary: Anadromous fish species – including alewives (Alosa pseudoharengus), also known as gaspereau, and Atlantic salmon (Salmo salar) – have been counted annually at the research trap at the Milltown dam fishway since 1981. The dam is at the head-of-tide on the St. Croix River and is owned by the New Brunswick Power Corporation. The fishway and research trap are located on the Canadian side of the river and are under the jurisdiction of Canada's Department of Fisheries and Oceans (DFO). Since 2007, the Milltown research trap has been operated for only a limited number of weeks in May-July to record the alewife spawning run. Since 2012, the Atlantic Salmon Federation (ASF) has operated the trap and collected data under agreements and/or partnerships with the St. Croix International Waterway Commission, the IJC, DFO, New Brunswick Power and the Maine Department of Marine Resources (DMR). The Milltown fishway and research trap were activated simultaneously on May 5 when spring water flows had fallen to levels that allowed for effective fishway operation. The trap was then operated continuously, with all fish counted individually, until July 8 when it was lifted due to hazardous conditions resulting from high flows and debris from an intense tropical storm. Unfavorable water conditions persisted into mid-July and trap counts to July 8 are presumed to record the full 2014 run. After July 8, NB Power continues to operate the fishway until November, without recording fish passage. River Herring1: There has been a general trend toward improving returns in recent years, presumably due to DFO trap-and-truck operations (2001-2008) and the State of Maine’s re-opening of the Woodland fishway (2008-present) that together restored access to 475 hectares (1,174 acres) of river herring spawning habitat, and Maine’s re-opening of the Grand Falls fishway in 2013 to restore access to another 16,724 hectares (41,325 acres) of spawning habitat in the upper watershed. Prior to spawning barriers first being initiated in 1987, these St. Croix waters supported a run of up to 2.6 million alewives in the mid-1980s. The 2014 run of 27,312 was the third highest return in the last 16 years but still lower than anticipated. Variability in freshwater or marine survival of one or more year
1. River herring is the general name for two species, the alewife and the blueback herring.

22
classes may have been a contributing factor. A technical issue with the fishway attraction flow was also noted and preliminarily investigated by the Department of Fisheries and Oceans. This will be examined further for 2015.
In 1995, the State of Maine blocked alewife passage at the next upstream dam, at Woodland, which restricted the fish to less than 0.2% of its believed historic St. Croix spawning habitat. A trap-and-truck operation by DFO from 2001-2007 and the State's reopening of the Woodland fishway to alewives in 2008 has given the species access to an additional 475 hectares (1174 acres) of spawning habitat in Woodland Flowage for the last twelve years. In April 2013, the Maine Legislature and Senate overwhelmingly approved an emergency bill to reopen the remaining areas of the eastern branch of the St. Croix (above Grand Falls and Vanceboro) to alewife passage. The re-opening of this habitat is expected to contribute to the increased return trend noted previously. A total of 39 alewives were lethally sampled at Milltown for fork length, body weight, gonad weight, sexual maturity stage, scale age and previous spawning record. An additional 30 alewives were live sampled for fork length, scale age and previous spawnings for a tracking study. Scale reading identified one fish as a blueback herring: a three-year-old male returning for the first time. This is the second consecutive year that a blueback herring has appeared in the Milltown sample, after more than a decade of absence. This fish and a seven-year-old female recorded in 2013 suggest that blueback herring have continued to comprise a portion of the St. Croix river herring run over the long term, generally undetected in the small Milltown sample size. Blueback herring were last documented in Milltown river herring samples in 1993 (18% of 413 fish) and 1990 (27% of 313 fish) while samples in 1992 (509 fish) and 1991 (111 fish) were exclusively alewife. Variable sampling protocols and limited sample size preclude any conclusions from these data but do offer some insight. Other species: Other fish captured in the Milltown trap during the course of the monitoring period are counted and immediately released upstream, unharmed, unless specified by fisheries agencies for removal. In 2014, three freshwater fish species were recorded in small numbers; these are all assumed to have passed over the dam spillway or through open gates and returned up the fish ladder after encountering brackish water.
23
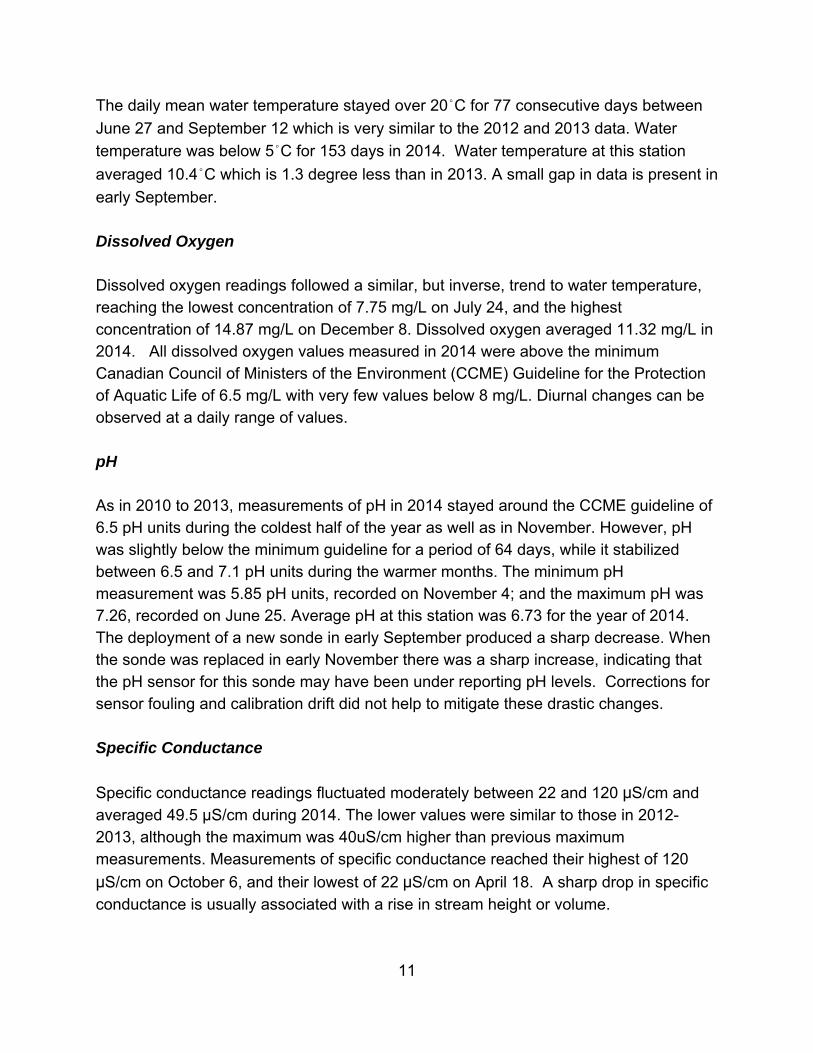
Four diadromous fish species in addition to river herring have been recorded at the Milltown trap at various times since 1981. In 2014 only one was documented: individual sea lamprey (Petromyzon marinus) passed the trap on June 3 and June 30. Both were approximately 40 cm in length. Juvenile American eel (Anguilla rostrata) can pass through the trap’s 1-inch mesh unimpeded and therefore are rarely recorded. Wild Atlantic salmon (Salmo salar) have not been recorded at the Milltown trap since 2006 and American shad (Alosa sapidissima) have not been recorded since 1999. Escaped farmed salmon have been recorded at the trap in the past. A summary by fish species for 2014 is shown below.
Species Trap Count
Alewife/blueback herring 27,312 Sea lamprey 2 White sucker 40 Smallmouth bass 8 Brook trout 2
5.2 Shellfish Harvesting New Brunswick: Shellfish harvesting occurs principally in Oak Bay, either for direct marketing within areas designated as conditionally approved, or for depuration in areas designated as restricted. Environment Canada sampled St. Croix River and Oak Bay marine water quality stations on five occasions from July 3 to October 17, 2014. Additional water quality sampling was performed as part of the bay’s Conditional Management Plan (CMP) which allows shellfish harvesting during dry / low rainfall conditions. No significant change in bacteriological water quality was observed in 2014. Fecal coliform densities were consistent with those observed in previous years (i.e., 2000, 2003, 2006, 2007, 2008, 2009, 2011, 2012 & 2013). Significant rainfall events continue to trigger a rise in fecal coliform densities. This confirms the adequacy of the current shellfish growing area classification. Maine: The shoreline along Calais and Robbinston, Maine has limited habitat for commercial shellfish. Most of area is classified as prohibited to shellfishing by the Maine Department of Marine Resources, Division of Shellfish Management to protect public health. However, there are two small coves opened on a seasonal conditional

24
basis. For more information on these areas refer to the November 2014 notice from that Maine Department of Marine Resources at: http://www.maine.gov/dmr/rm/public_health/closures/62.pdf
6.0 IJC INTERNATIONAL WATERSHED INITIATIVES
The following are projects in the St. Croix Watershed that are supported in part by the IJC’s International Watershed Initiative (IWI) program.
6.1 On-going Aquatic Food-Web Study Beginning in 2013, an ecological assessment of the St. Croix system was initiated by the IJC's International Watershed Initiative (IWI) and headed by the USGS Maine Cooperative Fish and Wildlife Research Unit at the University of Maine (Orono, Maine). The objective of this study is to explore the effects of marine-derived nutrients on freshwater food webs as alewives return to the St. Croix watershed. To characterize the presence of marine-derived nutrients, fish, aquatic insect, and zooplankton samples were collected in 2013 and 2014 for stable isotope analysis. Stable isotope ratios will be used to infer differences between communities with and without direct marine input. Such information with provide a baseline description of the freshwater food web prior to the anticipated recovery of the alewife run after fish passage improvements. Samples have been collected from seven sites in the St. Croix watershed. These sites include lake, impoundment, and main stem reaches. Samples were also collected at two sites in the East Machias River, a system with an established alewife run comparable to that which is anticipated in the St. Croix River. Samples from both years are currently being analyzed. In order to characterize nutrient limitation in the areas sampled, "nutrient diffusers" were deployed beginning in 2014. This approach allows for the characterization of limitations of primary productivity. A last year of samples will be collected in 2015 and focus will shift to analysis and reporting. A nutrient model will be developed to trace the net flow of nutrients into and out of the St. Croix watershed based on the information collected. 6.2 USGS Spednic Lake Study The objective of this project was to establish an estimated historical record of the temperature of Spednic Lake based on available meteorological data and use the estimated historical record to model survival of small mouth bass juveniles in their first year from 1970 to 2008. Regression modeling was used to estimate average daily

25
water temperature in Spednic Lake for April through October for each year; on the basis of estimated water temperatures, the dates of spawning were determined for each year. Mortality was estimated from the minimum average daily temperature each year. Growth models were used to estimate daily growth increments throughout the summer for bass spawned on the first and last days of the spawning period. Daily growth increments were summed over the growing period and added to an assumed average size at rise to estimate the total length of juveniles at the start of the winter for each year. The survival modeling identifies years when smallmouth bass year class strength were likely to have been challenged by meteorological conditions. A USGS Scientific Investigations Report documenting the analyses was completed in October 2014 and is available on-line at the link below. Dudley, R.W., and Trial, J.G., 2014, Estimates of growth and mortality of under-yearling smallmouth bass in Spednic Lake, from 1970 through 2008: U.S. Geological Survey Scientific Investigations Report 2014–5164, 15 p., http://dx.doi.org/10.3133/sir20145164. ISSN 2328–0328 (online) 6.3 Sustaining the St. Croix Watershed: Research, Partnerships and Action On November 20 and 21, 2014, the planned watershed forum entitled “Sustaining the St. Croix Watershed: Research, Partnerships and Action” was held at the Huntsman Marine Sciences Centre in St. Andrews, NB. The event brought together over 75 people from research institutions, government agencies, non-profit organizations, and the general public to share current research, discuss gaps and identify priorities in four theme areas. Themes were Fisheries, Ecosystems-based Management, Climate Change, and Resilient Communities. Highlights of the event included a frank and informative discussion on fisheries management during the panel session, and the after-hours event at Sunbury Shores Art Centre. Across all themes and discussions, the need for communication and facilitation amongst the groups at the event was highlighted. Speakers and Panelist and the agenda for the event are at the project web site. http://www.stateofthestcroix.org/ A summary report will be issued in spring 2015. 6.4 Alewife Count at Milltown In 2014, the IJC’s IWI program continued to provide support for the alewife count at Milltown Dam in partnership with the efforts of goverment and non-governmental organizations. The collected data is discussed in Section 5.0 in this report.

26
7.0 Additional Items to Report 7.1 Alewife Restoration Next Steps Group On April 10, 2013, the Maine Legislature passed, by an overwhelming majority, a bill to grant alewife (Gaspereau) unconstrained passage at Woodland and Grand Falls dam in the St. Croix River watershed. Ten days later, on April 22 the law came into effect. On June 5, 2013, a Statement of Cooperation was signed between Wabanaki Tribal leaders (Passamaquoddy) and four US Federal agencies (US Fish and Wildlife Service, National Marine Fisheries Service, US EPA, Region 1, and Bureau of Indian Affairs) and reaffirmed the commitment of the Tribe and Federal agencies to continue working together to restore the St. Croix River and Passamaquoddy Bay ecosystem. To accomplish this goal the Passamaquoddy Tribe and the four US Federal agencies noted above formed a “Next Steps” work group. As a result, and in cooperation with the Canadian government and the dam owners on both sides of the border, the group is reviewing the fish passage at the dams on the St. Croix River. The US Fish and Wildlife Service is the lead for preparing a fishway report. The report is expected to be available sometime in 2015. 7.2 FERC Dam Relicensing Vanceboro Dam/Spednic Lake: On March 1, 2011, Woodland Pulp LLC filed a notice of intent to start the re-licensing process for Vanceboro Dam which is located along the International Boundary. The current license expires in March 2016. The process is following the U.S. Federal Energy Regulatory Commission (FERC) integrated Licensing Process requirements and is on-going. The Docket number is P-2492-000. In 2011, focus was on preparing, filing and distributing for comment the requisite documents including background information and proposed study plans. In 2012, focus moved to identification, comment approval and implementation of studies and study plans. Corresponding field work was conducted in the areas of archaeology, fisheries, water quality, flora and fauna (including aquatic invertebrates and invasive species), wetlands, recreation, bathymetry and habitat, among other attributes. In 2013, study results were circulated for review and comment individually and in the Form of a Preliminary License Application (PLA). Additional information was provided and supplemental field work associated with fisheries and water quality was conducted. A Final License Application (FLA) was filed in February 2014. The FLA included study information, project specifications, answers to comments and requests and other required and/or relevant information. FERC deemed the application complete and is reviewing the FLA and has solicited comments. Preparation of an Environmental Assessment is the next step.
27
As part of the FERC licensing process, Woodland Pulp also filed an application for State 401 Water Quality Certificate with Maine Department of Environmental Protection and the application is under review by the Department. Forest City Dam/East Grand Lake: The Forest City Dam (Forest City Project) and the West Grand Lake and Sysladobsis and Farm Cove Dams (West Branch Project) on the St. Croix River system owned by Woodland Pulp LLC are also in the FERC re-licensing process. The Forest City Dam is located on the International Boundary. The licenses expired in 2000. Since 2000 these projects have been operating on annual licenses. Docket numbers are P-2660-024 and P-2618-024. Woodland Pulp and its predecessors as licensee of these projects in past sought to have FERC determine that the projects were not required to be licensed. However, in 2011 FERC ruled that licensing was required. A draft Environmental Assessment was issued by the FERC in October 2014 and comments were solicited. A final Environmental Assessment was issued in January 2015. It is expected that the licenses will be issued by FERC in 2015. Note: The above FERC licensing information is provided in the Board’s Annual Report for general information purposes only.

28
ACKNOWLEDGEMENTS
The International St. Croix River Watershed Board gratefully acknowledges the valuable input and efforts in support of this report provided by the following groups/ individuals and without which the preparation of this report would not be possible. Jonathan Carr Atlantic Salmon Federation Lee Sochasky Atlantic Salmon Federation Tim Andrews Environment Canada Dave Benoit Environment Canada Luc Bernard Environment Canada Derek Elliott Environment Canada Benoit Lalonde Environment Canada Vincent Mercier Environment Canada Paul Noseworthy Environment Canada Bernard Richard Environment Canada Kathyrn Parlee Environment Canada Susanne Miller Maine Department of Environmental Protection Brad McPhereson New Brunswick Department of Environment and
Local Government Darryl Pupek New Brunswick Department of Environment and
Local Government Abby Pond St. Croix International Waterway Commission Barbara Blumeris U.S. Army Corps of Engineers Laura Flight U.S. Geological Survey Nick Stasulius U.S. Geological Survey Gregory Stewart U.S. Geological Survey Bob Lent U.S. Geological Survey Joseph Zydlewski U.S. Geological Survey Jay Beaudoin Woodland Pulp LLC.

APPENDIX 1
SUMMARY - ORDERS OF APPROVAL & BASIN MAP


SUMMARY - ST. CROIX RIVER ORDERS OF APPROVAL INTERNATIONAL JOINT COMMISSION 9 November, 1915- For approval of a dam and power canal and the obstruction,
diversion and use of the waters of the St. Croix River at Grand Falls in the State of Maine and the Province of New Brunswick: Maximum elevation 202.0 feet m.s.l.
3 October, 1923- Erection and repairs of fishways in the St. Croix River. 6 October, 1931- For the obstructions of the waters of t he St. Croix River at Grand
Falls in the State of Maine and the Province of New Brunswick. Increase in elevation to 203.5 feet m.s.l.
2 October, 1934- For the reconstruction of a dam across the St. Croix River from
Milltown in the Province of New Brunswick to Milltown in the State of Maine.
15 October, 1965- For the construction of a storage dam in the St. Croix River at
Vanceboro, Maine and St. Croix, New Brunswick:
Discharge from Spednic Lake- 200 cfs ( 5.66 m3\s ) minimum
Elevation of Spednic Lake- 385.86 feet (117.611 metres ) maximum
Between 1 October and 30 April- 371.50 feet (113.233 metres) minimum
Between 1 May and 30 September- 376.50 feet (114.759 metres ) minimum
Discharge from East Grand Lake- 75 cfs ( 2.12 m3\s ) minimum
Elevation of East Grand Lake- 434.94 feet (132.571 metres ) maximum
427.94 feet (130.438 metres ) minimum 16 November, 1982- For the reconstruction of the diversion dike in the St. Croix River
near Baileyville, Maine.
Appendix 1 - page 1

Appendix 1 - page 2


APPENDIX 2
MILLTOWN, GRAND FALLS, VANCEBORO AND FOREST CITY DAMS

Appendix 2 - Page 1
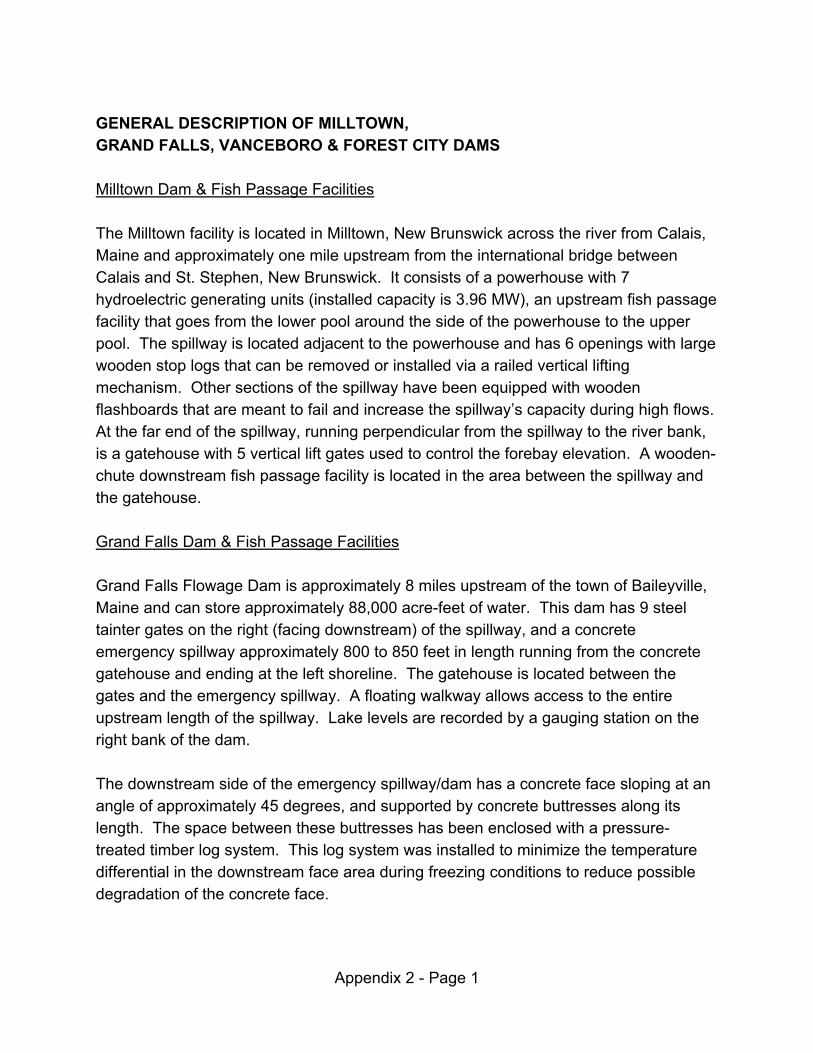
GENERAL DESCRIPTION OF MILLTOWN, GRAND FALLS, VANCEBORO & FOREST CITY DAMS Milltown Dam & Fish Passage Facilities The Milltown facility is located in Milltown, New Brunswick across the river from Calais, Maine and approximately one mile upstream from the international bridge between Calais and St. Stephen, New Brunswick. It consists of a powerhouse with 7 hydroelectric generating units (installed capacity is 3.96 MW), an upstream fish passage facility that goes from the lower pool around the side of the powerhouse to the upper pool. The spillway is located adjacent to the powerhouse and has 6 openings with large wooden stop logs that can be removed or installed via a railed vertical lifting mechanism. Other sections of the spillway have been equipped with wooden flashboards that are meant to fail and increase the spillway’s capacity during high flows. At the far end of the spillway, running perpendicular from the spillway to the river bank, is a gatehouse with 5 vertical lift gates used to control the forebay elevation. A wooden-chute downstream fish passage facility is located in the area between the spillway and the gatehouse. Grand Falls Dam & Fish Passage Facilities Grand Falls Flowage Dam is approximately 8 miles upstream of the town of Baileyville, Maine and can store approximately 88,000 acre-feet of water. This dam has 9 steel tainter gates on the right (facing downstream) of the spillway, and a concrete emergency spillway approximately 800 to 850 feet in length running from the concrete gatehouse and ending at the left shoreline. The gatehouse is located between the gates and the emergency spillway. A floating walkway allows access to the entire upstream length of the spillway. Lake levels are recorded by a gauging station on the right bank of the dam. The downstream side of the emergency spillway/dam has a concrete face sloping at an angle of approximately 45 degrees, and supported by concrete buttresses along its length. The space between these buttresses has been enclosed with a pressure-treated timber log system. This log system was installed to minimize the temperature differential in the downstream face area during freezing conditions to reduce possible degradation of the concrete face.

Appendix 2 - Page 2
Water is impounded behind Grand Falls Dam and delivered to the hydroelectric plant and fish passage facilities via a channel on the right side of the impoundment, approximately 1000 feet upstream of the dam. Water flows to the turbines via three steel penstocks. A Denil fishway is located on the side of the hydroelectric plant. It is a concrete structure with a series of bays equipped with guide slots that allow for the installation of wooden V notched weirs to modify flows to levels acceptable for fish migration. Vanceboro Dam & Fish Passage Facilities Vanceboro Dam consists of an earth embankment with a concrete gate structure and with rock filled gabions on the upstream face. The concrete structure is 69 feet (21 m) long, and contains a fishway and two tainter gates, each 22’-6” (6.9 m) wide by 14’-6” (4.4 m) high. These gates are operated by electrical cable lifts. The gate structure is located on the International Boundary line between the United States and Canada. Gate sill elevation is at 371.5 feet (113.23 m) NGVD. Normal full pond elevation is at 385.86 feet (117.61 m), with an impounded surface of 20,870 acres (84.5 km2). There are approximately 221,200 acre-feet (0.27 km3) of useable storage at normal full pond. The fishway is a vertical slot fish ladder and is to the left of the tainter gates and consists of 10 bays or pools. There are 5 vertical lift wooden gates to regulate flow through the ladder. There is a steel trash rack on the upstream face of the fish passage. Forest City Dam & Fish Passage Facilities Forest City Dam is a small timber crib rock filled structure with three wooden sluice gates operated with a wooden ratchet lever system that lifts the gates using a steel cable or steel chain. These gates have openings of 8'-4" (2.54 m) and a sill elevation of 427.94 feet (130.44 m) NGVD. Full pond elevation is at elevation 434.94 feet (132.57 m) NGVD, and impounds 105,300 acre-feet (0.130 km3) of water. The fishway is located on the left side (facing downstream) of the dam and consists of timber baffle system with an upstream timber trash rack.

Appendix 2 - Page 3
FACITILY SITE VISITS IN 2014 Board members met with New Brunswick Power Corporation officials (NB Power) on June 4, 2014 at the Milltown Dam in New Brunswick and participated in a site visit of the facility. Board members met with Woodland Pulp LLC officials on June 4, 2014 at the Woodland Mill at Baileyville, Maine and then Board members participated in site visits at Grand Falls, Forest City, and Vanceboro Dams. Participants included in the NB Power and Woodland Pulp LLC meetings and site visits are shown below: IJC and Board Representatives: Name Affiliation Dereth Glance IJC Commissioner, U.S. Section Benoit Bouchard IJC Commissioner, Canadian Section Joe Babb IJC staff, US Section Glenn Benoy IJC staff, Canadian Section Bill Appleby St. Croix Board, Chair, Canadian Section Colonel Samaris St. Croix Board, Chair, U.S. Section Ralph Abele St. Croix Board, U.S. Section Bob Lent St. Croix Board, U.S. Section Susanne Miller St. Croix Board, U.S. Section Jessie Davies St. Croix Board, Canadian Section Barbara Blumeris Secretary, St. Croix Board, U.S. Section Kathryn Parlee Secretary, St. Croix Board, Canadian Section
Facility Representatives: Jeff Babcock Hydro Manager, NB Power Glen Hanscom Hydro Technical Services, NB Power Jay Beaudoin Environmental Manager, Woodland Pulp LLC Kevin Dean Hydro Superintendent, Woodland Pulp LLC Scott Beal Environmental Manager, Woodland Pulp LLC

Appendix 2 - Page 4
Forest City Dam. No changes reported in 2014. In 2013 a new gate was added to control access to dam. FERC conducts periodic dam safety inspections. Forest City Dam (6-4-2014), View of dam from downstream.
Forest City Dam (6-4-2014), View of gates from upstream.

Appendix 2 - Page 5
Vanceboro Dam. No changes reported in 2014. FERC conducts periodic dam safety inspections.
Vanceboro Dam (6-4-2014), View of fishway.
Vanceboro Dam (6-4-2014). View of flow through Tainter gates.

Appendix 2 - Page 6
Grand Falls Dam. Maine Emergency Management Agency, Dam Safety Program and the owner Woodland Pulp conduct periodic dam safety inspections. In 2014 Woodland Pulp reported rebuilding one of the turbines at project. Grand Falls Dam (6-4-2014), Upstream side of spillway from US side.
Grand Falls Dam (6-4-2014), View of Tainter gates from downstream.

Appendix 2 - Page 7
Grand Falls Dam (6-4-2014), View of Denil fishway above the powerhouse.
. Grand Falls Dam (6-4-2014), View of Denil fishway alongside powerhouse.

Appendix 2 - Page 8
Milltown Dam. During the Board's annual site visits, it has been observed that there is a crack in the floor of the powerhouse near units 5/6/7. This is not a new issue as the crack has been apparent since the 1980s. However, several years ago NB Power reported to the Board that there was increased movement in the crack. At that time (2003) NB Power took actions to assess the situation and established procedures to prevent further movement of the wall. NB Power set up heated hoarding on the outside face of the wall to prevent freezing and thawing action and has continued to use this method. NB Power continues to monitor the wall to make sure that additional actions are not required. As part of 2014 facility maintenance, NB power reported repair to the hoarding, replacement of wooden stop logs, and planned repair to one of the wooden gates at the gatehouse. Each year, NB Power technical staff conducts an annual inspection of the facility structures. In addition, NB power engages an independent engineering consultant to provide periodic review of the facilities. Milltown conduct their 4 year inspection in summer 2012 and the report completed in April 2013 indicated satisfactory conditions. Milltown Dam (6-4-2014), View of spillway and powerhouse.
Appendix 2 - Page 9
Milltown Dam (6-4-2014), Powerhouse with enclosure installed on tailrace wall.
Milltown Dam (6-4-2014), Gate House.

Appendix 2 - Page 10
Milltown Dam (6-4-2014), View of fishway.

APPENDIX 3
WATER LEVELS AND FLOWS

(This page intentionally left blank.)

DAY JAN FEB MAR APR MAY JUN JUL AUG SEP OCT NOV DEC DAY1 131.713 131.962 131.791 131.823 132.397 132.355 132.346 132.077 131.883 131.493 131.723 132.043 12 131.713 131.959 131.783 131.821 132.390 132.344 132.330 132.071 131.870 131.486 131.762 132.047 23 131.714 131.950 131.773 131.821 132.376 132.332 132.317 132.066 131.870 131.479 131.779 132.057 34 131.705 131.940 131.766 131.821 132.364 132.327 132.313 132.065 131.853 131.473 131.771 132.072 45 131.703 131.933 131.760 131.831 132.368 132.328 132.404 132.086 131.831 131.483 131.772 132.071 5
6 131.713 131.929 131.753 131.838 132.359 132.353 132.437 132.094 131.819 131.481 131.781 132.076 67 131.736 131.919 131.747 131.842 132.354 132.352 132.434 132.092 131.811 131.468 131.825 132.093 78 131.740 131.909 131.742 131.860 132.352 132.345 132.422 132.085 131.787 131.485 131.853 132.089 89 131.744 131.899 131.738 131.882 132.346 132.340 132.402 132.075 131.765 131.494 131.864 132.089 9
10 131.748 131.892 131.734 131.902 132.350 132.344 132.384 132.065 131.746 131.487 131.881 132.124 10
11 131.760 131.882 131.732 131.927 132.356 132.343 132.357A 132.054 131.725 131.480 131.892 132.201 1112 131.809 131.871 131.736 131.960 132.356 132.334 132.333 132.045 131.718 131.476 131.906 132.237 1213 131.830 131.865 131.765 131.999 132.352 132.327 132.298 132.030 131.691 131.467 131.918 132.256 1314 131.853 131.884 131.763 132.041 132.345 132.343 132.280 132.039 131.678 131.460 131.928 132.261 1415 131.920 131.880 131.763 132.104 132.340 132.356 132.258 132.049 131.656 131.458 131.936 132.261 15
16 131.954 131.883 131.763 132.222 132.336 132.348 132.263 132.042 131.638 131.454 131.933 132.247 1617 131.983 131.874 131.761 132.291 132.331 132.338 132.262 132.038 131.625 131.503 131.941 132.240 1718 132.010 131.865 131.758 132.334 132.343 132.360 132.243 132.037 131.613 131.531 131.961 132.255 1819 132.033 131.862 131.756 132.364 132.366 132.378 132.228 132.028 131.594 131.540 131.960 132.229 1920 132.051 131.858 131.769 132.384 132.386 132.378 132.211 132.020 131.572 131.534 131.959 132.201 20
21 132.054 131.851 131.775 132.398 132.393 132.372 132.194 132.012 131.559 131.529 131.966 132.173 2122 132.047 131.85 131.776 132.405 132.397 132.367 132.178 132.005 131.559 131.533 131.957 132.145 2223 132.038 131.842 131.777 132.412 132.397 132.362 132.161 131.998 131.548 131.554 131.956 132.119 2324 132.027 131.833 131.776 132.434 132.394 132.352 132.156 131.989 131.536 131.623 131.958 132.101 2425 132.018 131.824 131.776 132.445 132.389 132.356 132.137 131.980 131.527 131.653 131.978 132.122 25
26 132.020 131.817 131.779 132.444 132.386 132.379 132.121 131.970 131.522 131.672 131.989 132.148 2627 132.013 131.809 131.778 132.444 132.394 132.381 132.103 131.958 131.518 131.693 132.033 132.148 2728 132.006 131.800 131.778 132.436 132.388 132.377 132.102 131.948 131.511 131.696 132.032 132.154 2829 131.996 131.78 132.423 132.379 132.369 132.097 131.931 131.506 131.704 132.032 132.161 2930 131.985 131.804 132.406 132.369 132.358 132.092 131.905 131.498 131.715 132.029 132.156 3031 131.974 132.363 132.083 131.890 131.718 132.145 31
TOTAL 4088.610 3692.642 3821.220 3964.314 4103.416 3970.598 4099.946 4092.744 3950.029 4077.822 3957.275 4096.72 TOTALMEAN 131.891 131.880 131.766 132.144 132.368 132.353 132.256 132.024 131.668 131.543 131.909 132.152 MEANMAX 132.054 131.962 131.804 132.445 132.397 132.381 132.437 132.094 131.883 131.718 132.033 132.261 MAXMIN 131.703 131.800 131.734 131.821 132.331 132.327 132.083 131.890 131.498 131.454 131.723 132.043 MIN
SUMMARY FOR THE YEAR 2014 NOTES:Mean water level, 131.996 mMaximum daily water level, 132.445 m On 2014-04-25Minimum daily water level, 131.454 m On 2014-10-16
GRAND LAKE AT FOREST CITYDAILY MEAN WATER LEVEL IN METERS FOR 2014
THE WATER LEVELS ARE PROVISIONAL AND ARE SUPPLIED BY ENVIRONMENT CANADA IN COOPERATION WITH WOODLAND PULP LLCA - PARTIAL DAY
TABLE I

DAY JAN FEB MAR APR MAY JUN JUL AUG SEP OCT NOV DEC DAY1 4.79 12.2 8.74 2.48 34.2 8.65 11.6 3.40 8.33 2.80 2.68 3.44 12 4.79 12.1 8.66 2.49 34.1 7.68 11.5 3.40 9.27 2.79 2.74 3.47 23 4.81 10.8 7.74 2.48 33.7 6.81 11.5 3.38 11.6 2.76 2.73 3.51 34 4.78 9.66 6.91 2.49 29.4 6.78 11.5 3.37 12.8 2.75 2.73 3.48 45 4.78 9.63 6.18 2.51 25.6 6.79 19.0 3.42 12.6 2.76 2.73 3.52 5
6 4.83 9.59 5.58 2.50 23.0 6.83 32.3 3.43 12.5 2.74 2.73 3.54 67 4.83 9.55 5.07 2.52 17.7 6.83 35.2 3.43 12.3 2.72 2.81 3.54 78 4.86 9.49 4.62 2.56 13.0 6.79 34.9 4.13 12.1 2.76 2.85 3.55 89 4.88 9.44 4.60 2.57 11.6 6.76 31.2 4.65 11.8 2.8 2.88 9.65 9
10 4.90 9.39 4.60 2.61 10.0 6.74 28.1 4.64 11.7 2.7 2.91 17.9 10
11 4.94 9.33 4.59 2.65 10.0 6.74 25.2 4.62 11.6 2.7 2.94 21.4 1112 5.03 9.27 4.58 2.71 10.0 6.75 22.8 4.62 11.5 2.6 2.97 24.7 1213 5.08 9.26 4.62 2.78 10.0 6.78 22.5 4.59 11.1 2.6 2.99 27.2 1314 5.15 9.32 4.63 3.61 9.0 6.81 22.3 4.64 11.0 2.6 3.01 27.2 1415 5.29 9.30 4.63 6.32 8.5 6.83 22.0 4.64 10.7 2.6 3.02 27.3 15
16 5.37 9.27 3.77 10.6 8.5 5.97 22.0 4.63 9.48 2.62 3.03 27.0 1617 5.45 9.21 3.20 15.8 8.5 5.42 22.0 4.63 8.87 2.74 3.05 26.9 1718 5.51 9.20 3.19 19.8 8.5 5.47 17.9 4.63 8.72 3.14 3.07 28.7 1819 5.56 9.19 3.19 21.1 8.60 5.49 15.7 4.61 7.76 2.79 3.07 29.8 1920 8.10 9.13 3.22 21.6 8.67 5.47 15.5 4.59 7.00 2.78 3.19 29.1 20
21 13.4 9.11 2.71 23.9 8.72 5.47 14.7 4.58 6.83 2.77 3.27 28.4 2122 15.4 9.08 2.45 30.4 8.74 5.48 12.6 4.53 5.95 2.78 3.26 27.7 2223 15.3 9.02 2.44 34.7 8.75 5.47 10.8 4.53 4.16 2.83 3.27 24.8 2324 14.0 8.95 2.44 35.2 8.77 5.47 10.8 4.54 3.60 2.68 3.30 22.5 2425 12.6 8.89 2.45 35.4 8.76 5.5 9.57 4.52 3.58 2.57 3.31 22.9 25
26 12.6 8.87 2.43 35.3 8.76 7.5 8.63 6.76 3.55 2.60 3.33 23.4 2627 12.5 8.84 2.42 35.2 8.79 10.7 8.56 8.62 3.52 2.61 3.39 23.4 2728 12.5 8.76 2.44 35.1 8.80 11.7 7.14 8.56 3.49 2.63 3.41 20.9 2829 12.4 2.43 34.8 8.74 11.7 5.46 8.48 3.07 2.65 3.41 18.7 2930 12.3 2.48 34.5 8.73 11.7 3.77 8.41 2.82 2.67 3.43 17.5 3031 12.2 8.69 3.40 8.36 2.67 14.2 31
FOREST CITY STREAM BELOW FOREST CITY DAMDAILY MEAN DISCHARGE CUBIC METERS PER SECOND FOR 2014
TOTAL 249 266 127 467 419 213 530 155 253 84 91 566 TOTALMEAN 8.03 9.49 4.23 15.6 13.5 7.10 17.1 5.01 8.44 2.72 3.05 18.9 MEANMAX 15.4 12.2 8.74 35.4 34.2 11.7 35.2 8.62 12.8 3.14 3.43 29.8 MAXMIN 4.78 8.76 2.42 2.48 8.51 5.42 3.40 3.37 2.82 2.57 2.68 3.44 MINDAM3 21500 23000 11000 40300 36200 18400 45800 13400 21900 7300 7900 48900 DAM3
SUMMARY FOR THE YEAR 2014 NOTES:Total discharge 295600 DAMMean discharge, 9.43 m^3/sMaximum daily discharge, 35.4 m^3/s On 2014-04-25Minimum daily discharge, 2.42 m^3/s On 2014-03-27
TABLE II
THE DISCHARGE ARE PROVISIONAL AND ARE SUPPLIED BY ENVIRONMENT CANADA IN COOPERATION WITH WOODLAND PULP LLC
DAY JAN FEB MAR APR MAY JUN JUL AUG SEP OCT NOV DEC DAY1 116.256 117.027 116.417 116.287 117.107 117.108 117.124 116.909 116.205 115.608 115.536 116.306 12 116.259 117.033 116.393 116.280 117.078 117.092 117.124 116.886 116.185 115.580 115.601 116.322 23 116.263 117.035 116.369 116.277 117.045 117.080 117.109 116.862 116.191 115.552 115.634 116.346 34 116.259 117.031 116.349 116.274 117.043 117.074 117.105 116.839 116.174 115.522 115.617 116.385 45 116.259 117.023 116.337 116.281 117.072 117.069 117.247 116.838 116.153 115.515 115.621 116.392 5
6 116.270 117.019 116.322 116.289 117.074 117.104 117.337 116.822 116.143 115.499 115.638 116.416 67 116.303 117.006 116.304 116.294 117.068 117.103 117.380 116.806 116.139 115.464 115.701 116.449 78 116.319 116.995 116.296 116.314 117.055 117.092 117.389 116.780 116.115 115.452 115.769 116.467 89 116.336 116.984 116.287 116.353 117.033 117.090 117.382 116.750 116.090 115.450 115.795 116.483 9
10 116.352 116.968 116.275 116.384 117.030 117.092 117.366 116.718 116.072 115.424 115.829 116.560 10
11 116.373 116.937 116.267 116.431 117.042 117.095 117.327 116.688 116.051 115.392 115.852 116.732 1112 116.430 116.904 116.265 116.498 117.036 117.086 117.283 116.660 116.056 115.373 115.877 116.902 1213 116.479 116.873 116.294 116.574 117.035 117.076 117.224 116.626 116.021 115.342 115.906 117.028 1314 116.531 116.865 116.280 116.651 117.026 117.104 117.186 116.608 116.015 115.314 115.937 117.109 1415 116.621 116.831 116.274 116.763 117.021 117.137 117.151 116.611 115.987 115.294 115.966 117.151 15
16 116.707 116.815 116.273 116.976 117.016 117.132 117.148 116.584 115.964 115.269 115.970 117.161 1617 116.774 116.779 116.268 117.134 117.008 117.121 117.159 116.565 115.948 115.300 115.989 117.160 1718 116.829 116.739 116.260 117.216 117.031 117.150 117.146 116.555 115.932 115.329 116.041 117.173 1819 116.873 116.709 116.253 117.261 117.059 117.184 117.128 116.530 115.910 115.344 116.059 117.150 1920 116.912 116.678 116.257 117.274 117.095 117.191 117.104 116.501 115.875 115.328 116.065 117.121 20
21 116.942 116.640 116.260 117.270 117.115 117.181 117.086 116.472 115.851 115.295 116.096 117.080 2122 116.966 116.617 116.259 117.265 117.129 117.172 117.073 116.445 115.853 115.282 116.096 117.029 2223 116.979 116.585 116.258 117.277 117.137 117.162 117.066 116.419 115.827 115.288 116.101 116.985 2324 116.988 116.558 116.254 117.317 117.140 117.150 117.065 116.394 115.788 115.360 116.110 116.952 2425 116.994 116.529 116.246 117.323 117.142 117.148 117.048 116.368 115.760 115.409 116.151 116.966 25
26 117.012 116.499 116.250 117.304 117.138 117.163 117.030 116.339 115.738 115.443 116.178 117.022 2627 117.018 116.475 116.242 117.279 117.145 117.163 117.002 116.319 115.716 115.483 116.244 117.046 2728 117.025 116.447 116.233 117.247 117.141 117.156 116.989 116.305 115.688 115.483 116.256 117.054 2829 117.029 116.232 117.202 117.138 117.148 116.981 116.274 115.654 115.495 116.270 117.053 2930 117.029 116.255 117.153 117.124 117.137 116.956 116.241 115.632 115.520 116.279 117.036 3031 117.028 117.117 116.932 116.218 115.526 117.019 31
TOTAL 3616.415 3270.601 3488.529 3504.448 3629.44 3513.76 3631.647 3613.932 3478.733 3577.935 3478.184 3622.055 TOTALMEAN 116.6585 116.8072 116.2843 116.8149 117.0787 117.1253 117.1499 116.5785 115.9578 115.4173 115.9395 116.8405 MEANMAX 117.029 117.035 116.417 117.323 117.145 117.191 117.389 116.909 116.205 115.608 116.279 117.173 MAXMIN 116.256 116.447 116.232 116.274 117.008 117.069 116.932 116.218 115.632 115.269 115.536 116.306 MIN
SUMMARY FOR THE YEAR 2014 NOTES:Mean water level, 116.554 NoneMaximum daily water level, 117.389 m On 2014-07-08Minimum daily water level, 115.269 m On 2014-10-16
DAILY MEAN WATER LEVEL IN METERS FOR 2014
WATER LEVELS ARE IN METERS AND ARE REFERENCED TO GEODETIC SURVEY OF CANADA DATUM. WATER LEVELS ARE PROVISIONAL AND ARE SUPPLIED BY ENVIRONMENT CANADA IN COOPERATION WITH WOODLAND PULP LLC A - PARTIAL DAY
SPEDNIC LAKE AT ST. CROIX
TABLE III

DAY JAN FEB MAR APR MAY JUN JUL AUG SEP OCT NOV DEC DAY1 12.4 24.4 38.8 13.3 145 28.3 26.6 28.2 27.5 24.0 10.4 8.72 12 12.3 24.4 38.5 13.2 144 25.8 18.3 28.2 27.4 23.8 10.6 8.67 23 12.4 24.4 33.4 13.2 131 22.2 27.7 28.1 27.4 23.6 10.8 8.69 34 12.2 26.5 27.6 13.3 98.8 22.1 27.7 28.0 27.3 23.4 10.7 8.81 45 12.1 28.1 24.1 13.4 88.3 22.1 43.3 27.8 27.2 23.4 10.7 8.84 5
6 12.2 28.1 24.1 13.5 85.2 22.2 67.4 27.6 27.2 23.2 10.8 8.84 67 12.4 28.0 20.7 13.6 80.4 22.2 84.4 28.9 27.2 23.0 11.0 8.95 78 12.4 27.9 18.5 13.8 71.6 22.1 89.5 30.3 27.0 22.9 11.2 8.98 89 12.4 27.9 18.4 13.5 61.4 22.1 89.2 30.3 26.9 22.9 11.3 9.01 9
10 12.5 37.4 18.3 12.5 49.8 22.2 88.9 30.3 26.8 22.7 11.4 9.20 10
11 12.6 44.2 18.3 10.1 47.6 22.1 88.3 30.0 26.7 22.6 11.4 12.9 1112 12.9A 43.9 18.3 10.2A 43.3 22.1 87.8 30.0 26.7 22.5 11.5 16.1 1213 12.9 46.2 18.5 10.4E 40.8 22.1 86.9 29.7 26.5 22.3 9.88 27.4 1314 13.0A 49.0 18.5 10.4E 37.4 22.2 75.0 29.7 26.4 22.1 8.16 47.0 1415 13.3E 48.4 18.4 26.6 34.3 22.3 66.5 29.7 26.3 21.9 8.21 60.3 15
16 13.5 48.4 16.9 50.1 31.1 19.0 66.5 29.5 26.2 21.8 8.24 75.3 1617 13.6 48.1 16.3B 63.4 28.0 16.2 66.5 29.5 26.1 22.1 8.27 81.0 1718 13.8 47.9 16.3B 73.1 28.1 16.3 56.9 29.5 26.0 22.2 8.41 86.9 1819 13.9 47.6 15.3 83.3 28.2 16.4 49.3 29.2 25.9 22.3 8.47 91.5 1920 14.0 47.6 13.6 94.0 28.3 19.7 49.3 29.2 25.7 22.4 8.47 91.2 20
21 19.4 47.0 13.5 100 28.3 21.5 42.5 28.9 25.5 22.3 8.55 98.5 2122 25.7 46.7 13.4 107 28.6 21.4 33.4 28.9 25.5 19.2 8.52 102 2223 28.3 46.7 13.3 114 28.6 21.4 28.9 28.6 25.3 16.9 8.50 89.5 2324 26.8 45.0 13.3 130 28.6 21.3 28.9 28.6 25.0 14.8 8.47 80.4 2425 24.8 43.0 13.3B 147 28.6 21.4 29.2 28.3 24.8 12.9 8.52 80.7 25
26 24.9 40.5 13.3B 151 28.6 24.9 28.6 28.3 24.7 13.1 8.61 81.6 2627 24.8 39.1 13.3B 150 28.6 28.6 28.6 28.1 24.6 12.0 8.78 81.8 2728 24.7 39.1 13.2B 149 28.6 29.7 28.6 28.1 24.4 10.3 8.78 81.8 2829 24.6 13.2 148 28.6 29.7 28.6 27.9 24.2 10.3 8.84 81.8 2930 24.4 13.5 146 28.3 29.7 28.3 27.8 24.1 10.4 8.81 74.8 3031 24.4 28.3 28.3 27.6 10.4 60.9 31
TOTAL 530 1095 566 1905 1617 680 1590 895 782 608 286 1592 TOTALMEAN 17.1 39.1 18.9 63.5 52.2 22.7 51.3 28.9 26.1 19.6 9.54 51.4 MEAN
MAX 28.3 49.0 38.8 151 145 29.7 89.5 30.3 27.5 24.0 11.5 102 MAXMIN 12.1 24.4 13.2 10.1 28.0 16.2 18.3 27.6 24.1 10.3 8.16 8.67 MIN
DAM3 45800 94600 48900 164600 139700 58700 137400 77300 67600 52500 24700 137600 DAM3
SUMMARY FOR THE YEAR 2014 NOTES:Total discharge 1049400 DAMMean discharge, 33.3 m^3/sMaximum daily discharge, 151 m^3/s On 2014-04-26Minimum daily discharge, 8.16 m^3/s On 2014-10-14
ST. CROIX RIVER AT VANCEBORODAILY MEAN DISCHARGE CUBIC METERS PER SECOND FOR 2014
DATA ARE SUPPLIED BY THE UNITED STATES GEOLOGICAL SURVEY AND ARE PROVISIONAL.A - PARTIAL DAYE - ESTIMATED DAYB - BACKWATER
TABLE IV
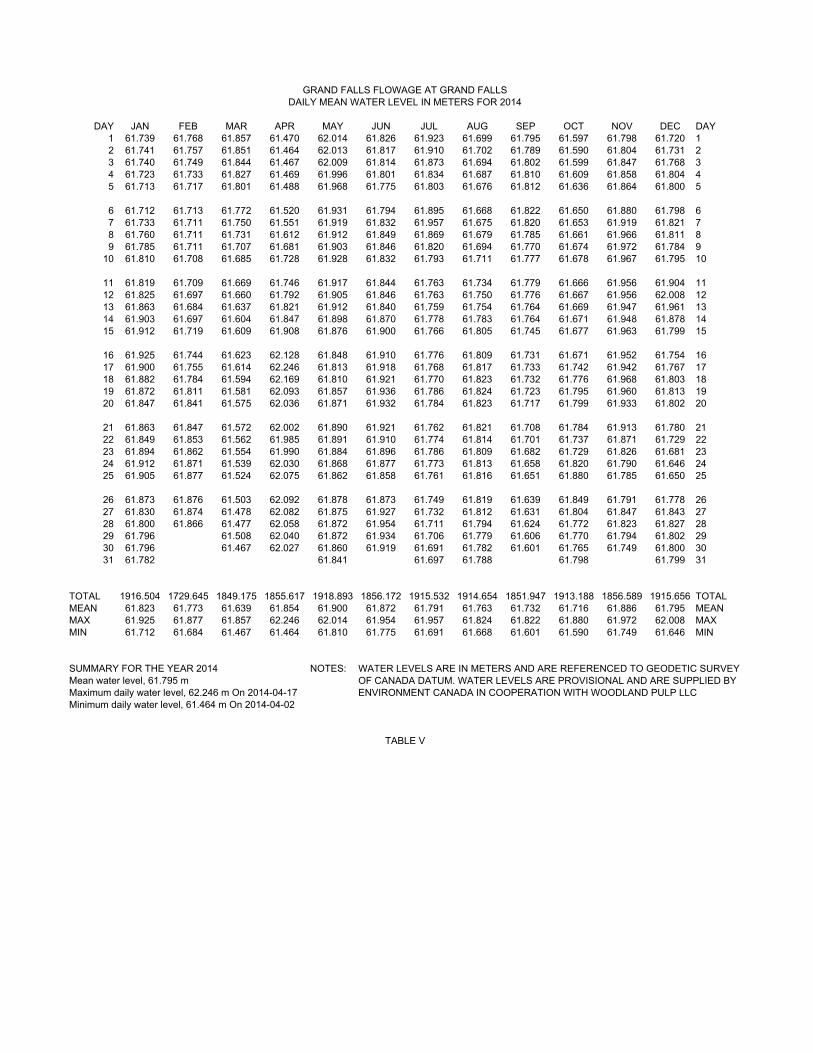
DAY JAN FEB MAR APR MAY JUN JUL AUG SEP OCT NOV DEC DAY1 61.739 61.768 61.857 61.470 62.014 61.826 61.923 61.699 61.795 61.597 61.798 61.720 12 61.741 61.757 61.851 61.464 62.013 61.817 61.910 61.702 61.789 61.590 61.804 61.731 23 61.740 61.749 61.844 61.467 62.009 61.814 61.873 61.694 61.802 61.599 61.847 61.768 34 61.723 61.733 61.827 61.469 61.996 61.801 61.834 61.687 61.810 61.609 61.858 61.804 45 61.713 61.717 61.801 61.488 61.968 61.775 61.803 61.676 61.812 61.636 61.864 61.800 5
GRAND FALLS FLOWAGE AT GRAND FALLSDAILY MEAN WATER LEVEL IN METERS FOR 2014
6 61.712 61.713 61.772 61.520 61.931 61.794 61.895 61.668 61.822 61.650 61.880 61.798 67 61.733 61.711 61.750 61.551 61.919 61.832 61.957 61.675 61.820 61.653 61.919 61.821 78 61.760 61.711 61.731 61.612 61.912 61.849 61.869 61.679 61.785 61.661 61.966 61.811 89 61.785 61.711 61.707 61.681 61.903 61.846 61.820 61.694 61.770 61.674 61.972 61.784 9
10 61.810 61.708 61.685 61.728 61.928 61.832 61.793 61.711 61.777 61.678 61.967 61.795 10
11 61.819 61.709 61.669 61.746 61.917 61.844 61.763 61.734 61.779 61.666 61.956 61.904 1112 61.825 61.697 61.660 61.792 61.905 61.846 61.763 61.750 61.776 61.667 61.956 62.008 1213 61.863 61.684 61.637 61.821 61.912 61.840 61.759 61.754 61.764 61.669 61.947 61.961 1314 61 903 61 697 61 604 61 847 61 898 61 870 61 778 61 783 61 764 61 671 61 948 61 878 1414 61.903 61.697 61.604 61.847 61.898 61.870 61.778 61.783 61.764 61.671 61.948 61.878 1415 61.912 61.719 61.609 61.908 61.876 61.900 61.766 61.805 61.745 61.677 61.963 61.799 15
16 61.925 61.744 61.623 62.128 61.848 61.910 61.776 61.809 61.731 61.671 61.952 61.754 1617 61.900 61.755 61.614 62.246 61.813 61.918 61.768 61.817 61.733 61.742 61.942 61.767 1718 61.882 61.784 61.594 62.169 61.810 61.921 61.770 61.823 61.732 61.776 61.968 61.803 1819 61.872 61.811 61.581 62.093 61.857 61.936 61.786 61.824 61.723 61.795 61.960 61.813 1920 61.847 61.841 61.575 62.036 61.871 61.932 61.784 61.823 61.717 61.799 61.933 61.802 20
21 61.863 61.847 61.572 62.002 61.890 61.921 61.762 61.821 61.708 61.784 61.913 61.780 2122 61 849 61 853 61 562 61 985 61 891 61 910 61 774 61 814 61 701 61 737 61 871 61 729 2222 61.849 61.853 61.562 61.985 61.891 61.910 61.774 61.814 61.701 61.737 61.871 61.729 2223 61.894 61.862 61.554 61.990 61.884 61.896 61.786 61.809 61.682 61.729 61.826 61.681 2324 61.912 61.871 61.539 62.030 61.868 61.877 61.773 61.813 61.658 61.820 61.790 61.646 2425 61.905 61.877 61.524 62.075 61.862 61.858 61.761 61.816 61.651 61.880 61.785 61.650 25
26 61.873 61.876 61.503 62.092 61.878 61.873 61.749 61.819 61.639 61.849 61.791 61.778 2627 61.830 61.874 61.478 62.082 61.875 61.927 61.732 61.812 61.631 61.804 61.847 61.843 2728 61.800 61.866 61.477 62.058 61.872 61.954 61.711 61.794 61.624 61.772 61.823 61.827 2829 61.796 61.508 62.040 61.872 61.934 61.706 61.779 61.606 61.770 61.794 61.802 2930 61.796 61.467 62.027 61.860 61.919 61.691 61.782 61.601 61.765 61.749 61.800 3031 61.782 61.841 61.697 61.788 61.798 61.799 3131 61.782 61.841 61.697 61.788 61.798 61.799 31
TOTAL 1916.504 1729.645 1849.175 1855.617 1918.893 1856.172 1915.532 1914.654 1851.947 1913.188 1856.589 1915.656 TOTALMEAN 61.823 61.773 61.639 61.854 61.900 61.872 61.791 61.763 61.732 61.716 61.886 61.795 MEANMAX 61.925 61.877 61.857 62.246 62.014 61.954 61.957 61.824 61.822 61.880 61.972 62.008 MAXMIN 61.712 61.684 61.467 61.464 61.810 61.775 61.691 61.668 61.601 61.590 61.749 61.646 MIN
SUMMARY FOR THE YEAR 2014 NOTES:Mean water level, 61.795 m
WATER LEVELS ARE IN METERS AND ARE REFERENCED TO GEODETIC SURVEY OF CANADA DATUM. WATER LEVELS ARE PROVISIONAL AND ARE SUPPLIED BY
Maximum daily water level, 62.246 m On 2014-04-17Minimum daily water level, 61.464 m On 2014-04-02
ENVIRONMENT CANADA IN COOPERATION WITH WOODLAND PULP LLC
TABLE V

DAY JAN FEB MAR APR MAY JUN JUL AUG SEP OCT NOV DEC DAY1 28.6B 62.3 74.2B 91.5 334 78.4 63.1 43.9 44.5 32.0 59.5 98.5 12 28.6B 58.6 73.6B 88.6 340 71.6 62.6 47.6 49.8 30.0 66.5 77.3 23 31.1B 60.0 72.8B 85.8 334 64.0 62.0 49.0 41.6 24.9 66.5 82.7 34 37.4B 53.2B 72.2B 84.4 323 63.4 83.5 47.3 40.8 24.3 65.1 106 45 37.9B 54.7 70.8B 86.1 317 65.1 231 48.4 44.5 25.5 66.3 96.3 5
6 44.5B 56.6B 69.4B 93.4 277 84.7 278 48.7 43.0 25.1 67.4 97.7 67 47.9B 56.4B 67.4B 93.2 244 85.5 334 44.7 47.9 26.6 81.8 100B 78 48.4B 49.3B 68.2B 106 230 81.0 337 44.5 54.4 28.3 123 99.1B 89 46.2B 41.6B 66.0 136 194 78.2 261 38.2 54.9 28.2 130 109 9
10 47.0B 45.0B 67.1 176 179 71.4 234 34.8 50.1 28.0 129 147 10
11 63.1B 50.1B 62.9 194 163 59.2 192 34.3 45.9 27.9 113 272 1112 106 60.0B 62.6B 228 144 57.2 175 33.7 48.7 27.9 99.4 388 1213 104 63.4B 65.1B 258 127 56.6 149 34.3 47.0 27.8 97.7 385 1314 126 65.4B 64.6B 264 126 60.3 139 46.7 45.9 27.8 84.1 334 1415 192 65.7B 61.7B 297 121 63.1 139 51.3 50.1 27.8 73.3 294 15
16 216 68.5B 61.4B 436 115 62.3 146 50.4 52.1 28.0 71.1 252 1617 221 67.7B 61.7B 473 109 61.7 164 46.2 48.7 43.6 65.1 233 1718 199 56.9B 56.1B 467 95.1 64.8 154 46.4 42.8 58.3 92.6 246 1819 182 50.1B 59.2 411 101 66.0 125 46.7 42.5 61.2 111 247 1920 155 54.1 66.5 362 126 64.3 119 46.7 42.8 60.0 104 243 20
21 131B 60.6 63.7 340 126 62.9 106 46.4 42.8 55.5 99.7 237 2122 111B 72.5 64.0 326 126 61.7 73.3 46.2 43.0 73.1 96.3 242 2223 87.2B 77.6 61.2B 326 125 60.6 62.6 46.2 45.0 82.1 95.4 230 2324 88.9B 78.2B 59.5B 354 121 59.7 63.7 46.2 44.7 130 94.9A 227 2425 89.5B 77.6B 58.1B 374 103 60.6 61.7 46.2 42.5 173 96.3E 242 25
26 102B 76.5B 58.3B 388 88.6 64.8 58.6 46.2 39.1E 183 94.3 268 2627 91.7B 75.3B 58.1B 385 94.3 65.1 57.8 47.3 37.1 161 69.1 303 2728 85.2B 74.8B 54.1 368 93.2 77.3 60.9 50.1 36.5 122 97.4 306 2829 66.5B 53.0 354 90.3 93.2 62.3 49.8 33.1 106 94.0 273 2930 65.1B 83.0 343 88.1 76.5 51.8 48.1 33.4 89.2 94.6 234B 3031 65.1 85.2 44.5 44.2 58.1 187B 31
TOTAL 2946 1733 1936 7989 5139 2041 4152 1401 1335 1897 2698 6656 TOTALMEAN 95.0 61.9 64.5 266 166 68.0 134 45.2 44.5 61.2 89.9 215 MEANMAX 221 78.2 83.0 473 340 93.2 337 51.3 54.9 183 130 388 MAXMIN 28.6 41.6 53.0 84.4 85.2 56.6 44.5 33.7 33.1 24.3 59.5 77.3 MINDAM3 254600 149700 167300 690300 444000 176400 358700 121000 115400 163900 233100 575100 DAM3
SUMMARY FOR THE YEAR 2014 NOTE:Total discharge 3449500 DAMMean discharge, 109 m3/sMaximum daily discharge, 473 m3/s On 2014-04-17Minimum daily discharge, 24.3 m3/s On 2014-10-04
TABLE VI
ST. CROIX AT BARINGDAILY MEAN DISCHARGE CUBIC METERS PER SECOND FOR 2014
DATA ARE SUPPLIED BY THE UNITIED STATES GEOLOGICAL SURVEY AND ARE PROVISIONALA - PARTIAL DAYB - BACKWATERE - ESTIMATED DAY

DAY JAN FEB MAR APR MAY JUN JUL AUG SEP OCT NOV DEC DAY1 13.764 13.766 13.767 13.967 13.977 13.694 13.676 13.697 13.700 13.724 13.896 13.909 12 13.776 13.767 13.769 13.943 14.017 13.694 13.664 13.695 13.723 13.739 13.968 13.803 23 13.773 13.792 13.789 13.928 13.994 13.688 13.672 13.676 13.713 13.749 13.898 13.697 34 13.795 13.774 13.778 13.967 13.949 13.683 13.684 13.679 13.700 13.748 13.900 13.664 45 13.775 13.786 13.783 14.000 13.935 13.708 13.827 13.683 13.702 13.756 13.890 13.694 5
6 13.816 13.768 13.791 13.974 13.834 13.741 13.917 13.696 13.677 13.738 13.928 13.732 67 13.954 13.764 13.767 13.975 13.764 13.704 13.980 13.696 13.699 13.725 13.945 13.703 78 13.781 13.768 13.761 14.021 13.783 13.672 13.975 13.695 13.094 13.723 13.949 13.693 89 13.776 13.768 13.770 14.023 13.736 13.687 13.833 13.693 12.791 13.724 13.892 13.695 9
10 13.787 13.774 13.770 14.030 13.755 13.692 13.748 13.699 12.791 13.724 13.841 13.740 10
11 13.803 13.799 13.776 14.045 13.712 13.691 13.714 13.696 12.793 13.732 13.842 13.854 1112 13.859 13.788 13.778 14.105 13.759 13.704 13.712 13.697 13.191 13.741 13.874 14.175 1213 13.807 13.792 13.756 14.102 13.741 13.699 13.647 13.697 13.763 13.736 13.847 14.104 1314 13.849 13.779 13.782 14.102 13.712 13.695 13.688 13.714 13.778 13.738 13.859 13.932 1415 13.988 13.763 13.754 14.170 13.683 13.709 13.748 13.699 13.791 13.741 13.838 13.833 15
16 13.891 13.818 13.776 14.269 13.682 13.682 13.735 13.693 13.775 13.755 13.878 13.774 1617 13.948 13.793 13.783 14.325 13.684 13.708 13.784 13.703 13.762 13.815 13.866 13.741 1718 13.930 13.774 13.779 14.274 13.693 13.705 13.709 13.703 13.784 13.863 13.945 13.791 1819 13.945 13.757 13.764 14.109 13.756 13.743 13.715 13.679 13.772 13.895 13.897 13.799 1920 13.908 13.778 13.886 14.004 13.728 13.695 13.661 13.701 13.718 13.876 13.876 13.742 20
21 13.927 13.790 13.946 13.916 13.714 13.683 13.682 13.705 13.699 13.861 13.872 13.708 2122 13.813 13.783 13.958 13.891 13.685 13.689 13.673 13.710 13.719 13.881 13.824 13.771 2223 13.794 13.778 13.974 13.930 13.689 13.671 13.682 13.673 13.711 13.872 13.819 13.741 2324 13.777 13.789 13.910 14.032 13.652 13.687 13.693 13.687 13.722 13.976 13.865 13.761 2425 13.778 13.806 13.892 14.055 13.682 13.703 13.695 13.697 13.717 14.019 13.914 13.820 25
26 13.818 13.777 13.826 14.074 13.717 13.685 13.707 13.681 13.712 13.925 13.881 13.853 2627 13.792 13.789 13.869 14.044 13.710 13.693 13.691 13.725 13.719 13.905 13.855 13.884 2728 13.787 13.817 13.759 14.018 13.672 13.696 13.716 13.708 13.711 13.875 13.876 13.807 2829 13.768 13.758 14.001 13.690 13.668 13.712 13.693 13.715 13.861 13.802 13.795 2930 13.785 13.949 13.971 13.699 13.672 13.694 13.698 13.723 13.870 13.838 13.732 3031 13.763 13.934 13.701 13.708 13.701 13.889 13.717 31
TOTAL 428.727 385.897 428.354 421.265 426.505 410.841 425.742 424.569 407.865 428.176 416.375 427.664 TOTALMEAN 13.830 13.782 13.818 14.042 13.758 13.695 13.734 13.696 13.596 13.812 13.879 13.796 MEANMAX 13.988 13.818 13.974 14.325 14.017 13.743 13.980 13.725 13.791 14.019 13.968 14.175 MAXMIN 13.763 13.757 13.754 13.891 13.652 13.668 13.647 13.673 12.791 13.723 13.802 13.664 MIN
SUMMARY FOR THE YEAR 2014 NOTES:Mean water level, 13.786 mMaximum daily water level, 14.325 m On 2014-04-17Minimum daily water level, 12.791 m On 2014-09-09
ST. CROIX RIVER AT MILLTOWN DAMDAILY MEAN WATER LEVEL IN METERS FOR 2014
WATER LEVELS ARE IN METERS AND ARE REFERENCED TO GEODETIC SURVEY OF CANADA DATUM. THE WATER LEVEL DATA ARE PROVISIONAL AND ARE SUPPLIED BY ENVIRONMENT CANADA IN COOPERATION WITH NEW BRUNSWICK POWER
TABLE VII

(This page intentionally left blank.)

APPENDIX 4
HYDROGRAPHS

(This page intentionally left blank.)

131.5
132
132.5
133
VEL IN M
ETER
SYEAR: 2014 STATION ID: 01AR009 ‐ GRAND LAKE AT FOREST CITY
MAXIMUM WATER LEVEL 132.571
FIGURE I
130
130.5
131
Jan Feb Mar Apr May Jun Jul Aug Sep Oct Nov Dec
WATER LE
MINIMUM WATER LEVEL 130.436

YEAR: 2014 STATION ID: 01AR011 ‐ FOREST CITY STREAM BELOW FOREST CITY DAM
FIGURE II5050
ECOND
10
BIC M
ETER
S PER
SE
ISCHARGE IN CUB
DI
MINIMUM DISCHARGE 2.12m^3/s
1Jan Feb Mar Apr May Jun Jul Aug Sep Oct Nov Dec

115.5
116
116.5
117
117.5
118
EVEL IN M
ETER
SYEAR: 2014 STATION ID: 01AR010 ‐ SPEDNIC LAKE AT ST. CROIX
MAXIMUM WATER LEVEL 117.610
FIGURE III
113
113.5
114
114.5
115
Jan Feb Mar Apr May Jun Jul Aug Sep Oct Nov Dec
WATER L
MINIMUM WATER LEVEL 114.757
MINIMUM WATER LEVEL 113.233MINIMUM WATER LEVEL 113.233
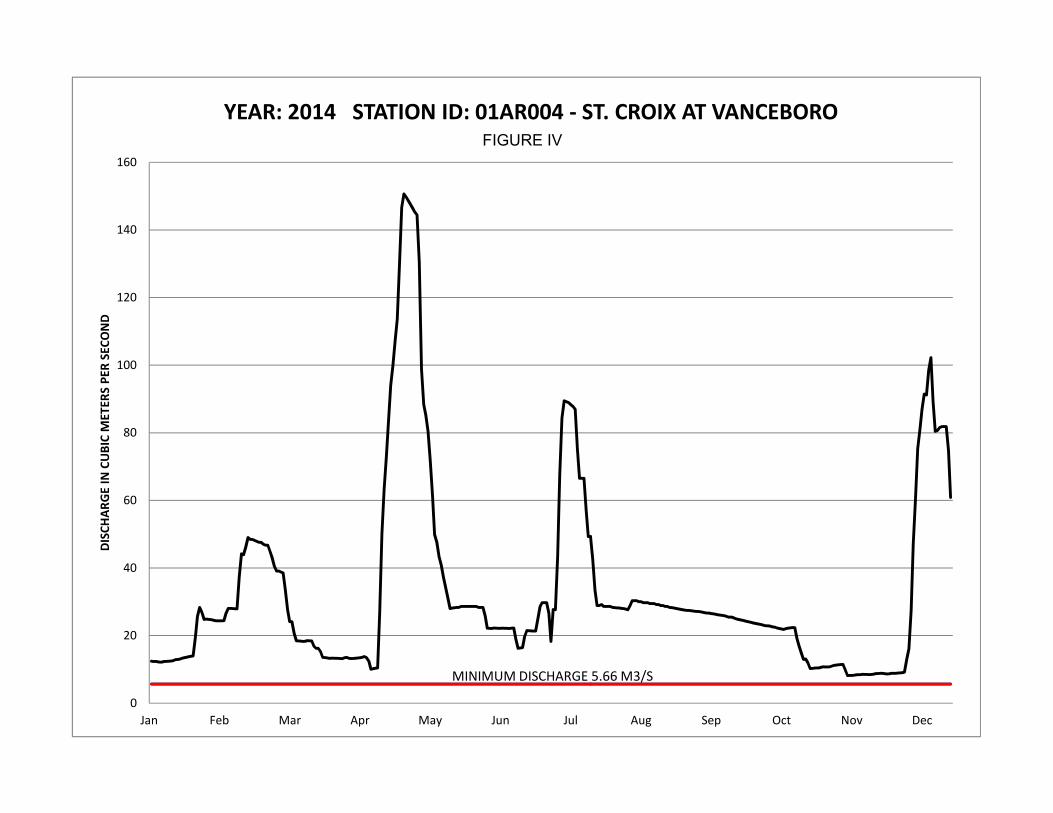
80
100
120
140
160
BIC M
ETER
S PER
SECOND
YEAR: 2014 STATION ID: 01AR004 ‐ ST. CROIX AT VANCEBOROFIGURE IV
0
20
40
60
Jan Feb Mar Apr May Jun Jul Aug Sep Oct Nov Dec
DISCHARGE IN CUB
MINIMUM DISCHARGE 5.66 M3/S!
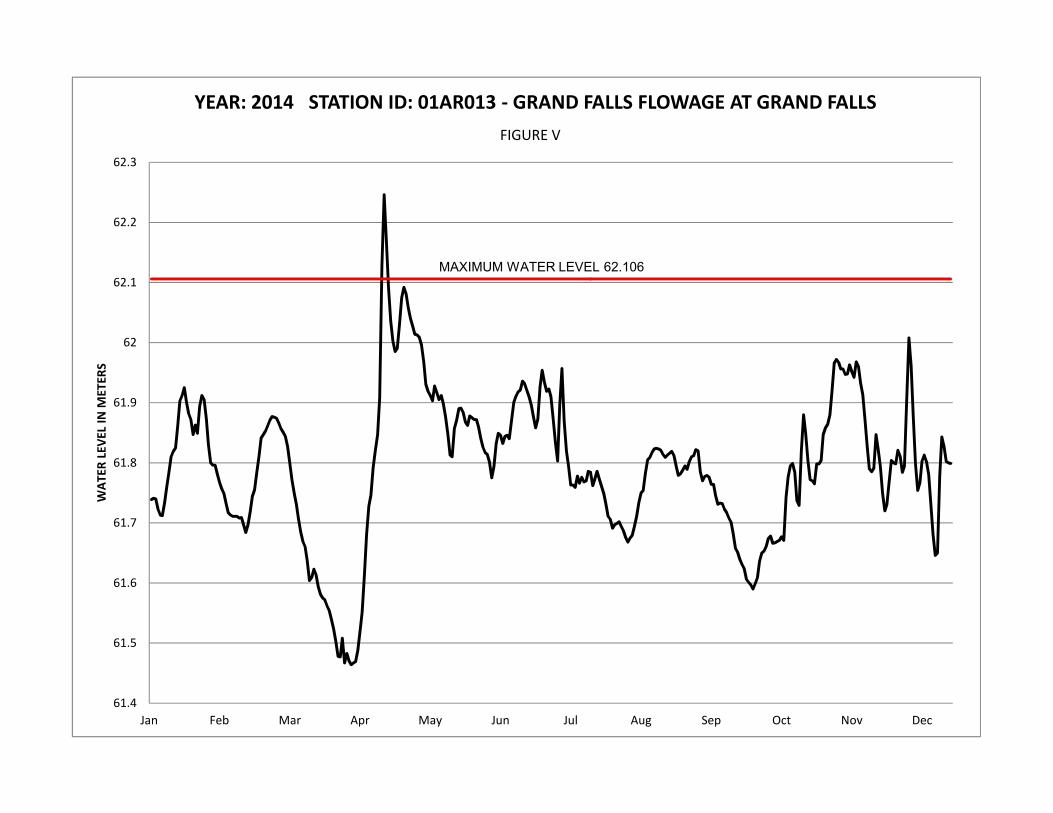
61.9
62
62.1
62.2
62.3
EVEL IN M
ETER
SYEAR: 2014 STATION ID: 01AR013 ‐ GRAND FALLS FLOWAGE AT GRAND FALLS
MAXIMUM WATER LEVEL 62.106
FIGURE VFIGURE V
61.4
61.5
61.6
61.7
61.8
Jan Feb Mar Apr May Jun Jul Aug Sep Oct Nov Dec
WATER L

250
300
350
400
450
500
BIC M
ETER
S PER
SECOND
YEAR: 2014 STATION ID: 01AR005 ‐ ST. CROIX AT BARING
The normal minimum flow requirement as considered by the State of Maine’s Department of Environmental Protection is 21.2 m3/s ( 750 f3/s)
FIGURE VI
0
50
100
150
200
Jan Feb Mar Apr May Jun Jul Aug Sep Oct Nov Dec
DISCHARGE IN CUB

13.6
13.8
14
14.2
14.4
14.6
EVEL IN M
ETER
SYEAR: 2014 STATION ID: 01AR014 ‐ ST. CROIX RIVER AT MILLTOWN DAM
FIGURE VII
12.6
12.8
13
13.2
13.4
Jan Feb Mar Apr May Jun Jul Aug Sep Oct Nov Dec
WATER L
Data depict daily water elevations in the forebay at Milltown.Data are provided by Environment Canada

Figure VIII Grand Falls Flowage High Level Occurrence above Order of 62.106m From April 16 at 09:15 ESTTo April 19 at 06:30 EST Daily Mean Water Level Results Are: April 15: 61.908 m (203.11 ft.) April 16: 62.128 m (203.83 ft.) above orderApril 17: 62 246 m (204 22 ft ) above orderApril 17: 62.246 m (204.22 ft.) above orderApril 18: 62.169 m (203.97 ft.) above order April 19: 62.093 m (203.72 ft.) Maximum Water Level 62.106 m

APPENDIX 5
WATER QUALITY DATA

(This page intentionally left blank.)


Monthly mean, maximum and minimum temperature, dissolved oxygen, pH, specific conductance, and turbidity on the St. Croix River at Milltown, NB, 2014.
January February March April May June July August September October November DecemberMin -0.01 0.02 0.02 0.03 6.42 16.08 19.23 21.2 15.6 9.33 0.48 0.03Max 0.6 0.55 2.69 6.96 17.77 23.98 26.46 25.77 24.04 16.62 10.1 2.31
Mean 0.13 0.1 0.56 3.075 12.559 19.394 23.428 23.281 19.082 13.56 3.771 0.834
January February March April May June July August September October November DecemberMin 12.75 13.33 13.28 12.31 9.57 8.32 7.75 8.02 8.34 9.23 10.87 13.51Max 13.91 13.99 14.02 13.99 12.39 9.74 9.14 8.95 9.86 11.25 14.21 14.87
Mean 13.444 13.718 13.649 13.17 10.599 9.02 8.384 8.497 9.135 10.065 12.958 14.234
January February March April May June July August September October November DecemberMin 6.31 6.51 6.52 6.17 6.56 6.82 6.34 6.85 6.392 5.859 5.89 6.37Max 6.74 6.75 6.77 6.61 7.07 7.26 6.99 7.26 7.22 6.995 6.91 6.95
Mean 6.467 6.636 6.671 6.41 6.862 7.055 6.722 7.027 6.789 6.55 6.757 6.666
January February March April May June July August September October November DecemberMin 30 22 28 22 22 44 27 55 56 37 38 23Max 86 58 63 51 47 59 65 75 100 120 56 56
Mean 50.047 49.042 49.917 32.93 34.559 51.581 42.832 63.337 69.671 75.937 44.436 31.8
January February March April May June July August September October November 1 December 1
Min 0 1.204 1.454 0.477 0 0.3 0 0.01 0 0Max 4.015 3.683 6.692 9.327 2.881 14.829 13.937 5.879 1.36 0.396
Mean 0.579 1.556 2.008 2.638 0.759 3.095 3.808 1.9 0.139 0.013
1. Insufficient data collected from 2014-11-04 to 2014-12-31 due to ice blockage and probe malfunction.
Turbidity (NTU)
St. Croix River at Milltown, NB - 2014
Temperature (°C)
Dissolved Oxygen (mg/L)
pH (pH units)
Specific Conductance (µS/cm)
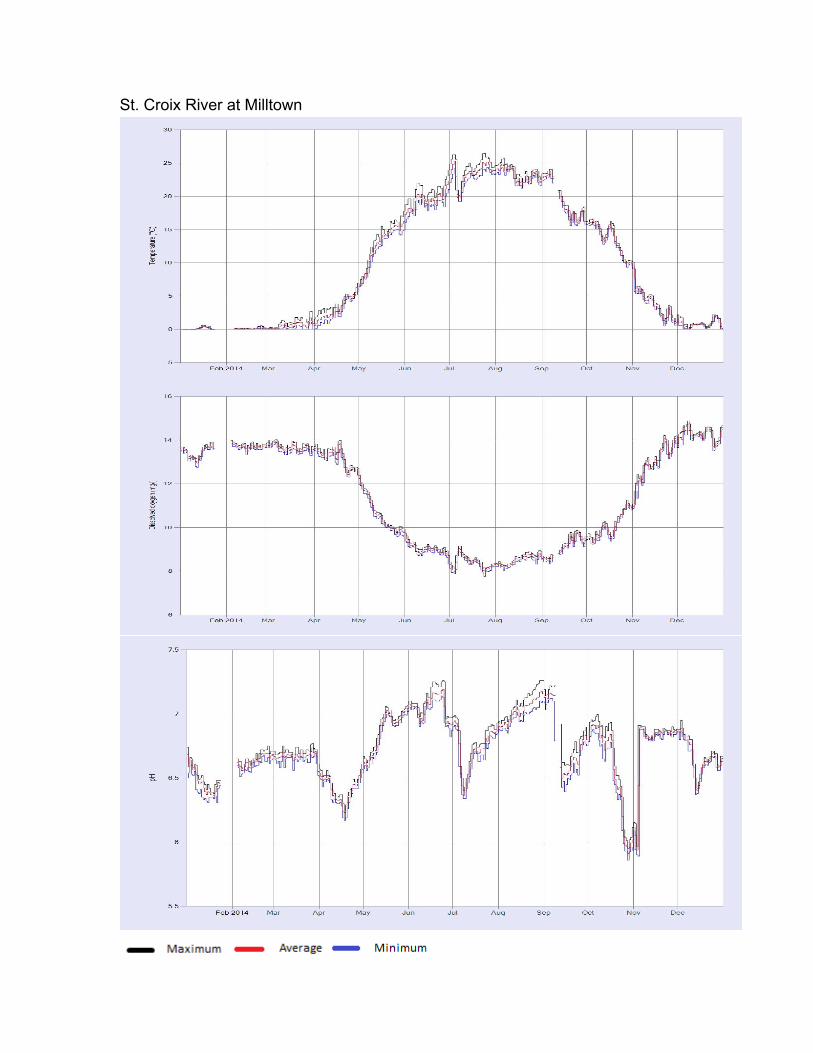
St. Croix River at Milltown

St. Croix River at Milltown

Daily mean, maximum and minimum temperature and specific conductance on the St. Croix River at Forest City, 2014.
January February March April May June July August September October November DecemberMin 0.698 1.268 1.142 1.251 4.206 13.37 18.49 20.24 14.57 8.17 0.615 0.117Max 1.398 1.465 1.566 5.176 15.73 24.41 25.79 25.9 23.49 16.41 10.14 3.461
Mean 1.062 1.36 1.341 2.517 9.555 17.413 22.69 22.793 18.864 13.069 4.979 1.3
January February March April May June July August September October November DecemberMin 17.63 19.543 18.556 4.24 16.768 22.49 26.38 29.572 25.442 1.937 12.433 14.773Max 22.059 23.502 25.213 23.181 23.454 34.484 49.54 43.543 44.081 26.656 22.446 17.279
Mean 20.047 21.376 21.812 18.288 19.873 26.394 32.926 31.943 29.144 19.244 18.207 15.645
Specific Conductance (µS/cm)
Temperature (°C)St. Croix River at Forest City, NB - 2014
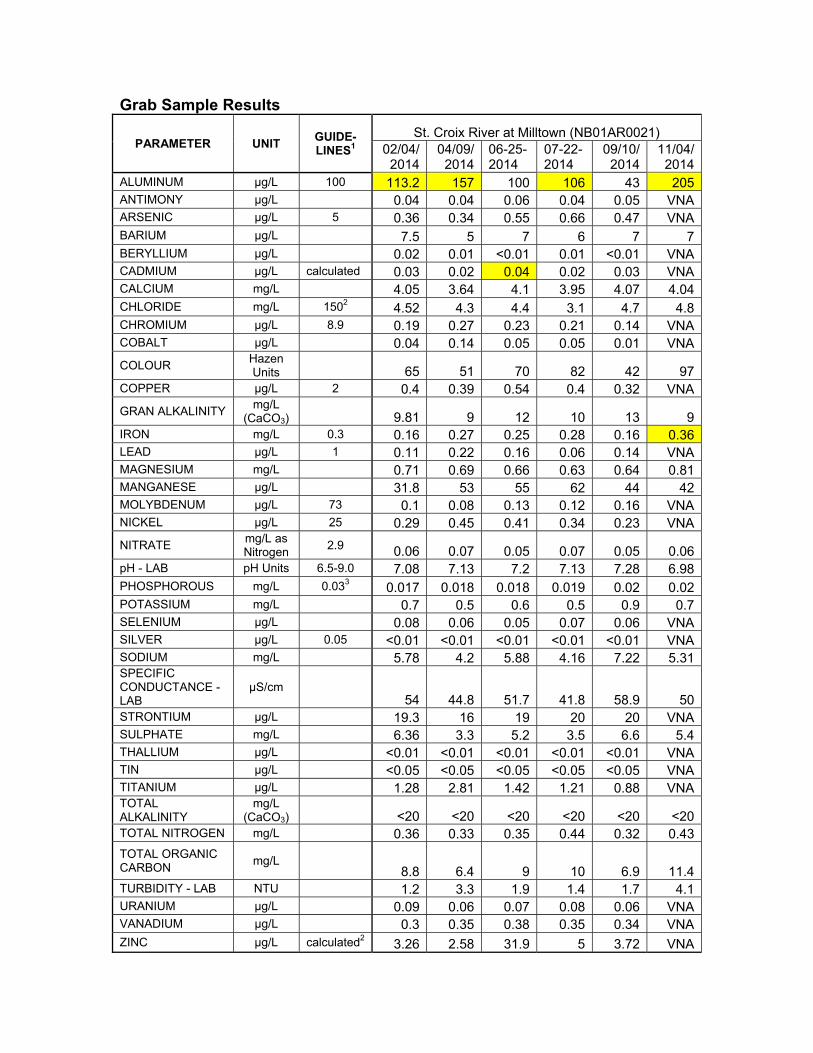
Grab Sample Results
PARAMETER UNIT GUIDE-LINES1
St. Croix River at Milltown (NB01AR0021) 02/04/2014
04/09/2014
06-25-2014
07-22-2014
09/10/2014
11/04/2014
ALUMINUM µg/L 100 113.2 157 100 106 43 205ANTIMONY µg/L 0.04 0.04 0.06 0.04 0.05 VNAARSENIC µg/L 5 0.36 0.34 0.55 0.66 0.47 VNABARIUM µg/L 7.5 5 7 6 7 7BERYLLIUM µg/L 0.02 0.01 <0.01 0.01 <0.01 VNACADMIUM µg/L calculated 0.03 0.02 0.04 0.02 0.03 VNACALCIUM mg/L 4.05 3.64 4.1 3.95 4.07 4.04CHLORIDE mg/L 1502 4.52 4.3 4.4 3.1 4.7 4.8CHROMIUM µg/L 8.9 0.19 0.27 0.23 0.21 0.14 VNACOBALT µg/L 0.04 0.14 0.05 0.05 0.01 VNACOLOUR Hazen
Units 65 51 70 82 42 97COPPER µg/L 2 0.4 0.39 0.54 0.4 0.32 VNAGRAN ALKALINITY mg/L
(CaCO3) 9.81 9 12 10 13 9
IRON mg/L 0.3 0.16 0.27 0.25 0.28 0.16 0.36LEAD µg/L 1 0.11 0.22 0.16 0.06 0.14 VNAMAGNESIUM mg/L 0.71 0.69 0.66 0.63 0.64 0.81MANGANESE µg/L 31.8 53 55 62 44 42MOLYBDENUM µg/L 73 0.1 0.08 0.13 0.12 0.16 VNANICKEL µg/L 25 0.29 0.45 0.41 0.34 0.23 VNANITRATE mg/L as
Nitrogen 2.9 0.06 0.07 0.05 0.07 0.05 0.06pH - LAB pH Units 6.5-9.0 7.08 7.13 7.2 7.13 7.28 6.98PHOSPHOROUS mg/L 0.033 0.017 0.018 0.018 0.019 0.02 0.02POTASSIUM mg/L 0.7 0.5 0.6 0.5 0.9 0.7SELENIUM µg/L 0.08 0.06 0.05 0.07 0.06 VNASILVER µg/L 0.05 <0.01 <0.01 <0.01 <0.01 <0.01 VNASODIUM mg/L 5.78 4.2 5.88 4.16 7.22 5.31SPECIFIC CONDUCTANCE - LAB
µS/cm 54 44.8 51.7 41.8 58.9 50
STRONTIUM µg/L 19.3 16 19 20 20 VNASULPHATE mg/L 6.36 3.3 5.2 3.5 6.6 5.4THALLIUM µg/L <0.01 <0.01 <0.01 <0.01 <0.01 VNATIN µg/L <0.05 <0.05 <0.05 <0.05 <0.05 VNATITANIUM µg/L 1.28 2.81 1.42 1.21 0.88 VNATOTAL ALKALINITY
mg/L (CaCO3)
<20 <20 <20 <20 <20 <20TOTAL NITROGEN mg/L 0.36 0.33 0.35 0.44 0.32 0.43TOTAL ORGANIC CARBON mg/L
8.8 6.4 9 10 6.9 11.4TURBIDITY - LAB NTU 1.2 3.3 1.9 1.4 1.7 4.1URANIUM µg/L 0.09 0.06 0.07 0.08 0.06 VNAVANADIUM µg/L 0.3 0.35 0.38 0.35 0.34 VNAZINC µg/L calculated2 3.26 2.58 31.9 5 3.72 VNA

Grab Sample Results
PARAMETER UNIT GUIDE-LINES1
St. Croix River at Forest City (NB01AR0151) 02/04/2014
04/09/2014
06-25-2014
07-22-2014
09/10/2014
11/04/2014
ALUMINUM µg/L 100 8.4 8 15 17 10 18ANTIMONY µg/L 0.04 0.04 0.04 0.04 0.04 VNA ARSENIC µg/L 5 0.26 0.23 0.23 0.21 0.2 VNA BARIUM µg/L 2.2 2 2 2 2 2BERYLLIUM µg/L <0.01 <0.01 <0.01 <0.01 <0.01 VNA CADMIUM µg/L calculated <0.02 <0.02 <0.02 <0.02 <0.02 VNA CALCIUM mg/L 4.54 4.7 4.36 4.38 4.4 4.4CHLORIDE mg/L 1502 1.63 1.6 1.5 1.5 1.4 1.4CHROMIUM µg/L 8.9 0.07 0.07 0.06 0.05 0.06 VNA COBALT µg/L <0.01 0.01 <0.01 <0.01 <0.01 VNA COLOUR Hazen
Units 13 13 15 14 14 14COPPER µg/L 2 0.28 0.56 0.26 0.24 0.22 VNA GRANALKALINITY mg/L
(CaCO3) 11.33 12 12 12 12 12
IRON mg/L 0.3 <0.02 <0.02 0.02 0.02 <0.02 0.03LEAD µg/L 1 <0.03 0.03 0.03 <0.03 <0.03 VNA MAGNESIUM mg/L 0.65 0.65 0.61 0.6 0.62 0.63MANGANESE µg/L 3.2 3 3 4 4 9MOLYBDENUM µg/L 73 0.06 0.06 0.06 0.07 0.06 VNA NICKEL µg/L 25 0.15 0.17 0.14 0.15 0.16 VNA NITRATE mg/L as
Nitrogen 2.9 0.02 0.02 0.02 <0.01 <0.02 0.03pH - LAB pH Units 6.5-9.0 7.33 7.31 7.37 7.41 7.36 7.3PHOSPHOROUS mg/L 0.033 0.004 0.005 0.005 0.004 0.004 0.006POTASSIUM mg/L <0.4 <0.4 <0.4 <0.4 <0.4 <0.4SELENIUM µg/L 0.06 0.08 0.04 <0.03 0.07 VNA SILVER µg/L 0.05 <0.01 <0.01 <0.01 <0.01 <0.01 VNA SODIUM mg/L 1.49 1.55 1.46 1.39 1.42 1.41SPECIFIC CONDUCTANCE - LAB
µS/cm 34.1 35.8 33.1 31.6 32.5 32.1
STRONTIUM µg/L 24 24 23 23 23 23SULPHATE mg/L 1.68 1.6 2.3 1.4 1.6 1.9THALLIUM µg/L <0.01 <0.01 <0.01 <0.01 <0.01 VNA TIN µg/L <0.05 <0.05 <0.05 <0.05 <0.05 VNA TITANIUM µg/L 0.18 0.21 0.19 0.22 0.1 VNA TOTAL ALKALINITY
mg/L (CaCO3)
<20 <20 <20 <20 <20 <20TOTAL NITROGEN mg/L 0.17 0.2 0.17 0.17 0.17 0.17TOTAL ORGANIC CARBON mg/L
4.3 4.6 5.1 4.2 4 3.72TURBIDITY - LAB NTU 0.5 0.3 0.5 0.4 0.5 1.1URANIUM µg/L 0.03 0.03 0.03 0.03 0.03 VNA VANADIUM µg/L 0.06 0.06 0.06 0.06 0.08 VNA ZINC µg/L calculated2 0.19 1.09 0.18 0.18 0.14 VNA

Notes: "VNA" - Value Not Available; µg/L - microgram per litre; mg/L - milligrams per litre; CaCO3 - calcium carbonate; µS/cm - microSiemens per centimetre; NTU - nephelometric turbidity units 1 - Guidelines refer to the Canadian Council of Ministers of the Environment (CCME) guidelines (2010 update) unless otherwise indicated. Bold and shading indicates exceedence. 2 - British Columbia Ministry of the Environment (BC MOE). 2001. BC Approved Water Quality Guidelines (criteria) 1998 edition. Environmental Protection Division, British Columbia Ministry of Environment, Victoria, British Columbia. Updated August 24, 2001 (http://www.env.gov.bc.ca/wat/wq/wq_guidelines.html). 3 - Ontario Ministry of the Environment (OMOE). 1994. Water Management Policies, Guidelines, Provincial Water Quality Objectives of the Ministry of Environment [reprinted February 1999]. Ontario Ministry of the Environment. 67 pp. (http://www.ene.gov.on.ca/environment/en/resources/STD01_076352.html).

APPENDIX 6
MILLTOWN FISH DATA

(This page intentionally left blank.)