international smoking statistics - france · international smoking statistics web edition a...
TRANSCRIPT

International Smoking Statistics
Web Edition
A collection of worldwide historical data
France
Barbara Forey, Jan Hamling, John Hamling, Peter Lee
P N Lee Statistics & Computing Ltd 17 Cedar Road Sutton SM2 5DA, UK www.pnlee.co.uk This report is an updated version of Chapter 9 of International Smoking Statistics 2nd edition, Wolfson Institute of Preventive Medicine and OUP, 2002, www.oup.co.uk/isbn/0-19-850856-5 Date of issue: 17-Sep-2009 (Last major revision 17-Sep-2009)

2 France 17-Sep-2009
© Barbara Forey, Jan Hamling, John Hamling, Peter Lee, 2009 This work is copyright. It may be reproduced or quoted in whole or in part for study or research purposes, subject to inclusion of an acknowledgement of the source. It may not be reproduced for purposes other than those above or sold without written permission from the authors.

17-Sep-2009 France 3
Contents Contents ........................................................................................................................................3
List of Figures ...........................................................................................................................4 Preface ..........................................................................................................................................5
Downloads ................................................................................................................................5 Acknowledgements .......................................................................................................................6 Introduction....................................................................................................................................7
Sales data .................................................................................................................................7 Survey data...............................................................................................................................7
Table 1.1 Total annual sales of tobacco products, 1861-1924.................................................9 Table 1.2 Total annual sales of tobacco products, 1932-1959...............................................10 Table 1.3 Total annual sales of tobacco products, 1960-1989...............................................11 Table 1.4 Total annual sales of tobacco products, 1990-2008...............................................12 Table 1.5 Percentage of sales of tobacco in different forms (by weight), selected years ......13 Table 2 Sales of cigarettes (including estimated number of hand-rolled cigarettes) and
of all tobacco products. Annual total and average per adult (age 15 years and over) per day...........................................................................................................14
Table 3 Manufactured cigarettes: percentage of total sales as filter cigarettes; percentage of total sales as blond cigarettes; sales-weighted average machine yields per cigarette of tar (SWAT) ..........................................................................17
Table 4M Prevalence of smoking, males: selected surveys by age.......................................18 Table 4F Prevalence of smoking, females: selected surveys by age....................................19 Table 5M Number of cigarettes smoked per smoker per day, males: selected surveys by
age..........................................................................................................................30 Table 5F Number of cigarettes smoked per smoker per day, females: selected surveys
by age .....................................................................................................................31 Table 6M Number of cigarettes smoked per person per day, males: selected surveys by
age; with percentage total sales .............................................................................34 Table 6F Number of cigarettes smoked per person per day, females: selected surveys
by age; with percentage total sales ........................................................................35 Table 7M Number of cigarettes smoked per person per day, sales-adjusted, males:
selected surveys1 by age; with percentage total sales...........................................38 Table 7F Number of cigarettes smoked per person per day, sales-adjusted, females:
selected surveys1 by age; with percentage total sales...........................................39 Table 8 Estimated1 prevalence of smoking and estimated1 number of cigarettes per
person per day (unadjusted and sales-adjusted): summary of Tables 4, 6 and 7. Males and females aged 15 years and over ......................................................42
Notes ...........................................................................................................................................49 Notes on sources of sales data ..............................................................................................49
Sales data before 1960 ......................................................................................................49 Sales data for 1960-1989 ...................................................................................................49 Sales data for 1990 onwards..............................................................................................50 Estimates of smuggling and cross-border sales.................................................................50 Estimates of numbers of hand-rolled cigarettes.................................................................52 Plain/Filter cigarette sales ..................................................................................................52 Dark/Blond cigarette sales..................................................................................................53 Tar and nicotine machine yields of cigarettes ....................................................................53
Notes on sources of survey data ............................................................................................53 Abbreviations and acronyms ..............................................................................................64
References ..................................................................................................................................65

Table of Contents (continued)
4 France 17-Sep-2009
List of Figures Figure 1 Percentage of sales of tobacco in different forms (by weight), selected years ..... 13 Figure 2 Sales of (i) manufactured and total1 cigarettes and (ii) all tobacco products.
Average per adult (aged 15 years and over) per day ............................................ 16 Figure 3 Estimated prevalence of smoking of (i) manufactured cigarettes, (ii) total
cigarettes and (iii) all tobacco products; by year of survey. Males and females aged 15 years and over ......................................................................................... 46
Figure 4 Estimated number of (i) manufactured cigarettes and (ii) total cigarettes smoked per person per day, sales-adjusted; by year of survey. Males and females aged 15 years and over ........................................................................... 48
1 See footnotes to Tables and Figures

17-Sep-2009 France 5
Preface
International Smoking Statistics is a collection of smoking data covering most of Europe and various other economically developed countries. The second edition (published by Wolfson Institute of Preventive Medicine and OUP, 2002, www.oup.co.uk/isbn/0-19-850856-5) included data for 30 countries up to 1995. It is planned to update the chapter for each country separately, and make them available online. Please register at www.pnlee.co.uk if you wish to be informed when updates are posted.
The methods used in the web edition are essentially unchanged from those of the second edition, although some minor changes are included in the online Methods chapter. Readers are strongly recommended to consult the Methods chapter.
The two main types of data presented are sales data and survey data. We give the results of the original authors as closely as possible, whilst presenting them in a uniform format.
Sales data give the total national consumption of tobacco. Data on sales of cigarettes and of all tobacco products are presented, usually from about 1920. Estimates of the consumption of hand-rolled cigarettes are included where possible, as are data on the types of manufactured cigarettes sold. The Tobacco Research Council provided most of the sales data until 1973, while later sales data were obtained from government and industry sources.
Survey data provide information on the prevalence and amount of smoking according to age and sex. These were obtained from a wide variety of surveys. Some survey data are available for the early part of the 20th century, but for most countries they are available only from the 1950s or 1960s onwards.
In additional tables we calculate further statistics by combining sales and survey data using certain standardized assumptions. The figures are intended to provide an easily interpretable summary of the data presented in the tables, and the commentary has deliberately been kept to a minimum.
Downloads Updates currently available to download from www.pnlee.co.uk include:
Methods, including Appendix I: Estimated size of adult population; Appendix II: Comparisons of manufactured and hand-rolled cigarettes and differences in the way they are smoked; Appendix III: Consumption category estimation;
Comparisons between countries;
Updated country chapters (see Methods for current list);
Tables from each updated chapter, in Excel format.
Supplement 1: Estimation of sex-specific smoking statistics by standardized age groups and time periods. [The web edition comprises a brief Update Note, together with tables (in Excel format only) for the countries with a chapter in the web edition. The original Supplement 1 to the second edition

Preface (continued)
6 France 17-Sep-2009
(an extended version of Appendix IV to the second edition) is also available and gives a full description and tables for the other countries];
Also available from the same source are:
Supplement 2 to the second edition: Estimating past smoking habits by an indirect method. An investigation into a method based on recall, with application to Great Britain. [This supplement is an extended version of Appendix V to the second edition];
IMASS, a comprehensive Excel database system, based on WHO mortality data and smoking statistics from Supplement 1. The IMASS system includes powerful routines for creating graphs and tables.
Acknowledgements
We would like to acknowledge the tobacco industry for their financial support and for providing some of the sales data in International Smoking Statistics.
We would also like to thank the many government and research organizations and individuals who supplied much of the information included.
We thank Yvonne Cooper, Pauline Wassell and Diana Morris for maintenance of our references database.
We are indebted to G. F. Todd, past director of the Tobacco Research Council, who, shortly before he died in 1988, had prepared a draft report from which the first edition of International Smoking Statistics developed.
Professor Nicholas Wald was an editor of earlier editions, and we thank him for his support and encouragement.
We alone bear the responsibility for the analysis and interpretation of the data presented.

17-Sep-2009 France 7
Introduction
Sales data See Tables 1-3 and Notes on sources of sales data.
Data on the sales of tobacco in France are available from 1861. The consumption of manufactured cigarettes started around the 1870s and reached 0.7 cigarettes per adult per day by 1923. Consumption per adult then increased to nearly 6 cigarettes per day by the late 1970s and was then steady until the early 1990s. Consumption then decreased to 3 per day by 2004. In addition to these general trends, there was a dip in the consumption of manufactured cigarettes during the Second World War.
We estimate that consumption of hand-rolled cigarettes per adult declined from about 1.5 to about 0.2 cigarettes per day between 1950 and 1990, then increased slightly, to 0.5 by 2005. Estimates of hand-rolled cigarette consumption are based on sales of ‘scaferlatis’ which is fine-cut tobacco used for hand-rolling and pipes.
Apart from a fall during the Second World War, the consumption per adult of all tobacco products combined increased from nearly 3 g per day in 1865 to around 7 g in the period between 1974 and 1979. Since then it has declined steadily, to about 3 g by 2005.
In 1865 the majority of tobacco was consumed in the form of scaferlatis, with chewing tobacco and snuff also popular. The use of manufactured cigarettes increased rapidly during the 1920s: by 1932 over 37% of all tobacco consumed was as manufactured cigarettes. This increased to nearly 90% by the mid 1980s but declined after the mid 1990s, reaching 75% by 2004. Most of the remainder was sold as pipe and hand-rolling tobacco, with a small surge in cigar and cigarillo consumption in the 2000s. The percentage of manufactured cigarettes that were filtered increased steadily from less than 10% in 1950s to over 90% in the 2000s. Traditionally a high proportion of the cigarettes sold in France have been of dark tobacco, but in recent years blond cigarettes have almost completely taken over, the proportion rising from 20% in 1978 to 90% by 2005.
Smuggling was not a major feature of the French market before 2000: it was estimated as around 3% of consumption. However, cross-border sales and smuggling may have increased since then.
Survey data See Tables 4-8 and Notes on sources of survey data.
In 1953, the prevalence of all tobacco smoking among those aged 15 years and over was 76% in men and 30% in women. The difference between the percentages of men and women who smoke has decreased since then owing to a steady decrease in the prevalence among men to around 30% in the 2000s (although one source (source 8) has given consistently lower estimates since the 1960s). Estimates for the prevalence among women varied around 15-35%, with no trend evident over time. Several surveys in the 1960s and 1970s showed a high prevalence of occasional smoking (about 10-15% in both sexes) so, when interpreting the prevalence estimates, the definition of smoking used by each survey should be taken into account.

Introduction (continued)
8 France 17-Sep-2009
The percentage of men who smoked other products but not cigarettes dropped from 15% in 1960 to 3-4% since the mid-1970s, with the prevalence somewhat higher for older men. Very few women smoked other tobacco products but not cigarettes. There are few data on prevalence by type of cigarette, but smoking of hand-rolled cigarettes only appears to be around 6% among men (perhaps rising to 9% in the 2000s) and 1% among women (perhaps rising to 4% in the 2000s). Several authors have noted that a higher proportion of men than women prefer dark tobacco brands (sources 11 and 12, see Notes on sources of survey data, p. 53).
During the period from the 1950s to the present, a decrease was seen within each age group in the percentages of men smoking; this appeared greatest among men aged over 65. There has always been a strong tendency for prevalence to decline with increasing age, this being particularly marked among women. Results of surveys of teenage smoking varied considerably, but most showed the prevalence of smoking among girls to be similar to that among boys, particularly when occasional smoking was included.
Comparison of survey and sales data suggests that surveys generally under-reported consumption by 5-30%. The estimated number of manufactured cigarettes smoked per person per day (sales-adjusted, averaged for the whole adult population) for men increased from 7 in 1960 to around 8 in the 1970s and 1980s, then decreased again to below 6 by the late 1990s. This may have decreased further during the 2000s. The number of cigarettes including hand-rolled cigarettes remained, for men, around 9 until the 1980s, after which it decreased to 7 by 2000 and possibly further since then. For women the number of cigarettes per person per day was 1-2 in the 1960s and 3-4 thereafter.

17-Sep-2009 France 9
Table 1.1 Total annual sales of tobacco products, 1861-1924
Source: see Notes on sources of sales data: Sales data before 1960, p. 49
Year Manufactured Cigars Smoking Chew ing Snuff All tobaccocigarettes & cigarillos tobacco tobacco products
tonnes millions tonnes millions tonnes tonnes tonnes tonnes
1861 8 7 3 108 777 16 743 977 7 243 28 0791862 10 8 3 120 780 17 093 981 7 320 28 5241863 10 8 3 064 766 17 650 1 062 7 455 29 2411864 10 8 3 108 777 17 982 1 093 7 734 29 9271865 11 9 2 960 740 18 005 1 092 7 846 29 9141866 12 10 3 248 812 18 237 1 119 7 946 30 5621867 13 11 3 268 817 18 824 1 159 7 927 31 1911868 14 12 3 120 780 19 045 1 224 9 747 33 1501869 18 15 3 124 781 19 560 1 232 8 239 32 173
1870 20 17 2 860 715 19 412 1 200 7 808 31 3001871 18 15 2 712 678 16 670 987 6 576 26 9631872 48 40 3 336 834 16 190 950 6 508 27 0321873 282 235 3 300 825 17 308 974 6 510 28 3741874 502 418 3 284 821 17 775 998 6 643 29 2021875 630 525 3 348 837 18 607 1 029 6 859 30 4731876 736 613 3 396 849 19 470 1 079 6 924 31 6051877 751 626 3 416 854 19 974 1 149 7 004 32 2941878 826 688 3 360 840 20 028 1 175 6 983 32 3721879 826 688 3 292 823 20 529 1 211 6 894 32 752
1880 946 788 3 400 850 21 230 1 244 6 886 33 7061881 1 050 875 3 396 849 21 696 1 237 6 897 34 2761882 1 127 939 3 604 901 22 266 1 269 6 962 35 2281883 1 127 939 3 672 918 22 964 1 284 6 860 35 9071884 1 105 921 3 724 931 23 729 1 222 6 775 36 5551885 1 063 886 3 628 907 23 955 1 225 6 586 36 4571886 1 030 858 3 524 881 23 771 1 210 6 446 35 9811887 1 002 835 3 536 884 23 992 1 219 6 242 35 9911888 1 115 929 3 496 874 24 389 1 249 6 049 36 2981889 1 026 855 3 508 877 24 704 1 214 5 898 36 350
1890 1 062 885 3 368 842 24 962 1 223 5 732 36 3471891 1 141 951 3 276 819 25 160 1 250 5 507 36 3341892 1 289 1 074 3 272 818 25 225 1 232 5 478 36 4961893 1 405 1 171 3 196 799 24 935 1 194 5 353 36 0831894 1 457 1 214 3 128 782 25 107 1 181 5 308 36 1811895 1 571 1 309 3 108 777 25 530 1 148 5 237 36 5941896 1 776 1 480 3 124 781 26 411 1 142 5 187 37 6401897 1 766 1 472 3 080 770 26 752 1 129 4 954 37 6811898 1 859 1 549 3 140 785 27 431 1 144 4 915 38 4891899 1 950 1 625 3 092 773 27 912 1 198 4 905 39 057
1900 2 161 1 801 2 880 720 27 734 1 135 4 918 38 8281901 2 215 1 846 2 624 656 27 874 1 085 4 855 38 6531902 2 372 1 977 2 580 645 28 429 1 075 4 606 39 0621903 2 556 2 130 2 628 657 27 833 1 108 4 554 38 6791904 2 641 2 201 2 660 665 28 340 1 181 4 640 39 4621905 2 710 2 258 2 684 671 28 498 1 185 4 716 39 7931906 3 026 2 522 2 688 672 28 388 1 162 4 831 40 0951907 3 353 2 794 2 384 596 28 724 1 150 4 851 40 4621908 3 488 2 907 2 316 579 29 156 1 157 4 756 40 8731909 3 661 3 051 2 312 578 29 493 1 142 4 861 41 469
1910 3 900 3 250 2 368 592 29 960 1 151 4 879 42 2581911 4 224 3 520 2 336 584 30 513 1 156 4 650 42 8791912 4 607 3 839 2 444 611 31 498 1 150 4 719 44 4181913 4 858 4 048 2 592 648 31 552 1 147 4 715 44 864
1923 10 121 8 434 1 452 363 38 082 1 078 4 224 54 9571924 12 035 10 029 1 348 337 40 222 1 076 3 917 58 598

10 France 17-Sep-2009
Table 1.2 Total annual sales of tobacco products, 1932-1959
Source: see Notes on sources of sales data: Sales data before 1960, p. 49
Year Manufactured Cigars Cigarillos Smoking Chew ing Snuff All tobaccocigarettes tobacco tobacco productstonnes millions tonnes millions tonnes millions tonnes tonnes tonnes tonnes
1932 22 106 18 422 764 191 163 102 32 348 937 2 551 58 8701933 21 767 18 139 720 180 165 103 32 274 923 2 413 58 2621934 20 815 17 346 656 164 176 110 31 874 891 2 309 56 7211935 20 082 16 735 616 154 189 118 30 364 848 2 169 54 2681936 20 628 17 190 632 158 208 130 30 723 853 2 026 55 0701937 21 684 18 070 680 170 256 160 29 574 810 1 897 54 9011938 22 468 18 723 592 148 256 160 29 314 767 1 716 55 1131939 24 601 20 501 620 155 258 161 31 841 685 1 628 59 633
1940 22 802 19 002 632 158 278 174 29 990 564 1 396 55 6631941 18 276 15 230 268 67 182 114 24 425 603 1 112 44 8661942 13 228 11 023 240 60 182 114 15 011 542 1 246 30 4491943 12 048 10 040 232 58 130 81 11 560 447 1 175 25 5921944 10 690 8 908 164 41 136 85 9 259 335 802 21 3861945 15 930 13 275 192 48 141 88 14 470 470 883 32 0861946 22 260 18 550 200 50 144 90 18 581 572 880 42 6371947 29 551 24 626 236 59 149 93 23 961 696 892 55 4851948 32 257 26 881 212 53 125 78 26 649 721 856 60 8201949 34 186 28 488 272 68 160 100 21 075 644 786 57 123
1950 38 252 31 877 396 99 245 153 21 643 612 757 61 9051951 41 546 34 622 424 106 251 157 19 856 613 729 63 4201952 43 649 36 374 412 103 304 190 18 415 574 699 64 0531953 43 426 36 188 400 100 366 229 18 519 536 656 63 9031954 43 878 36 565 416 104 381 238 18 120 515 555 63 8651955 47 683 39 736 472 118 440 275 17 414 520 560 67 0891956 51 042 42 535 588 147 472 295 17 505 529 574 70 7101957 53 549 44 624 576 144 530 331 17 839 558 559 73 6101958 55 264 46 053 764 191 573 358 18 327 507 493 75 9271959 52 844 44 037 868 217 517 323 17 783 533 508 73 053

17-Sep-2009 France 11
Table 1.3 Total annual sales of tobacco products, 1960-1989
Source: see Notes on sources of sales data: Sales data for 1960-1989, p. 49
Year Manufactured Cigars and cigarillos SmokingChew ing tobacco All tobacco
cigarettes cigars tobacco and snuff productstonnes millions tonnes millions tonnes tonnes tonnes
1960 52 729 44 617 1 490 242 325 18 057 985 73 2611961 53 999 46 046 1 614 264 18 075 946 74 6351962 55 765 47 923 1 746 285 18 262 883 76 6561963 57 268 49 602 1 906 328 18 371 821 78 3651964 57 732 50 401 2 105 378 17 269 884 77 9901965 61 508 54 127 2 251 406 16 636 816 81 2111966 63 843 56 635 2 426 440 15 952 790 83 0111967 67 513 60 377 2 498 451 15 549 775 86 3351968 70 186 63 282 2 648 492 15 540 723 89 0971969 72 428 65 844 2 788 533 14 359 721 90 296
1970 75 982 69 650 2 866 546 13 366 694 92 9071971 78 046 72 143 3 282 656 12 514 705 94 5461972 77 312 72 070 3 477 710 11 513 681 92 9821973 80 176 75 379 3 785 795 10 713 668 95 3421974 84 883 80 492 4 466 965 10 263 683 100 2951975 88 704 84 847 5 286 1 172 9 683 685 104 3581976 86 922 83 872 5 973 1 358 8 705 691 102 2911977 88 793 86 436 6 790 1 572 8 260 671 104 5151978 86 444 84 900 6 685 1 562 7 613 655 101 3961979 88 708 87 909 6 683 1 568 7 257 581 103 229
1980 87 628 87 628 7 053 1 926 7 140 516 102 3371981 86 269 87 098 6 830 1 865 6 972 427 100 4971982 86 266 87 941 6 321 1 726 6 908 416 99 9111983 86 995 89 554 5 907 1 613 6 689 416 100 0071984 87 681 91 153 5 680 1 551 6 469 391 100 2201985 91 628 96 209 6 405 1 749 6 550 404 104 9871986 89 200 94 606 5 870 1 603 5 846 372 101 2881987 87 942 94 224 5 610 1 532 5 529 374 99 4561988 85 913 92 999 5 405 1 476 5 235 382 96 9361989 86 792 94 929 5 343 1 459 4 988 380 97 503
273 257
378 379 374 338
426 411 398
314
416 434 425 410
380 372 371 393
cigarillosmillions
350

12 France 17-Sep-2009
Table 1.4 Total annual sales of tobacco products, 1990-2008
Source: see Notes on sources of sales data: Sales data for 1990 onwards, p. 50
Year Manufactured Cigars and cigarillos Hand- Pipe Chewing Snuff All tobaccocigarettes large small rolling tobacco tobacco products
total cigars cigars tobaccotonnes millions tonnes millions tonnes tonnes tonnes tonnes tonnes
1990 86 684 95 809 5 398 87 2 023 2 910 97 4121991 86 928 97 100 5 398 88 2 193 2 712 97 6241992 85 303 96 310 5 046 82 2 515 2 454 351 53 95 7221993 82 026 93 617 5 013 80 3 067 2 467 340 51 92 9651994 78 098 90 113 5 156 79 3 759 2 436 322 47 89 8181995 75 717 88 336 5 350 75 4 110 2 334 334 47 87 8921996 73 033 86 163 5 607 76 4 768 2 230 328 45 86 0111997 69 548 82 983 5 753 76 5 270 2 045 319 44 82 9791998 69 463 83 835 5 973 78 5 369 1 915 303 43 83 0661999 68 534 83 675 6 123 80 5 611 1 775 309 42 82 394
2000 66 797 82 514 6 269 80 5 581 1 589 319 39 80 5942001 66 771 83 464 6 335 85 5 633 1 454 333 38 80 5652002 64 423 80 529 6 255 83 5 721 1 236 332 34 78 0012003 55 719 69 649 6 335 5 954 1 041 69 4022004 43 939 54 924 6 929 6 970 891 58 7902005 43 841 54 801 6 767 7 009 773 58 3892006 44 618 55 772 6 661 7 168 627 59 0962007 43 956 54 945 6 196 7 095 611 57 9022008 42 871 53 589 5 965 7 400 431 56 676
352 1 892 1 848
1 629
1 819 1 692
1 625
1 6321 645
1 730
1 4551 4951 5531 592
1 2961 2891 3291 386
millions
1 3871 386
397 394

17-Sep-2009 France 13
Table 1.5 Percentage of sales of tobacco in different forms (by weight), selected years
Source: calculated from Tables 1.1 - 1.4
Figure 1 Percentage of sales of tobacco in different forms (by weight), selected years
Tobacco SalesPercentage by weight
0%
20%
40%
60%
80%
100%
1865 1875 1885 1895 1905 1913 1924 1935 1945 1955 1965 1975 1985 1995 2005
Manufactured cigarettes Cigars and cigarillosPipe and hand-rolling tobacco Chewing tobacco and snuff
Source: Table 1.5
Year Manufactured cigarettes
Cigars and cigarillos
Pipe and hand-rolling
tobacco
Chewing tobacco
and snuff% % % %
1865 0.0 9.9 60.2 29.91875 2.1 11.0 61.1 25.91885 2.9 10.0 65.7 21.41895 4.3 8.5 69.8 17.41905 6.8 6.7 71.6 14.81913 10.8 5.8 70.3 13.11924 20.5 2.3 68.6 8.51935 37.1 1.1 56.1 5.61945 49.9 0.6 45.3 4.21955 71.5 0.7 26.1 1.61965 75.7 2.8 20.5 1.01975 85.0 5.1 9.3 0.71985 87.3 6.1 6.2 0.41995 86.1 6.1 7.3 0.42005 75.1 11.6 13.3 0.0

14 France 17-Sep-2009
Table 2 Sales of cigarettes (including estimated number of hand-rolled cigarettes) and of all tobacco products. Annual total and average per adult (age 15 years and over) per day
Year Manufactured cigarettes Hand-rolled cigarettes Total cigarettes All tobacco productsTotal annual Number/ Total annual Number/ Total annual Number/ Total annual Grams/
millions adult/day millions adult/day millions adult/day tonnes adult/day
1865 9 0.0 29 914 2.9
1870 17 0.0 31 300 3.1
1875 525 0.1 30 473 3.1
1880 788 0.1 33 706 3.3
1885 886 0.1 36 457 3.5
1890 885 0.1 36 347 3.5
1895 1 309 0.1 36 594 3.5
1900 1 801 0.2 38 828 3.71901 1 846 0.2 38 653 3.71902 1 977 0.2 39 062 3.71903 2 130 0.2 38 679 3.61904 2 201 0.2 39 462 3.71905 2 258 0.2 39 793 3.71906 2 522 0.2 40 095 3.81907 2 794 0.3 40 462 3.81908 2 907 0.3 40 873 3.81909 3 051 0.3 41 469 3.9
1910 3 250 0.3 42 258 3.9
1913 4 048 0.4 44 864 4.1
1923 8 434 0.7 54 957 4.81924 10 029 0.9 58 598 5.1
1932 18 422 1.6 58 870 5.11933 18 139 1.6 58 262 5.01934 17 346 1.5 56 721 4.91935 16 735 1.4 54 268 4.71936 17 190 1.5 55 070 4.81937 18 070 1.6 54 901 4.81938 18 723 1.6 55 113 4.81939 20 501 1.8 59 633 5.2
1940 19 002 1.7 55 663 5.01941 15 230 1.4 44 866 4.11942 11 023 1.0 30 449 2.81943 10 040 0.9 25 592 2.31944 8 908 0.8 21 386 2.01945 13 275 1.2 32 086 2.91946 18 550 1.6 42 637 3.71947 24 626 2.1 55 485 4.81948 26 881 2.3 60 820 5.21949 28 488 2.4 57 123 4.8
1950 31 877 2.7 19 934 1.7 51 811 4.4 61 905 5.21951 34 622 2.9 18 288 1.5 52 910 4.5 63 420 5.41952 36 374 3.1 16 961 1.4 53 335 4.5 64 053 5.41953 36 188 3.0 17 057 1.4 53 245 4.5 63 903 5.41954 36 565 3.1 16 689 1.4 53 254 4.5 63 865 5.41955 39 736 3.3 16 039 1.3 55 775 4.7 67 089 5.61956 42 535 3.5 16 123 1.3 58 658 4.9 70 710 5.91957 44 624 3.7 16 431 1.4 61 055 5.1 73 610 6.11958 46 053 3.8 16 880 1.4 62 933 5.2 75 927 6.31959 44 037 3.6 16 379 1.3 60 416 4.9 73 053 6.0

17-Sep-2009 France 15
Table 2 (continued)
1 Uses population data for 2006 Source: Manufactured cigarettes and all tobacco products, Tables 1.1 - 1.4. Hand-rolled cigarettes, see Notes on sources of sales data: Estimates of numbers of hand-rolled cigarette, p. 52. Population, see Population, Methods p. 14.
Year Manufactured cigarettes Hand-rolled cigarettes Total cigarettes All tobacco productsTotal annual Number/ Total annual Number/ Total annual Number/ Total annual Grams/
millions adult/day millions adult/day millions adult/day tonnes adult/day
1960 44 617 3.6 16 631 1.4 61 248 5.0 73 261 6.01961 46 046 3.7 16 648 1.3 62 694 5.1 74 635 6.01962 47 923 3.8 16 820 1.3 64 743 5.1 76 656 6.11963 49 602 3.8 16 921 1.3 66 523 5.1 78 365 6.11964 50 401 3.9 15 906 1.2 66 307 5.1 77 990 6.01965 54 127 4.1 15 323 1.2 69 450 5.2 81 211 6.11966 56 635 4.2 14 693 1.1 71 328 5.3 83 011 6.21967 60 377 4.5 14 321 1.1 74 698 5.5 86 335 6.41968 63 282 4.6 14 313 1.0 77 595 5.7 89 097 6.51969 65 844 4.7 13 225 0.9 79 069 5.7 90 296 6.5
1970 69 650 4.9 12 311 0.9 81 961 5.8 92 907 6.61971 72 143 5.1 11 526 0.8 83 669 5.9 94 546 6.61972 72 070 5.0 10 604 0.7 82 674 5.7 92 982 6.51973 75 379 5.2 9 867 0.7 85 246 5.9 95 342 6.61974 80 492 5.5 9 453 0.6 89 945 6.1 100 295 6.81975 84 847 5.7 8 919 0.6 93 766 6.3 104 358 7.11976 83 872 5.6 8 018 0.5 91 890 6.2 102 291 6.91977 86 436 5.8 7 608 0.5 94 044 6.3 104 515 7.01978 84 900 5.6 7 012 0.5 91 912 6.1 101 396 6.71979 87 909 5.8 6 684 0.4 94 593 6.2 103 229 6.8
1980 87 628 5.7 6 576 0.4 94 204 6.1 102 337 6.61981 87 098 5.6 6 422 0.4 93 520 6.0 100 497 6.51982 87 941 5.6 6 363 0.4 94 304 6.0 99 911 6.41983 89 554 5.7 6 161 0.4 95 715 6.1 100 007 6.31984 91 153 5.7 5 958 0.4 97 111 6.1 100 220 6.31985 96 209 6.0 6 033 0.4 102 242 6.4 104 987 6.61986 94 606 5.9 5 384 0.3 99 990 6.3 101 288 6.31987 94 224 5.8 5 093 0.3 99 317 6.1 99 456 6.11988 92 999 5.7 4 822 0.3 97 821 6.0 96 936 5.91989 94 929 5.7 4 594 0.3 99 523 6.0 97 503 5.9
1990 95 809 5.7 2 662 0.2 98 471 5.9 97 412 5.81991 97 100 5.8 2 886 0.2 99 986 6.0 97 624 5.81992 96 310 5.7 3 309 0.2 99 619 5.9 95 722 5.71993 93 617 5.5 4 036 0.2 97 653 5.7 92 965 5.51994 90 113 5.3 4 946 0.3 95 059 5.6 89 818 5.21995 88 336 5.1 5 408 0.3 93 744 5.4 87 892 5.11996 86 163 5.0 6 274 0.4 92 437 5.3 86 011 5.01997 82 983 4.8 6 934 0.4 89 917 5.2 82 979 4.81998 83 835 4.8 7 064 0.4 90 899 5.2 83 066 4.81999 83 675 4.8 7 383 0.4 91 058 5.2 82 394 4.7
2000 82 514 4.7 7 343 0.4 89 857 5.1 80 594 4.62001 83 464 4.8 7 412 0.4 90 876 5.2 80 565 4.62002 80 529 4.5 7 528 0.4 88 057 5.0 78 001 4.42003 69 649 3.9 7 834 0.4 77 483 4.3 69 402 3.92004 54 924 3.0 9 171 0.5 64 095 3.6 58 790 3.32005 54 801 3.0 9 222 0.5 64 023 3.5 58 389 3.22006 55 772 3.1 9 432 0.5 65 204 3.6 59 096 3.22007/1 54 945 3.0 9 336 0.5 64 281 3.5 57 902 3.22008/1 53 589 2.9 9 737 0.5 63 326 3.5 56 676 3.1

16 France 17-Sep-2009
Figure 2 Sales of (i) manufactured and total1 cigarettes and (ii) all tobacco products. Average per adult (aged 15 years and over) per day
1 Includes estimated hand-rolled cigarette consumption Source: Table 2 Table 2 includes data for earlier years (not shown in this figure).
SalesNumber /adult /day
0
2
4
6
8
10
12
14
1920 25 30 35 40 45 50 55 60 65 70 75 80 85 90 95 00 05 2010
Year
Num
ber /
adu
lt / d
ay
Manufactured cigarettes Total cigarettes
SalesGrams /adult /day
0
2
4
6
8
10
12
14
1920 25 30 35 40 45 50 55 60 65 70 75 80 85 90 95 00 05 2010Year
Gra
ms
/ adu
lt / d
ay
All tobacco products

17-Sep-2009 France 17
Table 3 Manufactured cigarettes: percentage of total sales as filter cigarettes; percentage of total sales as blond cigarettes; sales-weighted average machine yields per cigarette of tar (SWAT)
Source: see Notes on sources of sales data: Plain/Filter cigarette sales, p. 52, Dark/Blond cigarette sales, p. 53 and Tar and nicotine machine yields of cigarettes, p. 53.
Year Filter Blond SWAT% % mg/cig
1950 35.0
1958 7.51959 8.7
1960 11.5 30.01961 14.31962 17.01963 19.01964 21.51965 24.81966 28.71967 31.91968 33.61969 35.6
1970 38.3 25.01971 42.41972 46.61973 49.91974 53.81975 56.61976 59.31977 59.01978 58.3 20.11979 60.5 24.5
1980 61.4 30.21981 62.5 34.71982 63.8 38.41983 65.4 42.21984 67.9 46.4 16.51985 70.2 50.71986 71.7 53.5 15.91987 73.3 56.51988 74.9 58.81989 76.3 60.8
1990 78.5 63.8 13.41991 80.5 67.6 12.81992 82.3 68.6 12.31993 83.2 70.0 11.51994 84.2 71.2 11.31995 85.3 72.7 11.31996 86.7 74.2 11.01997 87.5 76.1 10.21998 88.9 78.7 10.11999 90.1 80.7 10.1
2000 91.0 82.5 10.12001 91.8 84.2 9.92002 92.6 85.8 8.9
2004 94.4 88.12005 94.2 89.9

18 France 17-Sep-2009
Table 4M Prevalence of smoking, males: selected surveys by age (continues on p. 20)
12 13 14 15 16 17 18 19 - - - - - - - - - - - - Allages
53 1 A R 7253 1 A A 7756 26 UC R 7756 26 A R 8160 1 MC R60 1 U A 7360 8 U R63 10 UC U63 10 A U64 13 UC U*64 40 UC *64 40 U A 6865 1 MC R65 1 U A 7265 8 U R67 1 MC R67 1 MC A67 1 U A 7270 8 U R71 17 U R 21 33 47 5171 17 U A 60 64 69 7071 19 A U 81 80 7874 4 U A74 25 U R76 1 MC R76 1 MC A76 1 A U76 4 UC U76 4 U A 6076 4* UC U76 4* U U76 8 U R76 11 UC U76 18 UC *76 18 U U 27 35 40 3377 3 MC R 2977 3 U A 4877 4 U R77 4 UC A77 4 U A 5177 8 U R78 12 MC R78 12 TC R 5078 12 A R 5478 17 U R 10 22 30 4078 20 UC U78 20 A U78 24 UC R 38
735 20 40
43 40 36
55
64 65 67 56
5145
61 59 63 52 39 33 28
4764 56 51 53 38
31 53 6941
3220 44
10 31 55
5357
4764
5774 62 64 51 54
35455662
6153
7659
76 76 74 70
66504562
75 73 77 75
4969 67
43
495966
64
5769 75 75 75 72
84 79 6988 82 74
79 78 76 6974 74 73 65
Freq
uenc
y Age Groups
Year
Sour
ce
Prod
uct 20 25
24 29
30 35 40
39 44
45 7580+
50 55 60 65 70
7934 49 54 59 64 69 74

17-Sep-2009 France 19
Table 4F Prevalence of smoking, females: selected surveys by age (continues on p. 21)
12 13 14 15 16 17 18 19 - - - - - - - - - - - - Allages
53 1 A R 1753 1 A A 3556 26 UC R56 26 A R60 1 MC R60 1 U A 2860 8 U R63 10 UC U63 10 A U64 13 UC U* 1164 40 UC *64 40 U A 4665 1 MC R65 1 U A 3365 8 U R67 1 MC R67 1 MC A67 1 U A 3270 8 U R71 17 U R 16 22 28 3271 17 U A 67 76 80 7671 19 A U74 4 U A74 25 U R76 1 MC R76 1 MC A76 1 A U76 4 UC U76 4 U A 3176 4* UC U76 4* U U76 8 U R76 11 UC U76 18 UC *76 18 U U 22 31 34 2877 3 MC R 2177 3 U A 4377 4 U R77 4 UC A77 4 U A 2977 8 U R78 12 MC R78 12 TC R 1478 12 A R 1478 17 U R 16 16 28 3478 20 UC U78 20 A U78 24 UC R 50
Freq
uenc
y Age Groups
Year
Sour
ce
Prod
uct 20 25 30 35 40 45 50 55 60 65 70 75
80+24 29 34 39 44 49 54 7959 64 69 74
24 20 11 251 38 22 6
1154 38 32 24 14
1515
15 13 16 6
40 29
1549 40
101563 47
1026
66 48 30 20 8
2824
203333
3056 39 26 17 7
2627
4226
15 385 30 3820 62 60
1829
50 35 29 19 1029
1441 21 16 13 7 3 1
7 3 1
3 32 46
41 21 16 13

20 France 17-Sep-2009
Table 4M (continued from p. 18, continues on p. 22) Prevalence of smoking, males
12 13 14 15 16 17 18 19 - - - - - - - - - - - - Allages
79 1 MC R79 1 MC A79 1 A U79 4 U A 5479 4* UC U79 4* U A 4879 8 U R79 21 UC *79 28 U U80 3 UC *80 3 U A 4580 6 UC R80 6 A R 4480 7 MC U80 7 U U80 8 U R81 3 UC * 2681 3 U A 4381 4 U A 4981 9 UC U81 9 A U81 22 U U82 4 U A 4983 3 UC * 53 2683 3 U A 58 3683 4 U A 5183 4* U A83 23 UC * 2 9 20 34 45 1684 3 UC * 60 2784 3 U A 66 3685 4 U U86 4 UC R 3986 4 U A 4686 5 UC R 4486 14 UC R 3486 14 UC A 3686 14 A A 4186 15 UC R 3786 15 UC A 3786 15 A A 4387 8 U R87 16 UC R 3987 16 UC A 4287 16 A A 4787 29 UC U 4387 29 A U 4754 54 50 37
53 52 46 32
46 45 3449 48 41
4342 40 33
38 37 3645 43 40
55 33 3237 36 36
46 28 2749 29 27
42 35 27 2240 57 54 4839 27
29 5137 59 60 46
52 39 34 22
55
5 20 4210 34 52
50
61 54 44 3316 36 47
57
334 23 41
4954
3663 61 54 49
58 47 45 3224 44 60
71
455246
9 24 48
4128 53 55 50 46 40 34 30
2664
2726 46 63
63 65 54
40
4452 49 59 46 38
45
374250
64 69 74 79
43
80+24 29 34 39 44 49 54 59
60 65 70 7540 45 50 55
Freq
uenc
y Age Groups
Year
Sour
ce
Prod
uct 20 25 30 35

17-Sep-2009 France 21
Table 4F (continued from p. 19, continues on p. 23) Prevalence of smoking, females
12 13 14 15 16 17 18 19 - - - - - - - - - - - - Allages
79 1 MC R79 1 MC A79 1 A U79 4 U A 2379 4* UC U79 4* U A 2479 8 U R79 21 UC *79 28 U U80 3 UC *80 3 U A 4280 6 UC R80 6 A R 1680 7 MC U80 7 U U80 8 U R81 3 UC * 2981 3 U A 4581 4 U A 2981 9 UC U81 9 A U81 22 U U82 4 U A 2683 3 UC * 52 2583 3 U A 60 3683 4 U A 2983 4* U A83 23 UC * 1 12 16 35 39 1884 3 UC * 50 2984 3 U A 65 4285 4 U U86 4 UC R 2486 4 U A 3086 5 UC R 2086 14 UC R 1586 14 UC A 1786 14 A A 1886 15 UC R 1786 15 UC A 1986 15 A A 1987 8 U R87 16 UC R 1387 16 UC A 1987 16 A A 1987 29 UC U 2987 29 A U 29
Freq
uenc
y Age Groups
Year
Sour
ce
Prod
uct 20 25 30 35 40 45 50 55 60 65 70 75
80+24 29 34 39 44 49 54 59
17
222930
64 69 74 79
444 34 18
26
2451 32 21 15 5
2220 43 62
1620 36 25 17 12 10 4 2
282816
12 33 3827 50 56
54 46 27 16 84040
4155 32 26 8 9
4 15 4214 28 55
55 39 31 17 7
11 4
34
7 23 4514 37 61
25
14 828 4638 57 48 31
42 23
39 44 36 20 13 9 6 222 11 826 13 928 13 924 16 1025 17 1125 17 12
2020 13 325 20 625 21 6
49 38 17 849 38 17 8

22 France 17-Sep-2009
Table 4M (continued from p. 20, continues on p.24) Prevalence of smoking, males
12 13 14 15 16 17 18 19 - - - - - - - - - - - - Allages
88 3 UC * 54 2688 3 U A 62 3388 8 U R88 27 U R 3688 29 TC U 4288 29 A U 4588 29* TC U 4188 29* A U 4489 4 UC R89 4 U A89 27 U R 3789 29 TC U 3689 29 A U 4189 29* TC U 4789 29* A U 4990 3 UC *90 3 U A 62 3990 8 U R90 15 UC R 3190 15 UC A 3190 15 A A 3690 23 UC * 1 2 7 23 3490 27 U R 3990 29 MC U 4490 29 TC U 4690 29 A U 4990 32 U * 6 1190 32 U R 091 3 U * 50 1991 3 U A 68 3291 4 U R 3891 4 U A 4691 6 UC R 3891 27 U R 3991 29 MC U 4291 29 TC U 4791 29 A U 5091 31 MC U92 3 U * 69 2992 3 U A 76 3592 4 U R92 4 U A 4892 27 U R 3792 29 MC U 4092 29 TC U 4392 29 A U 4792 31 MC U 3892 34 UC R92 34 U A 44
4054 56 47 45 29 23
21 31 26 2355 58 51 2753 56 42 2152 53 38 16
32 1663 59
22 42 48 4554 53 40 20
392 24 375 30 43
40
59 59 52 3358 58 45 2857 50 43 23
1720 46 53 44 32 20
45 39 30 2312 34 50 51
2269 48 51 54 33 26
36 44 47 279 20 48
59
103 8 31
62 52 52 3162 48 49 30
34 2161 47 45 26
25 45 49 45
40 25 2541 33 31
3840 25 24
2414 33 57
55 63 49 2955 61 47 2549 55 46 2249 51 42 15
4549
21 46 46 46 29 19
48 54 54 2648 53 48 2053 62 43 29
31 2051 57 40 25
20 47 46 40
5 27 5139
2 21 4264 69 74 79
80+24 29 34 39 44 49 54 59
60 65 70 7540 45 50 55
Freq
uenc
y Age Groups
Year
Sour
ce
Prod
uct 20 25 30 35

17-Sep-2009 France 23
Table 4F (continued from p. 21, continues on p.25) Prevalence of smoking, females
12 13 14 15 16 17 18 19 - - - - - - - - - - - - Allages
88 3 UC * 43 2488 3 U A 57 3288 8 U R88 27 U R 1888 29 TC U 3188 29 A U 3188 29* TC U 2788 29* A U 2789 4 UC R89 4 U A89 27 U R 1989 29 TC U 2789 29 A U 2889 29* TC U 3089 29* A U 3090 3 UC *90 3 U A 51 3290 8 U R90 15 UC R90 15 UC A90 15 A A90 23 UC * 0 3 13 23 3890 27 U R 2190 29 MC U 2890 29 TC U 3090 29 A U 3090 32 U * 4 790 32 U R 291 3 U * 34 1891 3 U A 53 3091 4 U R 2691 4 U A 3591 6 UC R 2091 27 U R 2291 29 MC U 3191 29 TC U 3191 29 A U 3191 31 MC U92 3 U * 49 2692 3 U A 57 3392 4 U R92 4 U A 3392 27 U R 2292 29 MC U 3292 29 TC U 3292 29 A U 3392 31 MC U 2892 34 UC R92 34 U A 29
Freq
uenc
y Age Groups
Year
Sour
ce
Prod
uct 20 25 30 35 40 45 50 55 60 65 70 75
80+24 29 34 39 44 49 54 59
3 19 4064 69 74 79
5 30 4719
7 448 42 21 13
17 35 31 17
48 42 21 1347 34 23 847 34 23 8
3033
18 34 36 16 9 541 36 20 1241 37 20 1355 40 27 1055 40 28 10
209 23 54
19
16 42 35 19 9 554 41 20 856 42 21 956 42 22 9
72 10 33
96 23 49
42 362 54 35 26 9 5
42 29 15
47 27 38 35 220 38 37 22 10 4
24 15 9
56 43 24 1057 44 24 1157 44 24 12
12 8
286 23 369 31 44
27
12 763 52
20 34 35 2139 21
46 47 27 1547 47 27 1547 47 27 16
27 34 25 1427
54 44 32 14 8 10

24 France 17-Sep-2009
Table 4M (continued from p.22, continues on p.26) Prevalence of smoking, males
12 13 14 15 16 17 18 19 - - - - - - - - - - - - Allages
93 4 U R93 4 U A 4093 27 U R 3693 31 MC U 3793 34 UC R93 34 U A 4093 37 U * 1593 37 U A 2294 3 UC *94 3 U A 55 3194 27 U R 3594 29 MC U 4094 29 TC U 4494 29 A U 4794 30 MC U 4194 30 TC U 4494 30 A U 4894 31 MC U 3694 36 U R 11 2395 3 UC * 58 2795 3 U A 62 3595 3* U A95 4 U A 4195 15 UC R 2495 15 UC A 2595 15 A A 2995 27 U R 3695 30 MC U 3595 30 TC U 4095 30 A U 4295 31 MC U 3495 34 A R 3995 34 U A 4296 3 U * 52 2796 3 U A 60 3596 3* U A96 14 UC R 2396 14 UC A 2696 14 A A 2996 16 UC R 3396 16 UC A 3596 16 A A 4096 27 U R 3096 31 MC U 33
1621 31 26 23
44 41 3319 41 40 38 25
38 34 2540 34 28
33 25 1836 29 20
4030 21 16
4 19 4510 29 52
1752 53 47 39 1846 47 45 3822 31 25 22
50 50 47 2149 50 45 17
27 1944 45 40 13
20 44 47 42
32 22 2033 28 25
33 1431 21 19
5355 59 37
2 17 385 30 47
21 31 26 2251 63 41 3351 61 37 2648 59 34 2250 63 42 3350 60 37 25
31 1845 58 34 21
16 41 46 40
288 24 52
6 17 29 432 9 19 34
3655 58 42 28 14
32 1821 31 26 22
15 48 48 42
3655 58 42 28 14
64 69 74 7980+
24 29 34 39 44 49 54 59
60 65 70 7540 45 50 55
Freq
uenc
y Age Groups
Year
Sour
ce
Prod
uct 20 25 30 35

17-Sep-2009 France 25
Table 4F (continued from p.23, continues on p.27) Prevalence of smoking, females
12 13 14 15 16 17 18 19 - - - - - - - - - - - - Allages
93 4 U R93 4 U A 2793 27 U R 2193 31 MC U 2893 34 UC R93 34 U A 2793 37 U * 1593 37 U A 2494 3 UC *94 3 U A 49 3194 27 U R 2194 29 MC U 2994 29 TC U 3194 29 A U 3194 30 MC U 3094 30 TC U 3194 30 A U 3194 31 MC U 2894 36 U R 13 2595 3 UC * 45 2595 3 U A 55 3595 3* U A95 4 U A 3095 15 UC R 2295 15 UC A 2395 15 A A 2495 27 U R 2195 30 MC U 3195 30 TC U 3195 30 A U 3195 31 MC U 2895 34 A R 2895 34 U A 3196 3 U * 49 2696 3 U A 56 3396 3* U A96 14 UC R 1596 14 UC A 1796 14 A A 1796 16 UC R 1796 16 UC A 1896 16 A A 1896 27 U R 1996 31 MC U 27
Freq
uenc
y Age Groups
Year
Sour
ce
Prod
uct 20 25 30 35 7540 45 50 55
59
60 65 70
7980+
24 29 34 39 44 49 5423
40 44 29 9 5
64 69 74
11 625 35 24 16
19 34 37 21
2340 44 29 9 5
1 13 24 315 23 36 41
268 26 45
9 543 44 27 11
17 36 35 24
46 46 27 1146 46 27 1142 45 27 1146 47 27 1146 47 27 11
26 33 25 16
3 23 409 31 57
5162 33 35 14 4
34 19 736 20 837 20 9
12 451 44 30 9
14 31 34 24
53 45 30 953 45 30 9
25 34 25 168
59 39 37 21 1052 35 33 19
2 18 403 29 49
3824 12 626 14 725 15 826 12 827 14 927 15 9
18 29 30 24 10 424 33 24 18

26 France 17-Sep-2009
Table 4M (continued from p.24, continues on p.28) Prevalence of smoking, males
12 13 14 15 16 17 18 19 - - - - - - - - - - - - Allages
97 3 UC * 37 49 2497 3 U A 42 54 2897 4 U A 4097 5 U R 3497 27 U R 3397 31 MC U 3297 34 U R97 34 U A98 4 UC R 3998 4 U A 4198 4* U A98 5 U R 3498 27 U R 3198 31 MC U 3298 36 A * 5 2098 36 A R 9 2899 4 U A 4499 4* U A 3999 5 U R 3499 30 U U 4399 31 MC U 3199 34 TC R 3199 34 U A 3799 38 UC * 9 18 30 31 39 * 3099 38 UC *99 38 UC A 18 32 41 44 51 54 4199 38 UC A00 4 U A 3900 4* U A 4100 5 U R 3300 27 U R 3100 39 UC * 42 46 5400 39 UC A 50 53 6001 4 U A 3301 4* U A 4101 5 U R 3201 39 UC * 4301 39 UC A 5302 5 U R02 27 U R 3202 30 MC R 3502 30 TC R 4002 30 A R 4302 30 MC U 3902 30 TC U 4502 30 A U 4702 33 U *02 33 U A02 35 U R02 35 U A 3802 36 A * 4 2002 36 A R 7 2602 39 UC * 40 43 51 4202 39 UC A 48 51 58 50
3245
3149 46 41 39 29 16
57 54 55 2957 53 48 2654 51 39 1752 48 47 2752 47 42 2451 46 33 16
26 11
3237 43 33 10
33 45 42 34
1443 55 59 44 45 25 14
36 40 46 23
2434 1325 39 40 38 26 12
34 46 4246 20 8
56 5644 58 54 52
34 39
26 17
14
30
41
22 1552 52 46 3343 45
4 18 40 4640 282 13 32 41
19 30 26 25
23 1253 54 44 2238 49 42 36
49 27 1532 55 47 50 41 20 1446 63 57 49
26 1520 31 26 23
20 34 41 38
3935 48 44 34 28 11
29 1218 47 53 47 30 1215 44 51 44
3 20 36 481 14 31 43
20 30 26 24
1526 38 46 38 28 15
32 48 43 3557 46 26
2618
3 20 3748
1 14 3264 69 74 79
80+24 29 34 39 44 49 54 59
60 65 70 7540 45 50 55
Freq
uenc
y Age Groups
Year
Sour
ce
Prod
uct 20 25 30 35

17-Sep-2009 France 27
Table 4F (continued from p.25, continues on p.29) Prevalence of smoking, females
12 13 14 15 16 17 18 19 - - - - - - - - - - - - Allages
97 3 UC * 39 39 2397 3 U A 45 48 3097 4 U A 3097 5 U R 2297 27 U R 2197 31 MC U 2797 34 U R97 34 U A98 4 UC R 2698 4 U A 2798 4* U A98 5 U R 2398 27 U R 2098 31 MC U 2698 36 A * 6 2598 36 A R 11 3199 4 U A 3399 4* U A 3299 5 U R 2299 30 U U 3499 31 MC U 2699 34 TC R 2599 34 U A 3099 38 UC * 9 21 33 37 41 * 3299 38 UC *99 38 UC A 22 38 48 48 52 57 4599 38 UC A00 4 U A 3400 4* U A 3400 5 U R 2100 27 U R 2100 39 UC * 4000 39 UC A 5101 4 U A 3201 4* U A 2901 5 U R 2101 39 UC * 4101 39 UC A 5202 5 U R02 27 U R 2102 30 MC R 3202 30 TC R 3402 30 A R 3402 30 MC U 3502 30 TC U 3702 30 A U 3702 33 U *02 33 U A02 35 U R02 35 U A 3102 36 A * 3 2002 36 A R 6 2702 39 UC * 39 43 55 4202 39 UC A 48 52 60 50
Freq
uenc
y Age Groups
Year
Sour
ce
Prod
uct 20 25 30 35 40 45 50 55 60 65 70 75
80+24 29 34 39 44 49 54 59
2 15 3364 69 74 79
116 21 41
5020
48 33 1511 4
26 28 36 23 9 427 38 31
24 34 26 171 15 33 39
39 285 21 41 47
10 824 46 40 28 11 1024 46
2829 36 34 19 12 6
10 523 32 29 17
20 30 32 24
41 52 52 43 22 12 641 46 48 43 25 15 8
11 552 47 37 1328 38 31 18
21 32 27 2033 222 21 33 39
4 32 43 49
33
47
11 743 43 39 2637 37
28
14 8
1125 15 7
52 4444 59 47 37
38
517 31 32 26 13 4
26 35 31
50 38 18
1119
21
1236 47 39 40 25 7 2
39
11 3
2131 32 20 4
29 36 32
46 43 39 1249 46 40 1249 46 40 1251 47 42 1354 50 43 1354 50 43 13
3344
2647 43 37 24 16 9

28 France 17-Sep-2009
Table 4M (continued from p. 26) Prevalence of smoking, males
Source: see Notes on sources of survey data, p. 53 Frequency: A = all smokers (including occasional) Product: MC = manufactured cigarettes R = regular or daily smokers TC = total cigarettes (including hand-rolled) U = unspecified UC = cigarettes (type unspecified) * = refer to Notes on sources of survey data, p. 53 A = all products All ages: relates to ages reported; as given in original source
12 13 14 15 16 17 18 19 - - - - - - - - - - - - Allages
03 5 U R03 38 UC * 1 4 7 11 21 29 3703 38 UC *03 38 UC A03 39 UC * 37 43 4003 39 UC A 45 49 4704 5 U R04 27 U R04 34 A R 2804 34 A A 3305 30 MC R 2305 30 TC R 3205 30 A R 3405 30 MC U 2605 30 TC U 3505 30 A U 3805 39 UC * 3405 39 UC A 4106 27 U R06 33 U *06 33 U A06 36 A * 3 1306 36 A R 5 1707 38 UC *07 38 UC A 29
302435
18
45 43 47 2145 41 42 1737 32 28 1243 39 39 1943 37 36 1535 28 22 10
30 18 107 43 46 40 35 21 123 36 39 35
31 46
2828
32
21 37
64 69 74 7980+
24 29 34 39 44 49 54 59
60 65 70 7540 45 50 55
Freq
uenc
y Age Groups
Year
Sour
ce
Prod
uct 20 25 30 35

17-Sep-2009 France 29
Table 4F (continued from p.27) Prevalence of smoking, females
Source: see Notes on sources of survey data, p. 53 Frequency: A = all smokers (including occasional) Product: MC = manufactured cigarettes R = regular or daily smokers TC = total cigarettes (including hand-rolled) U = unspecified UC = cigarettes (type unspecified) * = refer to Notes on sources of survey data, p. 53 A = all products All ages: relates to ages reported; as given in original source
12 13 14 15 16 17 18 19 - - - - - - - - - - - - Allages
03 5 U R03 38 UC * 0 2 6 14 24 31 3403 38 UC *03 38 UC A03 39 UC * 38 42 4003 39 UC A 47 49 4804 5 U R04 27 U R04 34 A R 2204 34 A A 2705 30 MC R 2005 30 TC R 2405 30 A R 2405 30 MC U 2405 30 TC U 2905 30 A U 2905 39 UC * 3205 39 UC A 4106 27 U R06 33 U *06 33 U A06 36 A * 2 1606 36 A R 5 2107 38 UC *07 38 UC A
Freq
uenc
y Age Groups
Year
Sour
ce
Prod
uct 20 25 30 35 40 45 50 55 60 65 70 75
80+24 29 34 39 44 49 54 59
22
25 34
64 69 74 79
36 45
1919
5 30 30 30 21 9 611 38 36 35 25 11 7
25 29 24 733 36 27 833 36 27 831 38 27 939 45 31 1039 45 31 10
31
212335
16

30 France 17-Sep-2009
Table 5M Number of cigarettes smoked per smoker per day, males: selected surveys by age (continues on p. 32)
12 13 14 15 16 17 18 19 - - - - - - - - - - - - Allages
53 1 UC56 26 A * 1560 1 MC E64 13 UC E*64 40 UC E65 1 MC E71 17 UC E* 6.5 7.8 10 12 1371 19 A E 15 16 1774 4 UC E76 18 UC77 3 MC E77 4 UC E78 12 TC 1778 20 A E79 4 UC E79 21 UC80 3 UC E80 6 UC81 3 UC E81 9 UC E81 22 UC82 4 UC E83 3 UC E83 4 UC E 1783 4* UC E83 23 UC84 3 UC E86 4 UC86 5 UC86 14 UC 1986 15 UC 1887 16 UC 2187 29 UC E 1588 3 UC E88 27 UC88 29 TC E 1589 4 UC E89 27 UC89 29 TC E 1890 3 UC E90 15 UC 1990 23 UC90 27 UC90 29 TC E 1591 3 UC E91 4 UC E91 6 A91 27 UC91 29 TC E 1614 18 17 12
9.91816
15
5.015
15 16 17 12
1421 19 16
1614
13 19 21 18
1215
12 18 14 15
13 19 17 11
19 20 1621 22 17
1720 18 18
166.1
1218
1612
14 18 18 17 14
1612
179.5
1816
9.612
1816 17 16 16 15 15 10
1815
9.39.9
1416
1314
1117 15 14
Estim
ated
Age Groups
Year
Sour
ce
Prod
uct 20 25 30 35 40 45 50
80+24 29 34 39 44 49 54
55 7560 65 70
59 64 69 74 79

17-Sep-2009 France 31
Table 5F Number of cigarettes smoked per smoker per day, females: selected surveys by age (continues on p. 33)
12 13 14 15 16 17 18 19 - - - - - - - - - - - - Allages
53 1 UC56 26 A *60 1 MC E64 13 UC E* 1064 40 UC E65 1 MC E71 17 UC E* 5.3 5.6 7.8 7.9 6.471 19 A E74 4 UC E76 18 UC77 3 MC E77 4 UC E78 12 TC 1178 20 A E79 4 UC E79 21 UC80 3 UC E80 6 UC81 3 UC E81 9 UC E81 22 UC82 4 UC E83 3 UC E83 4 UC E 1283 4* UC E83 23 UC84 3 UC E86 4 UC86 5 UC86 14 UC 1486 15 UC 1487 16 UC 1487 29 UC E 1288 3 UC E88 27 UC88 29 TC E 1489 4 UC E89 27 UC89 29 TC E 1290 3 UC E90 15 UC90 23 UC90 27 UC90 29 TC E 1491 3 UC E91 4 UC E91 6 A91 27 UC91 29 TC E 1414 14 13 17
8.01413
13
12
5.512
13 15 17 7.0
1412
11 15 13 7.3
1012
12 14 13 15
10 13 13 9.6
15 15 1217 16 8.1
9.817
1315 14 11
10 1112
7.6
9.111 11 14
1012
8.012
117.7
9.612
7.814
11 11 12 11 11 8 3
7.79.1
107.1
7.9 9.1 9.4 8.6
4.0
8.3
Estim
ated
Age Groups
Year
Sour
ce
Prod
uct 20 25 30 35 40
80+7560 65 70
24 29 34 39 44 49 54
5545 50
7959 64 69 74

32 France 17-Sep-2009
Table 5M (continued from p. 30) Number of cigarettes smoked per smoker per day, males
Source: see Notes on sources of survey data, p. 53 Estimated: E = mean estimated from percentage distribution Product: MC = manufactured cigarettes (see also Consumption category estimation, Methods TC = total cigarettes (including hand-rolled) p. 11, and Appendix III) UC = cigarettes (type unspecified) * = refer to Notes on sources of survey data, p. 53 A = all products All ages: relates to ages reported; as given in original source U = unspecified
12 13 14 15 16 17 18 19 - - - - - - - - - - - - Allages
92 3 UC E92 4 UC E92 27 UC92 29 TC E 1892 34 TC93 27 UC93 34 TC93 37 UC E*94 27 UC94 29 TC E 1894 30 TC E 1995 3 UC E95 3 UC 1195 4 UC95 15 UC 1795 27 UC95 30 TC E 1695 34 TC96 3* UC E96 14 UC 2196 16 UC 2196 27 UC97 3 UC E97 4 UC E97 5 UC E*97 27 UC98 4 UC E*98 4* UC E*98 5 UC E*98 27 UC 1498 36 UC 0.6 1.099 4* UC E99 5 UC E*99 34 TC99 34 TC E99 34 A99 38 UC 13 * 10 * 10 * 1099 38 UC E00 4 UC E00 5 UC E*00 27 UC00 39 UC 11 12 1301 4 UC E01 5 UC E*01 39 UC 1202 30 TC E 1602 39 UC 11 12 13 1103 38 UC E03 39 UC 11 12 1204 34 A 1405 30 MC E 1405 30 TC E 1405 39 UC 1106 33 UC E 12
11 14 15 17
15 1211 14 15 17
12 14 16 16
9.8 12
6.4 8.4
1316
14 16 18 16
1013
1614
5.2 8.6 13 16
141615
8.3
1313
169.6 13 15 16 9.9
7.315
1614
22 23 1614
1613
21 20 20
12 18 18 11
16 21 1416
9.16.0 10
17
17 19 23 15
1617 18 23 14
151515
15
14 19 21 14
1117
16
64 69 74 7980+
24 29 34 39 44 49 54 59
60 65 70 7540 45 50 55Es
timat
edAge Groups
Year
Sour
ce
Prod
uct 20 25 30 35

17-Sep-2009 France 33
Table 5F (continued from p. 31) Number of cigarettes smoked per smoker per day, females
Source: see Notes on sources of survey data, p. 53 Estimated: E = mean estimated from percentage distribution Product: MC = manufactured cigarettes (see also Consumption category estimation, Methods TC = total cigarettes (including hand-rolled) p. 11, and Appendix III) UC = cigarettes (type unspecified) * = refer to Notes on sources of survey data, p. 53 A = all products All ages: relates to ages reported; as given in original source U = unspecified
12 13 14 15 16 17 18 19 - - - - - - - - - - - - Allages
92 3 UC E92 4 UC E92 27 UC92 29 TC E 1392 34 TC93 27 UC93 34 TC93 37 UC E*94 27 UC94 29 TC E 1494 30 TC E 1495 3 UC E95 3 UC 1195 4 UC95 15 UC 1395 27 UC95 30 TC E 1495 34 TC96 3* UC E96 14 UC 1496 16 UC 1796 27 UC97 3 UC E97 4 UC E97 5 UC E*97 27 UC98 4 UC E*98 4* UC E*98 5 UC E*98 27 UC 1398 36 UC 0.4 1.499 4* UC E99 5 UC E*99 34 TC99 34 TC E99 34 A99 38 UC 6.4 * 8.1 * 9.5 * 9.299 38 UC E00 4 UC E00 5 UC E*00 27 UC00 39 UC 1001 4 UC E01 5 UC E*01 39 UC 1102 30 TC E 1502 39 UC 9.7 11 12 1003 38 UC E03 39 UC 10 11 1104 34 A 1105 30 MC E 1305 30 TC E 1305 39 UC 1006 33 UC E
Estim
ated
Age GroupsYe
ar
Sour
ce
Prod
uct 20 25 30 35 40 45 50 55 60 65 70 75
80+24 29 34 39 44 49 54 59
9.914
12
64 69 74 79
12 15 12 12111212
1213
14 14 16 8.214 14 18 8.2
7.86.2 9.2
1515 13 10
1312 14 16 17
1210
14 16 9.515 18 18
136.4
121412
1112
138.3 11 13 14 10
121313
7.63.4 8.0 11 14
8.311
1313
1313
13 14 14 21
12
9.9 9.5
3.4 8.3
12
12 1210 11 18 12
9.3 11 13
11
10 11 18

34 France 17-Sep-2009
Table 6M Number of cigarettes smoked per person per day, males: selected surveys by age; with percentage total sales (continues on p. 36)
%12 13 14 15 16 17 18 19 - - - - - - - - - - - - All
ages56 26 A* 12 ** 60 1 MC 114%M64 13 UC* ** 64 40 UC ** 65 1 MC 83%M71 17 UC* 1.4 2.5 4.7 6.0 ** 71 19 A 12 13 13 ** 76 18 UC ** 77 3 MC ** 78 12 TC 8.4 79%T78 20 A ** 79 21 UC ** 80 2 MC -- 80 3 UC ** 80 6 UC 68%T81 3 UC ** 81 9 UC 93%T81 22 UC ** 83 3 UC ** 83 4 UC* 95%T83 4* UC* 100%T83 23 UC ** 84 3 UC ** 86 4 UC 87%T86 5 UC 78%T86 14 UC 6.5 ** 86 15 UC 6.7 ** 87 16 UC 8.1 ** 87 29 UC* 6.6 82%T88 3 UC ** 88 27 UC 62%T88 29 TC* 6.3 87%T89 4 UC 94%T89 27 UC 62%T89 29 TC* 6.5 82%T90 3 UC ** 90 15 UC 5.9 ** 90 27 UC 70%T90 29 TC* 7.1 92%T91 3 UC ** 91 4 UC* 84%T91 6 UC* 72%T91 27 UC 72%T91 29 TC* 7.4 96%T92 3 UC ** 92 4 UC* 89%T92 27 UC 70%T92 29 TC* 7.6 97%T92 34 TC 70%T5.8
3.76.9
5.77.5 11 8.8 3.0
8.0 11 7.5 3.3
3.26.7
6.15.9
5.89.4 7.6 8.2 3.6
3.38.3 4.6 3.8
7.35.3
6.7 10 9.0 2.7
3.15.4
6.3 10 5.6 3.9
8.9 8.9 5.77.1 9.9 7.7 3.7
9.1 5.1 4.76.9 7.1 5.7
0.93.1
6.97.5
9.7 7.5 4.58.6
3.43.1
7.8 11
3.26.5
3.28.3
2.813
2.58.6
10 8.4 5.9 5.0
3.12.9
9.8 10
106.4
6.0
14
15 13 107.7
Age Groups
Year
Sour
ce
Prod
uct 20 25
24 29
7035 40 45 50 5530 60 65
34 39
7580+
7944 49 54 59 64 69 74
17-Sep-2009 France 35
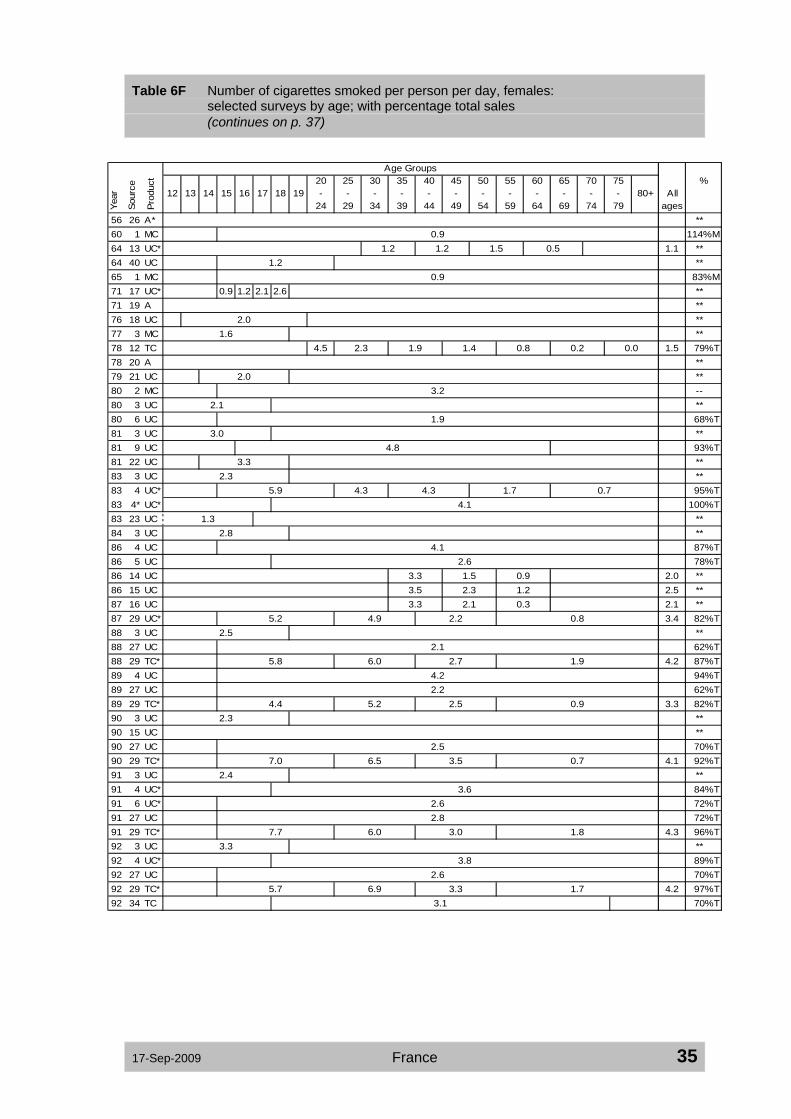
Table 6F Number of cigarettes smoked per person per day, females: selected surveys by age; with percentage total sales (continues on p. 37)
%12 13 14 15 16 17 18 19 - - - - - - - - - - - - All
ages56 26 A* ** 60 1 MC 114%M64 13 UC* 1.1 ** 64 40 UC ** 65 1 MC 83%M71 17 UC* 0.9 1.2 2.1 2.6 ** 71 19 A ** 76 18 UC ** 77 3 MC ** 78 12 TC 1.5 79%T78 20 A ** 79 21 UC ** 80 2 MC -- 80 3 UC ** 80 6 UC 68%T81 3 UC ** 81 9 UC 93%T81 22 UC ** 83 3 UC ** 83 4 UC* 95%T83 4* UC* 100%T83 23 UC ** 84 3 UC ** 86 4 UC 87%T86 5 UC 78%T86 14 UC 2.0 ** 86 15 UC 2.5 ** 87 16 UC 2.1 ** 87 29 UC* 3.4 82%T88 3 UC ** 88 27 UC 62%T88 29 TC* 4.2 87%T89 4 UC 94%T89 27 UC 62%T89 29 TC* 3.3 82%T90 3 UC ** 90 15 UC ** 90 27 UC 70%T90 29 TC* 4.1 92%T91 3 UC ** 91 4 UC* 84%T91 6 UC* 72%T91 27 UC 72%T91 29 TC* 4.3 96%T92 3 UC ** 92 4 UC* 89%T92 27 UC 70%T92 29 TC* 4.2 97%T92 34 TC 70%T
59 64 69 7434 39
7580+
7944 49 5429
7035 40 45 50 5530 60 65Age Groups
Year
Sour
ce
Prod
uct 20 25
24
0.91.2 1.2 1.5 0.5
1.20.9
2.01.6
0.8 0.2 0.0
2.0
4.5 2.3 1.9 1.4
3.22.1
1.93.0
4.83.3
2.35.9 4.3 4.3 1.7 0.7
4.11.3
2.84.1
2.63.3 1.5 0.93.5 2.3 1.23.3 2.1 0.3
5.2 4.9 2.2 0.82.5
2.15.8 6.0 2.7 1.9
4.22.2
4.4 5.2 2.5 0.92.3
2.57.0 6.5 3.5 0.7
2.43.6
2.62.8
7.7 6.0 3.0 1.83.3
3.82.6
5.7 6.9 3.3 1.73.1
36 France 17-Sep-2009
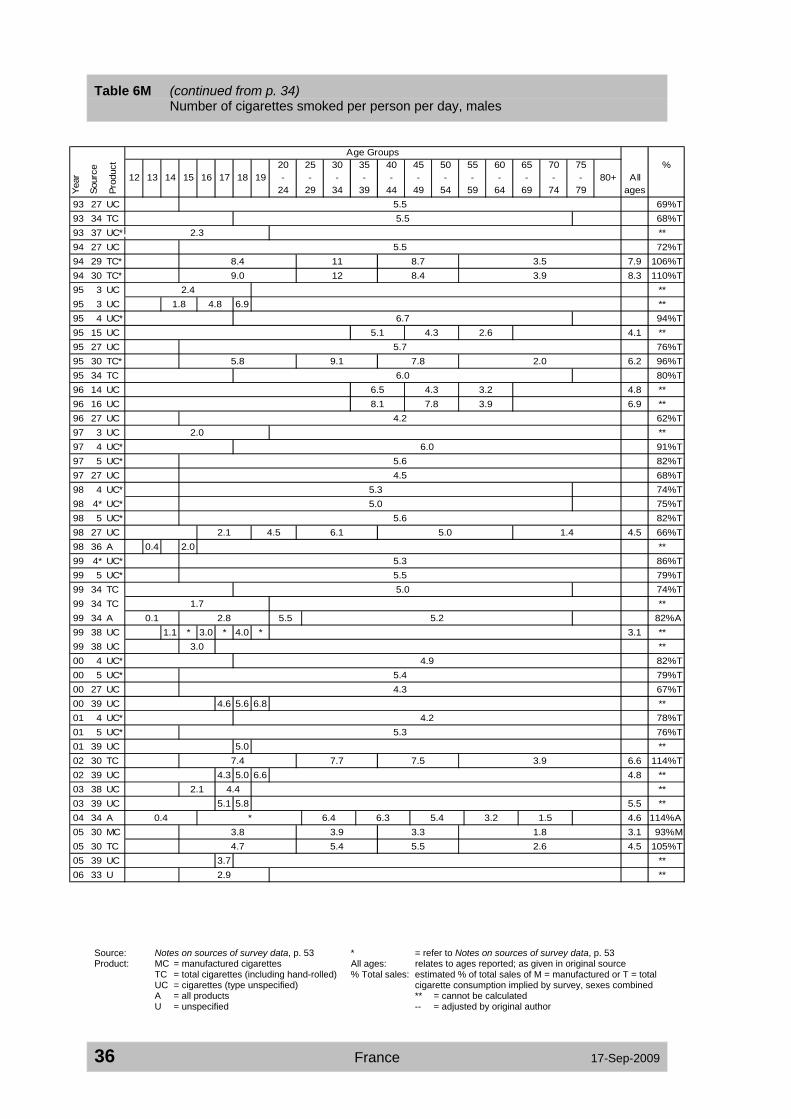
Table 6M (continued from p. 34) Number of cigarettes smoked per person per day, males
Source: Notes on sources of survey data, p. 53 * = refer to Notes on sources of survey data, p. 53 Product: MC = manufactured cigarettes All ages: relates to ages reported; as given in original source TC = total cigarettes (including hand-rolled) % Total sales: estimated % of total sales of M = manufactured or T = total UC = cigarettes (type unspecified) cigarette consumption implied by survey, sexes combined A = all products ** = cannot be calculated U = unspecified -- = adjusted by original author
%12 13 14 15 16 17 18 19 - - - - - - - - - - - - All
ages93 27 UC 69%T93 34 TC 68%T93 37 UC* ** 94 27 UC 72%T94 29 TC* 7.9 106%T94 30 TC* 8.3 110%T95 3 UC ** 95 3 UC 6.9 ** 95 4 UC* 94%T95 15 UC 4.1 ** 95 27 UC 76%T95 30 TC* 6.2 96%T95 34 TC 80%T96 14 UC 4.8 ** 96 16 UC 6.9 ** 96 27 UC 62%T97 3 UC ** 97 4 UC* 91%T97 5 UC* 82%T97 27 UC 68%T98 4 UC* 74%T98 4* UC* 75%T98 5 UC* 82%T98 27 UC 4.5 66%T98 36 A 0.4 2.0 ** 99 4* UC* 86%T99 5 UC* 79%T99 34 TC 74%T99 34 TC ** 99 34 A 82%A99 38 UC 1.1 * 3.0 * 4.0 * 3.1 ** 99 38 UC ** 00 4 UC* 82%T00 5 UC* 79%T00 27 UC 67%T00 39 UC 4.6 5.6 6.8 ** 01 4 UC* 78%T01 5 UC* 76%T01 39 UC 5.0 ** 02 30 TC 6.6 114%T02 39 UC 4.3 5.0 6.6 4.8 ** 03 38 UC ** 03 39 UC 5.1 5.8 5.5 ** 04 34 A 4.6 114%A05 30 MC 3.1 93%M05 30 TC 4.5 105%T05 39 UC 3.7 ** 06 33 U ** 2.9
4.7 5.4 5.5 2.6
1.53.8 3.9 3.3 1.8
6.4 6.3 5.4 3.2
2.1 4.4
0.4 *
4.25.3
7.4 7.7 7.5 3.9
3.04.9
5.44.3
0.1 2.8 5.5 5.2
5.35.55.0
1.7
5.35.0
5.62.1 4.5 6.1 5.0 1.4
2.06.0
5.64.5
8.1 7.8 3.94.2
6.06.5 4.3 3.2
5.8 9.1 7.8 2.0
5.1 4.3 2.65.7
2.41.8 4.8
6.7
9.0 12 8.4 3.9
2.35.5
8.4 11 8.7 3.5
795.55.5
59 64 69 74
7580+
24 29 34 39 44 49 54
55 60 65 7035 40 45 50Age Groups
Year
Sour
ce
Prod
uct 20 25 30

17-Sep-2009 France 37
Table 6F (continued from p. 35) Number of cigarettes smoked per person per day, females
Source: Notes on sources of survey data, p. 53 * = refer to Notes on sources of survey data, p. 53 Product: MC = manufactured cigarettes All ages: relates to ages reported; as given in original source TC = total cigarettes (including hand-rolled) % Total sales: estimated % of total sales of M = manufactured or T = total UC = cigarettes (type unspecified) cigarette consumption implied by survey, sexes combined A = all products ** = cannot be calculated U = unspecified -- = adjusted by original author
%12 13 14 15 16 17 18 19 - - - - - - - - - - - - All
ages93 27 UC 69%T93 34 TC 68%T93 37 UC* ** 94 27 UC 72%T94 29 TC* 4.2 106%T94 30 TC* 4.3 110%T95 3 UC ** 95 3 UC 6.0 ** 95 4 UC* 94%T95 15 UC 3.0 ** 95 27 UC 76%T95 30 TC* 4.4 96%T95 34 TC 80%T96 14 UC 2.1 ** 96 16 UC 2.7 ** 96 27 UC 62%T97 3 UC ** 97 4 UC* 91%T97 5 UC* 82%T97 27 UC 68%T98 4 UC* 74%T98 4* UC* 75%T98 5 UC* 82%T98 27 UC 2.8 66%T98 36 A 0.3 3.1 ** 99 4* UC* 86%T99 5 UC* 79%T99 34 TC 74%T99 34 TC ** 99 34 A 82%A99 38 UC 0.5 * 2.6 * 3.9 * 3.0 ** 99 38 UC ** 00 4 UC* 82%T00 5 UC* 79%T00 27 UC 67%T00 39 UC 4.0 ** 01 4 UC* 78%T01 5 UC* 76%T01 39 UC 4.3 ** 02 30 TC 5.0 114%T02 39 UC 3.8 4.6 6.6 4.3 ** 03 38 UC ** 03 39 UC 4.9 5.6 5.2 ** 04 34 A 2.9 114%A05 30 MC 2.6 93%M05 30 TC 3.1 105%T05 39 UC 3.3 ** 06 33 U **
Age Groups
Year
Sour
ce
Prod
uct 20 25 30 35 40 45 50 55 60 65 70 75
80+24 29 34 39 44 49 54 79
2.52.8
59 64 69 74
1.82.7
6.4 6.5 4.4 0.96.5 6.6 4.8 0.9
1.91.9 5.2
4.45.0 2.4 0.8
2.76.6 6.1 4.7 1.5
3.43.5 1.8 0.54.0 2.2 1.5
2.51.9
3.73.02.6
2.93.3
3.01.8 3.6 4.3 2.4 0.5
3.82.93.4
1.80.2 2.8 4.0 3.3
2.73.7
2.82.7
4.02.7
6.4 6.7 5.6 2.6
2.5 3.2
0.4 *
1.0
0.82.6 3.2 4.3 0.9
4.1 4.4 3.1 1.3
2.5
3.3 4.1 4.8

38 France 17-Sep-2009
Table 7M Number of cigarettes smoked per person per day, sales-adjusted, males: selected surveys1 by age; with percentage total sales (continues on p. 40)
%12 13 14 15 16 17 18 19 - - - - - - - - - - - - All
ages60 1 MC 114%M65 1 MC 83%M78 12 TC 11 79%T80 2 MC -- 80 6 UC 68%T81 9 UC 93%T83 4 UC* 95%T83 4* UC* 100%T86 4 UC 87%T86 5 UC 78%T87 29 UC* 8.0 82%T88 27 UC 62%T88 29 TC* 7.2 87%T89 4 UC 94%T89 27 UC 62%T89 29 TC* 7.9 82%T90 27 UC 70%T90 29 TC* 7.7 92%T91 4 UC* 84%T91 6 UC* 72%T91 27 UC 72%T91 29 TC* 7.7 96%T92 4 UC* 89%T92 27 UC 70%T92 29 TC* 7.8 97%T92 34 TC 70%T93 27 UC 69%T93 34 TC 68%T94 27 UC 72%T94 29 TC* 7.5 106%T94 30 TC* 7.5 110%T95 4 UC* 94%T95 27 UC 76%T95 30 TC* 6.5 96%T95 34 TC 80%T96 27 UC 62%T97 4 UC* 91%T97 5 UC* 82%T97 27 UC 68%T98 4 UC* 74%T98 4* UC* 75%T98 5 UC* 82%T98 27 UC 6.9 66%T99 4* UC* 86%T99 5 UC* 79%T99 34 TC 74%T99 34 A 82%A0.2 3.4 6.7 6.3
2.26.17.06.9
3.2 6.7 9.3 7.5
6.67.26.7
6.8
7.56.8
6.66.8
7.17.4
6.1 9.5 8.2 2.0
8.1 11 7.6 3.57.9 10 8.2 3.3
8.38.08.17.5
7.88.2
7.7 11 9.0 3.1
8.08.58.2
8.4 11 7.9 3.4
8.310 8.2 8.9 4.0
7.88.6
8.1 12 11 3.2
8.87.2 12 6.4 4.4
8.58.0
9.68.7 12 9.4 4.5
8.69.6
8.98.2 12 10 7.9 4.7
6.87.3
12 13 13 11 7.5 6.4 3.6
30 7035 40 45 50
69
Age Groups
Year
Sour
ce
Prod
uct 20 25 55 60 65 75
80+797424 29 34 5939 44 49 54 64

17-Sep-2009 France 39
Table 7F Number of cigarettes smoked per person per day, sales-adjusted, females: selected surveys1 by age; with percentage total sales (continues on p. 41)
%12 13 14 15 16 17 18 19 - - - - - - - - - - - - All
ages60 1 MC 114%M65 1 MC 83%M78 12 TC 1.9 79%T80 2 MC -- 80 6 UC 68%T81 9 UC 93%T83 4 UC* 95%T83 4* UC* 100%T86 4 UC 87%T86 5 UC 78%T87 29 UC* 4.2 82%T88 27 UC 62%T88 29 TC* 4.8 87%T89 4 UC 94%T89 27 UC 62%T89 29 TC* 4.0 82%T90 27 UC 70%T90 29 TC* 4.4 92%T91 4 UC* 84%T91 6 UC* 72%T91 27 UC 72%T91 29 TC* 4.5 96%T92 4 UC* 89%T92 27 UC 70%T92 29 TC* 4.4 97%T92 34 TC 70%T93 27 UC 69%T93 34 TC 68%T94 27 UC 72%T94 29 TC* 3.9 106%T94 30 TC* 3.9 110%T95 4 UC* 94%T95 27 UC 76%T95 30 TC* 4.6 96%T95 34 TC 80%T96 27 UC 62%T97 4 UC* 91%T97 5 UC* 82%T97 27 UC 68%T98 4 UC* 74%T98 4* UC* 75%T98 5 UC* 82%T98 27 UC 4.2 66%T99 4* UC* 86%T99 5 UC* 79%T99 34 TC 74%T99 34 A 82%A
29 34 593924 44
7580+
7949 54 64 69 74
35 40 45 50 7055 60 65Age Groups
Year
Sour
ce
Prod
uct 20 25 30
0.81.1
5.7 2.9 2.4 1.8 1.0 0.3 0.03.22.8
5.26.2 4.5 4.5 1.8 0.7
4.14.7
3.46.3 6.0 2.7 1.0
3.46.6 6.9 3.1 2.2
4.43.6
5.4 6.4 3.0 1.03.6
7.6 7.1 3.9 0.74.3
3.63.8
8.0 6.3 3.1 1.94.3
3.85.9 7.1 3.4 1.8
4.43.74.13.7
6.0 6.2 4.2 0.85.9 6.0 4.3 0.8
4.73.6
6.9 6.4 4.9 1.64.34.0
4.03.63.8
4.04.4
3.70.7
4.43.74.6
2.7 5.4 6.5 3.6
0.2 3.4 4.9 4.1

40 France 17-Sep-2009
Table 7M (continued from p. 38) Number of cigarettes smoked per person per day, sales-adjusted, males
1 Based on those surveys in Table 6 with data for both sexes and age range at least 21-64 (see Cigarette consumption per person, Methods p. 11)
Source: Notes on sources of survey data, p. 53 * = refer to Notes on sources of survey data, p. 53 Product: MC = manufactured cigarettes All ages: relates to ages reported; as given in original source TC = total cigarettes (including hand-rolled) % Total sales: Adjustment factor used, estimated % of total sales UC = cigarettes (type unspecified) of M = manufactured or T = total cigarette consumption A = all products implied by survey, sexes combined U = unspecified -- = adjusted by original author
%12 13 14 15 16 17 18 19 - - - - - - - - - - - - All
ages00 4 UC* 82%T00 5 UC* 79%T00 27 UC 67%T01 4 UC* 78%T01 5 UC* 76%T02 30 TC 5.7 114%T04 34 A 4.0 114%A05 30 MC 3.4 93%M05 30 TC 4.3 105%T5.2 2.4
0.4 * 5.6
4.5 5.14.0 4.2 3.6 1.9
5.5
5.46.9
6.5 6.8 6.6 3.44.7 2.8 1.3
6.06.96.4
64 69 74 7980+
24 29 34 39 44 49 54 59
60 65 70 7540 45 50 55Age Groups
Year
Sour
ce
Prod
uct 20 25 30 35

17-Sep-2009 France 41
Table 7F (continued from p. 39) Number of cigarettes smoked per person per day, sales-adjusted, females
1 Based on those surveys in Table 6 with data for both sexes and age range at least 21-64 (see Cigarette consumption per person, Methods p. 11)
Source: Notes on sources of survey data, p. 53 * = refer to Notes on sources of survey data, p. 53 Product: MC = manufactured cigarettes All ages: relates to ages reported; as given in original source TC = total cigarettes (including hand-rolled) % Total sales: Adjustment factor used, estimated % of total sales UC = cigarettes (type unspecified) of M = manufactured or T = total cigarette consumption A = all products implied by survey, sexes combined U = unspecified -- = adjusted by original author
%12 13 14 15 16 17 18 19 - - - - - - - - - - - - All
ages00 4 UC* 82%T00 5 UC* 79%T00 27 UC 67%T01 4 UC* 78%T01 5 UC* 76%T02 30 TC 4.4 114%T04 34 A 2.6 114%A05 30 MC 2.8 93%M05 30 TC 2.9 105%T
Age Groups
Year
Sour
ce
Prod
uct 20 25 30 35 40 45 50 55 60 65 70 75
80+24 29 34 39 44 49 54 59
0.7
4.53.54.0
64 69 74 79
1.03.8
5.23.6
5.6 5.8 4.9 2.32.7 1.2
4.5 1.0
0.3 * 3.6
3.2 3.92.8 3.4 4.6

42 France 17-Sep-2009
Table 8 Estimated1 prevalence of smoking and estimated1 number of cigarettes per person per day (unadjusted and sales-adjusted): summary of Tables 4, 6 and 7. Males and females aged 15 years and over
Year Source2 Product3
Totalsales cigarettes9
%person/day
M F M F M F M F M F M F
1953 1 A 70 151 A 76 30
1960 1 MC+U 57 11 73 26 7.7 0.9 114 6.8 0.88 U 49
1963 10 UC +A 57 15 64 15 ( 8.8 1.8 )
1965 1 MC+U 43 10 72 32 6.0 0.9 83 7.3 1.18 U 50
1967 1 MC 45 10 ( 7.8 1.4 )1 MC+U 62 26 70 27
1970 8 U 53
1974 4 U 58 28
1976 1 MC 45 20 ( 8.4 3.0 )1 MC+A 56 33 62 334 UC +U 56 30 60 27 ( 8.7 3.8 )
4* UC +U 52 27 56 28 ( 8.9 3.6 )8 U 47
11 UC 62 40 ( 8.2 4.2 )
1977 4 U 41 194 UC+U 47 30 52 28 ( 8.4 4.3 )8 U 51 29
1978 12 MC+TC+A 45 17 52 18 56 18 7.9 1.8 79 ( 8.8 2.6 ) 10.0 2.3
1979 1 MC 37 22 ( 7.9 3.8 )1 MC+A 42 29 50 304 U 53 23
4* UC +U 43 25 49 24 ( 8.6 3.9 )8 U 40
1980 2 MC 8.6 3.2 -- 8.6 3.26 UC+A 41 16 45 16 6.5 1.9 68 9.6 2.87 MC +U 45 28 52 28 ( 7.7 3.8 )8 U 46 16
1981 4 U 50 299 UC +A 46 33 51 33 7.5 3.8 93 8.1 4.1
1982 4 U 52 25
Manufactured
person/day
Total cigarettesnumber/ number/
Number/
Manufactured Total All Unadjusted7
person/day
Prevalence4 Number of cigarettes
Sales-adjusted8
cigarettes cigarettes5 products6

17-Sep-2009 France 43
Table 8 (continued)
Year Source2 Product3
Totalsales cigarettes9
%person/day
M F M F M F M F M F M F
1983 4 UC+U 51 29 8.4 3.3 95 8.8 3.54* UC+U 54 34 8.3 4.0 100 8.3 4.0
1985 4 U 50 25
1986 4 UC+U 39 23 46 30 6.9 4.1 87 8.0 4.75 UC 43 21 7.3 2.6 78 9.4 3.3
1987 8 U 43 2029 UC +A 45 26 49 26 7.1 3.0 82 8.7 3.7
1988 8 U 39 1927 UC+U 35 17 5.4 2.1 62 8.8 3.429 TC +A 43 29 47 29 6.6 3.9 87 7.6 4.5
29* TC +A 42 25 45 25 ( 8.2 3.9 )
1989 4 UC+U 45 30 49 33 7.3 4.2 94 7.8 4.427 UC+U 36 18 5.3 2.2 62 8.6 3.629 TC +A 39 25 43 26 7.1 3.0 82 8.6 3.7
29* TC +A 46 30 49 30 ( 8.1 4.1 )
1990 8 U 38 1927 UC+U 38 19 5.8 2.5 70 8.3 3.629 MC +TC +A 43 28 46 29 48 29 7.0 4.0 92 ( 7.7 3.9 ) 7.6 4.3
1991 4 UC+U 39 23 6.6 3.5 84 7.9 4.24 U 47 316 UC 38 19 6.1 2.6 72 8.5 3.6
27 UC+U 38 20 5.9 2.8 72 8.2 3.829 MC +TC +A 42 30 47 30 50 31 7.3 4.2 96 ( 7.4 4.2 ) 7.6 4.431 MC 38 28 ( 7.4 4.3 )
1992 4 UC+U 40 27 6.8 3.7 89 7.7 4.24 U 48 32
27 UC+U 36 20 5.7 2.6 70 8.2 3.829 MC +TC +A 39 31 42 32 47 32 7.5 4.1 97 ( 7.0 4.5 ) 7.7 4.331 MC 24 22 ( 6.7 4.7 )34 TC+UC+U 39 25 43 26 5.6 2.8 70 8.0 3.9
1993 4 U 36 244 U 36 22
27 UC+U 36 20 5.5 2.5 69 8.0 3.731 MC 24 22 ( 6.4 4.6 )34 TC+UC+U 35 21 40 24 5.4 2.5 68 7.9 3.7
number/ number/person/day
Manufactured Total person/day cigarettes
cigarettes cigarettes5 products6Number/
Prevalence4 Number of cigarettes
Manufactured Total All Unadjusted7 Sales-adjusted8

44 France 17-Sep-2009
Table 8 (continued/2)
Year Source2 Product3
Totalsales cigarettes9
%person/day
M F M F M F M F M F M F
1994 27 UC+U 34 20 5.5 2.7 72 7.5 3.729 MC +TC +A 39 29 43 30 47 30 7.8 4.1 106 ( 6.7 3.9 ) 7.4 3.930 MC +TC +A 40 29 43 30 47 30 8.2 4.2 110 ( 6.7 3.9 ) 7.4 3.831 MC 24 22 ( 6.2 4.4 )
1995 4 UC+U 39 27 6.4 3.9 94 6.8 4.227 UC+U 35 19 5.7 2.7 76 7.4 3.630 MC +TC +A 35 30 39 31 41 31 6.2 4.3 96 ( 6.1 4.2 ) 6.5 4.531 MC 24 22 ( 6.0 4.3 )34 TC+A 39 27 5.7 3.1 80 7.2 3.834 U 42 30
1996 27 UC+U 31 18 4.2 2.5 62 6.8 4.031 MC 24 23 ( 5.7 4.3 )
1997 4 UC+U 39 30 5.9 3.6 91 6.5 4.05 UC+U 34 22 5.6 3.0 82 6.8 3.6
27 UC+U 33 19 4.5 2.6 68 6.6 3.831 MC 25 22 ( 5.6 4.0 )
1998 4 UC+U 36 23 37 24 5.1 2.7 74 6.9 3.74* UC+U 37 25 4.8 3.1 75 6.5 4.15 UC+U 34 22 5.6 3.0 82 6.8 3.7
27 UC+U 31 19 4.5 2.5 66 6.8 3.831 MC 25 22 ( 5.6 4.1 )
1999 4 U 45 314* UC+U 39 31 5.3 3.8 86 6.1 4.45 UC+U 34 22 5.5 2.9 79 7.0 3.7
30 U 42 3431 MC 25 23 ( 5.6 4.1 )34 TC+U 32 23 37 28 4.8 3.0 74 6.5 4.134 A 4.8 3.1 82 5.8 3.7 /10
2000 4 UC+U 39 33 4.8 3.6 82 5.9 4.44* U 42 315 UC+U 33 21 5.4 2.8 79 6.9 3.5
27 UC+U 30 19 4.3 2.7 67 6.4 4.0
2001 4 UC+U 33 30 4.1 3.9 78 5.3 5.14* U 42 265 UC+U 32 21 5.3 2.7 76 6.9 3.6
number/ number/person/day
Manufactured Total person/day cigarettes
cigarettes cigarettes5 products6Number/
Prevalence4 Number of cigarettes
Manufactured Total All Unadjusted7 Sales-adjusted8

17-Sep-2009 France 45
Table 8 (continued/3)
1 Surveys covering an age range of at least 21-64 are included. Any gaps in the data for ages 15-20 and 65 years and over are filled
in by assumed extensions to the age distribution, given in Notes on sources of survey data, p. 53. Method: see Summary of adult smoking, Methods p. 13.
2 See Notes on sources of survey data, p. 53 3 Product: MC = manufactured cigarettes, TC = total cigarettes (including hand-rolled), UC = cigarettes (type unspecified), A = all
products, U = unspecified. Frequency of smoking is indicated by: regular or daily smokers in normal type, all smokers (including occasional) in bold, unspecified in italics
4 From Table 4 5 This column includes prevalence of smoking classified as UC = cigarettes (type unspecified) 6 This column includes prevalence of smoking classified as U = unspecified product 7 From Table 6 8 From Table 7, except data in parentheses, which are derived from the prevalence of smoking from Table 4 as described in Summary
of adult smoking, Methods p. 13 9 Number of cigarettes classified as UC = cigarettes (type unspecified) has been adjusted to total cigarette sales and included in this
column 10 All tobacco products, grams/person/day
Year Source2 Product3
Totalsales cigarettes9
%person/day
M F M F M F M F M F M F
2002 5 U 32 2127 U 32 2130 MC+TC+A 34 32 40 33 42 33 6.5 4.9 114 ( 5.3 3.9 ) 5.7 4.330 MC +TC +A 38 34 44 36 47 3635 U 30 2335 U 37 27
2003 5 U 32 22
2004 5 U 28 1927 U 28 1934 A 27 19 4.6 2.9 114 4.0 2.6 /10
34 A 32 24
2005 30 MC 22 19 3.1 2.6 93 3.3 2.830 TC+A 31 23 34 23 4.4 3.0 105 4.2 2.930 MC+TC+A 25 24 34 28 37 28
2006 27 U 30 21
number/ number/person/day
Manufactured Total person/day cigarettes
cigarettes cigarettes5 products6Number/
Prevalence4 Number of cigarettes
Manufactured Total All Unadjusted7 Sales-adjusted8

46 France 17-Sep-2009
Figure 3 Estimated prevalence of smoking of (i) manufactured cigarettes, (ii) total cigarettes and (iii) all tobacco products; by year of survey. Males and females aged 15 years and over
Percentage of SmokersTotal Cigarettes
0
10
20
30
40
50
60
70
80
90
100
1945 1950 1955 1960 1965 1970 1975 1980 1985 1990 1995 2000 2005 2010
Year
Per
cent
age
Male Female
Percentage of SmokersManufactured Cigarettes
0
10
20
30
40
50
60
70
80
90
100
1945 1950 1955 1960 1965 1970 1975 1980 1985 1990 1995 2000 2005 2010
Year
Perc
enta
ge
Male Female

17-Sep-2009 France 47
Figure 3 (continued)
Source: Table 8
Percentage of SmokersAll Tobacco Products
0
10
20
30
40
50
60
70
80
90
100
1945 1950 1955 1960 1965 1970 1975 1980 1985 1990 1995 2000 2005 2010
Year
Perc
enta
ge
Male Female

48 France 17-Sep-2009
Figure 4 Estimated number of (i) manufactured cigarettes and (ii) total cigarettes smoked per person per day, sales-adjusted; by year of survey. Males and females aged 15 years and over
Source: Table 8
Number of Cigarettes SmokedTotal Cigarettes (sales adjusted)
0
2
4
6
8
10
12
14
16
18
20
1945 1950 1955 1960 1965 1970 1975 1980 1985 1990 1995 2000 2005 2010
Year
Num
ber
/ per
son
/ day
Male Female
Number of Cigarettes SmokedManufactured Cigarettes (sales adjusted)
0
2
4
6
8
10
12
14
16
18
20
1945 1950 1955 1960 1965 1970 1975 1980 1985 1990 1995 2000 2005 2010
Year
Num
ber /
per
son
/ day
Male Female

17-Sep-2009 France 49
Notes
Notes on sources of sales data The data presented in the tables and figures were obtained from several sources, details of which are given below, together with estimations and related assumptions. Full citations of the sources are given on p. 65 under References. Acronyms used for organisations providing the data and French administrative regions are explained under Abbreviations and acronyms on p. 64.
Sales data before 1960
Société nationale d'exploitation industrielle des tabacs et allumettes (SEITA) (1961) In this period SEITA had the monopoly on tobacco manufacture and distribution in France (see notes on SEITA in Abbreviations and acronyms on p. 64).
Data (shown in Tables 1.1 and 1.2) are for all France (rather than continental France). Data are not available for 1914-1922 and 1925-1931. Cigarillos are included in the cigarette sales data until 1924.
Data for cigarettes, cigars and cigarillos were given as numbers of pieces (to the nearest million). They have been converted to tonnes using the factors 1 cigarette/cigarillo (1861-1924) or 1 cigarettes (1932-1959) = 1.2 g, 1 cigar = 4 g, and 1 cigarillo (when data are given separately) = 1.6 g. These factors are equivalent to those used in RP6 (Lee (1975)) which had been provided by SEITA.
Smoking tobacco is known as “scaferlatis”. The tobacco was used in hand-rolled cigarettes and in pipes. Chewing tobacco (“chique”) was available in the form of “rôles” or “carottes”.
For 1932 onwards there are some differences between the values shown and those in the previous edition of this report, which used data from RP6 (Lee (1975)). The data shown in RP6 were also based on reports from SEITA. The differences are possibly due to the conversion to imperial measures in RP6 and subsequent re-conversion to tonnes for the previous edition. We therefore now use the SEITA values directly.
Sales data for 1960-1989
SEITA, provided by Padioleau (1985, 1990) In this period SEITA had the monopoly on tobacco manufacture in France (see notes on SEITA in Abbreviations and acronyms on p. 64).
The data shown in table 1.3 are for continental France.
The values shown have been calculated as the sum of imports, ordinary sales in France and special sales to organisations such as the army and old people’s homes (“vente restreinte”). These special sales stopped in 1987 (Hill (1990)).
The values are from the same source as was used in Hill and Laplanche (2003) except that that report used data for all France rather than for continental France for 1960 and 1961.
In some years data are available from SEITA both for continental France and for all France, for example:
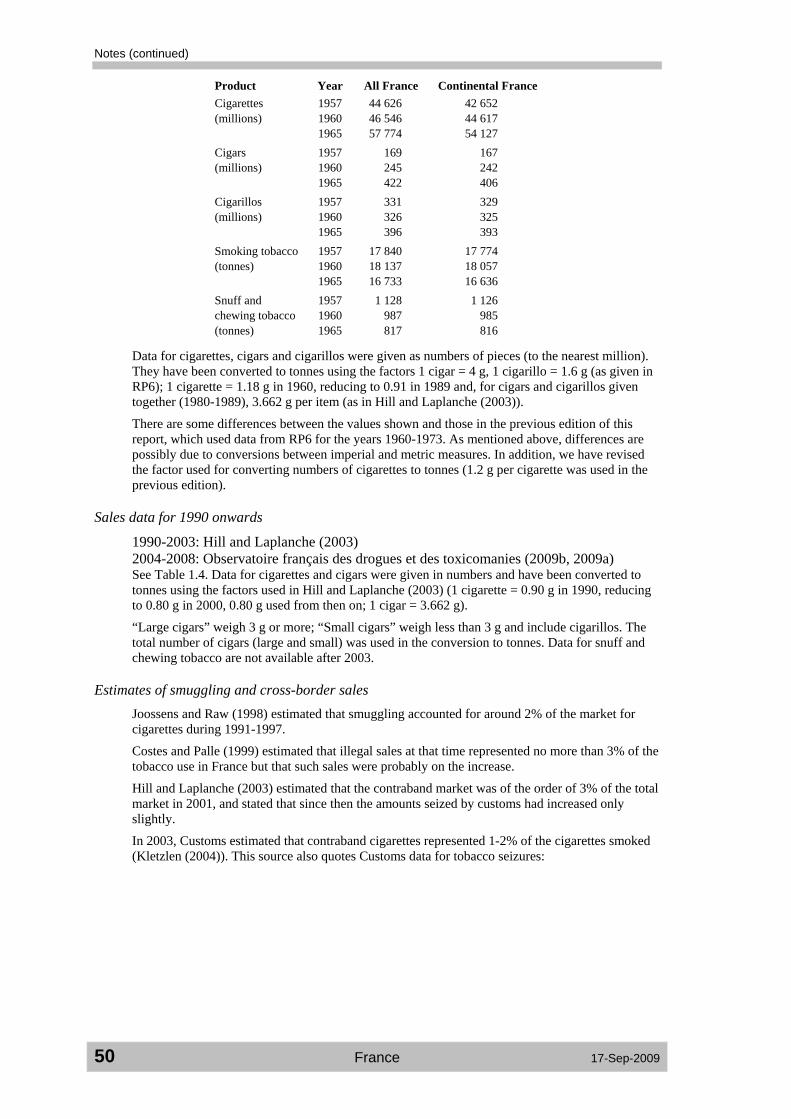
Notes (continued)
50 France 17-Sep-2009
Product Year All France Continental France Cigarettes 1957 44 626 42 652 (millions) 1960 46 546 44 617 1965 57 774 54 127 Cigars 1957 169 167 (millions) 1960 245 242 1965 422 406 Cigarillos 1957 331 329 (millions) 1960 326 325 1965 396 393 Smoking tobacco 1957 17 840 17 774 (tonnes) 1960 18 137 18 057 1965 16 733 16 636 Snuff and 1957 1 128 1 126 chewing tobacco 1960 987 985 (tonnes) 1965 817 816
Data for cigarettes, cigars and cigarillos were given as numbers of pieces (to the nearest million). They have been converted to tonnes using the factors 1 cigar = 4 g, 1 cigarillo = 1.6 g (as given in RP6); 1 cigarette = 1.18 g in 1960, reducing to 0.91 in 1989 and, for cigars and cigarillos given together (1980-1989), 3.662 g per item (as in Hill and Laplanche (2003)).
There are some differences between the values shown and those in the previous edition of this report, which used data from RP6 for the years 1960-1973. As mentioned above, differences are possibly due to conversions between imperial and metric measures. In addition, we have revised the factor used for converting numbers of cigarettes to tonnes (1.2 g per cigarette was used in the previous edition).
Sales data for 1990 onwards
1990-2003: Hill and Laplanche (2003) 2004-2008: Observatoire français des drogues et des toxicomanies (2009b, 2009a) See Table 1.4. Data for cigarettes and cigars were given in numbers and have been converted to tonnes using the factors used in Hill and Laplanche (2003) (1 cigarette = 0.90 g in 1990, reducing to 0.80 g in 2000, 0.80 g used from then on; 1 cigar = 3.662 g).
“Large cigars” weigh 3 g or more; “Small cigars” weigh less than 3 g and include cigarillos. The total number of cigars (large and small) was used in the conversion to tonnes. Data for snuff and chewing tobacco are not available after 2003.
Estimates of smuggling and cross-border sales Joossens and Raw (1998) estimated that smuggling accounted for around 2% of the market for cigarettes during 1991-1997.
Costes and Palle (1999) estimated that illegal sales at that time represented no more than 3% of the tobacco use in France but that such sales were probably on the increase.
Hill and Laplanche (2003) estimated that the contraband market was of the order of 3% of the total market in 2001, and stated that since then the amounts seized by customs had increased only slightly.
In 2003, Customs estimated that contraband cigarettes represented 1-2% of the cigarettes smoked (Kletzlen (2004)). This source also quotes Customs data for tobacco seizures:

Notes (continued)
17-Sep-2009 France 51
Year Tonnes of tobacco seized
1992 13 1993 60 1994 186 1995 117 1996 140 1997 181 1998 138 1999 194 2000 218 2001 215 2002 173
Ben Lakhdar (2005, 2006) estimated net cross-border sales into France (legal and illegal) using an analysis, by département, of changes in sales volumes:
Year Sales (tonnes)
Estimated net cross-border sales (tonnes)
Estimated consumption
(tonnes)
Estimated proportion of consumption that is
cross-border sales (%) 2004 54 924 8 635 63 559 13.6 2005 54 805 9 934 64 739 15.3
Note that the Sales (tonnes) values are from Ben Lakhdar (2006) and are different from those quoted in Table 1.4.
From a study in 2004 of 10 000 adults aged from 18 to 64 years old, British American Tobacco (BAT) estimated that, of the 26 billion fall in sales of cigarettes between 2002 and 2004, 10 billion were accounted for by increases in cross-border sales (Les Echos (2005)).
In a 2005 study by BAT of people’s cigarette packets, conducted in eight big towns in France, 22% of the packets were from outside France. The towns chosen were not all near borders with other countries. In Lille 31% of the cigarette packets examined were from outside France (Les Echos (2006), Le Bien Public (2007)).
According to Copé (2007), in 2006 seizures of smuggled smoking tobacco (for hand-rolling and pipes) reached a level never attained before. Customs services seized 75.2 tonnes of these goods, compared with 33.6 tonnes in 2005; an increase of 123.8%. No estimate was given of the total amount smuggled.
Ben Lakhdar (2008) used three methods of assessing cross-border sales and smuggling of tobacco into France. The first method (similar to that used in the 2006 report by the same author, mentioned above) was an analysis, by département, of changes in sales. This gave the estimates:
Year Manufactured cigarettes: estimated net cross-border sales and smuggled
tonnes proportion of total consumption (%) 2003 2 178 3.8 2004 8 635 16.4 2005 9 934 18.5 2006 9 930 18.2
The second method compared sales of cigarettes (manufactured and hand-rolled) with the amounts smoked as implied by Health Barometer survey of 2005. Survey results usually under-estimate true consumption, due to a tendency for survey subjects to understate their consumption, and so surveys generally imply a consumption that is lower than sales figures (see Percentage of total sales, Methods p.11). This was seen in the estimates for the year 1999. However, in 2005 implied consumption exceeded registered sales.
Year Difference between implied consumption and registered sales
tonnes proportion of registered sales (%) 1999 -11 185.34 -16 2005 13 109.63 +30
(See Tables 6 and 7 column “% Total sales” for source 34 for our estimates of implied consumption compared with registered sales.)

Notes (continued)
52 France 17-Sep-2009
The third method assessed the cigarette packs retrieved from household waste on two days in each of 2005 and 2006 in Nanterre in Haut de Seine. The data may therefore not be representative of the whole of France. In 2005 106 out of 570 packs (18.6%) were not bought in France. In 2006 the equivalent figures were 113 out of 731 packs (15.5%).
In 2008, customs officers seized about 40 tonnes of cigarettes, which represents an increase of 68% in comparison with 2007. A study for BAT by the Institute Epsy estimated that 14 % of the hand-rolling tobacco used in 2008 in France was bought abroad. (Les Echos (2009))
Estimates of numbers of hand-rolled cigarettes
For 1950-1989 we have taken as our estimate of hand-rolled cigarette consumption 70% of smoking tobacco (‘Scaferlatis’) sales. Data specifically for hand-rolling tobacco are available for 1990 onwards. Following Dymond (1996), we have assumed an average weight of 0.76 g per cigarette throughout. This is similar to the estimates of 0.722 g (range approximately 0.510-0.910 g) calculated in a study by SEITA, involving 200 consumers in 1992. This study also reported differences in the mean weight by age: 690 mg for smokers under 35; 870 mg for smokers over 50. A mean weight of 0.810 mg was reported from a Coresta study involving 40 consumers in 1994. The cigarettes were mainly made by simple hand-rolling, with <1% made by tubing and no data available on machine-rolling. (Coresta task force on roll-your-own (fine cut) tobacco (1999)).
‘Scaferlatis’ is fine-cut tobacco for hand-rolling and pipes. There is little evidence on which to base estimates of the proportion used for hand-rolled cigarettes. For 1990-2003, Hill and Laplanche (2003) give the quantities (tonnes) of smoking tobacco and hand-rolling tobacco separately. This shows the proportion of smoking tobacco used in hand rolled cigarettes increasing from 41% to 85% during that period. By contrast Merzdorf et al (1982) allocate all ‘Scaferlatis’ sales to hand-rolled cigarette smoking, ignoring pipes, which (survey source 1) were smoked by 16% of men in 1976.
Our estimate for 1978 gives hand-rolled cigarettes as 8% of total cigarette consumption, which can be compared with the smoking prevalences reported by Tuyns and Hu (1982) (survey source 12) in that year. Approximately 9% of cigarette smokers smoked hand-rolled cigarettes only and a further 8% smoked both (sexes combined).
Plain/Filter cigarette sales
1958-1989: SEITA, provided by Padioleau (1990). This included SEITA yearly “Statistiques” bulletins. Data for 1958-1969 were calculated from sales of imports (from the common market and other countries) and sales of SEITA products in France but excluded restricted sales (“vente restreinte”) as these were not split by filter and plain cigarette sales. Data for 1970-1989 were calculated by SEITA.
Data for 1958-1960 are for all France; those for 1961 onwards are for continental France. For some years both are available:
Year All France Continental France 1961 14.1 14.3 1962 16.8 17.0 1963 18.8 19.0 1964 21.4 21.5 1965 24.8 24.8
1988-1997: Centre de Documentation et Information sur le Tabac (1998) For years where data were also available from Padioleau (1990), the values were identical.
1998-2002: Hill and Laplanche (2003) This source also gives values for the years 1959-1997. They are virtually identical to those quoted by us.
2004: Observatoire français des drogues et des toxicomanies (2009a) 2005: Besson (2006)

Notes (continued)
17-Sep-2009 France 53
Dark/Blond cigarette sales
1978-2002: Hill and Laplanche (2003) quoting SEITA and Altadis 2004: Observatoire français des drogues et des toxicomanies (2009a) 2005: Besson (2006)
Tar and nicotine machine yields of cigarettes
1950-2002: Hill and Laplanche (2003) quoting CDIT Alternative estimates for sales-weighted average tar and nicotine (SWAT and SWAN respectively), based on the market share of the top 10 cigarette brands sold in France (data supplied by Centre de Documentation et d'Information sur le Tabac (1998)), are:
Year SWAT (mg/cig) SWAN (mg/cig) 1992 13.6 1.03 1993 13.5 1.04 1994 13.2 1.01 1995 12.7 0.97 1996 12.9 0.98 1997 12.3 0.95
The values for 1992-1995 above were shown in the tables of the previous edition of this report.
In the previous edition of this report, the values for years before 1992 were taken from Joossens (1989) and Todd (1986a). Those sources gave the values:
Year SWAT (mg/cig) 1950 30 1960 28 1971 24 1976 18 1986 17
The tar yield per cigarette was limited by EC directive (Directive 90/239/EEC) to 15 mg by the end of 1992, and to 12 mg by the end of 1997 (Harkin et al (1997)). From the start of 2004 cigarette yields were further limited by EU directive (Directive 2001/37/EC) to 10 mg tar, 1 mg nicotine and 10 mg carbon monoxide (ASPECT (Analysis of the Science and Policy for European Control of Tobacco) Consortium (2004)).
Notes on sources of survey data
Each source of survey data—either an individual survey or a series of surveys repeated over a number of years—is cited by a source number. This number is shown in the tables and corresponds to the source numbers given below, where details of the source publication and of the survey methodology are given. Full citations of the sources are given on p. 65 under References. Acronyms used for survey organisations and French administrative regions are explained under Abbreviations and acronyms on p. 64.
Source number
1 Merzdorf et al (1982), Hill and Flamant (1985), Hill (1990), Hill and Laplanche (2003) a. Surveys for SEITA.
Year Survey organisation Sample size 1953 ETMAR 3 573 1960 Sema-Sofres 24 427 1965 Sofres 13 710
1967/8 Sema-Sofres 12 940 1976 Sofres 6 000 1979 Unknown Unknown
b. Regular smokers: (1953) smoked at least 2 cigarettes/day or smoked tobacco bought in packets (Hill and Laplanche (2003)); (other years) undefined.

Notes (continued)
54 France 17-Sep-2009
c. According to Hill and Laplanche (2003), the prevalence of use of various tobacco products (%) among all smokers was:
Year Males Females Cigarettes Hand-
rolling Cigar-
illos Cigars Pipe Cigarettes Other
products 1953 77 38 21 100 0 1960 78 36 16 20 17 100 0 1965 80 27 12 14 14 100 0
d. In the previous edition of this report, the results for 1953 were assumed to relate to all adults (ages 15+). The source used in this edition clarifies that the age range for that year was 20+. This reduces the estimate of prevalence for all adults (Table 8) for that year because we assume that young people (aged 15-19) have a lower prevalence of smoking than older age groups (see note f below for details).
e. Consumption category estimation based on 1-5, 6-10, 11-15, 16-20 and 21+ cigarettes/smoker/day. f. Assumed extension to age distribution for percentage smokers (1953) age 15-19: males (regular) 50%, (all
smoking) 70%; females 15%.
2 Todd (1986a) a. Estimated by Todd.
3 Merzdorf et al (1982), Hill (1990), Sasco et al (1991, 1995), Grizeau et al (1997), Manninen (1997), Hill and Laplanche (2003)
a. Surveys of adolescents for CFES. Quota samples representative of the national population. Personal interviews.
Year Survey organisation Sample size Age group 1977 SOFRES 1 200 12-18 1980 BVA 1 200 12-17 1981 BVA 1 200 12-17 1983 Démoscopie 1 000 12-18 1984 Démoscopie 1 000 12-18 1988 MV2 conseil 987 12-18 1990 IPSOS 1 000 12-18 1991 IPSOS 1 000 12-18 1992 IPSOS 1 000 12-18 1994 MV2 conseil 1 005 12-18
1995 (Apr) IPSOS 1 006 12-18 1995 (Jun) IOD 600 15-25 1996 (Mar) Louis Harris 1 018 12-18 1996 (Jun) BVA 600 15-25
1997 BVA 4 115 12-19 When more than one survey was carried out in a single year (1995 and 1996), results for the
second survey of the year are marked with * against the source in Tables 4 and 5 There are minor discrepancies in the sample sizes reported by different sources. b. Regular smokers: undefined (1977). Smokers marked as frequency *: smoked at least one
cigarette/day (1980, 1981, 1988, 1990, 1994, 1995, 1997); smoked more than 6 cigarettes/week (1983, 1984); smoked every day (1991); smoked almost every day (1992, 1996). Note that cigarettes/smoker values relate to all smokers (not regular smokers) in 1991, 1992 and 1997.
c. According to Hill and Laplanche (2003), the prevalence of use of various tobacco products (%) among all smokers (1977-1984) or regular smokers (1988) was:
Year Males Females
Cigarettes Cigars
or pipe Cigarettes Cigars
or pipe 1977 95 5 99 1 1980 100 0 100 0 1981 100 0 100 0 1983 100 0 100 0 1984 100 0 100 0 1988 100 0 100 0
d. Consumption category estimation based on (1977, 1980) 1-5, 6-14, 15-20 and 21+ cigarettes/smoker/day; (1981, 1983, 1984, 1996) 1-5, 6-10, 11-14, 15-20 and 21+ cigarettes/smoker/day; (1988, 1990, 1995) 1-4, 5-10, 11-15, 16-20 and 21+ cigarettes/smoker/day; (1991, those smoking at least weekly) <5, 5-10, 11-15, 16-20 and 21+ cigarettes/smoker/day; (1992, all smokers) <5, 5-10, 11-15, 16-20 and 21+.

Notes (continued)
17-Sep-2009 France 55
4 Merzdorf et al (1982), Hill and Flamant (1985), Hill (1990), Todd (1986a, 1986b), Joossens et al (1994), Sasco et al (1994, 1995), World Health Organization (1997), Guilbert et al (1999), Hill and Laplanche (2003)
a. Surveys of adults for CFES. Quota samples representative of the national population. Personal interviews.
Year Survey organisation Sample size Age group 1974 SOFRES 1 000 18+
1976 (Sep) SOFRES 1 050 18+ 1976 (Dec) Unknown 1 052 18+
1977 SOFRES 1 010 18+ 1979 (Jan) SOFRES 1 021 18+ 1979 (Nov) SOFRES 1 006 18+
1981 SOFRES 1 019 18+ 1982 SOFRES 1 016 18-74
1983 (May) BVA 1 977 15+ 1983 (Dec) BVA 1 515 18+
1985 SOFRES 1 000 15+ 1986 BVA 2 000 15+ 1989 BVA 1 044 15+ 1991 Démoscopie 1 022 18+ 1992 IPSOS 1 000 18+ 1995 Démoscopie 1 000 18-75 1997 Louis Harris 1 005 18+
1998 (Aug) IFOP 2 006 15-75 1998 (Nov) IFOP 1 503 15-75 1999 (Jun) IPSOS 2 014 15+ 1999 (Oct) IPSOS 2 034 15+ 2000 (Oct) IPSOS 932 18+ 2000 (Dec) IPSOS 1 015 15+ 2001 (Apr) IPSOS 937 18+ 2001 (May) IPSOS 1 006 15+
When more than one survey was carried out in a single year, results for the second survey of the year are marked in the tables with * against the source.
There are minor discrepancies in the sample sizes reported by different sources. b. Regular smokers: smoked every day. All smokers: smoked, even if only from time to time. c. According to Hill and Laplanche (2003), the prevalence of use of cigarettes (%) among all
smokers was: Year Proportion of smokers using cigarettes
(manufactured or hand-rolled), % Males Females
1974 97 100 1977 92 100
1979 (Jan) 94 100 1979 (Nov) 91 99
1982 94 100 1983 (May) 96 99 1983 (Dec) 92 98
1989 98 100 According to Hill and Laplanche (2003), the prevalence of use of various tobacco products
(%, possible use of more than one product) among all smokers was: Product Males Females 1986 1991 1986 1991 Manufactured cigarettes 78 100 96 100 Hand-rolled cigarettes 12 4 2 2 Cigars 3 0 Cigarillos 4 1 Cigars or cigarillos 6 1 Pipe 3 3 0 0 Chewing tobacco 0 0

Notes (continued)
56 France 17-Sep-2009
d. 1983: results in Table 5 are consumption per regular cigarette smoker, calculated by Todd, using consumption category estimation based on 1-10, 11-20, 21+ cigarettes/smoker/day; calculation of age-specific consumption per person based on percentage smokers of any product and number of cigarettes per regular cigarette smoker. They may overestimate for men.
e. 1998, 2000, 2001: Cigarettes per smoker values relate to all smokers rather than regular smokers. f. 1992, 1995: Calculation of cigarettes per person based on prevalence of smoking (product unspecified) and number
of cigarettes per cigarette smoker, so may over-estimate. g. 1997, 1999 (Oct): Calculation of cigarettes per person based on prevalence of smoking (any frequency, any
product) and number of cigarette per regular cigarette smoker, so may over-estimate. h. 1998 (Aug and Nov): Calculation of cigarettes per person based on percentage smokers (any frequency, product
unspecified) and number of cigarettes per cigarette smoker (any frequency), so should be regarded with caution. i. Consumption category estimation based on (1974, 1976, 1977, 1979, 1981, 1982, 1983) 1-10, 11-20 and 21+
cigarettes/smoker/day; (1986, 1992, 1995) 1-5, 6-10, 11-15, 16-20 and 21+ cigarettes/smoker/day; (1989, 1991) 1-5, 6-15, 16-20 and 21+; (1997) 1-4, 5-9, 10-14, 15-19, 20 and 21+ cigarettes/smoker/day; (1998) <6, 6-9, 10-15, 16-20 and 21+ cigarettes/smoker/day; (1999) 1-5, 6-10, 11-20 and 21+; (2000, 2001) <6, 6-10, 11-20 and 21+.
j. Assumed extension to age distribution for percentage smokers: age 15-17, males (regular) (1977) 40%, (1991-1993) 35%; (cigarettes) (1976) 40%, (1977) 45%, (1979) 35%, (all/unspecified products) (1974) 40%, (1976-1977) 45%, (1979-1995) 40%, (1997) 30%, (2000) 40%, (2001) 30%; females (regular) 35%, (cigarettes) (1976) 35%, (1977) 40%, (1979) 35%, (all/unspecified products) (1974) 30%, (1976-2000) 40%, (2001) 30%. Age 65+ or 75+, males 10%, females 2%. Number of cigarettes/person/day, age 15-17, males (1974-1981) 2%, (1983-1995) 5%, (1997) 4%, (2000-2001) 3%; females 2%. Age 75+, males (1995) 3%, (1998) 2%; females 0.5%.
5 Hill and Laplanche (2003), Institut de recherche et documentation en économie de la santé (2009)
a. Conditions de vie des ménages (Household living conditions) surveys for INSEE. 1986-1987 (shown in Tables 4-6 as 1986): Etude de conditions de vie, 13 154 households
from which one person age 18+ selected. 1997-2004: Enquête permanente sur les conditions de vie des ménages, conducted annually
in May each year, 8 000 households, 11 000 subjects age 15+. b. Regular smokers: (1986) smoked at least one cigarette every day; (1997 onwards) smoked
every day. c. Consumption category estimation (1997-2001) based on two categories, 1-10 and 11+ cigarettes/smoker/day, and
resulting figures should be regarded with caution. d. Assumed extension to age distribution for percentage smokers, age 15-17: 35%. Number of cigarettes/person/day,
age 15-17: males 5%, females 2%.
6 Service des Statistiques des Etudes et des Systemes d'Information (SESI) (1983), Hill and Laplanche (2003)
a. Enquête décenniale (ten-yearly survey). Household surveys by INSEE for CREDOC, Ministère des Affaires Sociales, Ministère de la Santé, and INSERM. Usually face-to-face interviews with one member of household. Persons living in institutions excluded. The household member interviewed gave answers for each of the people in the household.
March 1980 - April 1981: Random sample of 7 323 households, 21 000 individuals, of which 16 220 were age 15+ and included in tobacco questions. Proxy responses for 24% of males, 57% of females.
1991-1992: 7 666 interviews representing 21 500 individuals age 14+. b. In tables 5-7, consumption shown as product code A (1991) refers to smoking of any
product, expressed as cigarette equivalents, calculated as 1 pipe or 1 cigarillo = 2 cigarettes, 1 cigar = 4 cigarettes and one packet of loose tobacco = 40 cigarettes.
c. According to Service des Statistiques des Etudes et des Systemes d'Information (SESI) (1983), in 1980 the prevalence of use of various tobacco products, among smokers, was:
Tobacco product Proportion of smokers using the product (%) Males Females
Cigarettes 93.6 99.5 Pipes 5.0 0.2 Cigarillos 3.9 0.9 Cigars 3.1 0.4
d. In Table 4 (1980), percentages of smokers adjusted to exclude non-respondents from base. e. Calculation of cigarettes per person (1991) based on prevalence of cigarette smoking among those aged 15+ and
number of cigarettes or cigarette equivalents per smoker aged 18+, so the resulting figures should be regarded with caution.
f. Assumed extension to age distribution for percentage smokers (1986-1987 and 1991-1992, cigarettes), age 15-17: males and females 35%.
7 SEITA a. Survey conducted by IFOP.

Notes (continued)
17-Sep-2009 France 57
8 Organisation for Economic Co-operation and Development (1993) a. No original source
9 Comité National contre le Tabagisme (1982) a. Survey by IDEM representative of working population. Sample size 1 001. b. There was one female smoker of only cigars/pipe. c. Consumption category estimation based on <5, 5-10 (assumed 6-10), 11-20, and 21+ cigarettes/smoker/day. d. Assumed extension to age distribution for percentage smokers, age 15: males 30%, females 15%. Number of
cigarettes/person/day: 1.0. For age 65+: males (cigarettes) 30%, (all products) 40%; females 7%. Number of cigarettes/person/day: males 4.0 and females 0.5.
10 Readers Digest (1963) a. Series of surveys conducted in European countries using identical questionnaires. French
survey conducted by SOFRES. Random sample of about 2 000 people. b. It is also reported that 11% of men (12% age <40 and 11% age 40+) smoke a pipe, and that
13% of men (13% age <40 and 12% age 40+) smoke cigars. c. Assumed extension to age distribution for percentage smokers, age 15-20: males (all products) 50%, (cigarettes)
45%; females 15%.
11 Wynder et al (1981) a. Subjects randomly selected in 65 départements, as they left factories, stores etc. Sample size
(males) 2 163, (females) 1 290. Response rate about 90%, a further 8% excluded owing to history of alcoholism or psychiatric conditions.
b. Smokers: included those who had given up smoking within the last year. c. Among cigarette smokers who listed a preferred brand, 86% of men and 49% of women
preferred black to blond tobacco. d. Assumed extension to age distribution for percentage smokers, age 15-19: males 50% and females 40%; age 81+:
males 40% and females 5%.
12 Tuyns and Hu (1982) and Dr A.J. Tuyns (personal communication) a. Département of Calvados. Tuyns and Hu (1982) stated that ‘Calvados can ... be considered
as an average French département with regard to tobacco consumption’. Sample size (males) 923, (females) 1 053. Response rate (males) 75%, (females) 78%.
b. There was only one female smoker of products other than cigarettes. c. Black tobacco brands were the type most commonly consumed by 68% of male cigarette
(including hand-rolled) smokers and 50% of female smokers. d. Assumed extension to age distribution for percentage smokers, age 15-19:(all products or total cigarettes) males
50% and females 45%; (manufactured cigarettes) males 45% and females 40%. Number of cigarettes/person/day: males 5.0 and females 4.0.
13 Fréour et al (1969) a. Study of chronic bronchitis conducted by INSERM in Bordeaux area in 1963-1967.
Representative of the regional population. Sample size (males) 1 320, (females) 1 170. b. The All ages data in Tables 4-6 are calculated from the prevalence of ever smokers of cigarettes and the proportions
of smokers of more than 1 000 cigarettes who had given up smoking, or smoked in specific categories. The age-specific data (females only) are based on the prevalence of ever smokers of cigarettes and the proportion of smokers of more than 1 000 cigarettes who had given up smoking for more than 10 years, and may therefore overestimate as they include some ex-smokers.
c. Consumption category estimation based on (males) 0-10, 10-20, 20-30, 30+ and (females) 1-10, 10-20, 20+ cigarettes/smoker/day. This has been interpreted as 1-9, 10-19, 20-29, 30+, but a different interpretation would have had considerable impact on the estimates.
14-16 Tolonen et al (2000), Kuulasmaa et al (1998), Wolf et al (1998), Molarius et al (1999) a. Surveys using interviews in three regions carried out in three phases, forming part of WHO
MONICA Project: Region Phase Participation
rate (%) Sample used*
Date
Males Females Males Females 14 Strasbourg 1 47 51 667 714 Jan 1985-Aug 1987 15 Toulouse 1 73 67 678 645 May 1985-Feb 1987 16 Lille 1 71 67 646 544 Jun 1986-Feb 1989 15 Toulouse 2 65 - 586 - Oct 1988-May 1991 14 Strasbourg 3 52 50 536 543 Mar 1995-Apr 1997 15 Toulouse 3 67 59 609 566 Dec 1994-Jul 1996 16 Lille 3 76 76 571 578 Jun 1995-Nov 1996
* Strasbourg ‘Sample used’ includes age 25-34; all other figures are for age 35-64 only

Notes (continued)
58 France 17-Sep-2009
b. All ages column relates only to age 35-64 and is standardized to world population. c. Regular cigarette smokers: smoked cigarettes daily. All smokers: smoked cigarettes daily or
occasionally, or smoked 1 g pipe tobacco or 1 cigar per week. d. For phase 1, there are minor discrepancies between the data shown in Table 4 and equivalent data taken from
World Health Organization (1989) used in earlier editions of this report.
17 Davidson et al (1973), Davidson and Choquet (1980) a. Studies of secondary pupils in Paris and Paris region, Rennes and département (Bretagne),
and Marseille and département (Bouches-du-Rhone) during 1971 and 1978-1979. Sample size (1971) 2 339, (1978-1979) 2 088. Studies covered all lycée students, and included some students up to age 20.
b. 1971 survey: prevalences averaged over the three regions. c. Regular smokers: smoked daily. d. Consumption category estimation based on <5, 5-9, 10-19, and 20+ cigarettes/smoker/day, excluding about 10% of
boys in each age group who smoked pipes, and 10-35% of boys and 35-45% of girls with amount smoked unknown.
18 Cooreman et al (1978, 1979, 1985) a. Survey in Bas-Rhin in spring 1976, covering all schoolchildren aged 13-19 in both public
and private schools. Anonymous questionnaire completed by the students in class. Sample size 29 138, response rate 93%.
b. Smokers marked as frequency *: smoked daily.
19 Lenoir et al (1973), Bernard and Boyer (1976) a. Results combined from a study in 1971 at selection centre (CS) before military service and a
study in 1972 at the end of military service (SM). Sample size Average age CS 47 942 19 SM 27 899 21
In the CS study, 1% smoked only pipe or cigars (no equivalent data for SM study). b. Numbers of cigarettes include equivalents of 1 pipe or cigarillo = 2 cigarettes and 1 cigar =
5 cigarettes. c. Results presented for individual ages 20-24 have been averaged. d. Consumption category estimation based on <10, 10-20, and 21+ cigarettes/smoker/day.
20 Bernard et al (1980) a. Part of a study on an anti-smoking campaign during military service. b. Numbers of cigarettes include equivalents of 1 pipe or cigarillo = 2 cigarettes and 1 cigar =
5 cigarettes. c. Consumption category estimation based on <10, 10-20, and 21+ cigarettes/smoker/day.
21 Perdrizet et al (1982), Cooreman et al (1985) quoting Cooreman et al (1982a) a. Survey in 1979 of all public secondary schools in Bas-Rhin. Sample size 7 963, response
rate 87%. Classes from “Seconde” to “Terminale” were surveyed so the students are mainly aged 15-18 years, but some students were older or younger than this. Same method and questionnaire as was used in source 18.
b. Smokers marked as frequency *: smoked daily. c. Data on cigarettes smoked per day are not given by sex, but for the sexes combined:
Cigarettes smoked per day
Proportion of the daily smokers (%)
<5 15 5-9 31
10-14 21 15+ 18
22 Cooreman et al (1985), quoting Cooreman et al (1982b) a. Survey in Bordeaux. Sample size 15 247. Age group 13/14 – 19 years. Same method and
questionnaire as was used in source 18.
23 Oriol et al (1988, 1994) a. Studies conducted in département Yvelines (Ile-de-France). Sample drawn from all types of
school (except an international school). Self-completed anonymous questionnaire, distributed by a medical researcher, completed during lesson time generally with a teacher present. Sample size (1983) 2 776, (1990) 1 916. Response rate (1983) 92%.

Notes (continued)
17-Sep-2009 France 59
b. Age range 11-16 years. Results for 11-year-olds are included in the lowest age group for prevalence in 1983 (Table 4) and in the All ages prevalence results for both years, but are not included in the age-specific prevalence results for 1990. Results for 11-year-olds are also included in the lowest age group for cigarettes per smoker and per person in 1983 and 1990.
c. Smokers marked as frequency *: smoked at least 1 cigarette per day on average. Consumption levels based on numbers smoked per week.
24 Neukirch et al (1982) a. Survey of all pupils at a secondary school in Paris. Upper age not stated, results for pupils
under age 12 not presented here. Sample size 2 266. b. Smokers: smoked at least 1 cigarette per day.
25 Chicou (1978) quoting SOFRES a. Survey by SOFRES for ONSER and CNCT. Lower age limit not stated. b. Results were erroneously shown as year 1977 in the previous edition of this report.
26 Schwartz et al (1961) a. Patients hospitalized due to work or traffic accident in Paris or large provincial cities
(control group in a study of cancer). Study started in 1954, but end year not stated. Age range not stated. Sample size 1 807.
b. Smokers: smoked an average of 1 cigarette or 1 g of pipe tobacco a day during the 10 years before interview.
c. The amount smoked shown in Tables 5-6 relates to all smokers and includes equivalents of 1 g pipe tobacco = 1 cigarette. The amount smoked per smoker was 14.5 cigarettes for cigarette only smokers, 13.6 cigarettes or 21.3 cigarette equivalents for smokers of cigarette and pipe, and 16.3 cigarette equivalents for pipe only smokers.
27 Bocagnano et al (1999a, 1999b), Auvray et al (2003), Hill and Laplanche (2003), Allonier et al (2006, 2008)
a. ESPS (Enquête sur la santé et la protection sociale) by IRDES (formerly CREDES). Survey of households in which at least one member has health insurance. This includes 85-95% of households in metropolitan France. Partly conducted by telephone (with some additional questionnaires sent by post), partly face to face (for those who could not be contacted by telephone). Results weighted to be representative of all insured households or to be representative of all households (2002 only).
b. Survey details: Year Sample size Response rate (%) 1988 7 783 1989 9 000 1990 8 485 1991 8 697 1992 9 462 1993 11 521 72 1994 9 934 69 1995 9 962 69 1996 12 203 66 1997 11 425 1998 23 035 66 2000 20 045 2002 20 834 65 2004 12 939 70 2006 12 428 63
c. Regular smokers: smoked habitually (“de façon habituelle”). d. Assumed extension to age distribution for percentage smokers, age 15: (2002) males 20%, females 15%; (2006)
males 10%, females 15%. Number of cigarettes/person/day, age 15: males 2%, females 1%.
28 Treguer et al (1983) a. Two studies conducted at the Nancy selection centre before military service, in June and
December 1979. Results presented here are average. Age limits are approximate, average age 19.5. Sample size 2 067, response rate 93%.

Notes (continued)
60 France 17-Sep-2009
29, 30 Rabier et al (1989), Reif and Melich (1990, 1991a, 1991b, 1992, 1995, 1998a, 1998b, 2000), Reif and Marlier (1998), Christensen (2004), Melich (2006), Papacostas (2008)
a. Eurobarometer Surveys commissioned by the European Commission to monitor public opinion in the European Union. Some Eurobarometer surveys include questions on smoking habits. Sample size about 1 000.
b. For surveys before 1994 the sample consisted of people aged 15 and over who were resident in the country and had the country’s nationality (source 29). For surveys after 1994 the sample consisted of people aged 15 and over who were resident in the country and had the nationality of any of the member states (source 30). For 1994 itself (Eurobarometer survey 41.0) results were available according to both sample definitions and both are presented.
c. Two waves of the survey were carried out in each of 1988 and 1989. Prevalence data from both waves are presented in Table 4 but data on cigarettes per smoker and per person are available only from the first. Results for the second survey of the year are marked with * against the source.
d. Frequency U represents positive answers to questions such as “Do you smoke cigarettes?” or “You smoke packeted cigarettes”. From 2002 an additional question made it possible to identify regular smokers also.
e. In 2006, the prevalence of smoking (age 15+, sexes combined, sex-specific data not yet available) was 26% for packeted cigarettes, 8% for hand-rolled cigarettes and 2% for cigars or pipe. 89% of smokers smoked regularly. (Special Eurobarometer 272c, European Commission (2007))
f. Consumption category estimation based on <5, 5-9, 10-14, 15-19, 20-24, 25-29, 30-34, 35-39 and 40+ cigarettes/smoker/day.
g. Before 2002 the calculation of cigarettes per person was based on prevalence of smoking (daily and non-daily) and number of cigarettes per daily smoker, so may overestimate.
31 Tobacco industry, CDIT a. Assumed extension to age distribution for percentage smokers, age 15-17: males and females 20%. b. For prevalence of smoking in males (Table 4) the values for All ages appear to be incompatible with the age-
specific values, from which the values in Table 8 were calculated.
32 van Reek et al (1992), van Reek and Adriaanse (1995) a. A series of surveys of Young Europeans. About 800 children aged 11-15 years interviewed
in each EC country except Luxembourg (where only 250 interviewed). Lowest age group 11-12. Interviews conducted at home, with parents absent.
b. Smokers marked as frequency *: smoked daily. Regular smokers: smoked at least once a week.
33 Karsenty and Díaz-Gómez (2003), Karsenty et al (2007) a. La lutte contre le tabagisme en milieu scolaire (Fight against smoking in schools). Surveys
by OFDT, MILDT and le Ministère de l’Éducation nationale. Representative sample of Lycées (secondary schools). Self-completed questionnaire.
b. Sample size (2002) 3 590, (2006) 9 476. Table 4 shows approximate ages corresponding to collège and lycée classes 6th, 5th, 4th, 3rd, 2nd and 1st.
c. Smokers marked as frequency *: smoked at least one cigarette/day.
34 Arènes et al (1996), Baudier and Arènes (1997), Dressen et al (2001), Guilbert et al (2001), Hill and Laplanche (2003), Beck et al (2007)
a. Baromètre Santé (Health Barometer), a random sample telephone survey for CFES and INSERM, in cooperation with CNAMTS, Ministère du travail et des affaires sociales, le Haut-Comité de santé publique and MILDT. Includes Baromètre santé adultes (surveys of adults), Baromètre santé jeunes (surveys of young people aged 12-19 years) and surveys that include both adults and young people.
Year Study type Sample size Survey dates 1992 Adults 2 099 Nov 1992 1993 Adults 1 950 Nov-Dec 1993 1995 Adults 1 993 Nov-Dec 1995 1997 Young people 4 115 Nov-Dec 1997 1999 Adults and young people 13 685 Oct-Dec 1999 2004 Adults and young people 30 514 Oct 2004-Feb 2005
b. The questionnaire uses the same questions on smoking as the CFES quota samples (sources 3 and 4). For the adult surveys, a random sample of households is selected. One person aged 18 or older is randomly selected from each household.

Notes (continued)
17-Sep-2009 France 61
c. From 1999 survey results were weighted to correct for non-responses and household size. In 2004 the survey method was amended to include households on the “liste rouge” (ex-directory, unlisted) and those with no telephone land line but with a mobile phone (14% of households).
d. Smokers marked as frequency *: smoked daily. Regular smokers: (1992) smoked every day; (1993, 1997, 1999, 2004) smoked at least one cigarette a day; (1995) smoked at least one cigarette a day or tobacco in packets. Smokers: smoked, even if only occasionally.
e. In Tables 5-7, consumption shown as product code A refers to smoking of all products expressed as cigarette equivalents at a rate of 1 pipe = 5 cigarettes; 1 cigar or cigarillo = 2 cigarettes. In 2004, cigarettes per smoker (Table 5) relate to all smokers rather than regular smokers.
f. For 1999 Hill and Laplanche (2003) gives smoking prevalence for ages 18 and 19 separately:
Product, frequency Prevalence of smoking (%) Male Female age 18 age 19 age 18 age 19 Cigarettes, daily 39 44 38 41 All products, daily or occasionally 43 48 45 54
g. In 1999 (according to Guilbert et al (2001)) pipe or cigar/cigarillo smoking was very rare among those aged 12-25 years (2.9% and 0.5% respectively). Among those aged 26-75, 4.9% smoked cigars/cigarillos and 1.2% smoked a pipe. Hand-rolled cigarettes were smoked by 5.8% of all subjects (ages 12-75 years, sexes combined). This proportion varied by age as follows:
Age group (years)
Prevalence of smoking hand-rolled cigarettes (%)
12-14 0.7 15-19 10.8 20-25 11.1 26-34 7.9 35-44 6.3 45-54 4.2 55-64 2.6 65-75 1.8
In 1999, product use among smokers (according to Hill and Laplanche (2003)) was: Tobacco product Proportion of smokers using the product (%)
Ages 12-19 Ages 18-75
Males Females Males Females Manufactured cigarettes 97 99 84 97 Hand rolling tobacco 33 17 23 9 Cigars/cigarillos 10 0 23 3 Pipes 0 0 6 0
In 1999 and 2004 (according to Beck et al (2007)), tobacco products were used by the following percentages of adult smokers:
Tobacco product Proportion of smokers using the product (%) 1999 2004
Manufactured cigarettes 90.6 87.8 Hand rolling tobacco 17.4 22.7 Cigars/cigarillos 13.3 13.9 Pipes 3.2 2.5 Chewing tobacco - 0.2
h. In 1999, calculation of cigarettes per person based on prevalence of cigarette smoking (manufactured and hand-rolled) and cigarette equivalents (any product) per smoker per day and should be regarded with caution.
i. Consumption category estimation (adolescents, 1999) based on 1-5, 6-10, 11-15, 16-20 and 21+ cigarettes/smoker/day.
j. Assumed extension to age distribution for percentage smokers, age 15-17: (cigarettes, regular) males 35%, females 20%, (unspecified product) (1992, 1993) males 40%, females 30%, (1995) males and females 40%. For age 75+: (1992) males 20%, females 2%; (1993-1999) males 10%, females 2%; (2004) males 5%, females 2%. Number of cigarettes/person/day, age 15-17: males (1992-1993) 5%, (1995) 4%, (1999) 3%; females 2.0. For age 76+: males (1992-1995) 3.0, (1999) 2%, (2004) 1%; females 0.5%.

Notes (continued)
62 France 17-Sep-2009
35 Beck et al (2003) a. Enquête sur les représentations, opinions et perceptions sur les psychotropes (EROPP) 2002:
a telephone survey of opinions on drugs carried out by SOFRES. Quota sample, age range 15-75. Sample size 2 009.
b. Although reported as EROPP 2002, the survey was carried out during November and December 2001.
c. Assumed extension to age distribution for percentage smokers, age 75+: males 10%, females 2%.
36 King and Coles (1992), King et al (1996), Currie et al (2000, 2004, 2008) a. Part of the HBSC (Health Behaviour in School-Aged Children) Study, a collaborative cross-
national research study organised by the WHO. In 1994 and 1998, conducted in Nancy-Metz in Lorraine and Toulouse in Midi-Pyrénées. National survey for later years. School classes or schools were randomly selected, targeting age groups 11 (not presented here), 13 and 15. Questionnaires self-completed in class.
Year Target age Mean age Sample size 1994 13 13.5 1 283
15 15.5 1 260
1998 13 13.6 1 421 15 15.6 1 245
2002 13 13.1 2 900 15 15.1 2 614
2006 13 13.6 2 426 15 15.6 2 222
b. Regular smokers: smoked once a week or more. Smokers marked as frequency *: smoked daily.
c. Number of cigarettes per smoker per day (Table 5, 1998 only) is derived from the median number smoked per week.
37 Choquet and Ledoux (1994) a. Santé de l’adolescent (National Adolescent Health Survey) by INSERM in 1993.
Representative national sample of those attending public secondary school aged 11-19. Self-completed questionnaire. Sample size 12 391, participation rate approximately 92%.
b. Considered comparable with the ESPAD surveys (source 38) (Choquet et al (2004)). c. Smokers marked as frequency *: smoked daily. d. Lowest age group includes 11 year olds. e. Consumption category estimation based on 2 categories, 1-9 and 10+ cigarettes/smoker/day, and the resulting
figures should be regarded with caution.
38 Hibell et al (2000, 2004), Choquet et al (2000, 2002, 2004), Andersson et al (2007), Legleye et al (2009)
a. ESPAD surveys (European School Survey Project on Alcohol and Other Drugs) carried out every 4 years. Conducted in France since 1999 under the “Santé de l’adolescent” programme by INSERM, OFDT and the Minister for Education. Anonymous questionnaire completed by the pupil, in class. A doctor or nurse was present, but discouraged from walking round the classroom.
Year Sample size Response rate (%) Age 12-19 Age 15-16
1999 11 870 2 284 84 2003 16 833 2 119 78 2007 2 807 >90
b. France was not involved in the 1995 survey, but the INSERM survey of 1993 (source 37) is considered comparable with the ESPAD surveys (Choquet et al (2004)). Although the international ESPAD surveys consider pupils aged 15-16 at the time of the survey (and, for some countries, pupils aged 17-18), the surveys carried out in France included a wider age range: students aged 12-19 years. Results are presented for ages 15-16 and 17-18 (for comparison with other countries) and also for the wider age range where available.
c. A large proportion of young people in France stay in education (e.g. in 2003: 98% at ages 13-15, 92% at age 16, 82% at age 17 and 75% at age 18) so the survey can be considered representative of young people in France, especially in the younger age groups. However,

Notes (continued)
17-Sep-2009 France 63
students who are often absent are under-represented and these students have a higher prevalence of smoking than other students (Choquet et al (2004)).
d. Smokers marked as frequency *: smoked 1 or more cigarettes per day in the last 30 days. All smokers: smoked in the last 30 days.
e. The All ages values refer to ages 14-19; age-specific data are not available for the age groups marked *.
f. Consumption category estimation based on 1-5, 6-10, 11-20, 21+ cigarettes/smoker/day.
39 Beck et al (2000, 2002, 2004, 2005, 2006), Beck and Legleye (2003), Legleye et al (2007) a. ESCAPAD surveys (Enquête sur la Santé et les Comportements lors de l’Appel de
Préparation À la Défense – inquiry into health and behaviours during the call to preparation for defence). Since the end of national service in 1996, each young person with French nationality (including those resident in the DOM) has been obliged to attend a “journée d'appel de préparation à la défense” (JAPD – day of preparation for defence). The certificate issued at the end of the day is required in order to sit public exams or to apply for a driving licence. Completing this survey is included as one of the activities of the day. Thus, unlike most surveys of young people, this survey includes those who are not in education. Young people with severe illness or handicap are not required to attend (approximately 1-2%). Non-nationals are not included (approximately 4% of the population in this age group). Self-completed questionnaire.
b. Survey details: Year Sample
size Response rate (%)*
Regions reported Age group reported (yrs)
2000 13 957 96 Metropolitan France 17-19 2001 12 512 97 Metropolitan France† 18 2002 16 552 97 Metropolitan France† 17-19 2003 15 069 98 Metropolitan France†‡ 17-18 2005 29 393 92 Metropolitan France 17
* Response among those attending the day. † Prevalence of smoking in the DOM reported separately – see note c below. ‡ Prevalence of smoking in the TOM reported separately – see note c below. c. Results quoted in the main tables are for metropolitan France only. Prevalence of smoking
in the DOM-TOM was as follows: Year Age group Region Daily smoking (%)
Males Females 2001 17-18 Réunion 19 19
Guadeloupe 13 9 Martinique 10 12
2002 17-19 Réunion 24 12 Guadeloupe 16 9 Martinique 12 10
2003 17-18 Réunion 28.5 23.8 Guadeloupe 13.2 9.4 Martinique 14.8 9.3 New Caledonia 35.3 42.5 French Polynesia 31.4 41.0
d. Smokers marked as frequency *: smoked daily in the last 30 days. All smokers: smoked in the last 30 days.
e. Consumption category estimation based on 1-5, 6-10, 11-20, 20+ (assumed 21+) cigarettes/smoker/day.
40 Hill and Laplanche (2003) a. Survey of young people aged 15-24 for SEITA. Random sample, size 6 317. b. Smokers marked as frequency *: smoked at least one cigarette/day. c. Tobacco products smoked (multiple products used by some): Boys: manufactured cigarettes (99%), hand-rolled cigarettes (6%), cigarillos (25%),
cigars (6%), pipe (31%); Girls: manufactured cigarettes (100%), pipe (2%). d. Consumption category estimation based on 1-4, 5-9, 10, 11-19 and 20+ cigarettes/smoker/day.

Notes (continued)
64 France 17-Sep-2009
Abbreviations and acronyms BVA A survey organisation. CDIT Centre de Documentation et d'Information sur le Tabac CFES le Comité français d’éducation pour la santé CNAMTS Caisse Nationale d' Assurance Maladie des Travailleurs Salariés CNCT Comité National Contre le Tabagisme, Paris Continental France The part of France in mainland Europe (excludes Corsica and DOM-TOM). CREDES Centre de recherche d’étude et de documentation en économie de la santé CREDOC Centre de recherche pour l'étude et l'observation des conditions de vie Département An administrative region of France. France consists of 96 départements. DOM “Départements d'outre-mer”, the overseas départements of France: Réunion,
French Guiana, Martinique and Guadeloupe. DOM-TOM “Départements et territoires d'outre mer”; DOM plus other overseas territories
such as New Caledonia and French Polynesia. ETMAR A survey organisation. IDEM Institut Développement—Études—Marketing. A survey organisation. IFOP A survey organisation. INSEE Institut National de la Statistique et des Études Économiques INSERM Institut national de la santé et de la recherche médicale. IOD Institut d’Observation et de Décision. A survey organisation. IPSOS A survey organisation. IRDES Institut de recherche et documentation en économie de la santé Metropolitan France The part of France that is in Europe (includes Corsica but excludes DOM-TOM). MILDT Mission interministérielle de lutte contre les drogues et les toxicomanies. MV2 conseil A survey organisation. OFDT Observatoire français des drogues et des toxicomanies. ONSER A survey organisation. SEITA Société nationale d'exploitation industrielle des tabacs et allumettes. Until 1976
this was the monopoly for manufacture and supply of tobacco products in France. In 1976 it lost the monopoly on supply of tobacco but retained the monopoly on manufacture. Privatised in 1995. In 1999 SEITA merged with Tabacalera to become Altadis. In 2008 Altadis was acquired by Imperial Tobacco.
Sema-Sofres A survey organisation. SESI Service des Statistiques des Etudes et des Systemes d'Information SOFRES A survey organisation.

17-Sep-2009 France 65
References
Allonier C., Dourgnon P. and Rochereau T. (2006). Santé, soins et la protection sociale en 2004: enquête santé et protection sociale (ESPS). IRDES (Institut de recherche et documentation en économie de la santé), Paris. Biblio no. 1621. http://www.irdes.fr/Publications/Rapports2006/rap1621.pdf.
Allonier C., Dourgnon P. and Rochereau T. (2008). Enquête sur la santé et la protection sociale 2006. IRDES (Institut de recherche et documentation en économie de la santé), Paris. Biblio no. 1701. http://www.irdes.fr/Publications/Rapports2008/rap1701.pdf.
Andersson B., Hibell B., Beck F., Choquet M., et al (2007). Alcohol and drug use among European 17-18 year old students: data from the ESPAD project. The Swedish Council for Information on Alcohol and Other Drugs (CAN) and Council of Europe, Co-operation Group to Combat Drug Abuse and Illicit Trafficking in Drugs (Pompidou Group). http://www.espad.org/documents/Espad/ESPAD_reports/17_18_Year_Old_Students_Full_Report.pdf.
Arènes J., Grizeau D., Baudier F., Chan-Chee C., et al (1996). Evolution des comportements de santé des médecins généralistes en matière de tabagisme de 1992 à 1994. (Changes in smoking habits in general practitioners 1992-94). Bulletin épidémiologique hebdomadaire No 19. http://www.invs.sante.fr/BEh/1996/9619/beh_19_1996.pdf.
ASPECT (Analysis of the Science and Policy for European Control of Tobacco) Consortium (2004). Tobacco or health in the European Union. Past, present and future. European Commission. http://europa.eu.int/comm/health/ph_determinants/life_style/Tobacco/Documents/tobacco_fr_en.pdf.
Auvray L., Doussin A. and Le Fur P. (2003). Santé, soins et protection sociale en 2002: Enquête sur la santé et la protection sociale, France 2002. CREDES (Centre de recherche d'étude et de documentation en économie de la santé), Paris. Biblio no. 1509. http://www.irdes.fr/Publications/Rapports2003/rap1509.pdf.
Baudier F. and Arènes J. (1997). Baromètre santé adultes 95/96. Éditions CFES, Paris. (Collections Baromètres.) http://www.inpes.sante.fr.
Beck F., Guilbert P. and Gautier A. (2007). Baromètre santé 2005: attitudes et comportements da santé. INPES, Saint-Denis. http://www.inpes.sante.fr/Barometres/BS2005/pdf/BS2005_Methodologie.pdf;http://www.inpes.sante.fr/Barometres/BS2005/pdf/BS2005_Tabac.pdf;http://www.inpes.sante.fr/Barometres/BS2005/pdf/BS2005_Questionnaire.pdf.
Beck F. and Legleye S. (2003). Drogues et adolescence: usages de drogues et contextes d'usage entre 17 et 19 ans, évolutions récentes - ESCAPAD 2002. Observatoire français des drogues et des toxicomanies. http://www.ofdt.fr/BDD/publications/docs/epfxfbja.pdf.
Beck F., Legleye S. and Peretti-Watel P. (2000). Regards sur la fin de l'adolescence: consommations de produits psychoactifs dans l'enquête ESCAPAD 2000. Observatoire français des drogues et des toxicomanies. http://www.ofdt.fr/BDD/publications/docs/escapad00.pdf.
Beck F., Legleye S. and Peretti-Watel P. (2002). Santé, mode de vie et usages de drogues à 18 ans: ESCAPAD 2001. Observatoire français des drogues et des toxicomanies. http://www.ofdt.fr/BDD/publications/docs/epfxfbi6.pdf.
Beck F., Legleye S. and Peretti-Watel P. (2003). Penser les drogues: perceptions des produits et des politiques publiques. Enquête sur les représentations, opinions et perceptions sur les psychotropes (EROPP) 2002. OFDT, Paris. http://www.ofdt.fr/BDD/publications/docs/epfxfbj1.pdf.

References (continued)
66 France 17-Sep-2009
Beck F., Legleye S. and Spilka S. (2004). Drogues à l'adolescence. Niveaux et contextes d'usage de cannabis, alcool, tabac et autres drogues à 17-18 ans en France -ESCAPAD 2003-. (Enquêtes en population générale.) http://www.ofdt.fr/BDD/publications/docs/escap03db.pdf;http://www.ofdt.fr/BDD/publications/docs/epfxfbka.pdf.
Beck F., Legleye S. and Spilka S. (2005). Baisse du tabagisme parmi les adolescents: principaux résultats de l'enquête Escapad, France, 2003. Bulletin épidémiologique hebdomadaire No 21-22. http://mvst.free.fr/InVSBEH2005.pdf.
Beck F., Legleye S. and Spilka S. (2006). Les droques à 17 ans: évolutions, contextes d'usages et prises de risque. OFDT. Tendances No 49. http://www.ofdt.fr/BDD/publications/docs/eftxfbm9.pdf.
Ben Lakhdar C. (2005). Contrebande et ventes de tabac 1999-2004. OFDT. Tendances No 44. http://www.ofdt.fr/BDD/publications/docs/eftxcblb.pdf;http://www.ofdt.fr/BDD/publications/docs/eftacblb.pdf.
Ben Lakhdar C. (2006). Actualisation du Tendances no. 44: contrebande et ventes de tabac 1999-2004. OFDT. http://www.ofdt.fr/BDD/publications/docs/tend44b.pdf.
Ben Lakhdar C. (2008). Quantitative and qualitative estimates of cross-border tobacco shopping and tobacco smuggling in France. Tob Control, 17, 12-6.
Bernard J.-G., Nauroy J., Bizeau J.M. and Bernard J.-J. (1980). Le tabagisme du jeune Français et le service militaire. (Tobacco addiction of the young French male and his military service). Rev Epidemiol Sante Publique, 28, 413-21.
Bernard J.G. and Boyer G. (1976). Etude épidémiologique du tabagisme de l'adulte jeune en France. (Epidemiological study of tobacco smoking among young men in France). Bull World Health Organ, 53, 75-81.
Besson D. (2006, Décembre (accessed November 2008)). Consommation de tabac: la baisse s'est accentuée depuis 2003. INSEE, Paris. INSEE Première No 1110. http://www.insee.fr/fr/ffc/ipweb/ip1110/ip1110.pdf.
Bocagnano A., Dumesnil S., Frérot L., Le Fur P. and Sermet C. (1999a). Santé, soins et protection sociale en 1998: Enquête sur la santé et la protection sociale, France 1998. CREDES, Paris. Biblio no 1282. http://www.irdes.fr/Publications/Rapports1999/rap1282.pdf.
Bocagnano A., Dumesnil S., Frérot L., Le Fur P. and Sermet C. (1999b). Santé, soins et protection sociale en 1998: Enquête sur la santé et la protection sociale, France 1998: Annexes. CREDES, Paris. Biblio no 1282 bis. http://www.irdes.fr/Publications/Rapports1999/ann1282bis.pdf.
Centre de Documentation et d'Information sur le Tabac [Personal communication to Hamling J. S.] 1998.
Centre de Documentation et Information sur le Tabac (1998). Le tabac en France en 1997. Tabac News, 19, 1-14.
Chicou F.-J. (1978). La prévention du tabagisme chez les jeunes français. (Prevention of smoking among the young in France). Rev Prat, 28, 1423-8.
Choquet M., Beck F., Hassler C., Spilka S., Morin D. and Legleye S. (2004). Les substances psychoactives chez les collégiens et lycéens: consommations en 2003 et évolutions depuis dix ans. OFDT. Tendances No 35. http://www.ofdt.fr/BDD/publications/docs/eftxmck3.pdf.
Choquet M. and Ledoux S. (1994). Adolescents: enquête nationale. INSERM, Paris. Analyses et prospective (U169).
Choquet M., Ledoux S. and Hassler C. (2002). Alcool, tabac, cannabis et autres drogues illicites parmi les élèves de collège et de lycée: ESPAD 99 France European School Survey Project on Alcohol and other Drugs. Tome I. OFDT. http://www.ofdt.fr/BDD/publications/docs/espad991.pdf.

References (continued)
17-Sep-2009 France 67
Choquet M., Ledoux S., Hassler C., Beck F. and Peretti-Watel P. (2000). Consommation de substances psychoactives chez les 14-18 ans scolarisés: premiers résultats de l'enquête Espad 1999, évolution 1993-1999. Tendances No 6 (Suppl). http://ifr69.vjf.inserm.fr/~ado472/INTRODUCTION/files/Tend6_supl.pdf.
Christensen T. (2004). Euro-barometer 58.2: Health and developing countries, October-December 2002 [Computer file]. Inter-university Consortium for Political and Social Research, Ann Arbor, Michigan. http://www.data-archive.ac.uk/findingData/snDescription.asp?sn=4810.
Comité National contre le Tabagisme (1982). La consommation de tabac chez les travailleurs. Tabac et Sante, (45), 15.
Cooreman J., Burghard G. and Perdrizet S. (1978). L'adolescent et le tabagisme. Responsabilité des parents et des professeurs. Résultats d'une campagne de sensibilisation (Teenagers and tobacco consumption. The responsibility of parents and teachers. Results of a sensitizing campaign). J Med Strasb, 9, 483-8.
Cooreman J., Neukirch F. and Perdrizet S. (1985). Le tabagisme et les adolescentes scolarisées. Med Hyg, 43, 3381-4.
Cooreman J., Perdrizet S. and Burghard G. (1982a). La lutte anti-tabagique à l'école primaire. (The results of educational anti-smoking measures at the primary school level). Arch Fr Pediatr, 39, 113-7.
Cooreman J., Perdrizet S., Metz-Marcy G., Welsch M. and Burghard G. (1979). Un auto-questionnaire appliqué à 30 000 adolescents. Evaluation de ce mode de recueil des données. (A self-administered questionnaire applied to 30,000 teen-agers. Assessment of this method of data collection). Rev Epidemiol Sante Publique, 27, 301-5.
Cooreman J., Redon S. and Perdrizet S. (1982b). Etiologie de la toux chronique des lycéens de l'agglomération bordelaise: methodologie de l'enquête et résultats préliminaires. Bull Int Union Tuberc, 57, 272-9. §
Copé J.-F. (2007). Resultats 2006, La douane: "Agir pour protéger". Conférence de presse de Jean-François Copé. Direction générale des douanes et droits directs. http://www.douane.gouv.fr/data/file/4494.pdf.
Coresta task force on roll-your-own (fine cut) tobacco (1999). Report of the CORESTA task force on roll-your-own (fine cut) tobacco. Special CORESTA Bulletin 1999-2. http://www.coresta.org/.
Costes J.-M. and Palle C. (1999). Drogues et toxicomanies - indicateurs et tendances 1999 (Drugs and drug addictions: indicators and trends 1999). OFDT. http://www.ofdt.fr/BDD/publications/docs/dt99.pdf;http://www.ofdt.fr/BDD/publications/docs/epaxjcf1.pdf.
Currie C., Hurrelmann K., Settertobulte W., Smith R. and Todd J. (eds) (2000). Health and health behaviour among young people: Health behaviour in school-aged children: a WHO cross-national study (HBSC) international report. World Health Organization. (WHO Policy Series: Health policy for children and adolescents, issue 1.) www.hbsc.org/downloads/Int_Report_00.pdf.
Currie C., Roberts C., Morgan A., Smith R., Settertobulte W., Samdal O. and Barnekow Rasmussen V. (eds) (2004). Young people's health in context. Health behaviour in school-aged children (HBSC) study: international report from the 2001/2002 survey. World Health Organization. Health policy for children and adolescents, No. 4. http://www.euro.who.int/Document/e82923.pdf.
Currie C., Gabhainn S.N., Godeau E., Roberts C., Smith R., Currie D., Picket W., Richter M., Morgan A. and Barnekow V. (eds) (2008). Inequalities in young people's health. Health behaviour in school-aged children: international report from the 2005/2006 survey. World Health Organization. Health policy for children and adolescents, No. 5. http://www.euro.who.int/Document/E91416.pdf.

References (continued)
68 France 17-Sep-2009
Davidson F. and Choquet M. (1980). Les jeunes et les drogues permises et interdites. Les lycéens, le tabac, l'alcool, les médicaments psychotropes et les drogues illicites. Genèse et évolution de la toxicomanie. INSERM, Paris.
Davidson F., Choquet M. and Depagne M. (1973). La connaissance et l'usage par les jeunes de produits ayant une affinité psychotrope. Résultats d'une enquête auprès des lycéens. (Results of a survey carried out in secondary schools on the pupils' knowledge and use of psychotropic substances). Rev Epidemiol Med Soc Sante Publique, 21, 23-49.
Dressen C., Guilbert P. and Oddoux K. (2001). Health barometers in France 95/99: key findings. Comité français d'éducation pour la santé (CFES), Vanves. http://www.inpes.sante.fr/CFESBases/catalogue/pdf/472.pdf.
Dymond H.F. (1996). A survey of roll-your-own tobacco use and practice and considerations for the analysis of smoking articles made from it. Tobacco Science, 40, 82-6.
European Commission (2007). Attitudes of Europeans towards tobacco. Special Eurobarometer 272c/Wave 66.2. http://ec.europa.eu/public_opinion/archives/ebs/ebs_272c_en.pdf.
Fréour P., Coudray P. and Fontan M.E.C. (1969). La consommation de tabac. Contribution à son étude en France sur un groupe d'adultes des deux sexes. Bull Inst Natl Sante Rech Med, 24, 1151-83.
Grizeau D., Baudier F. and Allemand H. (1997). Opinions et comportements des adolescents français face au tabac en 1995. (Opinions and behaviour of French adolescents confronted with tobacco in 1995). Arch Pediatr, 4, 1079-86.
Guilbert P., Baudier F. and Arwidson P. (1999). Comparaison de 2 modalités d'enquête sur les comportements et attitudes au sujet de l'alcool, du tabac et des drogues illégales (Comparison of two types of KABP surveys on alcohol, tobacco and illegal drugs). Rev Epidemiol Sante Publique, 47, 129-38.
Guilbert P., Baudier F. and Gautier A. (2001). Baromètre santé 2000. INPES, Vanves. http://www.inpes.sante.fr/Barometres/Baro2000/pdf/questionnaireb2k.pdf;http://www.inpes.sante.fr/Barometres/Baro2000/pdf/tabac.pdf.
Harkin A.M., Anderson P. and Goos C. (1997). Smoking, drinking and drug taking in the European Region. Alcohol, Drugs and Tobacco Programme, WHO Regional Office for Europe, Copenhagen.
Hibell B., Andersson B., Ahlström S., Balakireva O., et al (2000). The 1999 ESPAD report. Alcohol and other drug use among students in 30 European countries. The Swedish Council for Information on Alcohol and Other Drugs (CAN) and Council of Europe, Co-operation Group to Combat Drug Abuse and Illicit Trafficking in Drugs (Pompidou Group). http://www.espad.org/documents/Espad/ESPAD_reports/The_1999_ESPAD_report.pdf.
Hibell B., Andersson B., Bjarnason T., Ahlstrom S., et al (2004). The ESPAD report 2003. Alcohol and other drug use among students in 35 european countries. The Swedish Council for Information on Alcohol and Other Drugs (CAN) and Council of Europe, Co-operation Group to Combat Drug Abuse and Illicit Trafficking in Drugs (Pompidou Group), Stockholm. Sweden. http://www.espad.org/documents/Espad/ESPAD_reports/The_2003_ESPAD_report.pdf.
Hill C. (Institut Gustave-Roussy) Re: Tobacco situation in France [Personal communication to Forey B. A.] 1990, 7 November.
Hill C. and Flamant R. (1985). Une cause d'épidémie majeure: l'augmentation de la consommation de tabac en France. (A major cause of epidemic: the tobacco consumption increase in France). Rev Epidemiol Sante Publique, 33, 387-95.
Hill C. and Laplanche A. (2003). Le tabac en France: les vrais chiffres. La documentation française, Paris. http://www.igr.fr/doc/cancer/pdf/prevention/tabacvraichiffres.pdf.
References (continued)
17-Sep-2009 France 69
Institut de recherche et documentation en économie de la santé (2009, (downloaded 27 February 2009)). Eco-santé France - consommation de tabac. http://www.ecosante.fr/;http://www.ecosante.fr/index2.php?base=FRAN&langh=FRA&langs=FRA&sessionid=.
Joossens L. (1989). Documentation Tabac. CRIOC, Bruxelles. (Hilgers P. (ed) .)
Joossens L., Naett C., Howie C. and Muldoon A. (1994). Tobacco and health in the European Union. An overview. European Bureau for Action on Smoking Prevention (BASP), Brussels.
Joossens L. and Raw M. (1998). Cigarette smuggling in Europe: who really benefits? Tob Control, 7, 66-71.
Karsenty S. and Díaz-Gómez C. (2003). Le tabac en milieu scolaire - Résultats de la première évaluation de la loi Évin dans les écoles, collèges et lycées (2002). OFDT, Paris. (Évaluation des politiques publiques.) http://www.ofdt.fr/BDD/publications/docs/epfxskjc.pdf.
Karsenty S., Maignon G., Díaz-Gómez C. and Brannellec T. (2007). Règles et usages en matière de tabac: évolution 2002-2006 dans les lycées français. OFDT, Paris. http://www.ofdt.fr/BDD/publications/docs/epfxskn1.pdf;http://www.ofdt.fr/BDD/publications/docs/Annexes.pdf.
King A., Wold B., Tudor-Smith C. and Harel Y. (1996). The health of youth, a cross-national survey. WHO Regional Publications, Europe, Copenhagen. European Series No. 69. http://www.hbsc.org/publications/reports.html.
King A.J.C. and Coles B. (1992). The health of Canada's youth. Views and behaviours of 11-, 13- and 15-year-olds from 11 countries. Health and Welfare Canada, Ottawa. Catalogue No. H39-239/1992E.
Kletzlen A. (2004). La douane face aux trafics de cigarettes et de monnaies, No 94. CESDIP, Paris. (Études et Données Pénales.) http://www.cesdip.org/IMG/pdf/EDP_no_94.pdf;http://www.cesdip.fr/spip.php?article122&var_recherche=La%20douane%20face%20aux%20trafics;http://www.cesdip.org/spip.php?page=recherche&recherche=transnational.
Kuulasmaa K., Tolonen H., Ferrario M. and Ruokokoski E. (1998). Age, date of examination and survey periods in the MONICA surveys. World Health Organization. www.ktl.fi/publications/monica/age/ageqa.htm.
Le Bien Public, Cupaiolo-Verney S. (2007, Apr 13). Coup de tabac sur les ventes de cigarettes. http://www.bienpublic.com/archives/article.php?a=art&num=000002941&aaaammjj=20070413&g.
Lee P.N. (ed) (1975). Tobacco consumption in various countries, 4th edition. Tobacco Research Council, London. Research Paper 6.
Legleye S., Beck F., Spilka S. and Le Nézet O. (2007). Drogues à l'adolescence en 2005: niveaux, contextes d'usage et évolutions à 17 ans en France - résultats de la cinquième enquête nationale ESCAPAD. OFDT, Paris. http://www.ofdt.fr/BDD/publications/docs/epfxsln5.pdf.
Legleye S., Spilka S., Le Nézet O., Hassler C. and Choquet M. (2009). Alcool, tabac et cannabis à 16 ans. OFDT, Paris. Tendances No 64. http://www.ofdt.fr/BDD/publications/docs/eftxslp1.pdf.
Lenoir P., Bernard J.G. and Boyer G. (1973). Étude épidémiologique du tabagisme de l'adolescent. Bull Acad Natl Med, 1572, 130-6.
Les Echos, Anonymous (2005, Apr 11). Les ventes de cigarettes en France ont reculé de 21% l'an dernier (French cigarette sales down 21% in 2004). p.21. http://archives.lesechos.fr/archives/2005/LesEchos/19389-92-ECH.htm.

References (continued)
70 France 17-Sep-2009
Les Echos, Anonymous (2006, Feb 8). Tabac : le marché officiel a cessé de chuter (Tobacco: official trade stops falling). p.19. http://archives.lesechos.fr/archives/2006/LesEchos/19601-120-ECH.htm?texte=marche%20tabac.
Les Echos, Cougard M.-J. (2009, Mar 13). Tabac : le gouvernement veut mettre fin au «tourisme fiscal» (Tobacco: the government wants to end "fiscal tourism"). http://www.lesechos.fr/info/france/4842062.htm.
Manninen J. (ed) (1997). Smoking prevalence and tobacco policies in the member states of the European Union. A summary of the overviews by country. National Public Health Institute, Helsinki. http://www.ktl.fi/enypat/data/smokprev_eu.htm.
Melich A. (2006). Euro-barometer 52.1: Modern biotechnology, quality of life, and consumers access to justice, November-December 1999 [Computer file]. Zentralarchiv für Empirische Sozialforschung, Cologne, and Inter-university Consortium for Political and Social Research, Ann Arbor, Michigan. http://www.data-archive.ac.uk/findingData/snDescription.asp?sn=4203.
Merzdorf J., Reuter U. and Welsch G. (1982). Daten und Fakten zur Entwicklung des Rauchens in Mitgliedsländern der Europäischen Gemeinschaften (Facts and figures on the development of smoking in the member states of the European Communities). Kommission der Europäischen Gemeinschaften, Luxemburg. Medizin - EUR 7907 DE.
Molarius A., Kuulasmaa K., Evans A., McCrum E. and Tolonen H. (1999). Quality assessment of data on smoking behaviour in the WHO MONICA project. World Health Organization. http://www.ktl.fi/publications/monica/smoking/qa30.htm.
Neukirch F., Liard R., Cooreman J. and Perdrizet S. (1982). Prevalence of respiratory symptoms in Parisian teenagers according to smoking habits. J Epidemiol Community Health, 36, 202-4.
Observatoire français des drogues et des toxicomanies (2009a). Recherche thématique: tabac: production/offre. OFDT. http://www.ofdt.fr/ofdtdev/live/produits/tabac/offre-1.html#aff_rech;http://www.ofdt.fr/ofdtdev/live/produits/tabac/2pdf//produits/tabac/offre-1.pdf.
Observatoire français des drogues et des toxicomanies (2009b). Tabagisme et arrêt du tabac en 2008. OFDT. (Tableau de bord mensuel des indicateurs tabac.) http://www.ofdt.fr/ofdt/fr/tt_08bil.pdf.
Organisation for Economic Co-operation and Development (1993). OECD health systems. Facts and trends 1960-1991. Health policy studies no 3. OECD, Paris. (Health policy studies, Volume 1.)
Oriol P., Patois E., Guenin-Tostain F., Benotman H. and Kauffmann F. (1994). Le tabagisme des jeunes de 11-16 ans dans le département des Yvelines en 1990 (Smoking by 11-16 year olds in the Yvelines department in 1990). Rev Mal Respir, 11, 583-92.
Oriol P., Patois E., Guenin-Tostain F. and Kauffmann F. (1988). Facteurs de risque du tabagisme chez les jeunes de 11 à 16 ans. (Risk factors for smoking in the young age 11 to 16). Rev Mal Respir, 5, 393-400.
Padioleau M. (Société nationale d'exploitation industrielle des tabacs et allumettes (SEITA)) Re: Tobacco sales in France [Personal communication to Forey B. A.] 1990, 24 September.
Padioleau M. (Société nationale d'exploitation industrielle des tabacs et allumettes (SEITA)) Re: Tobacco sales in France from 1861 and cigarette consumption per adult for the years 1974-84 [Personal communication to Lee P. N.] 1985, 30 August.
Papacostas A. (2008, (accessed April 2008)). Euro-barometer 64.1: Mobility, food risk, smoking, AIDS prevention, and medical errors, September-October 2005 [Computer file], 1st GESIS-ZA edition as of March 12, 2008. Zentralarchiv für Empirische Sozialforschung an der Universität zu Köln (ZA). ZA4413. http://zacat.gesis.org/webview/index.jsp.

References (continued)
17-Sep-2009 France 71
Perdrizet S., Cooreman J. and Burghard G. (1982). Les adolescents et le tabac dans un département français, en 1979. In: Fontana F. (ed) Tabacco e giovani (Tobacco and youth), International conference, Venice 9-11 November 1981. ATTI, Venice; 315-26.
Rabier J.-R., Riffault H. and Inglehart R. (1989). Euro-barometer 27: The common agricultural policy and cancer, March-May 1987 [Computer file]. Inter-university Consortium for Political and Social Research, Ann Arbor, Michigan. http://www.data-archive.ac.uk/findingData/snDescription.asp?sn=2695.
Readers Digest (1963). Products and people. A digest of the marketing survey of the European Common Market and Britain, 1963. Reader's Digest Association Limited, London.
Reif K. and Marlier E. (1998). Euro-barometer 43.0: Cross-border purchases, smoking habits and cancer risks, March-April 1995 [Computer file]. Zentralarchiv für Empirische Sozialforschung, Cologne. http://www.data-archive.ac.uk/findingData/snDescription.asp?sn=3811.
Reif K. and Melich A. (1990). Euro-barometer 29: Environmental problems and cancer, March-April 1988 [Computer file]. Inter-university Consortium for Political and Social Research, Ann Arbor, Michigan. http://www.data-archive.ac.uk/findingData/snDescription.asp?sn=2745.
Reif K. and Melich A. (1991a). Euro-barometer 30: Immigrants and out-groups in Western Europe, October-November 1988 [Computer file]. Inter-university Consortium for Political and Social Research, Ann Arbor, Michigan. http://www.data-archive.ac.uk/findingData/snDescription.asp?sn=2857.
Reif K. and Melich A. (1991b). Euro-barometer 31: European elections, 1989: Pre-election survey, March-April 1989 [Computer file]. Inter-university Consortium for Political and Social Research, Ann Arbor, Michigan, and Zentralarchiv für Empirische Sozial-forschung, Cologne. http://www.data-archive.ac.uk/findingData/snDescription.asp?sn=2729.
Reif K. and Melich A. (1992). Euro-barometer 32: The single european market, drugs, alcohol, and cancer, November 1989 [Computer file], Second edition. Inter-university Consortium for Political and Social Research, Ann Arbor, Michigan, and Zentralarchiv für Empirische Soziolforschung, Cologne. http://www.data-archive.ac.uk/findingData/snDescription.asp?sn=2977.
Reif K. and Melich A. (1995). Euro-barometer 38: European court of justice, passive smoking, and consumer issues, September-October 1992 [Computer file], Second edition. Zentralarchiv für Empirische Sozialforschung, Cologne, and Inter-university Consortium for Political and Social Research, Ann Arbor, Michigan. http://www.data-archive.ac.uk/findingData/snDescription.asp?sn=3216.
Reif K. and Melich A. (1998a). Euro-barometer 36: Regional identity and perceptions of the third world, Fall 1991 [Computer file]. Inter-university Consortium for Political and Social Research, Ann Arbor, Michigan, and Zentralarchiv für Empirische Sozialforschung, Cologne. http://www.data-archive.ac.uk/findingData/snDescription.asp?sn=3228.
Reif K. and Melich A. (1998b). Euro-barometer 41: Trade issues, blood donation, aids, and smoking, April-May 1994 [Computer file], Fourth edition. Inter-university Consortium for Political Ann Arbor, Michigan, and Social Research, and Zentralarchiv für Empirische Sozialforschung, Cologne. http://www.data-archive.ac.uk/findingData/snDescription.asp?sn=3525.
Reif K. and Melich A. (2000). Euro-barometer 34.1: Health problems, Fall 1990 [Computer file], Second edition. Zentralarchiv für Empirische Sozialforschung, Cologne, and Inter-university Consortium for Political and Social Research, Ann Arbor, Michigan. http://www.data-archive.ac.uk/findingData/snDescription.asp?sn=2968.
Sasco A.J., Grizeau D. and Danzon M. (1995). Is tobacco use finally decreasing in France? Cancer Detect Prev, 19, 210-8.
Sasco A.J., Grizeau D., Pobel D., Chatard O. and Danzon M. (1994). Tabagisme et classe sociale en France de 1974 à 1991 (Smoking and social class in France 1974-1991). Bull Cancer, 81, 355-9.

References (continued)
72 France 17-Sep-2009
Sasco A.J., Pobel D., Grizeau D. and Danzon M. (1991). Évolution récente du tabagisme des jeunes en France (Current development of smoking in young people in France). Pediatrie, 46, 555-60.
Schwartz D., Flamant R., Lellouch J. and Denoix P.F. (1961). Results of a French survey on the role of tobacco, particularly inhalation, in different cancer sites. J Natl Cancer Inst, 26, 1085-108.
Service des Statistiques, des Etudes et des Systemes d'Information (SESI) (1983). Quelques résultats sur les consommateurs de boissons alcoholiques et de tabac en France en 1980. Enquête auprès des menages sur la santé et les soins medicaux - 1980-81. Ministère des Affaires Sociales. Informations Rapides 20.
Société nationale d'exploitation industrielle des tabacs et allumettes (SEITA) (1961). Un siècle d'activité du Monopole des Tabacs: II - Ventes totales de tabacs fabriqués. Paris. Bulletin d'Information de la Direction Générale, No 127.
SOFRES (date unknown). Les français et le tabac. Résultats d'un sondage de la SOFRES effectué entre le 7 et le 10 décembre 1974 auprès d'un échantillon national de 1000 personnes représentatif de la population française âgée de 18 ans et plus.
Todd G. (1986a). Medicine. Statistics of smoking in the Member States of the European Community. Commission of the European Communities, Luxembourg.
Todd G.F. (1986b). Cigarette Data Collection : A record of six cigarette smoking parameters in 20 countries. Internal report.
Tolonen H., Kuulasmaa K. and Ruokokoski E. (2000, revised November 2005). MONICA population survey data book. World Health Organization. http://www.ktl.fi/publications/monica/surveydb/title.htm.
Treguer M., D'Houtard A., Deschamps J.P., Martin J., Andre G. and Chau N. (1983). Données épidémiologiques concernant le tabagisme chez les jeunes. Med Armees, 11, 595-600.
Tuyns A.J. and Hu M.X. (1982). Changing smoking patterns in Calvados (France). Br J Addict, 77, 167-83.
van Reek J. and Adriaanse H. (1995). Daily smoking among adolescents in the European Community. Rev Epidemiol Sante Publique, 43, 281-2.
van Reek J., Adriaanse H. and Karaoglou A. (1992). Smoking among children in the European Community. J Public Health Med, 14, 93-4.
Wolf H.K., Kuulasmaa K., Tolonen H. and Ruokokoski E. (1998). Participation rates, quality of sampling frames and sampling fractions in the MONICA surveys. World Health Organization. http://www.ktl.fi/publications/monica/nonres/nonres.htm.
World Health Organization (1989). The WHO MONICA project: a worldwide monitoring system for cardiovascular diseases. In: World Health Statistics Annual 1989. WHO, Geneva; 25-149.
World Health Organization (1997). Tobacco or health: A global status report. WHO, Geneva.
Wynder E.L., Mushinski M.H., Stellman S.D. and Choay P. (1981). Tobacco usage in France: An epidemiological study. Prev Med, 10, 301-15.
§ Original paper not obtained, but information taken as quoted by another author