international review of biophysical chemistrybose.res.in/~skpal/papers/tanumoy_irbc1.pdfvol. 2 n. 6...
TRANSCRIPT

International Review of Biophysical Chemistry
(IREBIC)
Contents:
Formation of Human ILPR G-Quadruplex in dsDNA by Soma Dhakal, Zhongbo Yu, Ryan Konik, Deepak Koirala, Hanbin Mao
191
Structure and Function of Eukaryotic DNA-Binding Proteins in DNA Repair by Stephanie J. S. Kind, Mark R. Sanderson
193
Hydroxyl Radical: a Key Species in Atmospheric Reaction by Sunakar Panda
207
Study of Biomolecular Recognition Using Time-Resolved Optical Spectroscopy by Tanumoy Mondol, Soma Banerjee, Subrata Batabyal, Samir Kumar Pal
211
ISSN 2038 - 0321Vol. 2 N. 6
December 2011
REPRINT

International Review of Biophysical Chemistry (IREBIC)
Editor-in-Chief: prof. Concetta Giancola Department of Chemistry Faculty of Mathematical, Physical and Natural Sciences FEDERICO II University Via Cinthia - Complesso Monte S. Angelo - I80126, Naples, Italy [email protected]
Editorial Board:
Barone Vincenzo (Italy) Scuola Normale Superiore di Pisa Berliner Lawrence J. (U.S.A.) University of Denver - Department of Chemistry & Biochemistry Catala' Angel (Argentina) Universidad Nacional de La Plata - Facultad de Ciencias Exactas Chaires Jonathan B. (U.S.A.) University of Louisville - James Graham Brown Cancer Center Gabelica Valérie (Belgium) University of Liege - Mass Spectrometry Laboratory Gadda Giovanni (U.S.A.) Georgia State University - Department of Chemistry Kim Byeang Hyean (Korea) Pohang University of Science and Technology Kotlyar Alexander (Israel) Tel-Aviv University of Israel Markovitsi Dimitra (France) Francis Perrin Laboratory- CEA/Sacaly Mergny Jean- Louis (France) Institut Européen de Chimie et Biologie Pa'li Tibor László (Hungary) Institute of Biophysics - Biological Research Centre Plavec Janez (Slovenia) National Institute of Chemistry Sugimoto Naoki (Japan) Konan University - Frontier Institute for Biomolecular Engineering Research (FIBER)Toshev Borislav (Bulgaria) University of Sofia - Department of Physical Chemistry Ventura Salvador (Spain) Universitat Autonoma de Barcelona - Institut de Biotecnologia i de Biomedicina The International Review of Biophysical Chemistry (IRe.Bi.C.) is a publication of the Praise Worthy Prize S.r.l.. The Review is published bimonthly, appearing on the last day of February, April, June, August, October, December. Published and Printed in Italy by Praise Worthy Prize S.r.l., December 31, 2011. Copyright © 2011 Praise Worthy Prize S.r.l. - All rights reserved. This journal and the individual contributions contained in it are protected under copyright by Praise Worthy Prize S.r.l. and the following terms and conditions apply to their use: Single photocopies of single articles may be made for personal use as allowed by national copyright laws. Permission of the Publisher and payment of a fee is required for all other photocopying, including multiple or systematic copying, copying for advertising or promotional purposes, resale and all forms of document delivery. Permission may be sought directly from Praise Worthy Prize S.r.l. at the e-mail address: [email protected] Permission of the Publisher is required to store or use electronically any material contained in this journal, including any article or part of an article. Except as outlined above, no part of this publication may be reproduced, stored in a retrieval system or transmitted in any form or by any means, electronic, mechanical, photocopying, recording or otherwise, without prior written permission of the Publisher. E-mail address permission request: [email protected] Responsibility for the contents rests upon the authors and not upon the Praise Worthy Prize S.r.l.. Statement and opinions expressed in the articles and communications are those of the individual contributors and not the statements and opinions of Praise Worthy Prize S.r.l.. Praise Worthy Prize S.r.l. assumes no responsibility or liability for any damage or injury to persons or property arising out of the use of any materials, instructions, methods or ideas contained herein. Praise Worthy Prize S.r.l. expressly disclaims any implied warranties of merchantability or fitness for a particular purpose. If expert assistance is required, the service of a competent professional person should be sought.
REPRINT
International Review of Biophysical Chemistry (I.RE.BI.C.), Vol. 2, N. 6
December 2011
Manuscript received and revised November 2011, accepted December 2011 Copyright © 2011 Praise Worthy Prize S.r.l. - All rights reserved
211
Study of Biomolecular Recognition Using Time-Resolved Optical Spectroscopy
Tanumoy Mondol, Soma Banerjee, Subrata Batabyal, Samir Kumar Pal* Abstract – Molecular recognition process refers to the weak non-covalent interaction, which takes place selectively and specifically between small ligand molecules with biological macromolecules. Understanding of such recognition in biological and biomimetic milieu is the central attraction for drug designing, which is crucial for the improvement of human healthcare. A thorough knowledge of the structural, dynamical and energetic parameters that dictate such molecular interactions can find immense use in the modulations of the ligand-macromolecule recognition process. In this article, we present our continuous effort to investigate the fundamental physical processes involved in the biomolecular recognition, e.g. efficiency (binding affinity and rigidity of the complex) and role of solvent molecules in the molecular recognition using steady state and predominantly, ultrafast time-resolved fluorescence spectroscopy. In this perspective, we have thoroughly investigated the molecular recognition of small ligand/drug molecules (Rifampicin; Rf, 4-(dicyanomethylene)-2-methyl-6-(p-dimethylaminostyryl)-4H-pyran; DCM, and Nile Blue; NB) by a human transporter protein, Human Serum Albumin (HSA), and also established the nonspecific type of interaction between a ligand molecule (Rf) and a biomimetic system (Sodium Dodecyl Sulfate (SDS) micelle). Simultaneous recognition of an intercalator (Ethidium Bromide, EtBr) and a DNA minor groove binder (Hoeschst 33258, H258) to a dodecamer DNA of specific sequence has also been monitored. Besides, we report an investigation on the recognition of ethidium (Et) cation, a potential mutagen, by synthetic DNA and various cell nuclei in presence of a stimulant drug, caffeine, employing the mentioned spectroscopic techniques along with NMR and fluorescence microscopy. Moreover, we have explored the differential molecular recognition of 8-anilino-1-naphthalenesulfonic acid (ANS) and 2,6-p-toluidinonaphthalene sulfonate (TNS) by bovine pancreatic α-chymotrypsin (CHT) upon interaction with genomic DNA. The correlation of the molecular recognition of the DNA and DNA-protein complexes with the hydration dynamics has been further exploited in our studies. In addition, we have developed functional nanoparticles/Quantum dots (QDs) that are covalently linked to biological molecules to detect the molecular interaction phenomenon between biomolecules. It should be noted that QDs have a significant contribution in the field of nano-biotechnology due to its high quantum yield, low photo-bleaching and increased biological application (cell labeling, in vivo imaging, gene delivery, sensing of fluorescence and molecular recognition). In this regard, we have exploited QDs as a potential energy donor/acceptor system and validated Förster resonance energy transfer (FRET) model over nano-surface energy transfer (NSET) technique. Therefore, the ultrafast non-radiative energy migration from tryptophan (Trp214) present in HSA to the HSA bound CdS QD, and from 4-nitrophenyl anthranilate (NPA) to Silver (Ag) nanoclusters in CHT (both NPA and Ag bound to CHT) have been investigated using FRET technique to monitor the protein folding pathway of HSA, and molecular interaction between NPA and CHT respectively. Moreover, we have also used functionalized QDs (CdSe/ZnS) for the detection of molecular recognition of ethidium bromide (EtBr) by a synthetic DNA. However, the intention of this review is to give an overview of ultrafast optical spectroscopic techniques for the exploration of biomolecular recognition, which may find potential significance for further research in the field of nano-biotechnology and medicine. Copyright © 2011 Praise Worthy Prize S.r.l. - All rights reserved. Keywords: Biomolecular Recognition, Ultrafast Spectroscopy, NMR Spectroscopy, Förster
Resonance Energy Transfer (FRET)
I. Introduction A long-standing but yet unattained objective in
biophysical chemistry is to elucidate the physico-chemical basis of the specific and nonspecific interaction between various biological molecules. Such molecular
REPRINT

Tanumoy Mondol, Soma Banerjee, Subrata Batabyal, Samir Kumar Pal
Copyright © 2011 Praise Worthy Prize S.r.l. - All rights reserved International Review of Biophysical Chemistry, Vol. 2, N. 6
212
interactions form the basis of highly specific recognition, reaction, transport and regulation, which are fundamental to all life processes [1]-[2]. Enzymatic reactions, immunological antigen-antibody association, intermolecular reading, translation and transcription of the genetic code [3]-[4], signal induction by neurotransmitters [5], and cellular recognition are the representative examples, where a small ligand molecule binds to biological macromolecules like proteins and DNA (biomolecular recognition). Again, a large number of clinically important drugs/ligands and antibiotics are believed to exert their primary biological action by means of non-covalent interactions with protein and DNA.
The weak, noncovalent interactions (hydrophobic, electrostatic, van der Waals, and hydrogen bonding) govern the ligand-binding process during protein/DNA-ligand complexation. However, drugs/ligands interact with biomolecules at the latter’s active site and efficient biological activity demands good geometric fit as suggested by Emil Fischer in the “Lock and Key” principle along with a high degree of complementarities of polar and non-polar part of ligand and macromolecular binding sites. The other factors contributing to biological activity are binding site flexibility, distortion energies, desolvation effects, entropy and molecular electrostatic field complementarities [6]. Thus, the understanding of molecular recognition in protein-ligand and DNA-ligand complexes on an atomic level is crucial to biological function and of significant, practical importance in the discovery of new drugs and in phototherapy [7]-[8].
Elucidating the role of these interactions and the time scales involved provide insights into the mechanism of molecular recognition. At this point, it is interesting to know how rigidly are the ligands bound to macromolecules and what are the consequences of binding on the macromolecular structure. Another major interest behind understanding of molecular recognition lies in the fact that the macromolecules inside the physiological system rarely exist and function alone. As a rule, they act as parts of complex biomolecular assemblies, which may involve several protein units, DNA loops, lipids and various ligands. For example, recognition of substrate by enzyme, antigen by antibody, neurotransmitter by neuroreceptor, etc., all rely on such interactions. So, how are the molecular recognition properties affected in vivo? In this respect, experimental biophysics forms a very strong support on which the fundamentals of the studies of biomolecular recognition are based on and photophysical studies are certainly its efficient tools. The results of photophysical studies provide enormous information for both the target molecules and its environment.
As biomimetic systems like micelles often resemble the surface of the protein, we have investigated the nonspecific interaction between a ligand molecule (Rifampicin (Rf)) and a biomimetic system (sodium dodecyl sulfate (SDS) micelle) prior entering to the real and complex biological system (Where both specific and
nonspecific type of interaction may exist). Subsequently, we have explored the molecular recognition of Rf and an anti-thrombosis drug Warfarin (Wf) by a human transporter protein (human serum albumin; HSA) and identified the binding site of Rf to HSA. An attempt has also been made to characterize the simultaneous binding of the two ligands (4-(dicyanomethylene)-2-methyl-6-(p-dimethylaminostyryl)-4H-pyran; DCM, and Nile Blue; NB) in various temperature-dependent folded states of HSA. Simultaneous recognition of an intercalator (Ethidium Bromide, EtBr) and a minor groove binder (Hoeschst 33258, H258) by a dodecamer DNA of specific sequence has been thoroughly investigated, which has importance in drug designing since it provides information on the compatibility of various drugs and their effect on a mutagen-bound DNA. Moreover, we have demonstrated the effect of a stimulant drug, caffeine in the molecular recognition of EtBr, a potential mutagen [9] by synthetic DNA and various cell nuclei. In addition, we have monitored the differential molecular recognition of 8-anilino-1-naphthalenesulfonic acid (ANS) and 2,6-p-toluidinonaphthalene sulfonate (TNS) by bovine pancreatic α-chymotrypsin (CHT) in presence of genomic DNA. The correlation of sequence dependent molecular recognition with hydration dynamics in the minor grove of DNA and Histone-DNA complex has been further exploited in our studies.
In past few years the use of nonmaterial has received overwhelming responses in the field of material science and biology due to the wide variety of core materials available, desired fluorescent properties: high quantum yield, high photostability, high extinction coefficient and narrow emission spectra but with a broad excitation band. In addition, nanoparticles/quantum dots (QDs) have an advantage over organic dyes in the Förster resonance energy transfer (FRET) studies on biological macromolecules as organic fluorophore often suffers from unavoidable photo-bleaching. Such properties of QDs provide a useful platform for sensing the molecular recognition between biomolecules. While using QDs, it becomes equally important to establish the validation of FRET over nano-surface energy transfer technique (NSET), which comes from the damping of the donor fluorophore’s oscillating dipole by the acceptor QDs through either electron hole pair (EHP) for semiconductor or free electrons for metal. In this respect, we have conferred the validation of FRET over NSET in the case of quantum metal clusters and applied the finding to other systems. The efficiency of energy transfer from various size QDs have been further investigated using picosecond resolved fluorescence transients. Most importantly, we have developed functional nanoparticles that are covalently linked to biological molecules. Such integrated biomolecule–QD hybrid systems can be utilized to explore the biomolecular recognition phenomenon. In this respect, one of our previous studies demonstrates the use of CdS QD, to study the protein (HSA) folding pathway which takes place in the time of molecular recognition. We
REPRINT
Tanumoy Mondol, Soma Banerjee, Subrata Batabyal, Samir Kumar Pal
Copyright © 2011 Praise Worthy Prize S.r.l. - All rights reserved International Review of Biophysical Chemistry, Vol. 2, N. 6
213
have established that Ag nanoclusters could work as an efficient energy acceptor in FRET studies and can sense the association of 4-nitrophenyl anthranilate (NPA) with CHT. Additionally, functionalized CdSe/ZnS QDs have been utilized to investigate the biomolecular recognition of a DNA intercalator (EtBr) by DNA. Nevertheless, this review provides a detailed spectroscopic investigation of ligand/drug–biomolecular interactions as well as applications of nanoparticles in biological sensing and bimolecular recognition.
II. Methodology II.1. Steady State Spectroscopy
All absorbance measurements were performed in a Shimadzu UV-2450 spectrophotometer. All fluorescence measurements were performed in a Jobin Yvon Fluoromax-3 fluorimeter. Circular dichroism (CD) measurements were carried out on a JASCO 815 spectro-polarimeter with a temperature controller attachment.
The scan speed of the measurements was 50 nm /min and each spectrum was the average of five scans.
II.2. Time-Resolved Spectroscopy
Details of the time-resolved spectroscopic data were measured with a time correlated single photon counting (TCSPC) setup from Edinburgh Instruments. Protein samples were excited by the third harmonic laser beam (299 nm) of the 897 nm (0.5 nJ per pulse) using a mode-locked Ti-sapphire laser with an 80 MHz repetition rate (Tsunami, Spectra Physics), pumped by a 10 W Millennia (Spectra Physics) followed by a pulse-peaker (rate 8 MHz) and a third harmonic generator (Spectra-Physics, model 3980).
The third harmonic beam was used for excitation of the sample inside the TCSPC instrument (instrument response function, IRF=50 ps) and the second harmonic beam was collected as for the start pulse. The picosecond-resolved fluorescence transients were fitted
with multi-exponential (n) function, 1
n
iii
tA expτ=
⎛ ⎞−⎜ ⎟
⎝ ⎠∑
where, Ai’s are weight percentages of the decay components with time constants of iτ . The average excited state lifetime is expressed by the equation
1
n
i ii
τ τ=
= Α∑ , when 1
1n
ii=
Α =∑ .
For 375 nm and 409 nm excitation sources, picoseconds laser diodes from PicoQuant, Germany, were used. The temperature dependent femtosecond-resolved fluorescence was measured using a femtosecond upconversion setup (FOG 100, CDP) along with an indigenous temperature controller setup [10]. The sample was excited (0.5 nJ per pulse), using the second harmonic of a mode-locked Ti-sapphire laser with an 80 MHz repetition rate (Tsunami, Spectra Physics), pumped by 10
W Millennia (Spectra Physics). The fundamental beam is frequency doubled in a nonlinear crystal (1mm BBO, θ = 25o, φ = 90o). The fluorescence emitted from the sample is up-converted in a nonlinear crystal (0.5 mm BBO, θ = 10o, φ = 90o) using a gate pulse of the fundamental beam. The upconverted light is dispersed in a double monochromator and detected using photon counting electronics.
A cross-correlation function obtained using the Raman scattering from water displayed a full width at half maximum (FWHM) of 165 fs. Upon excitation with an ultrafast laser pulse, a significant dipole moment is generated in the probe and hence the polar solvent molecules at t = 0 find themselves in a relatively high-energy configuration. Subsequently the solvent molecules begin to move and rearrange themselves to reach their new equilibrium positions. The shift in the probe’s emission frequency (peak), which accompanies the solvent relaxation, gives a measure of the dynamics of solvation. To construct time-resolved emission spectra (TRES) after the excitation pulse, the method described elsewhere [11] had been adopted. The time-resolved spectra were fitted with a lognormal shape function to estimate the spectrum maximum ν(t). The temporal Stokes shift can be represented by the time dependence of the fit. By following the time-resolved emission, the solvation correlation function had been constructed:
( ) ( ) ( ) ( ) ( )0C t t /ν ν ν ν= − ∞ − ∞⎡ ⎤ ⎡ ⎤⎣ ⎦ ⎣ ⎦ (1) where ν(0), ν(t) and ν(∝), denote the observed emission peaks (in wave numbers) at time 0, t and ∝, respectively.
For anisotropy (r(t)) measurements, emission polarization was adjusted to be parallel or perpendicular to that of the excitation and anisotropy is defined as:
( )
2para perp
para perp
I G Ir t
I G I
⎡ ⎤− ×⎣ ⎦=⎡ ⎤+ × ×⎣ ⎦
(2)
G, the grating factor is determined following tail
matching technique [12]. The time-resolved anisotropy of a probe reveals the physical motion of the probe in a microenvironment. The time constants reflect rotational correlation time of the probe in the microenvironment.
II.3. Förster Resonance Energy Transfer (FRET) Technique
The Förster distances of donor–acceptor pairs were calculated using the Equation (13):
( ) ( )1
2 4 60 0 211 In ÅDR . n Jκ λ−⎡ ⎤= × Φ⎣ ⎦ (3)
where, R0 is the distance between the donor and the acceptor at which the energy transfer efficiency is 50%,
REPRINT
Tanumoy Mondol, Soma Banerjee, Subrata Batabyal, Samir Kumar Pal
Copyright © 2011 Praise Worthy Prize S.r.l. - All rights reserved International Review of Biophysical Chemistry, Vol. 2, N. 6
214
κ2 is a factor describing the relative orientation in space of the transition dipoles of the donor and acceptor. The magnitude of κ2 is assumed to be 0.66 for random orientation of donor and acceptor pair [13].
The refractive index (n) of the medium is assumed to be 1.33 (aqueous medium). ΦD is the fluorescence quantum yield of the donor. J (λ), the overlap integral, which expresses the degree of spectral overlap between the donor emission and the acceptor absorption, is given by:
( )( ) ( )
( )
4
0
0
D A
D
F d
J
F d
λ ε λ λ λ
λ
λ λ
∞
∞=
∫
∫ (4)
where, FD (λ) is the fluorescence intensity of the donor in the wavelength range of λ to λ+dλ and is dimensionless. εA (λ) is the extinction coefficient (in M−1 cm−1) of the acceptor at λ.
If λ is in nm, then J(λ) is in units of M−1 cm−1 nm4. Once the value of R0 is known, the donor–acceptor distance (r) can easily be calculated using the formula:
( )6 60 1r R E / E⎡ ⎤= −⎣ ⎦ (5)
here, E is the efficiency of energy transfer, which can be expressed as follows:
1 DA
D
FE
F= − (6-a)
1 DA
DE
ττ
= − (6-b)
The transfer efficiency can be measured using the
relative fluorescence intensity of the donor in the absence (FD) and presence (FDA) of the acceptor (Equation (6-a)).
The efficiency, E can also be calculated from the lifetimes (τD and τDA) using the equation 6b, where τD and τDA are lifetimes of the donor in absence and in presence of the acceptor. However, the potential danger of using equation 6(a) for the estimation of donor-acceptor (D-A) distance had been discussed in our previous studies [14].
II.4. Nanosurface Energy Transfer (NSET) Technique
The Donor (D)-Acceptor (A) separations can also be calculated using another prevailing technique, NSET [15], in which the energy transfer efficiency depends on the inverse of fourth power of the donor-acceptor separation.
Nano-surface energy transfer (NSET) technique is based on the model of Persson and Lang [16], which is concerned with the momentum and energy conservation
in the dipole-induced formation of electron-hole pairs. Here the rate of energy transfer is calculated by performing a Fermi golden rule calculation for an excited-state molecule depopulating with the simultaneous scattering of an electron in the nearby metal to above the Fermi level. The Persson model states that the damping rate to a surface of a noble metal may be calculated by:
2
40 3 dyeet
F Fk .
k d
µ ω
ω
⎛ ⎞⎜ ⎟=⎜ ⎟⎝ ⎠
(7)
which can be expressed in more measurable parameters through the use of the Einstein A21 coefficient [17]:
3
221 3
03dyeA
c
ωµ
ε π= (8)
to give the following rate of energy transfer, in accordance with Coulomb’s law (1/4πε0):
3
2 40 225 dyeet
dye F F dye
ck .
k dω ω τ
Φ= (9)
where c is the speed of light, Фdye is the quantum yield of the donor, ωdye is the angular frequency for the donor, ωF is the angular frequency for bulk metal, d is the donor-acceptor separation, τdye is the average lifetime of the dye and kF is the Fermi wave vector for bulk metal.
The d0 value is a convenient value to calculate for a dye-metal system, yielding the distance at which a dye will display equal probabilities for energy transfer and spontaneous emission.
For the Persson model, the d0 value may be calculated by:
13 4
0 20 225 dye
dye F F
cd .
kω ω
⎛ ⎞Φ⎜ ⎟=⎜ ⎟⎝ ⎠
(10)
In our case we have used the k time-resolved as ket:
1 1
time resolveddonor acceptor dye
kτ τ−
−= − (11)
where, τdonor-acceptor is the average lifetime of the donor-acceptor system.
II.5. Validation of FRET over NSET in the Case of Nano Materials
This work is performed to validate FRET model over NSET technique in the case of quantum clusters and to apply the findings to other quantum dots (QDs). In one of our earlier studies, we have explored the possibility of using gold nanoclusters of 25 atoms (Au25) as energy
REPRINT

Tanumoy Mondol, Soma Banerjee, Subrata Batabyal, Samir Kumar Pal
Copyright © 2011 Praise Worthy Prize S.r.l. - All rights reserved International Review of Biophysical Chemistry, Vol. 2, N. 6
215
acceptors in a FRET study, where the donor-acceptor system represents two point dipoles [18]. A dansyl chromophore was used as a model donor molecule. Dansyl chromophore was attached to the Au25 core by two different routes. In the first route, dansyl chloride was reacted at the amino group of the glutamate residue of some of the glutathione ligands (-SG) anchored on Au25.
This gives Au25 cluster protected with a mixture of glutathione and N-dansyl glutathione. The product obtained in this route is referred to as the reaction product in the ongoing discussion. In the second route, some of the glutathione ligands of the cluster underwent exchange by the classical ligand exchange method with dansyl glutathione (-SG-D) when the Au25SG18 was stirred with dansyl glutathione. This method also led to the formation of Au25 protected with a mixture of glutathione and N-dansyl glutathione. The product obtained is referred to as the exchange product (Figure 1). Steady state fluorescence measurements were carried out on both the exchange and reaction products in order to check whether any energy transfer occurred between the cluster and the chromophore. It was found that emission of dansyl glutathione underwent drastic quenching in both the products. Figure 2 depicts the emission profile of the reaction product. The quenching of the donor is seen clearly. On the other hand, the emission at 700 nm, which is the characteristic emission of Au25, enhanced in both the reaction and the exchange products when excited at the excitation maximum of the donor (330 nm).
Fig. 1. Approaches used for the functionalization of dansyl chromophore on the Au25 cluster. (Reprinted with permission from ref.
18. Copyright 2008, American Chemical Society) It is clear from Figure 2 that the intensity of emission
collected when excited at 535 nm (excitation maximum for the parent Au25) is low when compared with the emission collected at 330 nm excitation. This clearly establishes energy transfer from the dansyl chromophore to Au25. From the femtosecond-resolved lifetime measurements, a faster decay of fluorescence is observed in both the dansylated products compared to the parent donor (Figure 3). The decay is faster for the exchange product than the reaction product. Note that the chromophore underwent complete quenching in the case of exchange product and hence faster decay. From multi-exponential fitting of the fluorescence transient of the donor, time constants of 0.85 ps (29.6%), 6.40 ps (42.9%) and 39.05 ps (27.5%) are obtained. The time constants are consistent with the reported study on the
ultrafast deactivation pathways of the dansyl fluorophore in bulk methanol. The femtosecond-resolved study on the dansyl chromophore reveals that the sub-picosecond component is due to the ultrafast solvation dynamics in polar environments (water in our case) and other two components are associated with the structural relaxation of the probe. The excited state lifetime of the probe, which is reported to be 9–12 ns is reflected in the offset in the fluorescence decay, does not decay reasonably in our experimental window of 4 ps. The overall average lifetime of the probe of 13.75 ps is also consistent with the previous report.
However, in case of the donor (D)-acceptor (A) system, much shorter components of 0.20 ps (86.8%) and 5.1 ps (13.2%) for the reaction product and 0.15 ps (92.4%) and 3.0 ps (7.6%) for the exchange product are observed. The overall lifetimes of the probe in presence of acceptor Au25 (0.85 ps for reaction product and 0.35 ps for exchange product) reveal significant fluorescence quenching compared to that in donor (13.75 ps).
Fig. 2. Steady state fluorescence spectra of the reaction product. (I) and (II) are the emission spectra obtained when excited at 330 and 535 nm,
respectively showing the same emission maximum. Corresponding excitation spectra for emission at 700 and 550 nm are in (III) and (IV).
The emission at 550 nm is the quenched donor emission. Asterisks correspond to regions where higher order lines of the grating mask the spectrum. (Reprinted with permission from ref. 18. Copyright 2008,
American Chemical Society)
Fig. 3. Femtosecond time-resolved fluorescence transients of (1) D-GSH, (2) reaction and (3) exchange products. The samples were excited at 364 nm and the transients were collected at 500 nm. (Reprinted with permission from ref. 18. Copyright 2008, American Chemical Society)
REPRINT

Tanumoy Mondol, Soma Banerjee, Subrata Batabyal, Samir Kumar Pal
Copyright © 2011 Praise Worthy Prize S.r.l. - All rights reserved International Review of Biophysical Chemistry, Vol. 2, N. 6
216
This indicates that large non-radiative resonance energy transfer has taken place from the dansyl chromophore to Au25. Since the percentage of dansyl glutathione per cluster is only 25, they are expected to be far apart due to steric effects and hence the dipole-dipole coupling within D-D pairs would be negligible. Firstly we have analyzed the energy transfer by FRET. The J(λ) and R0 are determined to be 1.91 × 10¹⁵ M−1 cm−1 nm4
and 41Å, respectively. The D-A separations (r) for the reaction and exchange products are 25.9 Å and 22.2 Å, respectively. This corresponds to a very high efficiency of energy transfer. The theoretically estimated distance between the Au25 cluster and the dansyl chromophore (centre to centre), assuming standard bond lengths is around 23 Å, which matches with the experimental data.
The D-A separations can also be calculated using another prevailing technique NSET. The calculated D-A values using NSET are 19.9 Å and 15.8 Å for the reaction and exchange products, respectively. In either case, the shorter D-A separation for exchange product is because during exchange, some of the glutathione ligands attached to the cluster are removed and dansyl glutathione occupies the space provided, with dansyl group projecting towards the liquid phase. In the reaction product, dansylation is carried out directly on the assembly of glutathione ligands on the cluster surface. Due to steric hindrance, reaction occurs only on those ligands which are farthest from the core and hence therefore a longer D-A distance. In either case, the data reflect the asymmetry in the ligand binding on the metal core, supporting the structures proposed using experiment and theory.
We have also explored the possibility of FRET from point dipole (CdSe/ZnS core-shell type semiconductor quantum dots (QDs)) to surface (silver film) [19]. The photo-excited state behavior of QDs was studied on a plasmonically active silver film using picosecond resolved fluorescence spectroscopy. The study rules out the possibility of charge migration from QDs by comparing the fluorescence transients with a reference system (QDs-Benzoquinone) and demonstrates FRET from QDs to the silver film. Furthermore, the non-validity of nanosurface energy transfer (NSET) [15] is established by measuring the donor-acceptor distance by time resolved fluorescence spectroscopy. The absorption band maxima of the silver thin film at 440nm (Figure 4) is consistent with the presence of silver particles of diameter 10-30nm in the thin film, which makes the film to be plasmonically active. Noble metal film having nano-structure exhibits one very interesting phenomenon known as localize surface plasmon resonance (LSPR) which arises from resonant oscillation of their free electrons in the presence of light. While the locations and photo-luminescence (PL) peaks of the QDs on the thin film are schematically demonstrated in Figure 4. The consequences of the excitonic dynamics of the QDs are evident in Figs. 5. Each PL decay curve was fitted multi-exponentially to achieve lifetimes under various conditions.
Fig. 4. Schematic diagram of FRET from QDs (Lake Placid Blue: LBP; Adirondack Green: AG and Birch Yellow: BY) to silver film (above).
Overlap of the silver absorption with QDs emission (bellow). (Reprinted with permission from ref. 19. Copyright 2011, IOP
Publishing Ltd)
Figs. 5. Picosecond resolved photoluminescence transients of QDs under various conditions. (a) lifetime quenching of QDs by silver film due to energy transfer. (b) Lifetime quenching of QDs in presence of BQ due to electron transfer. (Reprinted with permission from ref. 19.
Copyright 2011, IOP Publishing Ltd) Table I comprises of the detail time-resolved lifetimes
of the QDs. It is clearly evident from the Figs. 5 and Table I, that the PL dynamics of QDs become significantly faster on the metal film compared to that on the quartz surface, which could be consequences of either nonradiative energy transfer or photo-induced charge transfer to the host film. From the Figs. 5 and Table I, it is also evident that QDs in presence of BQ offer much
REPRINT

Tanumoy Mondol, Soma Banerjee, Subrata Batabyal, Samir Kumar Pal
Copyright © 2011 Praise Worthy Prize S.r.l. - All rights reserved International Review of Biophysical Chemistry, Vol. 2, N. 6
217
faster PL dynamics compared to those on the metal film. Strong lifetime quenching of QDs in presence of BQ is typical example of excited state interfacial charge migration from QDs to BQ, the well-known electron shuttle which pumps the excited electron out from semiconductor conduction band [20]-[21].
The nonradiative energy transfer could be justified by the strong spectral overlap between the QDs emission with the LSPR band of silver film. The efficiency of the FRET for the various QDs on the metal film is depicted in Figures 5 and Table I, and found to be in excellent agreement with the estimated values. The FRET efficiency goes on decreasing from LBP to BY with increase of donor-acceptor distance. The effective donor-acceptor distances which are the distances [22] from the center of the QDs to the contact point of the QDs to the film are consistent with the estimated distances from the diameter of the QDs and the length of the capping ligand TOPO (0.8-1nm).
The non-validity of NSET was also confirmed by calculating the donor – acceptor distance assuming NSET model as described under methods materials section. The insignificantly less possibility of electron transfer from the QDs to the metal surface can be justified from the formation of a Schottky barrier [23] in the semiconductor metal junction. The equilibrium contact potentials; V0 which is the order of 0.26eV is higher enough to prevent the net electron transfer from semiconductor conduction band to metal side.
II.6. NMR Spectroscopy 1H-NMR experiments were performed on caffeine,
EtBr and a mixture of the two (titrations) samples in aqueous phosphate buffer at pH 7.2 (Watergate solvent suppression) using a Bruker DRX 500 MHz spectrometer. 1H-signals were assigned either by comparing with literature or by performing TOCSY and NOESY / ROESY experiments using standard protocols.
II.7. Fluorescence Microscopy
Fluorescence micrographs were taken using Olympus BX51 fluorescence microscope connected with DP72 microscope digital camera. Olympus fluorescence microscope is equipped with various sets of fluorescence mirror unit combined with appropriate filters, which are variable depending on wavelengths. The fluorescence mirror unit, which matches the fluorochrome in use, was selected. The micrographs were analyzed with analySIS Five image analysis software provided with the microscope.
III. Results and Discussions III.1. Biomolecular Recognition of Small Ligand/Drug
Molecules
This section investigates the fundamental physical
processes involved in the biomolecular recognition of some drug molecules like rifampicin (Rf) [24]-[25], Warfarin (Wf), some DNA minor groove binders like Hoechst 33258 (H258) along with the DNA intercalators like ethidium bromide (EtBr) by biomacromolecules. Moreover, the effect of temperature on the molecular recognition of several ligands (4-(dicyanomethylene)-2-methyl-6-(p-dimethylaminostyryl)-4H-pyran (DCM) and Nile blue (NB)) by human serum albumin (HSA) has also been investigated [26].
Our studies on simultaneous recognition of two different ligands by DNA have importance in drug designing, since it provides information on the compatibility of various drugs and their effect on a ligand-bound DNA [27].
III.1.1. Interaction of an Anti-Tuberculosis Drug with a Biomimetic System and a Human Transporter
Protein
Biomimetic systems very often resemble the structural properties of biomolecules (protein surface). However, the association between a ligand molecule and a biomimetic system is governed by nonspecific interaction unlike ligand-biomacromolecular system (both specific and nonspecific mode of interaction). In this regard, a detailed study of the interaction between a ligand (here, anti-tuberculosis drug Rf) and a biomimetic system (sodium dodecyl sulfate; SDS micelle) is essential prior to entering in the real biomacromolecular system.
Besides, the inescapable necessity and poor solubility of Rf in water also necessitates a drug carrier (SDS biomimetic system) system [28]-[32]. In this perspective, this work is dedicated to investigate the interaction between Rf and SDS micelle and the effect of temperature on the association. The binding of Rf to SDS micelle is evident from the Conductometric and CD spectroscopic studies (data not shown).
To confirm the association of Rf to the SDS micelle, another fluorescent dye H258, bound to the SDS micelle, has been utilized.
The emission spectrum of the dye H258 in buffer shows a peak at 505 nm, which becomes blue shifted in hydrophobic environment (475 nm in SDS micelles) [33] as shown in Figure 6(a).
The binding of the donor drug H258 to the micelle is confirmed by time resolved anisotropy study. The fluorescence anisotropy, r(t), which can decay in time due to the rotational motion of the molecules and consequently leads to depolarization of the fluorescence can be fitted to single exponential decay function to determine the rotational time constant (τrot) of the probe molecule (H258) [13].
The τrot value is found to be 2.3ns (inset of Figure 6(b)) when bound to the micelle and 0.53ns only in buffer. The absorption spectrum of Rf broadly overlaps with the emission of H258 bound to the SDS micelle (Figure 6(a)).
REPRINT

Tanumoy Mondol, Soma Banerjee, Subrata Batabyal, Samir Kumar Pal
Copyright © 2011 Praise Worthy Prize S.r.l. - All rights reserved International Review of Biophysical Chemistry, Vol. 2, N. 6
218
TABLE I LIFE TIME OF QDS IN DIffERENT CONDITIONS ALONG WITH OBSERVED AND CALCULATED FRET EFFICIENCY
(REPRINTED WITH PERMISSION FROM REF. 19. COPYRIGHT 2011, IOP PUBLISHING LTD) Sample τ1(ns) τ2(ns) τ3(ns) τav(ns) R0(nm) J(λ)×1014 FRETEXP FRETCAL
QD(LPB;3.2nm) 0.15(26%) 4.08(11%) 18.20(63%) 12 QD-silver 0.15(64%) 1.72(24%) 8.60(12%) 1.54 3.6 3.67 87% 89% QD-BQ 0.07(79%) 0.70(15%) 4.15(06%) 0.41
QD(AG;4.4nm) 0.29(27%) 2.89(27%) 9.74(46%) 5.29 QD-silver 0.18 (59%) 2.20(26%) 8.10(15%) 1.90 3.56 3.41 64% 64% QD-BQ 0.03(94%) 0.88(06%) 0.08
QD(BY;5.2nm) 0.17(29%) 3.74(19%) 15.20(52%) 8.63 QD-silver 0.13(36%) 0.87(22%) 11.00(42%) 4.80 3.5 3.06 35% 36% QD-BQ 0.06(86%) 0.57(12%) 4.34(02%) 0.23
TABLE II
TEMPERATURE DEPENDENT FLUORESCENCE LIFETIMES (ΤI) AND THEIR RESPECTIVE AMPLITUDES (AMP %), ROTATIONAL TIME CONSTANT [ΤROT], FÖRSTER RESONANCE ENERGY TRANSFER (FRET) EFFICIENCY (E) AND FRET DISTANCE (R) OF H258 (H-SDS) IN SDS MICELLE AND H258 (H-SDS-
RF) IN SDS MICELLE - RIFAMPICIN (RF) COMPLEX. THE SYSTEMS WERE EXCITED AT 375 NM AND DECAY COLLECTED AT 475 NM. (REPRINTED WITH PERMISSION FROM REF. 24. COPYRIGHT 2011, AMERICAN CHEMICAL SOCIETY)
Systems Temp (oC) τi (ns) (amp %) τav (ns) [τrot] (ns) E (%) r (Å)
H-SDS 20 4.1 (81%) 0.05 (19%) 3.8 2.4 - -
H-SDS-Rf 20 3.3 (16%)
0.91 (29%) 0.16 (55%)
0.8 - 76 33
H-SDS 25 4.0 (84%) 1.6 (12%) 0.17 (4%)
3.5 2.3 - -
H-SDS-Rf 25 3.5 (19%)
0.93 (30%) 0.10 (51%)
0.9 - 72 34
H-SDS 45 3.9 (65%)
1.61 (23%) 0.08 (12%)
2.9 1.2 - -
H-SDS-Rf 45 3.4 (21%)
0.87 (28%) 0.09 (51%)
1.0 - 65 36
H-SDS 55 3.8 (61%)
1.59 (29%) 0.08 (10%)
2.8 1 - -
H-SDS-Rf 55 3.2 (26%)
0.85 (28%) 0.08 (46%)
1.1 - 60 37
The decrease in steady state and time resolved
emission of H258, bound to the micellar system, upon addition of Rf is shown in the inset of Figure 6(a) and Figure 6(b) respectively. The efficiency of energy transfer is calculated to be 72%. The estimated Förster distance (R0), and donor (H258)-acceptor (Rf) distance are found to be 40 Å and 34 Å respectively (at 25°C). The observation indicates simultaneous binding of the two drugs to the micelle at room temperature. In order to study the thermal stability of the drug binding to the SDS micelle, we have performed picosecond resolved temperature dependent FRET experiments, as shown in Figure 7. From the temperature dependent fluorescence anisotropy of the donor H258 bound to the micelle, it is evident that the dynamics of anisotropy becomes faster with increasing temperature. Decrease in energy transfer efficiency and increase in donor (H258)-acceptor (Rf) distance with increasing temperature is evident from Table II.
In this section, we will discuss about the molecular recognition of Rf by real biomacromolecule, which is human serum albumin (HSA), one of the model carrier
protein in human plasma. Although Rf is one of the most effective antibiotics against infection caused by Mycobacterium tuberculosis [34], interaction of the drug with universal carrier protein in human blood plasma is not fully understood. Reduction of medicinal efficacy of other drugs, including anti-thrombosis drug Warfarin (Wf), to the patients on Rf therapy [35]-[36] also needs molecular understanding. Therefore, we have studied the interaction of Rf with HSA. By using circular dichroism (CD) spectroscopy, we have characterized the change in the secondary structure of the protein upon addition of Rf. The model transporter protein (HSA) used in our study has a distinct CD characteristic [37]-[38] owing to its α−helical content in its secondary structure which makes CD spectroscopy a suitable tool to study the effect of Rf on the protein as a function of its structural changes. CD studies have been done on the protein and protein – Rf complexes in order to investigate the possibility of any structural change of the protein upon complexation with the drug. Figure 8 shows the CD spectra of HSA with various drug concentrations in phosphate buffer at pH 7.
REPRINT

Tanumoy Mondol, Soma Banerjee, Subrata Batabyal, Samir Kumar Pal
Copyright © 2011 Praise Worthy Prize S.r.l. - All rights reserved International Review of Biophysical Chemistry, Vol. 2, N. 6
219
Figs. 6. (a) Steady state absorption spectrum of Rifampicin (RF) (Violet) and emission spectrum of H258-SDS (SDS-H; green) are
shown. An overlapping zone between emission of H258 and absorption of acceptor RF is indicated as yellow shaded zone. Inset shows the steady state emission of SDS-H258 (SDS-H) and SDS-RF-H258 complex (SDS-RF-H). (b) The picosecond resolved fluorescence
transients of SDS-H258 (SDS-H), in absence (green) and in presence (red) of acceptor RF. Inset shows the fluorescence anisotropy, r(t) of
SDS-H258 (SDS-H) complex. Excitation wavelength was 375 nm and data collected at 475 nm wavelength. (Reprinted with permission from
ref. 24. Copyright 2011, American Chemical Society).
On complexation with Rf, there is no peak shift of the CD bands (208 nm and 222 nm, characteristic of α-helix) of HSA but there is definitely a decrease in the band intensity. As shown in the inset of Figure 8, the quantitative analysis using CDNN software [39], indicates that the complexation of Rf to HSA has induced significant decrease in the α-helix content of the protein. For native protein, at 20°C, we have obtained 65 % of α – helix, which is in close agreement to the previously reported values [37]-[38]. However, in presence of 10 µM Rf (Fig. 8), the amount of α – helix decreases to 48.1 %. The association constant between Rf and HSA is found to be 3.46 X 10⁵ M-1.
In order to estimate the binding site of the Rf on the model transporter protein HSA, we have explored the possibility of using FRET. In Figure 9(a) the emission from the single tryptophan (Trp214) of HSA and the absorption spectrum of Rf are shown. A significant spectral overlap, as indicated by yellow shaded region, is evident from the figure.
As apparent from the spectral overlap, Trp214 and Rf could, unambiguously, form a FRET pair and same is depicted in the inset of Figure 9(a), which shows the steady state Trp214 fluorescence emission quenching in presence of Rf. However, we have recognized that the quenching of the Trp214 residue in the protein upon complexation with the drug Rf is not dynamic in nature.
Figs. 7. The picosecond resolved fluorescence transients of H-SDS (H258-SDS), in absence (green) and in presence (red) of acceptor RF
(excitation at 375 nm) at (a) 20oC. Inset shows the fluorescence anisotropy, r(t) of H-SDS complex at 20oC; (b) 55oC. Inset shows the fluorescence anisotropy, r(t) of H-SDS complex at 55oC. (Reprinted with permission from ref. 24. Copyright 2011, American Chemical
Society)
Fig. 8. CD spectra of HSA in various concentrations of the drug Rf in aqueous buffer (pH=7). The inset of the graph shows the decrease of α-
helical content of the protein upon complexation with the drug. (Reprinted with permission from ref. 25. Copyright 2011, Elsevier) It has also been reported in literature that the
quenching of the tryptophan residue of HSA, in presence of a different derivative of Rf, is not dynamic in nature [40].
Negligibly small dipolar interaction of Trp214 with Rf is clearly evident from the Fig. 9(b). The fluorescence transients of Trp214 in absence and presence of the drug Rf reveals similar fluorescence dynamics indicating the energy transfer from Trp214 to Rf to be radiative; not non-radiative resonance type. Thus application of FRET in order to estimate the distance between Trp214 and Rf is misleading.
REPRINT

Tanumoy Mondol, Soma Banerjee, Subrata Batabyal, Samir Kumar Pal
Copyright © 2011 Praise Worthy Prize S.r.l. - All rights reserved International Review of Biophysical Chemistry, Vol. 2, N. 6
220
Figs. 9. (a) Normalized fluorescence of HSA and absorption extinction coefficient of Rf. Inset shows the steady state fluorescence emission of HSA (in red) and quenching of emission of HSA in presence of Rf (in
green). (b) Picosecond-resolved fluorescence decay of HSA and of HSA in presence of Rf. Instrument response is shown in black.
Excitation wavelength of 299 nm has been used for both the experiments. (Reprinted with permission from ref. 25. Copyright 2011,
Elsevier) Our observation clearly justifies the exploration of an
alternative FRET donor for the characterization of Rf binding to the protein. In order to study the binding of Rf to the protein, we have explored the possibility of using Wf as potential energy donor. The anti-thrombosis drug Wf binds to the protein at the site I [41]-[42]. There are several studies [43]-[44] on the FRET from Trp214 of HSA to the protein-bound Wf, because of a large spectral overlap of the emission of Trp214 with the absorption spectrum of Wf, as also shown in Figure 10(a). As a consequence, steady-state emission of Trp214 in the presence of Wf shows significant quenching as shown in inset of Figure 10(a). Apparent “strong” dipolar coupling of Trp214 with the Wf is evident from Figure 10(b). Faster fluorescence transient of HSA-Wf complex at 360 nm (excitation 299 nm), compared to that of the protein (Trp214 alone), apparently is indicative of the FRET from Trp214 to the Wf moiety. The excitation spectra of the HSA-Wf complex with various detection wavelengths are shown in Fig. 10(c).
It is evident from the figure that contribution of the Wf (UV – visible absorption peak at 310 nm) at the detection wavelength of 360 nm is significant, but at the detection wavelength of 420 nm and longer, there is minimum contribution arising from the Trp214. Therefore, in order to measure the excited state lifetime of the donor Wf bound to HSA, the detection wavelength of 420 nm would be optimum, because at the detection wavelength greater than 420 nm the fluorescence intensity of Wf decreases significantly.
Figs. 10. (a) Normalized fluorescence intensity of HSA (in red) and absorption extinction coefficient of Wf (in black). The emission spectra
of HSA (in red), Wf (in black) and Wf bound HSA (in green) are shown in the inset. (b) Picosecond-resolved fluorescence decay at 360
nm of HSA (in red) and of HSA in presence of Wf (in blue). Instrument response is shown in black. Excitation wavelength of 299 nm has been
used for both the experiments. (c) Excitation spectra of HSA – Wf complex with detection wavelengths at 360nm, 385nm, 420 nm and 460 nm. (Reprinted with permission from ref. 25. Copyright 2011,
Elsevier) The distance between Trp214 and Wf is found to be
12.1 Å. The spectral overlap of the HSA-Wf emission with the absorption of the HSA-bound Rf is shown in Fig. 11(a). The inset shows the steady-state emission quenching of the Wf in HSA upon complexation with Rf. The dipolar interaction of the Wf with Rf is confirmed from the faster fluorescence transient (Figure 11(b)) of HSA-Wf complex upon binding with Rf. The estimated R0 is 25.8 Å and the distance between the Wf and the Rf is found to be 28.1 Å. The estimated average distance between the Wf binding site (located at domain IIA of the protein) and domain IIIA, as well as IB is 27.2 ± 0.1 Å. The calculated FRET distance is 28.1 Å, which is quite close to the value corresponding to the distance from domain IIA to both the hydrophobic drug binding domains, IB and IIIA. Hence, simultaneous binding of the two drugs evidently rules out the possibility of competitive binding of the drugs.
REPRINT

Tanumoy Mondol, Soma Banerjee, Subrata Batabyal, Samir Kumar Pal
Copyright © 2011 Praise Worthy Prize S.r.l. - All rights reserved International Review of Biophysical Chemistry, Vol. 2, N. 6
221
Figs. 11. (a) Spectral overlap between Wf emission complexed with HSA and Rf absorbance. Inset shows the fluorescence emission
intensity of Wf complexed with HSA (in green) and of the same in presence of Rf (in red). (b) Picosecond-resolved fluorescence decay at
420 nm of HSA in presence of Wf (in green) and that of HSA-Wf complex in presence of Rf (in red). Instrument response is shown in black. Excitation wavelength of 299 nm has been used for both the
steady state and time resolved experiments. (Reprinted with permission from ref. 25. Copyright 2011, Elsevier)
Thus the molecular basis of the reduced effectiveness
of the drug Wf on the patients on Rf therapy could be due to the structural perturbation of the host transporter protein.
III.1.2. Temperature-Dependent Molecular Recognition of DCM and NB by Human Serum Albumin (HSA)
Here, we focus our study to inspect the influence of temperature on the recognition of ligands by HSA. HSA is a soluble protein in our circulatory system, which is known to bind a variety of drugs and ligands. Despite knowing about the ligand-binding properties and specific residues important for the binding of specific drugs, less is understood about the temperature dependent molecular recognition by the protein. Picosecond-resolved Fӧrster resonance energy transfer (FRET) studies along with steady-state and polarization-gated spectroscopy on the ligands in the protein reveal the dynamics of the binding sites at various temperatures. The environmental relaxation dynamics of the DCM binding sites at various temperatures is investigated through time-resolved solvation dynamics. In order to investigate the nature of dynamics of the local environment of DCM in HSA at different temperatures, we have studied the solvation relaxation of the probe in HSA at different temperatures. DCM is a well-known solvation probe for proteins [45].
The constructed temperature-dependent solvent correlation functions are shown in Fig. 12(a). At room temperature the correlation function shows a bi-exponential decay with time constants of 0.3 and 3.8 ns.
The faster time constant of 0.3 ns is consistent with the rigidly trapped water molecules in the cavity, and the relatively longer time constant of 3.8 ns is the reflection of the relaxation of the excited state of the probe by polar residues of the protein. At higher temperature the overall solvation dynamics of the probe becomes faster, which is consistent with the fact that labile water molecules enter into the cavity of the protein at elevated temperatures. At 50°C, as the protein unfolds water molecules can intrude into the cavity of HSA resulting in an increase in the faster component. The physical motion of the probe DCM in the HSA cavity is reflected in the temporal decays of the fluorescence anisotropy at different temperatures (Fig. 12(b)-(d)). The decay at room temperature (Fig. 12(b)) shows a time constant of 11 ns, indicating the tumbling motion of the probe in the hydrophobic moiety of the protein. The relatively high rotational time constant value at 25°C confirms the possible location of DCM deep inside the hydrophobic cavity. At higher temperatures, the time constants become faster, which might be due to the penetration of water into the DCM binding site of HSA (domain IIIA) at elevated temperatures. The observation is consistent with higher polarity in the binding site of DCM at elevated temperature as also evidenced from the red shift in the emission spectrum of HSA bound DCM at elevated temperature (data not shown). Red shift of the steady state emission and faster anisotropy decay profile of Nile Blue (NB) bound to HSA also reveal the higher polarity in the binding site of NB at elevated temperature (data not shown). In order to measure the inter-ligand distance between DCM and NB simultaneously bound to the protein, we have used the FRET technique. Figure 13(a) shows the normalized DCM (donor) emission and NB (acceptor) absorption in HSA at room temperature. Figure 13(b) shows the emission of the donor and that of the donor-acceptor complex indicating to the fact that emission from the donor gets quenched due to the absorption by the acceptor. This quenching of the donor emission is further evident from the faster donor lifetime of the donor-acceptor (DCM-NB) complex compared to that of the donor (DCM) itself in the protein (Figure 13(c)). The Fӧrster distance, R0, for the system is calculated to be 3.0 nm. Thus it can be confirmed that the NB binds to subdomain IIB at room temperature, which is 3 nm away from the DCM binding site (subdomain IIIA).
III.1.3. Simultaneous Recognition of a Minor Groove Binder and an Intercalator by Genomic and
Dodecamer DNA
The motive of this work is to study the molecular recognition of a potent mutagenic intercalator by a DNA, which is already hosting a minor groove binding drug.
REPRINT

Tanumoy Mondol, Soma Banerjee, Subrata Batabyal, Samir Kumar Pal
Copyright © 2011 Praise Worthy Prize S.r.l. - All rights reserved International Review of Biophysical Chemistry, Vol. 2, N. 6
222
Figs. 12. (a) Solvent correlation function, C(t), of HSA-bound DCM in 50 mM phosphate buffer at different temperatures. Time-resolved anisotropy, r(t), of HSA-bound DCM in 50 mM phosphate buffer at (b) 25, (c) 50, and (d) 75°C. (Reprinted with permission from ref. 26. Copyright 2008,
American Chemical Society) In this study, EtBr and H258 have been used as the
model intercalator and minor groove binder, respectively. FRET is effectively used in this study to explore the interaction of two drug molecules with DNA. Figure 14(a) shows that there is sufficient spectral overlap between the emission spectrum of the H258 (donor) and the absorption spectrum of the EtBr (acceptor) in 100 µM salmon sperm DNA. The concentration of the EtBr (10 µM) has been chosen so as to ensure maximum intercalation of the dye (considering one ethidium molecule intercalates per 10 base pairs [46]). On the addition of acceptor (EtBr) molecules to H258-DNA solution, there is no shift in the emission maxima of the probe H258 compared to that of the H258-DNA complex without EtBr, indicating that the donor is still bound to the DNA. The binding of the ethidium molecules to DNA is confirmed by the 22 ns component in the temporal fluorescence decay characterizing the DNA environment [46] (inset of Figure 14(c)). The quenching of the fluorescence intensity (Figure 14(b)) coupled with the appearance of faster components in the decay (Figure 14(c)) of the H258 in the presence of EtBr in the DNA suggests considerable energy transfer from the donor to the acceptor molecule. It has been suggested in a previous study [47] that the donor and acceptor molecules in the genomic DNA cannot assume random orientations with respect to each other. Thus, the value of ĸ2, which takes into account the relative orientation of the donor and acceptor transition dipoles [13], cannot be taken as 0.667, the value in the random orientation condition. In accordance with the above-mentioned study, the calculated value of R0, using a ĸ2 value of 1.2, is found to be 3.23 nm. Analysis of the temporal decays
of the donor and the donor-acceptor complex in the genomic DNA show that 5% of the DNA-bound donor is not involved in energy transfer, 51% transfers energy to the acceptor with an efficiency of 97.75%, 25% transfers energy to the acceptor with an efficiency of 84.55%, and the remaining 17% undergoes energy transfer with an efficiency of 50.79%.
The corresponding distances are estimated to be 1.77, 2.50, and 3.30 nm. It has been shown that the center of the H258 (donor) is situated at a distance of 0.4 nm from the helix axis [48]. The probability of energy transfer between donor and acceptor molecules bound to different DNA strands (inter-DNA energy transfer) has been checked by a control experiment.
In the experiment, two separate solutions, one containing the donor (H258) bound to genomic DNA and another containing the acceptor (EtBr) bound to genomic DNA, are mixed.
The temporal decay of the resultant solution shows no faster component associated with energy transfer. The result indicates that there is no inter-DNA energy transfer.
In order to verify whether the intercalator EtBr and groove binder H258 can bind to the same region of the DNA, the FRET studies are carried out in the dodecamer DNA. In a solution containing both the dyes H258 and EtBr in dodecamer DNA, the dye H258 shows emission maxima at 460 nm, characteristic of minor groove binding (Figure 15(b)), whereas the dye EtBr shows the 22 ns component at 620 nm, indicative of intercalation (inset of Fig. 15(c)). Fig. 15(a) shows the spectral overlap between the emission spectra of the donor and the absorption spectra of the acceptor in the dodecamer.
REPRINT

Tanumoy Mondol, Soma Banerjee, Subrata Batabyal, Samir Kumar Pal
Copyright © 2011 Praise Worthy Prize S.r.l. - All rights reserved International Review of Biophysical Chemistry, Vol. 2, N. 6
223
Figs. 13. (a) Spectral overlap of the donor (DCM) and acceptor (NB) in HSA at 25 °C. (b) Emission spectrum of HSA-bound DCM in the
absence and presence of the acceptor NB at 25 °C. (c) Time-resolved normalized fluorescence transients of HSA-bound DCM in the absence and presence of the acceptor NB at 25 °C. (Reprinted with permission
from ref. 26. Copyright 2008, American Chemical Society) The quenching of fluorescence intensity (Fig. 15(b))
along with the faster temporal decay (Figure 15(c)) in the H258-EtBr complex relative to that of the H258 in the dodecamer suggests energy transfer between the two molecules.
To confirm that the energy transfer takes place between the dye molecules bound to a single dodecamer, a control experiment is performed. As a control, two separate solutions, one containing the donor (H258) bound to dodecamer DNA and another containing the acceptor (EtBr) bound to dodecamer DNA, are mixed.
The temporal decay of the resultant solution shows no faster component associated with energy transfer. The result confirms that the energy transfer is indeed intra-DNA. The difference between the temporal decays of the H258-EtBr complex in genomic (Figure 14(c)) and dodecamer (Figure15(c)) DNA clearly points out the difference in binding of these two dyes to the different types of DNA. In the synthesized DNA, the molecules H258 and EtBr attain a definite geometry relative to each other.
Figs. 14. (a) Spectral overlap of H258 and EtBr in 100 µM (base pair) genomic DNA. The emission spectrum (b) and the temporal decay (c) of H258 (1 µM) and H258-EtBr ([EtBr] = 10 µM) in genomic DNA. (Reprinted with permission from ref. 27. Copyright 2007, American
Chemical Society) The transition dipole moment of EtBr is inclined 75°
with respect to the helix axis [49]. The transition dipole of the minor groove binding drug, H258, is perpendicular to the long axis of the minor groove, which in turn makes an angle of 51° with the helix axis. The transition dipoles of the donor-acceptor pair thus make an angle of 66° with respect to each other. Using these results, the value of ĸ2 is estimated to be 0.04 and the R0 value is calculated to be 1.91 nm. It is calculated that 21% of the donor molecules are not involved in energy transfer. The loss of efficiency of FRET of the donor in the close proximity of the acceptor in the dodecamer is a clear indication of a smaller value of ĸ2 compared to those in the genomic DNA. From this study, it is also clear that 60% of the donor molecules show an energy transfer efficiency of 96.47% to the acceptor situated at 0.92 nm (two base pairs away from the donor), whereas the remaining 17% transfer energy to an acceptor located at 1.95 nm with an efficiency of 50.12%. The distance of 1.95 nm, which is five base pairs away from the acceptor, reveals that the acceptor molecules are intercalated at the ends of the dodecamer.
REPRINT

Tanumoy Mondol, Soma Banerjee, Subrata Batabyal, Samir Kumar Pal
Copyright © 2011 Praise Worthy Prize S.r.l. - All rights reserved International Review of Biophysical Chemistry, Vol. 2, N. 6
224
It is worthwhile to mention that if the value of ĸ2 is taken as 1.2, the calculated donor-acceptor distances are 1.92 and 3.37 nm. The distance of 3.37 nm indicates that the H258 and EtBr are separated by a distance of 10 base pairs. The result is unphysical because in the dodecamer DNA the maximum distance from the center of the helix is 2.07 nm (six base pairs). Considering the random orientation of the transition dipoles of the donor- acceptor (ĸ2= 0.667), the calculated donor-acceptor distance of 3.06 nm also has no physical significance. Thus it is revealed that the use of the calculated value of the orientation parameter (ĸ2= 0.04) is crucial for the estimation of the distance between the donor and acceptor bound to the dodecamer.
III.2. Biomolecular Recognition in Presence of a Metabolic Stimulant and other Interfering
Biomolecules
Here, we focus our study on the effect of a widely consumed stimulant drug, caffeine in the biomolecular recognition of a DNA intercalator as well as a potential mutagen [9]. Furthermore, for the better understanding of molecular recognition in vivo, where biomolecules act as parts of complex biomolecular assemblies, we have studied how biomolecular recognition gets affected in presence of other intervening biomacromolecules [50]. Our studies on the correlation of sequence dependent molecular recognition with hydration dynamics in the minor groove of DNA and Histone-DNA complex suggest the possible difference between a drug action in vivo and in vitro [51].
III.2.1. Effect of a Stimulant Drug, Caffeine in the Molecular Recognition of Mutagenic Ethidium by
DNA
One of our recent studies involve the caffeine mediated dissociation of mutagenic ethidium from synthetic DNA and various cell nuclei [9]. Caffeine (1,3,7-trimethylxanthine) is in a class of molecules with conjugated planer ring systems that constitute the most widely distributed naturally occurring methylxanthines and regularly consumed by human beings from various dietary sources (e.g. coffee, tea, cola beverages, chocolates). This study has used steady state and picosecond resolved fluorescence spectroscopy and time gated fluorescence microscopy in order to investigate the detachment of mutagenic ethidium (Et) from synthesized DNA of specific sequences in vitro and various types of cell lines including squamous epithelial cells collected from the inner lining of the human mouth, A549 (lung carcinoma), A375 (human skin), RAW (macrophage) and Vero (African green monkey kidney epithelium) cells in ex vivo conditions. As shown in the Figure 16(a), Et in water produces an emission peak at 623 nm (excited at 409 nm). In presence of 100 mM caffeine, the peak exhibits a blue shift to 615 nm with a subsequent increase in the intensity. The blue shift of the emission
peak signifies a hydrophobic environment experienced by Et, which might be due to the caffeine-Et hetero-association as evidenced by some previous works [46]. When completely intercalated in the DNA oligomer at [DNA]:[Et] = 8:1, the emission of Et exhibits substantial blue shift to produce the fluorescence maximum at 600 nm with an order of magnitude increase in the intensity with respect to that in water. The observed blue shift and enhanced intensity is due to strong intercalation of Et into the hydrophobic interior of the DNA [46]. As 100 mM caffeine solution is added into the DNA-Et complex, the emission intensity decreases with a little red shift to 605 nm. The red shift can be explained in terms of the de-intercalative property of caffeine that releases certain amount of Et from the DNA bound state either to the caffeine bound state or to the free form in the buffer. A similar picture evolves from the time resolved study (Figure 16(b)). Et in buffer shows single exponential fluorescence decay with a time constant of 1.6 ns which is close to the earlier reported values [46]. In caffeine solution the decay pattern becomes bi-exponential with time constants of 2.3 ns (15.5%) and 7 ns (84.5%). When intercalated in DNA, the decay pattern of Et emission gets considerably slower with time constants of 1.5 ns (2%) and 21 ns (98%). The insignificant contribution of the fast component in the transient confirms the presence of a very low fraction of Et free in buffer. On the other hand the longer time component (21 ns) is assigned to the lifetime of Et molecules intercalated to DNA. When 100 mM caffeine is added to Et-DNA complex the decay process becomes faster and can only be fitted tri-exponentially with time constants of 1.8 ns (4%), 7 ns (22%) and 23 ns (74%). These time constants can easily be identified with those of Et in buffer, hetero-association with caffeine and intercalation with DNA, respectively. The tri-exponential nature of the decay pattern signifies the presence of at least three different environment of residence of Et in the solution. If the contribution from each environment is assumed to add up linearly in the total decay process, then it can be inferred that addition of caffeine reduces the fraction of Et molecules bound to DNA from 98% to 74% and the released Et mostly gets bound to caffeine as indicated by the 7 ns component (22%) and a small fraction (2%) goes into the buffer. We have also studied the solvation dynamics of caffeine which imparts such interactive property with xanthine alkaloids. To ascertain the dynamical states of water molecules associated with the caffeine dimer (caffeine exists as dimer in water), the femtosecond resolved fluorescence spectra of DCM in caffeine solution has been measured [52]. In order to ensure high signal to noise ratio, the transients at 80oC have been measured where the caffeine solubility is high enough (900 mM) to provide high signal from the fluorophore.
The probe at such elevated temperature found to be highly stable. Figure 17(a) depicts the femtosecond resolved transients in the blue end (560 nm), peak (620 nm) and in the red end (700 nm).
REPRINT

Tanumoy Mondol, Soma Banerjee, Subrata Batabyal, Samir Kumar Pal
Copyright © 2011 Praise Worthy Prize S.r.l. - All rights reserved International Review of Biophysical Chemistry, Vol. 2, N. 6
225
Figs. 15. (a) Spectral overlap of H258 and EtBr in 70 µM (base pair) synthesized DNA. The emission spectrum (b) and the temporal decay (c) of H258 (1 µM) and H258-EtBr ([EtBr] = 6 µM) in synthesized DNA. (Reprinted with permission from ref. [27]. Copyright 2007,
American Chemical Society)
Figure 16. (a) Steady state emission of ethidium in various environments. (b) Time resolved fluorescence transients of ethidium
(from bottom) in buffer, caffeine ([caffeine] = 100 mM), DNA ([DNA]:[Et] = 8:1) in presence and absence of caffeine. (Reprinted with permission from ref. 9. Copyright 2011, American Chemical
Society)
Figs. 17. (a) Femtosecond resolved fluorescence transient of DCM in 900 mM caffeine at 80oC at three characteristic wavelengths. (b)
Solvation correlation function, C(t) of the corresponding sample. The solid line is exponential fit. The bigger inset shows the time-resolved emission spectra (TRES) along with the anisotropy (smaller inset) of the same sample. (Reprinted with permission from ref. 52. Copyright
2011, Springer Science+Business media, LLC) As can be observed from the figure, the transient in
the blue end can be fitted tri-exponentially with three decay components of 0.46 ps (86%), 22.7 ps (11%) and 519 ps (3%). On the other hand, the red end transient exhibits a distinct rise component of 0.94 ps with a decay component of 510 ps.
This is a clear indication of the solvation of the dye. Fig. 17(b) shows the solvent correlation function, C(t) against time which is well fitted bi-exponentially with time constants of 0.6 ps (82%) and 5.85 ps (18%). The observed C(t) decay is much slower than that of the pure water [53] (126 fs (20%) and 880 fs (35%)) wherein about half of the solvation process occurs in a time scale of experimental time resolution of 30 fs. On the other hand these time scales are rather comparable [54] or faster [55] in reverse micelles or micelles [11] confirming the finding that caffeine is aggregated as dimers in aqueous solution and with a rather weakly structured water network around it.
The smaller inset inside Fig. 17(b) inset shows fluorescence anisotropy of DCM at 80oC in 900 mM caffeine solution. The transient can be fitted single exponentially with a time constant of 0.33 ns. Since DCM is extremely insoluble in water and its solubility in aqueous caffeine solution is only possible due to its confinement inside caffeine dimer, the rotational time constant obtained for the probe actually signifies the time required for rotation of the caffeine in dimeric form. In view of the fact that the anisotropic time scale is much
REPRINT
Tanumoy Mondol, Soma Banerjee, Subrata Batabyal, Samir Kumar Pal
Copyright © 2011 Praise Worthy Prize S.r.l. - All rights reserved International Review of Biophysical Chemistry, Vol. 2, N. 6
226
longer compared to the obtained solvation time scales of the same sample it can be concluded that the solvation time scales obtained reflects the dynamics of the bound water around the caffeine dimer and not due to the dynamics of caffeine dimer close to one another at such a high concentration (900 mM). Therefore, the solvation time scales associated with caffeine dimer indicates weakly structured water around the caffeine dimer which is responsible for its mode of interaction with Et.
We have explored the mode of interaction between caffeine and Et using NMR spectroscopy. All observable protons in Et and caffeine were assigned and were followed in a NMR experiment where 1.78 mM Et was titrated with caffeine. The changes in the chemical shift of Et protons (∆δobs = δwith caffeine - δno caffeine) are shown in Fig. 18(a). All proton signals (the Et CH2 signal overlapped with H2O signal and was not monitored) exhibited a hyperbolic change indicating Et-caffeine binding. Changes in ∆δobs of individual 1H-chemical resonances in Et, upon titration with caffeine, were fitted with the following equation for obtaining the association constant [56] Ka ([C]T and [E]T are the total concentrations of caffeine and Et respectively and ∆δmax is the value of ∆δobs for a large excess of [C]T):
[ ]
[ ] [ ]( )
[ ] [ ]( ){ }[ ] [ ]
2
2
1
124
obs
a T Tmax
a T Ta T
a T T
K C E
K C EK EK C E
δ
δ
∆ =
⎡ ⎤+ + +⎢ ⎥⎢ ⎥∆ ⎡ ⎤= + + +⎢ ⎥⎢ ⎥−⎢ ⎥⎢ ⎥⎢ ⎥−⎢ ⎥⎣ ⎦⎣ ⎦
(12)
As can be observed from Figure 18(a), Ka values were
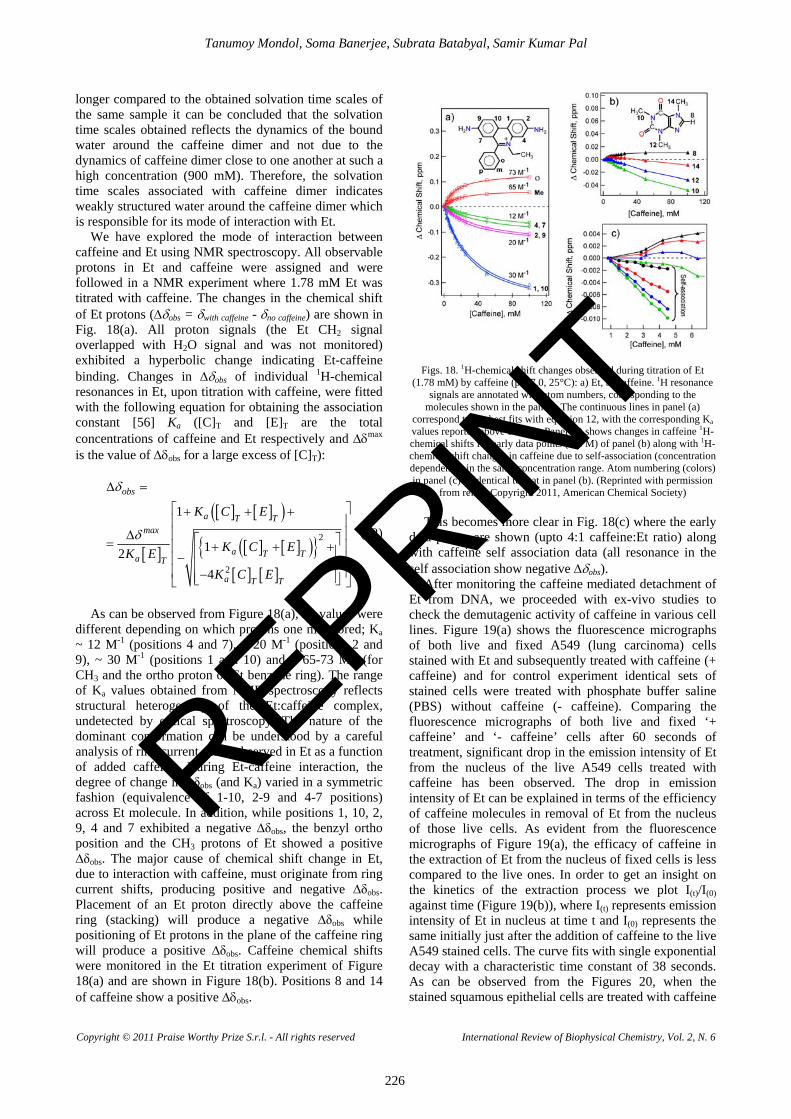
different depending on which protons one monitored; Ka ~ 12 M-1 (positions 4 and 7), ~ 20 M-1 (positions 2 and 9), ~ 30 M-1 (positions 1 and 10) and ~ 65-73 M-1 (for CH3 and the ortho proton of Et benzene ring). The range of Ka values obtained from NMR spectroscopy reflects structural heterogeneity of the Et:caffeine complex, undetected by optical spectroscopy. The nature of the dominant conformation can be understood by a careful analysis of ring current shifts observed in Et as a function of added caffeine. During Et-caffeine interaction, the degree of change in ∆δobs (and Ka) varied in a symmetric fashion (equivalence of 1-10, 2-9 and 4-7 positions) across Et molecule. In addition, while positions 1, 10, 2, 9, 4 and 7 exhibited a negative ∆δobs, the benzyl ortho position and the CH3 protons of Et showed a positive ∆δobs. The major cause of chemical shift change in Et, due to interaction with caffeine, must originate from ring current shifts, producing positive and negative ∆δobs. Placement of an Et proton directly above the caffeine ring (stacking) will produce a negative ∆δobs while positioning of Et protons in the plane of the caffeine ring will produce a positive ∆δobs. Caffeine chemical shifts were monitored in the Et titration experiment of Figure 18(a) and are shown in Figure 18(b). Positions 8 and 14 of caffeine show a positive ∆δobs.
Figs. 18. 1H-chemical shift changes observed during titration of Et (1.78 mM) by caffeine (pH 7.0, 25°C): a) Et, b) caffeine. 1H resonance
signals are annotated with atom numbers, corresponding to the molecules shown in the panels. The continuous lines in panel (a)
correspond to the best fits with equation 12, with the corresponding Ka values reported above each fit. Panel (c) shows changes in caffeine 1H-chemical shifts for early data points (0-6 M) of panel (b) along with 1H-chemical shift changes in caffeine due to self-association (concentration dependence) in the same concentration range. Atom numbering (colors) in panel (c) is identical to that in panel (b). (Reprinted with permission
from ref. 9. Copyright 2011, American Chemical Society) This becomes more clear in Fig. 18(c) where the early
data points are shown (upto 4:1 caffeine:Et ratio) along with caffeine self association data (all resonance in the self association show negative ∆δobs).
After monitoring the caffeine mediated detachment of Et from DNA, we proceeded with ex-vivo studies to check the demutagenic activity of caffeine in various cell lines. Figure 19(a) shows the fluorescence micrographs of both live and fixed A549 (lung carcinoma) cells stained with Et and subsequently treated with caffeine (+ caffeine) and for control experiment identical sets of stained cells were treated with phosphate buffer saline (PBS) without caffeine (- caffeine). Comparing the fluorescence micrographs of both live and fixed ‘+ caffeine’ and ‘- caffeine’ cells after 60 seconds of treatment, significant drop in the emission intensity of Et from the nucleus of the live A549 cells treated with caffeine has been observed. The drop in emission intensity of Et can be explained in terms of the efficiency of caffeine molecules in removal of Et from the nucleus of those live cells. As evident from the fluorescence micrographs of Figure 19(a), the efficacy of caffeine in the extraction of Et from the nucleus of fixed cells is less compared to the live ones. In order to get an insight on the kinetics of the extraction process we plot I(t)/I(0) against time (Figure 19(b)), where I(t) represents emission intensity of Et in nucleus at time t and I(0) represents the same initially just after the addition of caffeine to the live A549 stained cells. The curve fits with single exponential decay with a characteristic time constant of 38 seconds. As can be observed from the Figures 20, when the stained squamous epithelial cells are treated with caffeine
REPRINT

Tanumoy Mondol, Soma Banerjee, Subrata Batabyal, Samir Kumar Pal
Copyright © 2011 Praise Worthy Prize S.r.l. - All rights reserved International Review of Biophysical Chemistry, Vol. 2, N. 6
227
(+ caffeine), Et is released from the nucleus at a very fast rate. The intensity of red colour of the cells gets blurred with time which indicates release of Et from the nucleus. In control experiment (- caffeine) cells retain almost the entire amount of Et in their nucleus. In order to highlight the de-intercalative property of caffeine in a more quantitative manner, the intensity of the red colour of Et from cell nucleus, which is proportional to the amount of Et present, has been plotted at regular time interval for both the systems (‘- caffeine’ and ‘+ caffeine’) where the x-coordinate represents distance in the horizontal plane where the cell lies (Figure 20(a)). As evident from the figure the intensity of red colour is considerably high at the position that corresponds to the cell nucleus and it falls rapidly after 8 seconds (blue line) upon treatment with caffeine solution, whereas a negligible change is produced in control set (- caffeine) within the same time scale (Figure 20(a), inset). After 18 seconds, ‘+ caffeine’ cells show negligible amount of Et left in their nucleus (green line) while no significant change has been observed in ‘- caffeine’ cells. As a control study to rule out the possibility of cell disruption upon treatment with caffeine, the cell images (Figure 20(b), lower left inset) have been taken under bright field before and after treating them with caffeine and no change has been observed even after 5 minutes. In addition, the cell nuclei have been stained with a fluorescent dye, DAPI and found that cell nuclei remain intact over the same time span upon treatment with caffeine. Furthermore, the membrane integrity of the cells got checked by staining them with another fluorescent dye, merocyanine 540 and results show that the cell membranes remain unperturbed upon treatment with caffeine. The plot of I(t)/I(0) against time (Figure 20(b)), gives the characteristic time constant for extraction of Et from these cells by caffeine as 8 seconds.
III.2.2. Differential Molecular Recognition of ANS and TNS by α-Chymotrypsin in Presence of Genomic
DNA
The motive of this study is to explore the change in biomolecular recognition of ligand molecules by protein after complex formation with genomic DNA as quite often biomolecules interact with each other in real biological system, inside the cell. In this regard, we have studied the interaction of 8-anilino-1-naphthalenesulfonic acid (ANS) and 2,6-p-toluidinonaphthalene sulfonate (TNS) with α-Chymotrypsin (CHT) in absence and in presence of DNA [50]. An extensive fluorescence study followed by an X-ray crystallographic study [57] on the ANS–CHT complex indicates that ANS binds rigidly at a single site on the surface of the protein near the Cys-1-122 disulfide bond whereas it has been proposed by several groups that TNS binds to the hydrophobic sites at the protein surface [58]. Steady-state and picosecond-resolved fluorescence studies reveal the displacement of TNS from TNS-labeled CHT upon complexation with DNA (data not shown).
Figs. 19. (a) Fluorescence micrographs of both live and fixed Et stained A549 cells initially and after 60 seconds upon treatment with caffeine (+ caffeine) along with the control sets (- caffeine) treated with PBS without caffeine. (b) Rate of leaching out of Et from nucleus of live
A549 lung carcinoma cells when treated with caffeine. It and Io represent the emission intensity of Et at time t and initially,
respectively. (Reprinted with permission from ref. [9]. Copyright 2011, American Chemical Society)
Figs. 20. (a) Reduction in intensity of red colour with time when squamous epithelial cells treated with caffeine and PBS as control (inset). (b) Rate of leaching out of Et from nucleus of squamous epithelial cells when treated with caffeine. It and Io represents the
emission intensity of Et at time t and initially, respectively. Upper right inset shows the fluorescence micrographs of Et stained same cells initially, after 8 seconds and after 18 seconds upon treatment with
caffeine along with the control sets. Lower left inset shows the morphology of the same cell line before and after 5 minutes upon
caffeine treatment under bright field (I) and fluorescence micrographs of the same stained with DAPI (II) and Merocyanine 540 (III).
(Reprinted with permission from ref. [9]. Copyright 2011, American Chemical Society)
REPRINT
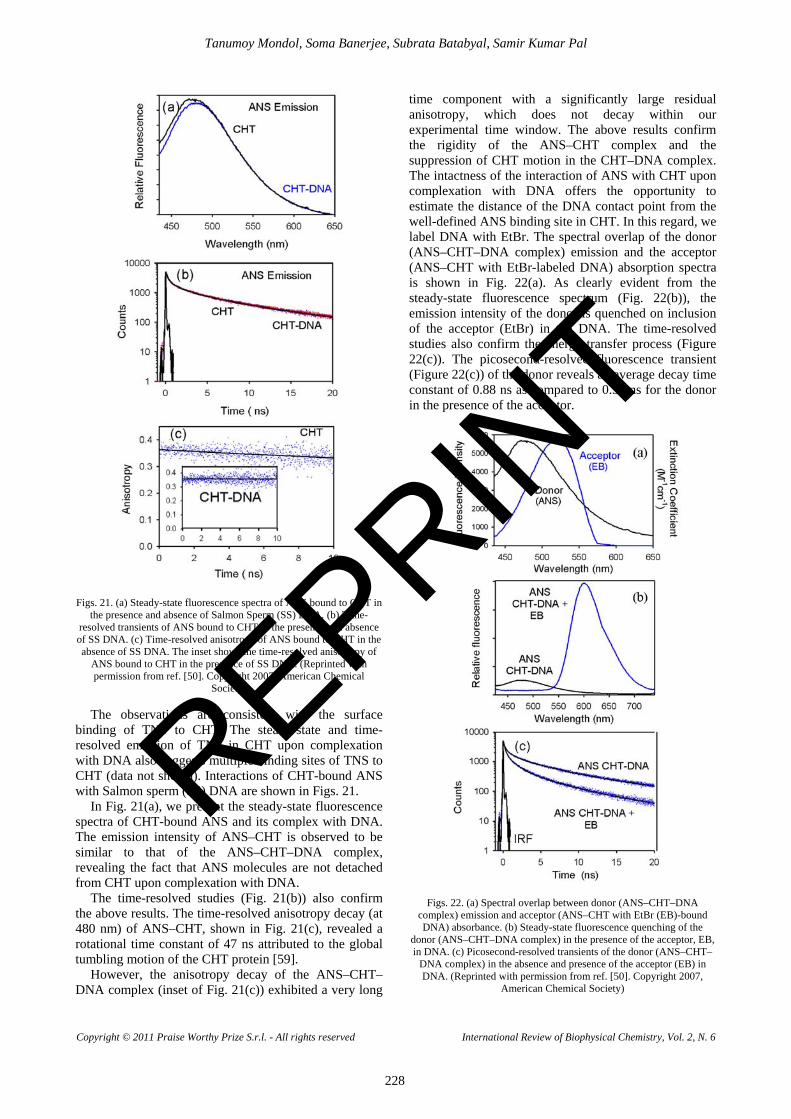
Tanumoy Mondol, Soma Banerjee, Subrata Batabyal, Samir Kumar Pal
Copyright © 2011 Praise Worthy Prize S.r.l. - All rights reserved International Review of Biophysical Chemistry, Vol. 2, N. 6
228
Figs. 21. (a) Steady-state fluorescence spectra of ANS bound to CHT in the presence and absence of Salmon Sperm (SS) DNA. (b) Time-
resolved transients of ANS bound to CHT in the presence and absence of SS DNA. (c) Time-resolved anisotropy of ANS bound to CHT in the absence of SS DNA. The inset shows the time-resolved anisotropy of
ANS bound to CHT in the presence of SS DNA. (Reprinted with permission from ref. [50]. Copyright 2007, American Chemical
Society) The observations are consistent with the surface
binding of TNS to CHT. The steady-state and time-resolved emission of TNS in CHT upon complexation with DNA also suggests multiple binding sites of TNS to CHT (data not shown). Interactions of CHT-bound ANS with Salmon sperm (SS) DNA are shown in Figs. 21.
In Fig. 21(a), we present the steady-state fluorescence spectra of CHT-bound ANS and its complex with DNA. The emission intensity of ANS–CHT is observed to be similar to that of the ANS–CHT–DNA complex, revealing the fact that ANS molecules are not detached from CHT upon complexation with DNA.
The time-resolved studies (Fig. 21(b)) also confirm the above results. The time-resolved anisotropy decay (at 480 nm) of ANS–CHT, shown in Fig. 21(c), revealed a rotational time constant of 47 ns attributed to the global tumbling motion of the CHT protein [59].
However, the anisotropy decay of the ANS–CHT–DNA complex (inset of Fig. 21(c)) exhibited a very long
time component with a significantly large residual anisotropy, which does not decay within our experimental time window. The above results confirm the rigidity of the ANS–CHT complex and the suppression of CHT motion in the CHT–DNA complex. The intactness of the interaction of ANS with CHT upon complexation with DNA offers the opportunity to estimate the distance of the DNA contact point from the well-defined ANS binding site in CHT. In this regard, we label DNA with EtBr. The spectral overlap of the donor (ANS–CHT–DNA complex) emission and the acceptor (ANS–CHT with EtBr-labeled DNA) absorption spectra is shown in Fig. 22(a). As clearly evident from the steady-state fluorescence spectrum (Fig. 22(b)), the emission intensity of the donor is quenched on inclusion of the acceptor (EtBr) in the DNA. The time-resolved studies also confirm the energy-transfer process (Figure 22(c)). The picosecond-resolved fluorescence transient (Figure 22(c)) of the donor reveals an average decay time constant of 0.88 ns as compared to 0.54 ns for the donor in the presence of the acceptor.
Figs. 22. (a) Spectral overlap between donor (ANS–CHT–DNA complex) emission and acceptor (ANS–CHT with EtBr (EB)-bound DNA) absorbance. (b) Steady-state fluorescence quenching of the
donor (ANS–CHT–DNA complex) in the presence of the acceptor, EB, in DNA. (c) Picosecond-resolved transients of the donor (ANS–CHT–
DNA complex) in the absence and presence of the acceptor (EB) in DNA. (Reprinted with permission from ref. [50]. Copyright 2007,
American Chemical Society)
REPRINT
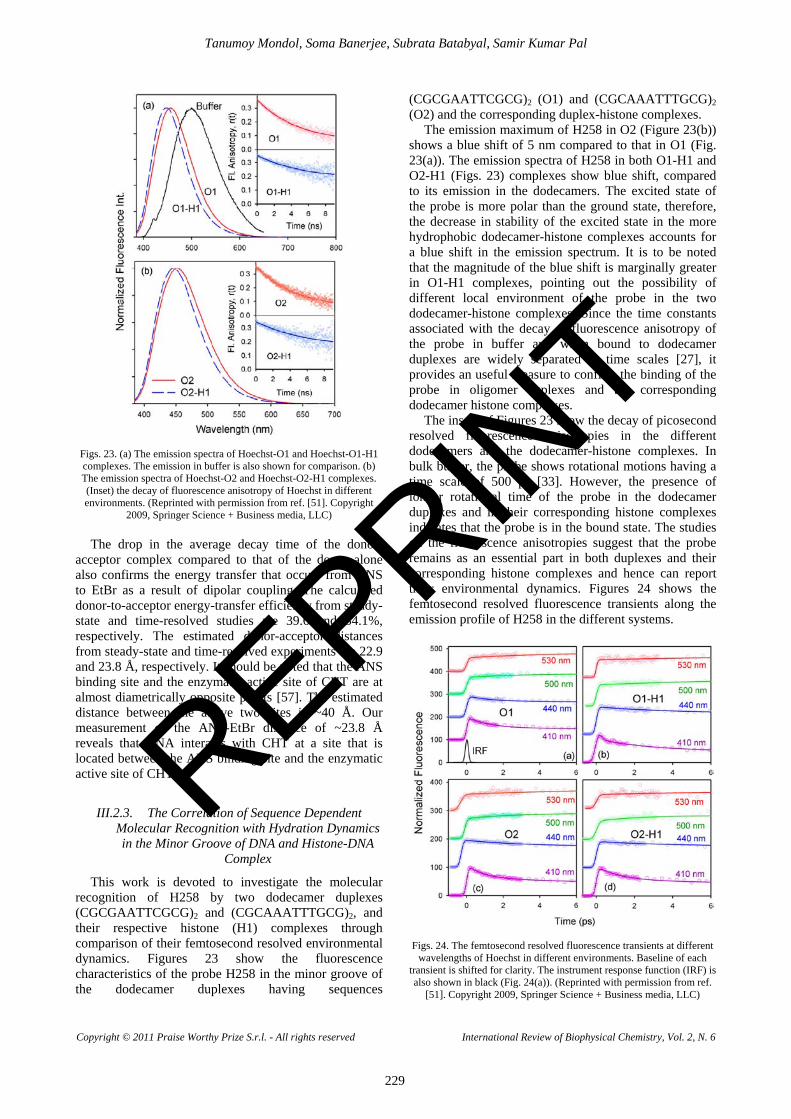
Tanumoy Mondol, Soma Banerjee, Subrata Batabyal, Samir Kumar Pal
Copyright © 2011 Praise Worthy Prize S.r.l. - All rights reserved International Review of Biophysical Chemistry, Vol. 2, N. 6
229
Figs. 23. (a) The emission spectra of Hoechst-O1 and Hoechst-O1-H1 complexes. The emission in buffer is also shown for comparison. (b) The emission spectra of Hoechst-O2 and Hoechst-O2-H1 complexes. (Inset) the decay of fluorescence anisotropy of Hoechst in different environments. (Reprinted with permission from ref. [51]. Copyright
2009, Springer Science + Business media, LLC) The drop in the average decay time of the donor-
acceptor complex compared to that of the donor alone also confirms the energy transfer that occurs from ANS to EtBr as a result of dipolar coupling. The calculated donor-to-acceptor energy-transfer efficiency from steady-state and time-resolved studies are 39.6 and 34.1%, respectively. The estimated donor-acceptor distances from steady-state and time-resolved experiments are 22.9 and 23.8 Å, respectively. It should be noted that the ANS binding site and the enzymatic active site of CHT are at almost diametrically opposite points [57]. The estimated distance between the above two sites is ~40 Å. Our measurement of the ANS-EtBr distance of ~23.8 Å reveals that DNA interacts with CHT at a site that is located between the ANS binding site and the enzymatic active site of CHT.
III.2.3. The Correlation of Sequence Dependent Molecular Recognition with Hydration Dynamics in the Minor Groove of DNA and Histone-DNA
Complex
This work is devoted to investigate the molecular recognition of H258 by two dodecamer duplexes (CGCGAATTCGCG)2 and (CGCAAATTTGCG)2, and their respective histone (H1) complexes through comparison of their femtosecond resolved environmental dynamics. Figures 23 show the fluorescence characteristics of the probe H258 in the minor groove of the dodecamer duplexes having sequences
(CGCGAATTCGCG)2 (O1) and (CGCAAATTTGCG)2 (O2) and the corresponding duplex-histone complexes.
The emission maximum of H258 in O2 (Figure 23(b)) shows a blue shift of 5 nm compared to that in O1 (Fig. 23(a)). The emission spectra of H258 in both O1-H1 and O2-H1 (Figs. 23) complexes show blue shift, compared to its emission in the dodecamers. The excited state of the probe is more polar than the ground state, therefore, the decrease in stability of the excited state in the more hydrophobic dodecamer-histone complexes accounts for a blue shift in the emission spectrum. It is to be noted that the magnitude of the blue shift is marginally greater in O1-H1 complexes, pointing out the possibility of different local environment of the probe in the two dodecamer-histone complexes. Since the time constants associated with the decay of fluorescence anisotropy of the probe in buffer and when bound to dodecamer duplexes are widely separated in time scales [27], it provides an useful measure to confirm the binding of the probe in oligomer duplexes and the corresponding dodecamer histone complexes.
The insets of Figures 23 show the decay of picosecond resolved fluorescence anisotropies in the different dodecamers and the dodecamer-histone complexes. In bulk buffer, the probe shows rotational motions having a time scale of 500 ps [33]. However, the presence of longer rotational time of the probe in the dodecamer duplexes and in their corresponding histone complexes indicates that the probe is in the bound state. The studies on the fluorescence anisotropies suggest that the probe remains as an essential part in both duplexes and their corresponding histone complexes and hence can report their environmental dynamics. Figures 24 shows the femtosecond resolved fluorescence transients along the emission profile of H258 in the different systems.
Figs. 24. The femtosecond resolved fluorescence transients at different wavelengths of Hoechst in different environments. Baseline of each
transient is shifted for clarity. The instrument response function (IRF) is also shown in black (Fig. 24(a)). (Reprinted with permission from ref.
[51]. Copyright 2009, Springer Science + Business media, LLC)
REPRINT
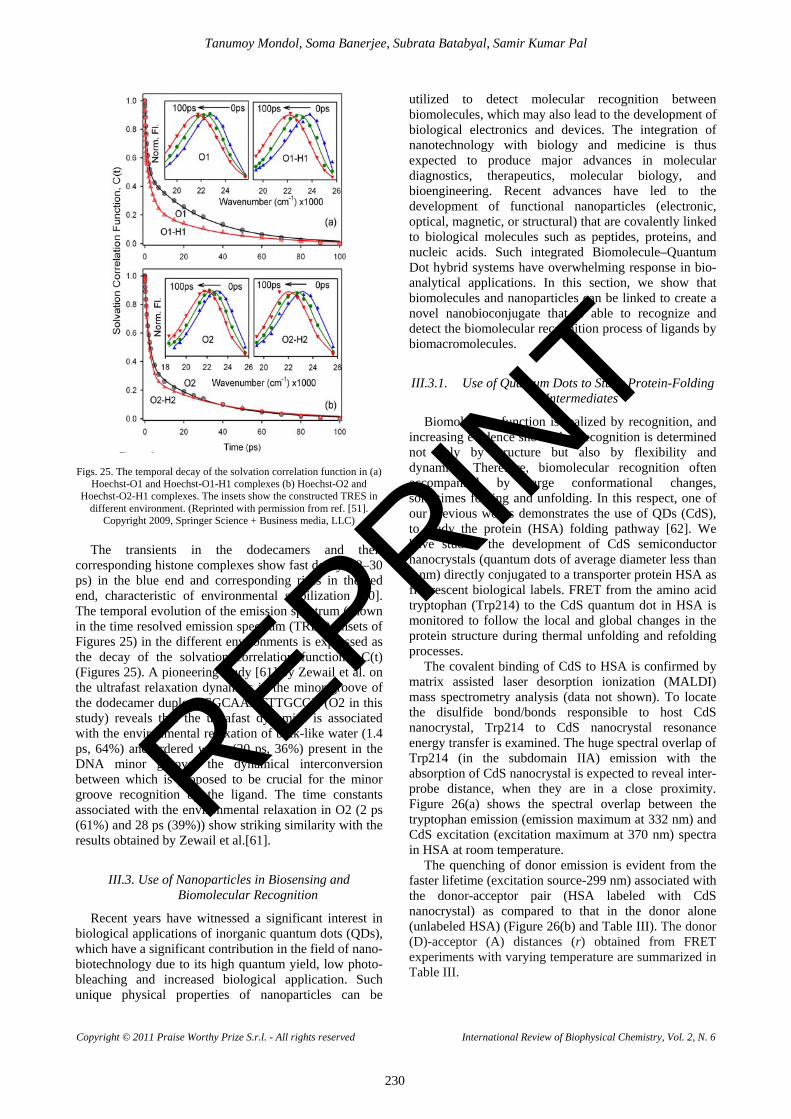
Tanumoy Mondol, Soma Banerjee, Subrata Batabyal, Samir Kumar Pal
Copyright © 2011 Praise Worthy Prize S.r.l. - All rights reserved International Review of Biophysical Chemistry, Vol. 2, N. 6
230
Figs. 25. The temporal decay of the solvation correlation function in (a) Hoechst-O1 and Hoechst-O1-H1 complexes (b) Hoechst-O2 and
Hoechst-O2-H1 complexes. The insets show the constructed TRES in different environment. (Reprinted with permission from ref. [51].
Copyright 2009, Springer Science + Business media, LLC) The transients in the dodecamers and their
corresponding histone complexes show fast decays (2–30 ps) in the blue end and corresponding rises in the red end, characteristic of environmental stabilization [60]. The temporal evolution of the emission spectrum (shown in the time resolved emission spectrum (TRES), insets of Figures 25) in the different environments is expressed as the decay of the solvation correlation functions, C(t) (Figures 25). A pioneering study [61] by Zewail et al. on the ultrafast relaxation dynamics in the minor groove of the dodecamer duplex (CGCAAATTTGCG)2 (O2 in this study) reveals that the ultrafast dynamics is associated with the environmental relaxation of bulk-like water (1.4 ps, 64%) and ordered water (20 ps, 36%) present in the DNA minor groove, the dynamical interconversion between which is proposed to be crucial for the minor groove recognition by the ligand. The time constants associated with the environmental relaxation in O2 (2 ps (61%) and 28 ps (39%)) show striking similarity with the results obtained by Zewail et al.[61].
III.3. Use of Nanoparticles in Biosensing and Biomolecular Recognition
Recent years have witnessed a significant interest in biological applications of inorganic quantum dots (QDs), which have a significant contribution in the field of nano-biotechnology due to its high quantum yield, low photo-bleaching and increased biological application. Such unique physical properties of nanoparticles can be
utilized to detect molecular recognition between biomolecules, which may also lead to the development of biological electronics and devices. The integration of nanotechnology with biology and medicine is thus expected to produce major advances in molecular diagnostics, therapeutics, molecular biology, and bioengineering. Recent advances have led to the development of functional nanoparticles (electronic, optical, magnetic, or structural) that are covalently linked to biological molecules such as peptides, proteins, and nucleic acids. Such integrated Biomolecule–Quantum Dot hybrid systems have overwhelming response in bio-analytical applications. In this section, we show that biomolecules and nanoparticles can be linked to create a novel nanobioconjugate that is able to recognize and detect the biomolecular recognition process of ligands by biomacromolecules.
III.3.1. Use of Quantum Dots to Study Protein-Folding Intermediates
Biomolecular function is realized by recognition, and increasing evidence shows that recognition is determined not only by structure but also by flexibility and dynamics. Therefore, biomolecular recognition often accompanied by large conformational changes, sometimes folding and unfolding. In this respect, one of our previous works demonstrates the use of QDs (CdS), to study the protein (HSA) folding pathway [62]. We have studied the development of CdS semiconductor nanocrystals (quantum dots of average diameter less than 2 nm) directly conjugated to a transporter protein HSA as fluorescent biological labels. FRET from the amino acid tryptophan (Trp214) to the CdS quantum dot in HSA is monitored to follow the local and global changes in the protein structure during thermal unfolding and refolding processes.
The covalent binding of CdS to HSA is confirmed by matrix assisted laser desorption ionization (MALDI) mass spectrometry analysis (data not shown). To locate the disulfide bond/bonds responsible to host CdS nanocrystal, Trp214 to CdS nanocrystal resonance energy transfer is examined. The huge spectral overlap of Trp214 (in the subdomain IIA) emission with the absorption of CdS nanocrystal is expected to reveal inter-probe distance, when they are in a close proximity. Figure 26(a) shows the spectral overlap between the tryptophan emission (emission maximum at 332 nm) and CdS excitation (excitation maximum at 370 nm) spectra in HSA at room temperature.
The quenching of donor emission is evident from the faster lifetime (excitation source-299 nm) associated with the donor-acceptor pair (HSA labeled with CdS nanocrystal) as compared to that in the donor alone (unlabeled HSA) (Figure 26(b) and Table III). The donor (D)-acceptor (A) distances (r) obtained from FRET experiments with varying temperature are summarized in Table III.
REPRINT
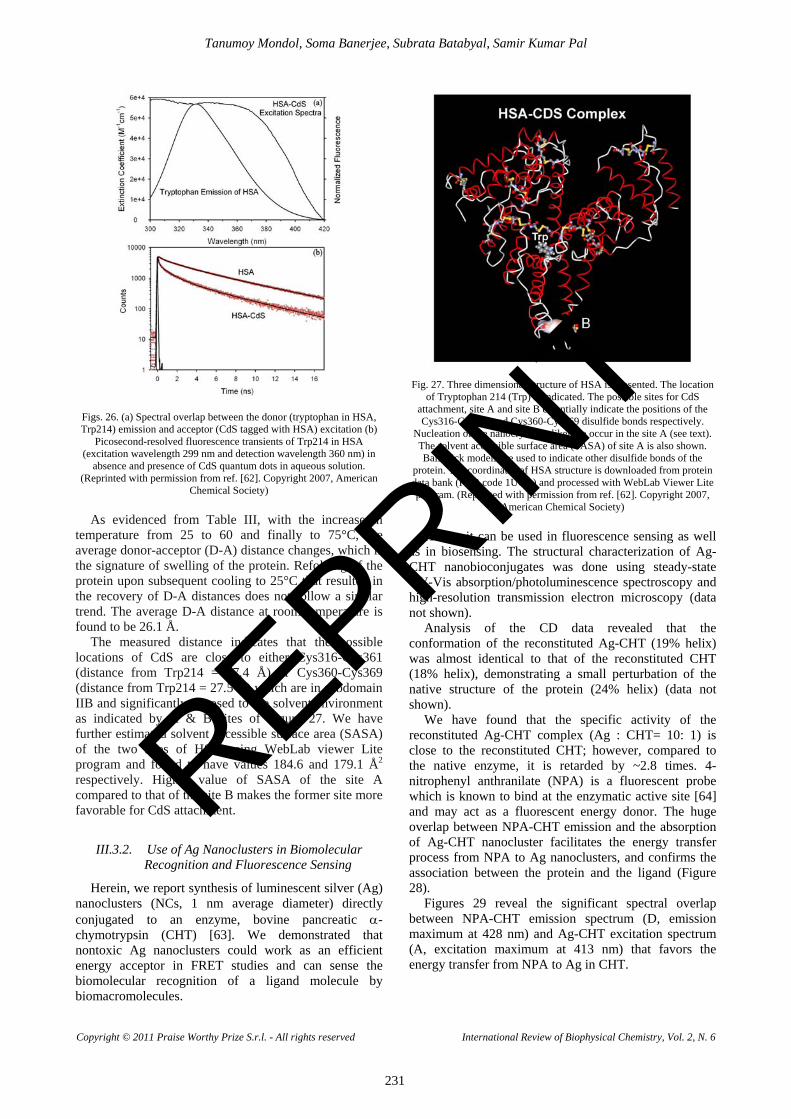
Tanumoy Mondol, Soma Banerjee, Subrata Batabyal, Samir Kumar Pal
Copyright © 2011 Praise Worthy Prize S.r.l. - All rights reserved International Review of Biophysical Chemistry, Vol. 2, N. 6
231
Figs. 26. (a) Spectral overlap between the donor (tryptophan in HSA, Trp214) emission and acceptor (CdS tagged with HSA) excitation (b)
Picosecond-resolved fluorescence transients of Trp214 in HSA (excitation wavelength 299 nm and detection wavelength 360 nm) in
absence and presence of CdS quantum dots in aqueous solution. (Reprinted with permission from ref. [62]. Copyright 2007, American
Chemical Society) As evidenced from Table III, with the increase in
temperature from 25 to 60 and finally to 75°C, the average donor-acceptor (D-A) distance changes, which is the signature of swelling of the protein. Refolding of the protein upon subsequent cooling to 25°C that resulted in the recovery of D-A distances does not follow a similar trend. The average D-A distance at room temperature is found to be 26.1 Å.
The measured distance indicates that the possible locations of CdS are close to either Cys316-Cys361 (distance from Trp214 = 27.4 Å) or Cys360-Cys369 (distance from Trp214 = 27.5 Å) which are in subdomain IIB and significantly exposed to the solvent environment as indicated by A & B sites of Figure 27. We have further estimated solvent accessible surface area (SASA) of the two sites of HSA using WebLab viewer Lite program and found to have values 184.6 and 179.1 Å2 respectively. Higher value of SASA of the site A compared to that of the site B makes the former site more favorable for CdS attachment.
III.3.2. Use of Ag Nanoclusters in Biomolecular Recognition and Fluorescence Sensing
Herein, we report synthesis of luminescent silver (Ag) nanoclusters (NCs, 1 nm average diameter) directly conjugated to an enzyme, bovine pancreatic α-chymotrypsin (CHT) [63]. We demonstrated that nontoxic Ag nanoclusters could work as an efficient energy acceptor in FRET studies and can sense the biomolecular recognition of a ligand molecule by biomacromolecules.
Fig. 27. Three dimensional structure of HSA is presented. The location of Tryptophan 214 (Trp) is indicated. The possible sites for CdS
attachment, site A and site B essentially indicate the positions of the Cys316-Cys361 and Cys360-Cys369 disulfide bonds respectively.
Nucleation of the nanocrystal is likely to occur in the site A (see text). The solvent accessible surface area (SASA) of site A is also shown. Ball-stick models are used to indicate other disulfide bonds of the
protein. The coordinates of HSA structure is downloaded from protein data bank (PDB code 1UOR) and processed with WebLab Viewer Lite program. (Reprinted with permission from ref. [62]. Copyright 2007,
American Chemical Society) Hence, it can be used in fluorescence sensing as well
as in biosensing. The structural characterization of Ag-CHT nanobioconjugates was done using steady-state UV-Vis absorption/photoluminescence spectroscopy and high-resolution transmission electron microscopy (data not shown).
Analysis of the CD data revealed that the conformation of the reconstituted Ag-CHT (19% helix) was almost identical to that of the reconstituted CHT (18% helix), demonstrating a small perturbation of the native structure of the protein (24% helix) (data not shown).
We have found that the specific activity of the reconstituted Ag-CHT complex (Ag : CHT= 10: 1) is close to the reconstituted CHT; however, compared to the native enzyme, it is retarded by ~2.8 times. 4-nitrophenyl anthranilate (NPA) is a fluorescent probe which is known to bind at the enzymatic active site [64] and may act as a fluorescent energy donor. The huge overlap between NPA-CHT emission and the absorption of Ag-CHT nanocluster facilitates the energy transfer process from NPA to Ag nanoclusters, and confirms the association between the protein and the ligand (Figure 28).
Figures 29 reveal the significant spectral overlap between NPA-CHT emission spectrum (D, emission maximum at 428 nm) and Ag-CHT excitation spectrum (A, excitation maximum at 413 nm) that favors the energy transfer from NPA to Ag in CHT.
REPRINT

Tanumoy Mondol, Soma Banerjee, Subrata Batabyal, Samir Kumar Pal
Copyright © 2011 Praise Worthy Prize S.r.l. - All rights reserved International Review of Biophysical Chemistry, Vol. 2, N. 6
232
TABLE III HELIX-CONTENT, PICOSECOND-RESOLVED FLUORESCENCE TRANSIENTS AND ENERGY TRANSFER PARAMETERS OF HSA BEFORE AND AFTER
LABELING WITH CDS NANOCRYSTAL. HERE QD, R0 AND R DENOTE QUANTUM YIELD OF THE DONOR IN ABSENCE OF THE ACCEPTOR, FÖRSTER DISTANCE AND DONOR-ACCEPTOR (D-A) DISTANCE RESPECTIVELY.
(REPRINTED WITH PERMISSION FROM REF. [62]. COPYRIGHT 2007, AMERICAN CHEMICAL SOCIETY) Systems Temperature α-helix content (%) τ1 in ns (%) τ2 in ns (%) τ3 in ns (%) QD R0(Å) r(Å)
HSA 25°C 69.7 0.23(18.1) 1.65(23.6) 5.99(58.3) 60°C 58.4 0.15(29.4) 1.46(31.3) 4.56(39.3) 75°C 45.9 0.11(40.8) 1.15(32.6) 3.82(26.6)
60°C (reverse) 49.4 0.09(45.5) 1.08(30.3) 3.69(24.2) 25°C (reverse) 60.5 0.13(36.7) 1.23(30.0) 4.63(33.3)
HSA-CdS 25°C 76.4 0.08(73.8) 1.45(16.6) 5.99(9.6) 0.097 32.1 26.1 60°C 66.9 0.08(72.4) 1.12(20.6) 4.56(7.0) 0.092 32.9 27.7 75°C 58.8 0.07(69.8) 0.92(24.0) 3.82(6.2) 0.087 31.6 28.6
60°C (reverse) 55.2 0.06(72.9) 0.89(20.0) 3.69(7.1) 0.091 33.0 30.4 25°C (reverse) 60.4 0.05(75.9) 1.02(15.3) 4.63(8.8) 0.091 33.0 28.8
As revealed from Figures 29 the overall steady-state
emission intensity of the donor emission drastically decreased in the presence of acceptor. Also, the faster decay of donor in the presence of acceptor (Fig. 29(c)) as compared to that of the donor alone confirms the energy transfer from NPA to Ag cluster in CHT. The calculated donor to acceptor energy transfer efficiency from steady state and time-resolved studies are 97.5% and 60.7% respectively.
The estimated donor-acceptor distances from steady-state and time-resolved experiments are 19.1 and 32.6 Å, respectively. Therefore, possible nucleation sites (D-A distance of 32.6 Å) for the formation of Ag NCs in CHT could be free amine groups from the amino acid residues or the thiols at the protein surface, which could have been easily generated by the reduction of disulfide bonds by NaBH4 [65]. These functional groups (thiols and amines) have the ability to bind covalently with the silver particle surface, leading to the formation of nanobioconjugates.
Fig. 28. Structure of α-chymotrypsin depicting the catalytic triad (His57, Asp102 and Ser195), NPA chromophore binding site and
luminescent Ag nanocluster (covalently attached at a site away from catalytic center). (Reprinted with permission from ref. [63]. Copyright
2008, American Chemical Society)
III.3.3. Use of Functionalized QDs (CdSe/ZnS) in Biomolecular Recognition
In this study, CdSe/ZnS QDs have been utilized to investigate the biomolecular association between DNA
and a DNA intercalator (EtBr). Femtosecond-resolved fluorescence upconversion and picosecond-resolved spectroscopic measurements have been employed to confirm a highly efficient ultrafast FRET from 3-mercaptopropionic acid (MPA)-capped CdSe/ZnS QDs to dye molecules attached to dodecamer DNA [22]. CD studies have been performed which reveal some perturbation in the native B-form of DNA in the nanobioconjugate (data not shown).
It appears that the hydrogen-bonding interaction between the nucleobases of DNA and the protonated carboxyl surface groups of the QDs is the mechanism behind the association of QDs to DNA. Because of a huge spectral overlap between the emission spectrum of QDs and absorption spectrum of EtBr-labeled DNA, a highly FRET efficiency of 92% has been obtained in our studies.
The high FRET efficiency and the corresponding donor–acceptor distance of 2.5 nm suggest that adsorptive interactions between the DNA molecules and MPA-capped QDs result in a conformation that lies across the surface of the QD. This kind of study is well relevant for making sensitive FRET-based sensors.
Inset of Figure 30(a) illustrates the absorption and emission spectra of MPA-capped CdSe/ZnS QDs in buffer, which remains largely unchanged after the ligand-exchange procedure. High resolution transmission electron microscope (HRTEM) image (inset of Figure 30(b)) of QDs reveals an average diameter of 4–4.5 nm with a honeycomb structure.
The existence of lattice fringes illustrates the highly crystalline nature of the QDs. Furthermore, when the fluorescence intensity at 528 nm was measured as a function of the excitation wavelength (280–450 nm), both the toluene and aqueous samples yield similar emission profiles and intensities. Taken all together, it indicates that the QDs retained their photoluminescence properties when transferred into water using the literature procedure.
The inset of Figure 30(a) reveals a huge spectral overlap between the emission spectrum of QDs and the absorption spectrum of EtBr-DNA complex suggesting that efficient FRET between the donor (QDs) and the acceptor (EtBr labeled DNA) can take place when DNA is adsorbed onto the surface of QDs.
REPRINT
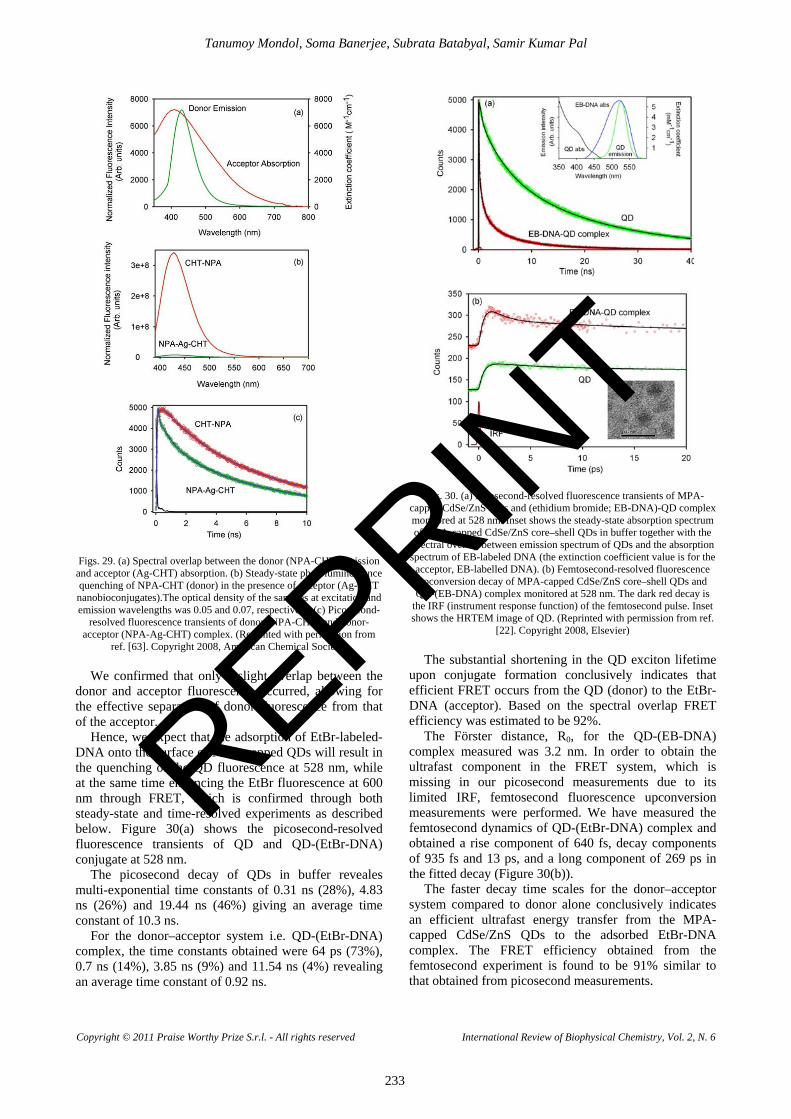
Tanumoy Mondol, Soma Banerjee, Subrata Batabyal, Samir Kumar Pal
Copyright © 2011 Praise Worthy Prize S.r.l. - All rights reserved International Review of Biophysical Chemistry, Vol. 2, N. 6
233
Figs. 29. (a) Spectral overlap between the donor (NPA-CHT) emission and acceptor (Ag-CHT) absorption. (b) Steady-state photoluminescence quenching of NPA-CHT (donor) in the presence of acceptor (Ag-CHT nanobioconjugates).The optical density of the samples at excitation and emission wavelengths was 0.05 and 0.07, respectively. (c) Picosecond-
resolved fluorescence transients of donor (NPA-CHT) and donor-acceptor (NPA-Ag-CHT) complex. (Reprinted with permission from
ref. [63]. Copyright 2008, American Chemical Society) We confirmed that only a slight overlap between the
donor and acceptor fluorescence occurred, allowing for the effective separation of donor fluorescence from that of the acceptor.
Hence, we expect that the adsorption of EtBr-labeled-DNA onto the surface of MPA-capped QDs will result in the quenching of the QD fluorescence at 528 nm, while at the same time enhancing the EtBr fluorescence at 600 nm through FRET, which is confirmed through both steady-state and time-resolved experiments as described below. Figure 30(a) shows the picosecond-resolved fluorescence transients of QD and QD-(EtBr-DNA) conjugate at 528 nm.
The picosecond decay of QDs in buffer reveales multi-exponential time constants of 0.31 ns (28%), 4.83 ns (26%) and 19.44 ns (46%) giving an average time constant of 10.3 ns.
For the donor–acceptor system i.e. QD-(EtBr-DNA) complex, the time constants obtained were 64 ps (73%), 0.7 ns (14%), 3.85 ns (9%) and 11.54 ns (4%) revealing an average time constant of 0.92 ns.
Figs. 30. (a) Picosecond-resolved fluorescence transients of MPA-capped CdSe/ZnS QDs and (ethidium bromide; EB-DNA)-QD complex monitored at 528 nm. Inset shows the steady-state absorption spectrum of MPA-capped CdSe/ZnS core–shell QDs in buffer together with the
spectral overlap between emission spectrum of QDs and the absorption spectrum of EB-labeled DNA (the extinction coefficient value is for the
acceptor, EB-labelled DNA). (b) Femtosecond-resolved fluorescence upconversion decay of MPA-capped CdSe/ZnS core–shell QDs and QD-(EB-DNA) complex monitored at 528 nm. The dark red decay is
the IRF (instrument response function) of the femtosecond pulse. Inset shows the HRTEM image of QD. (Reprinted with permission from ref.
[22]. Copyright 2008, Elsevier) The substantial shortening in the QD exciton lifetime
upon conjugate formation conclusively indicates that efficient FRET occurs from the QD (donor) to the EtBr-DNA (acceptor). Based on the spectral overlap FRET efficiency was estimated to be 92%.
The Förster distance, R0, for the QD-(EB-DNA) complex measured was 3.2 nm. In order to obtain the ultrafast component in the FRET system, which is missing in our picosecond measurements due to its limited IRF, femtosecond fluorescence upconversion measurements were performed. We have measured the femtosecond dynamics of QD-(EtBr-DNA) complex and obtained a rise component of 640 fs, decay components of 935 fs and 13 ps, and a long component of 269 ps in the fitted decay (Figure 30(b)).
The faster decay time scales for the donor–acceptor system compared to donor alone conclusively indicates an efficient ultrafast energy transfer from the MPA-capped CdSe/ZnS QDs to the adsorbed EtBr-DNA complex. The FRET efficiency obtained from the femtosecond experiment is found to be 91% similar to that obtained from picosecond measurements.
REPRINT
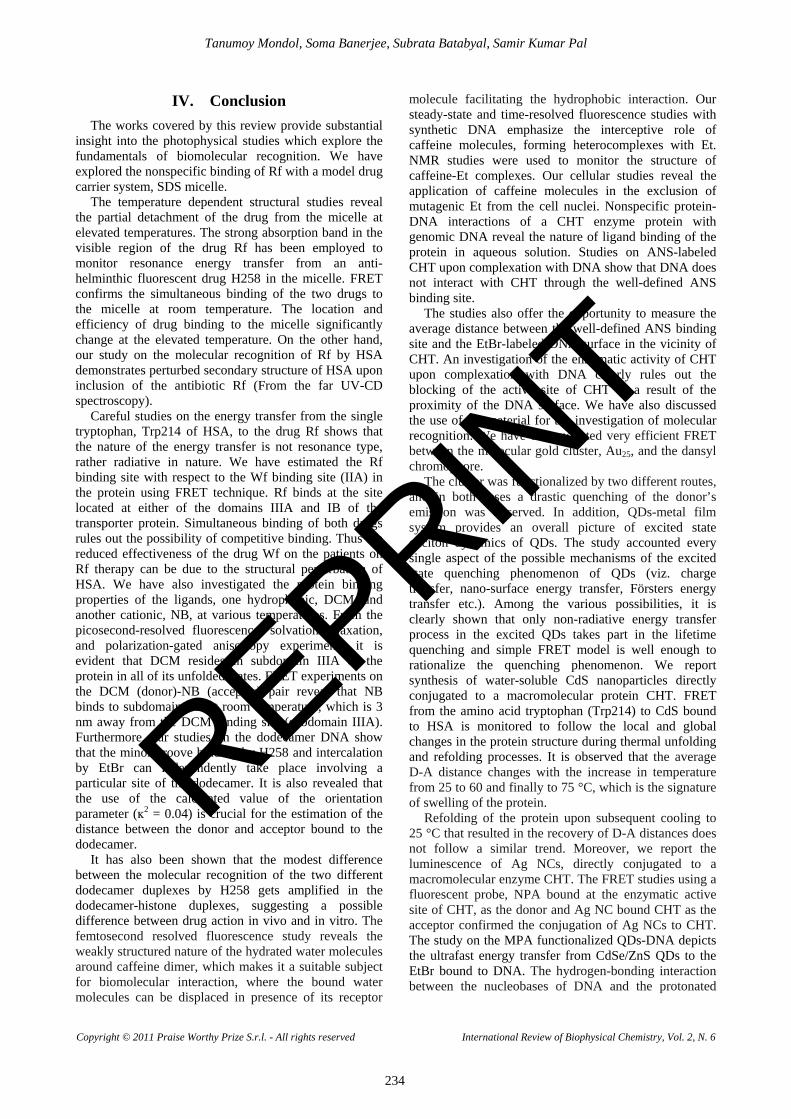
Tanumoy Mondol, Soma Banerjee, Subrata Batabyal, Samir Kumar Pal
Copyright © 2011 Praise Worthy Prize S.r.l. - All rights reserved International Review of Biophysical Chemistry, Vol. 2, N. 6
234
IV. Conclusion The works covered by this review provide substantial
insight into the photophysical studies which explore the fundamentals of biomolecular recognition. We have explored the nonspecific binding of Rf with a model drug carrier system, SDS micelle.
The temperature dependent structural studies reveal the partial detachment of the drug from the micelle at elevated temperatures. The strong absorption band in the visible region of the drug Rf has been employed to monitor resonance energy transfer from an anti-helminthic fluorescent drug H258 in the micelle. FRET confirms the simultaneous binding of the two drugs to the micelle at room temperature. The location and efficiency of drug binding to the micelle significantly change at the elevated temperature. On the other hand, our study on the molecular recognition of Rf by HSA demonstrates perturbed secondary structure of HSA upon inclusion of the antibiotic Rf (From the far UV-CD spectroscopy).
Careful studies on the energy transfer from the single tryptophan, Trp214 of HSA, to the drug Rf shows that the nature of the energy transfer is not resonance type, rather radiative in nature. We have estimated the Rf binding site with respect to the Wf binding site (IIA) in the protein using FRET technique. Rf binds at the site located at either of the domains IIIA and IB of the transporter protein. Simultaneous binding of both drugs rules out the possibility of competitive binding. Thus the reduced effectiveness of the drug Wf on the patients on Rf therapy can be due to the structural perturbation of HSA. We have also investigated the protein binding properties of the ligands, one hydrophobic, DCM, and another cationic, NB, at various temperatures. From the picosecond-resolved fluorescence, solvation relaxation, and polarization-gated anisotropy experiments it is evident that DCM resides in subdomain IIIA of the protein in all of its unfolded states. FRET experiments on the DCM (donor)-NB (acceptor) pair reveal that NB binds to subdomain IIB at room temperature, which is 3 nm away from the DCM binding site (subdomain IIIA). Furthermore, our studies on the dodecamer DNA show that the minor groove binding by H258 and intercalation by EtBr can independently take place involving a particular site of the dodecamer. It is also revealed that the use of the calculated value of the orientation parameter (ĸ2 = 0.04) is crucial for the estimation of the distance between the donor and acceptor bound to the dodecamer.
It has also been shown that the modest difference between the molecular recognition of the two different dodecamer duplexes by H258 gets amplified in the dodecamer-histone duplexes, suggesting a possible difference between drug action in vivo and in vitro. The femtosecond resolved fluorescence study reveals the weakly structured nature of the hydrated water molecules around caffeine dimer, which makes it a suitable subject for biomolecular interaction, where the bound water molecules can be displaced in presence of its receptor
molecule facilitating the hydrophobic interaction. Our steady-state and time-resolved fluorescence studies with synthetic DNA emphasize the interceptive role of caffeine molecules, forming heterocomplexes with Et. NMR studies were used to monitor the structure of caffeine-Et complexes. Our cellular studies reveal the application of caffeine molecules in the exclusion of mutagenic Et from the cell nuclei. Nonspecific protein-DNA interactions of a CHT enzyme protein with genomic DNA reveal the nature of ligand binding of the protein in aqueous solution. Studies on ANS-labeled CHT upon complexation with DNA show that DNA does not interact with CHT through the well-defined ANS binding site.
The studies also offer the opportunity to measure the average distance between the well-defined ANS binding site and the EtBr-labeled DNA surface in the vicinity of CHT. An investigation of the enzymatic activity of CHT upon complexation with DNA clearly rules out the blocking of the active site of CHT as a result of the proximity of the DNA surface. We have also discussed the use of nonmaterial for the investigation of molecular recognition. We have demonstrated very efficient FRET between the molecular gold cluster, Au25, and the dansyl chromophore.
The cluster was functionalized by two different routes, and in both cases a drastic quenching of the donor’s emission was observed. In addition, QDs-metal film system provides an overall picture of excited state exciton dynamics of QDs. The study accounted every single aspect of the possible mechanisms of the excited state quenching phenomenon of QDs (viz. charge transfer, nano-surface energy transfer, Försters energy transfer etc.). Among the various possibilities, it is clearly shown that only non-radiative energy transfer process in the excited QDs takes part in the lifetime quenching and simple FRET model is well enough to rationalize the quenching phenomenon. We report synthesis of water-soluble CdS nanoparticles directly conjugated to a macromolecular protein CHT. FRET from the amino acid tryptophan (Trp214) to CdS bound to HSA is monitored to follow the local and global changes in the protein structure during thermal unfolding and refolding processes. It is observed that the average D-A distance changes with the increase in temperature from 25 to 60 and finally to 75 °C, which is the signature of swelling of the protein.
Refolding of the protein upon subsequent cooling to 25 °C that resulted in the recovery of D-A distances does not follow a similar trend. Moreover, we report the luminescence of Ag NCs, directly conjugated to a macromolecular enzyme CHT. The FRET studies using a fluorescent probe, NPA bound at the enzymatic active site of CHT, as the donor and Ag NC bound CHT as the acceptor confirmed the conjugation of Ag NCs to CHT. The study on the MPA functionalized QDs-DNA depicts the ultrafast energy transfer from CdSe/ZnS QDs to the EtBr bound to DNA. The hydrogen-bonding interaction between the nucleobases of DNA and the protonated
REPRINT
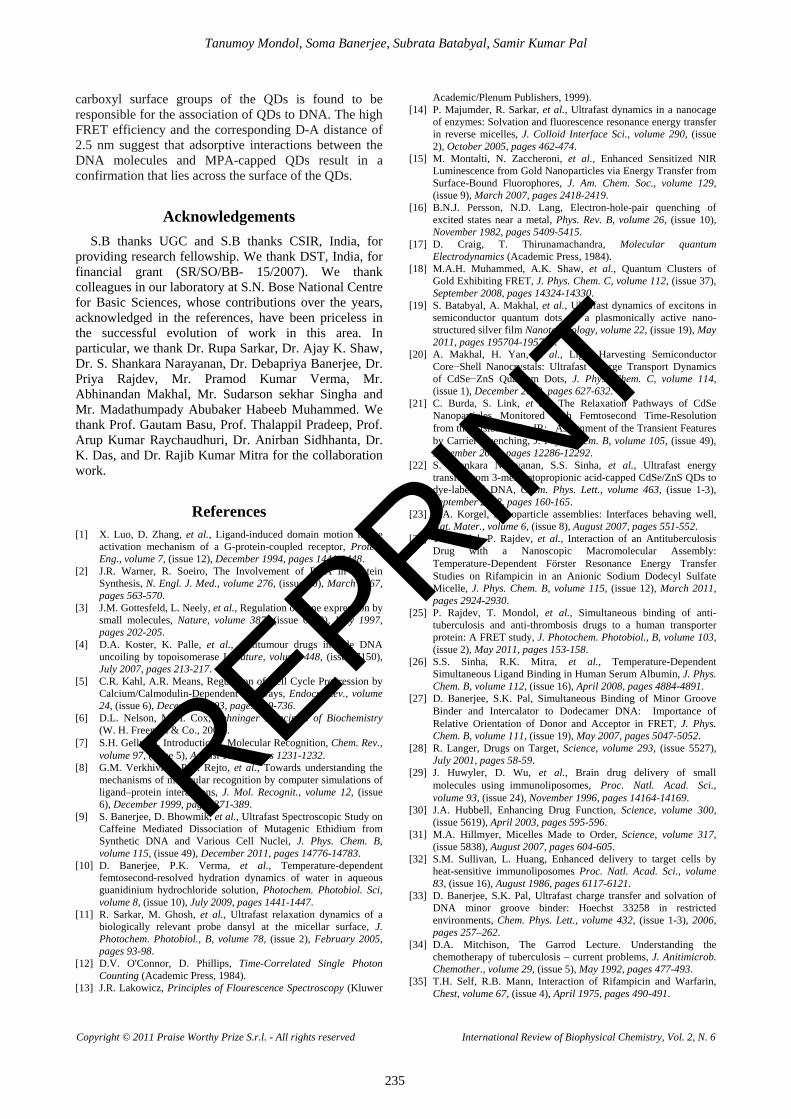
Tanumoy Mondol, Soma Banerjee, Subrata Batabyal, Samir Kumar Pal
Copyright © 2011 Praise Worthy Prize S.r.l. - All rights reserved International Review of Biophysical Chemistry, Vol. 2, N. 6
235
carboxyl surface groups of the QDs is found to be responsible for the association of QDs to DNA. The high FRET efficiency and the corresponding D-A distance of 2.5 nm suggest that adsorptive interactions between the DNA molecules and MPA-capped QDs result in a confirmation that lies across the surface of the QDs.
Acknowledgements S.B thanks UGC and S.B thanks CSIR, India, for
providing research fellowship. We thank DST, India, for financial grant (SR/SO/BB- 15/2007). We thank colleagues in our laboratory at S.N. Bose National Centre for Basic Sciences, whose contributions over the years, acknowledged in the references, have been priceless in the successful evolution of work in this area. In particular, we thank Dr. Rupa Sarkar, Dr. Ajay K. Shaw, Dr. S. Shankara Narayanan, Dr. Debapriya Banerjee, Dr. Priya Rajdev, Mr. Pramod Kumar Verma, Mr. Abhinandan Makhal, Mr. Sudarson sekhar Singha and Mr. Madathumpady Abubaker Habeeb Muhammed. We thank Prof. Gautam Basu, Prof. Thalappil Pradeep, Prof. Arup Kumar Raychaudhuri, Dr. Anirban Sidhhanta, Dr. K. Das, and Dr. Rajib Kumar Mitra for the collaboration work.
References [1] X. Luo, D. Zhang, et al., Ligand-induced domain motion in the
activation mechanism of a G-protein-coupled receptor, Protein Eng., volume 7, (issue 12), December 1994, pages 1441-1448.
[2] J.R. Warner, R. Soeiro, The Involvement of RNA in Protein Synthesis, N. Engl. J. Med., volume 276, (issue 10), March 1967, pages 563-570.
[3] J.M. Gottesfeld, L. Neely, et al., Regulation of gene expression by small molecules, Nature, volume 387, (issue 6629), May 1997, pages 202-205.
[4] D.A. Koster, K. Palle, et al., Antitumour drugs impede DNA uncoiling by topoisomerase I, Nature, volume 448, (issue 7150), July 2007, pages 213-217.
[5] C.R. Kahl, A.R. Means, Regulation of Cell Cycle Progression by Calcium/Calmodulin-Dependent Pathways, Endocr. Rev., volume 24, (issue 6), December 2003, pages 719-736.
[6] D.L. Nelson, M.M. Cox, Lehninger Principles of Biochemistry (W. H. Freeman & Co., 2000).
[7] S.H. Gellman, Introduction:� Molecular Recognition, Chem. Rev., volume 97, (issue 5), August 1997, pages 1231-1232.
[8] G.M. Verkhivker, P.A. Rejto, et al., Towards understanding the mechanisms of molecular recognition by computer simulations of ligand–protein interactions, J. Mol. Recognit., volume 12, (issue 6), December 1999, pages 371-389.
[9] S. Banerjee, D. Bhowmik, et al., Ultrafast Spectroscopic Study on Caffeine Mediated Dissociation of Mutagenic Ethidium from Synthetic DNA and Various Cell Nuclei, J. Phys. Chem. B, volume 115, (issue 49), December 2011, pages 14776-14783.
[10] D. Banerjee, P.K. Verma, et al., Temperature-dependent femtosecond-resolved hydration dynamics of water in aqueous guanidinium hydrochloride solution, Photochem. Photobiol. Sci, volume 8, (issue 10), July 2009, pages 1441-1447.
[11] R. Sarkar, M. Ghosh, et al., Ultrafast relaxation dynamics of a biologically relevant probe dansyl at the micellar surface, J. Photochem. Photobiol., B, volume 78, (issue 2), February 2005, pages 93-98.
[12] D.V. O'Connor, D. Phillips, Time-Correlated Single Photon Counting (Academic Press, 1984).
[13] J.R. Lakowicz, Principles of Flourescence Spectroscopy (Kluwer
Academic/Plenum Publishers, 1999). [14] P. Majumder, R. Sarkar, et al., Ultrafast dynamics in a nanocage
of enzymes: Solvation and fluorescence resonance energy transfer in reverse micelles, J. Colloid Interface Sci., volume 290, (issue 2), October 2005, pages 462-474.
[15] M. Montalti, N. Zaccheroni, et al., Enhanced Sensitized NIR Luminescence from Gold Nanoparticles via Energy Transfer from Surface-Bound Fluorophores, J. Am. Chem. Soc., volume 129, (issue 9), March 2007, pages 2418-2419.
[16] B.N.J. Persson, N.D. Lang, Electron-hole-pair quenching of excited states near a metal, Phys. Rev. B, volume 26, (issue 10), November 1982, pages 5409-5415.
[17] D. Craig, T. Thirunamachandra, Molecular quantum Electrodynamics (Academic Press, 1984).
[18] M.A.H. Muhammed, A.K. Shaw, et al., Quantum Clusters of Gold Exhibiting FRET, J. Phys. Chem. C, volume 112, (issue 37), September 2008, pages 14324-14330.
[19] S. Batabyal, A. Makhal, et al., Ultrafast dynamics of excitons in semiconductor quantum dots on a plasmonically active nano-structured silver film Nanotechnology, volume 22, (issue 19), May 2011, pages 195704-195707.
[20] A. Makhal, H. Yan, et al., Light Harvesting Semiconductor Core−Shell Nanocrystals: Ultrafast Charge Transport Dynamics of CdSe−ZnS Quantum Dots, J. Phys. Chem. C, volume 114, (issue 1), December 2009, pages 627-632.
[21] C. Burda, S. Link, et al., The Relaxation Pathways of CdSe Nanoparticles Monitored with Femtosecond Time-Resolution from the Visible to the IR:� Assignment of the Transient Features by Carrier Quenching, J. Phys. Chem. B, volume 105, (issue 49), November 2001, pages 12286-12292.
[22] S. Shankara Narayanan, S.S. Sinha, et al., Ultrafast energy transfer from 3-mercaptopropionic acid-capped CdSe/ZnS QDs to dye-labelled DNA, Chem. Phys. Lett., volume 463, (issue 1-3), September 2008, pages 160-165.
[23] B.A. Korgel, Nanoparticle assemblies: Interfaces behaving well, Nat. Mater., volume 6, (issue 8), August 2007, pages 551-552.
[24] T. Mondol, P. Rajdev, et al., Interaction of an Antituberculosis Drug with a Nanoscopic Macromolecular Assembly: Temperature-Dependent Forster Resonance Energy Transfer Studies on Rifampicin in an Anionic Sodium Dodecyl Sulfate Micelle, J. Phys. Chem. B, volume 115, (issue 12), March 2011, pages 2924-2930.
[25] P. Rajdev, T. Mondol, et al., Simultaneous binding of anti-tuberculosis and anti-thrombosis drugs to a human transporter protein: A FRET study, J. Photochem. Photobiol., B, volume 103, (issue 2), May 2011, pages 153-158.
[26] S.S. Sinha, R.K. Mitra, et al., Temperature-Dependent Simultaneous Ligand Binding in Human Serum Albumin, J. Phys. Chem. B, volume 112, (issue 16), April 2008, pages 4884-4891.
[27] D. Banerjee, S.K. Pal, Simultaneous Binding of Minor Groove Binder and Intercalator to Dodecamer DNA:� Importance of Relative Orientation of Donor and Acceptor in FRET, J. Phys. Chem. B, volume 111, (issue 19), May 2007, pages 5047-5052.
[28] R. Langer, Drugs on Target, Science, volume 293, (issue 5527), July 2001, pages 58-59.
[29] J. Huwyler, D. Wu, et al., Brain drug delivery of small molecules�using�immunoliposomes, Proc. Natl. Acad. Sci., volume 93, (issue 24), November 1996, pages 14164-14169.
[30] J.A. Hubbell, Enhancing Drug Function, Science, volume 300, (issue 5619), April 2003, pages 595-596.
[31] M.A. Hillmyer, Micelles Made to Order, Science, volume 317, (issue 5838), August 2007, pages 604-605.
[32] S.M. Sullivan, L. Huang, Enhanced delivery to target cells by heat-sensitive immunoliposomes Proc. Natl. Acad. Sci., volume 83, (issue 16), August 1986, pages 6117-6121.
[33] D. Banerjee, S.K. Pal, Ultrafast charge transfer and solvation of DNA minor groove binder: Hoechst 33258 in restricted environments, Chem. Phys. Lett., volume 432, (issue 1-3), 2006, pages 257–262.
[34] D.A. Mitchison, The Garrod Lecture. Understanding the chemotherapy of tuberculosis – current problems, J. Anitimicrob. Chemother., volume 29, (issue 5), May 1992, pages 477-493.
[35] T.H. Self, R.B. Mann, Interaction of Rifampicin and Warfarin, Chest, volume 67, (issue 4), April 1975, pages 490-491.
REPRINT
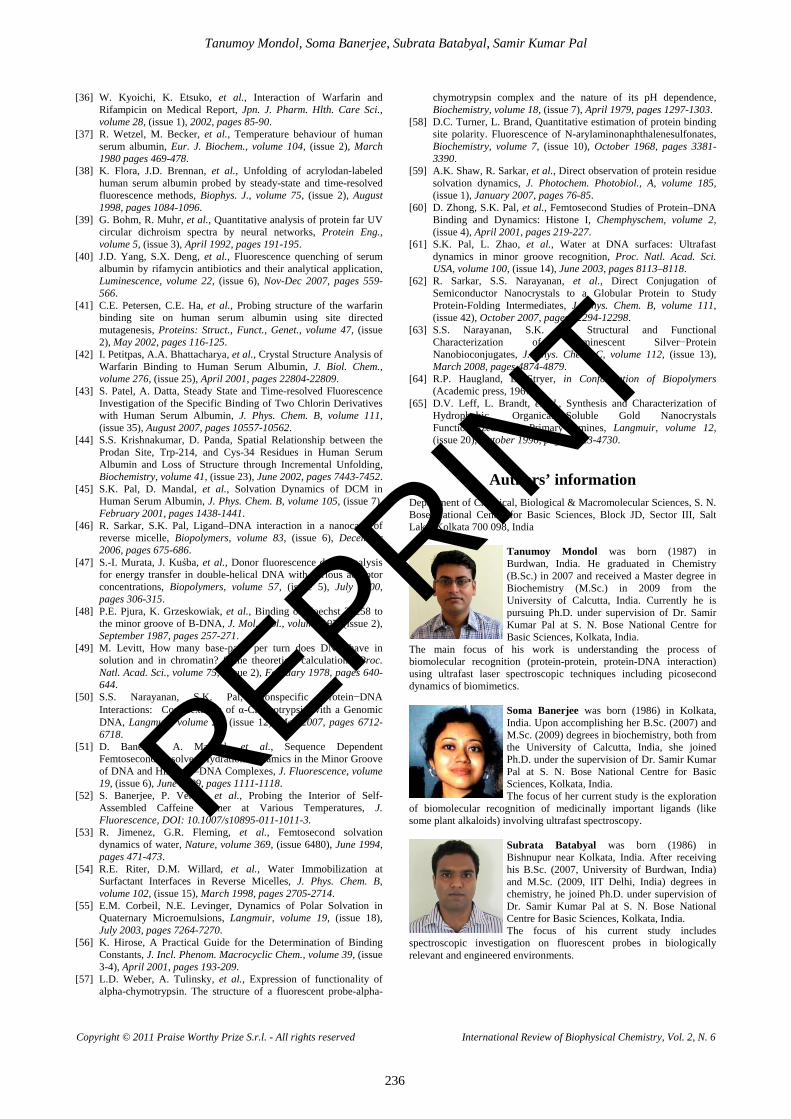
Tanumoy Mondol, Soma Banerjee, Subrata Batabyal, Samir Kumar Pal
Copyright © 2011 Praise Worthy Prize S.r.l. - All rights reserved International Review of Biophysical Chemistry, Vol. 2, N. 6
236
[36] W. Kyoichi, K. Etsuko, et al., Interaction of Warfarin and Rifampicin on Medical Report, Jpn. J. Pharm. Hlth. Care Sci., volume 28, (issue 1), 2002, pages 85-90.
[37] R. Wetzel, M. Becker, et al., Temperature behaviour of human serum albumin, Eur. J. Biochem., volume 104, (issue 2), March 1980 pages 469-478.
[38] K. Flora, J.D. Brennan, et al., Unfolding of acrylodan-labeled human serum albumin probed by steady-state and time-resolved fluorescence methods, Biophys. J., volume 75, (issue 2), August 1998, pages 1084-1096.
[39] G. Bohm, R. Muhr, et al., Quantitative analysis of protein far UV circular dichroism spectra by neural networks, Protein Eng., volume 5, (issue 3), April 1992, pages 191-195.
[40] J.D. Yang, S.X. Deng, et al., Fluorescence quenching of serum albumin by rifamycin antibiotics and their analytical application, Luminescence, volume 22, (issue 6), Nov-Dec 2007, pages 559-566.
[41] C.E. Petersen, C.E. Ha, et al., Probing structure of the warfarin binding site on human serum albumin using site directed mutagenesis, Proteins: Struct., Funct., Genet., volume 47, (issue 2), May 2002, pages 116-125.
[42] I. Petitpas, A.A. Bhattacharya, et al., Crystal Structure Analysis of Warfarin Binding to Human Serum Albumin, J. Biol. Chem., volume 276, (issue 25), April 2001, pages 22804-22809.
[43] S. Patel, A. Datta, Steady State and Time-resolved Fluorescence Investigation of the Specific Binding of Two Chlorin Derivatives with Human Serum Albumin, J. Phys. Chem. B, volume 111, (issue 35), August 2007, pages 10557-10562.
[44] S.S. Krishnakumar, D. Panda, Spatial Relationship between the Prodan Site, Trp-214, and Cys-34 Residues in Human Serum Albumin and Loss of Structure through Incremental Unfolding, Biochemistry, volume 41, (issue 23), June 2002, pages 7443-7452.
[45] S.K. Pal, D. Mandal, et al., Solvation Dynamics of DCM in Human Serum Albumin, J. Phys. Chem. B, volume 105, (issue 7), February 2001, pages 1438-1441.
[46] R. Sarkar, S.K. Pal, Ligand–DNA interaction in a nanocage of reverse micelle, Biopolymers, volume 83, (issue 6), December 2006, pages 675-686.
[47] S.-I. Murata, J. Kuśba, et al., Donor fluorescence decay analysis for energy transfer in double-helical DNA with various acceptor concentrations, Biopolymers, volume 57, (issue 5), July 2000, pages 306-315.
[48] P.E. Pjura, K. Grzeskowiak, et al., Binding of Hoechst 33258 to the minor groove of B-DNA, J. Mol. Biol., volume 197, (issue 2), September 1987, pages 257-271.
[49] M. Levitt, How many base-pairs per turn does DNA have in solution and in chromatin? Some theoretical calculations, Proc. Natl. Acad. Sci., volume 75, (issue 2), February 1978, pages 640-644.
[50] S.S. Narayanan, S.K. Pal, Nonspecific Protein−DNA Interactions:� Complexation of α-Chymotrypsin with a Genomic DNA, Langmuir, volume 23, (issue 12), May 2007, pages 6712-6718.
[51] D. Banerjee, A. Makhal, et al., Sequence Dependent Femtosecond-Resolved Hydration Dynamics in the Minor Groove of DNA and Histone—DNA Complexes, J. Fluorescence, volume 19, (issue 6), June 2009, pages 1111-1118.
[52] S. Banerjee, P. Verma, et al., Probing the Interior of Self-Assembled Caffeine Dimer at Various Temperatures, J. Fluorescence, DOI: 10.1007/s10895-011-1011-3.
[53] R. Jimenez, G.R. Fleming, et al., Femtosecond solvation dynamics of water, Nature, volume 369, (issue 6480), June 1994, pages 471-473.
[54] R.E. Riter, D.M. Willard, et al., Water Immobilization at Surfactant Interfaces in Reverse Micelles, J. Phys. Chem. B, volume 102, (issue 15), March 1998, pages 2705-2714.
[55] E.M. Corbeil, N.E. Levinger, Dynamics of Polar Solvation in Quaternary Microemulsions, Langmuir, volume 19, (issue 18), July 2003, pages 7264-7270.
[56] K. Hirose, A Practical Guide for the Determination of Binding Constants, J. Incl. Phenom. Macrocyclic Chem., volume 39, (issue 3-4), April 2001, pages 193-209.
[57] L.D. Weber, A. Tulinsky, et al., Expression of functionality of alpha-chymotrypsin. The structure of a fluorescent probe-alpha-
chymotrypsin complex and the nature of its pH dependence, Biochemistry, volume 18, (issue 7), April 1979, pages 1297-1303.
[58] D.C. Turner, L. Brand, Quantitative estimation of protein binding site polarity. Fluorescence of N-arylaminonaphthalenesulfonates, Biochemistry, volume 7, (issue 10), October 1968, pages 3381-3390.
[59] A.K. Shaw, R. Sarkar, et al., Direct observation of protein residue solvation dynamics, J. Photochem. Photobiol., A, volume 185, (issue 1), January 2007, pages 76-85.
[60] D. Zhong, S.K. Pal, et al., Femtosecond Studies of Protein–DNA Binding and Dynamics: Histone I, Chemphyschem, volume 2, (issue 4), April 2001, pages 219-227.
[61] S.K. Pal, L. Zhao, et al., Water at DNA surfaces: Ultrafast dynamics in minor groove recognition, Proc. Natl. Acad. Sci. USA, volume 100, (issue 14), June 2003, pages 8113–8118.
[62] R. Sarkar, S.S. Narayanan, et al., Direct Conjugation of Semiconductor Nanocrystals to a Globular Protein to Study Protein-Folding Intermediates, J. Phys. Chem. B, volume 111, (issue 42), October 2007, pages 12294-12298.
[63] S.S. Narayanan, S.K. Pal, Structural and Functional Characterization of Luminescent Silver−Protein Nanobioconjugates, J. Phys. Chem. C, volume 112, (issue 13), March 2008, pages 4874-4879.
[64] R.P. Haugland, L. Stryer, in Conformation of Biopolymers (Academic press, 1967).
[65] D.V. Leff, L. Brandt, et al., Synthesis and Characterization of Hydrophobic, Organically-Soluble Gold Nanocrystals Functionalized with Primary Amines, Langmuir, volume 12, (issue 20), October 1996, pages 4723-4730.
Authors’ information Department of Chemical, Biological & Macromolecular Sciences, S. N. Bose National Centre for Basic Sciences, Block JD, Sector III, Salt Lake, Kolkata 700 098, India
Tanumoy Mondol was born (1987) in Burdwan, India. He graduated in Chemistry (B.Sc.) in 2007 and received a Master degree in Biochemistry (M.Sc.) in 2009 from the University of Calcutta, India. Currently he is pursuing Ph.D. under supervision of Dr. Samir Kumar Pal at S. N. Bose National Centre for Basic Sciences, Kolkata, India.
The main focus of his work is understanding the process of biomolecular recognition (protein-protein, protein-DNA interaction) using ultrafast laser spectroscopic techniques including picosecond dynamics of biomimetics.
Soma Banerjee was born (1986) in Kolkata, India. Upon accomplishing her B.Sc. (2007) and M.Sc. (2009) degrees in biochemistry, both from the University of Calcutta, India, she joined Ph.D. under the supervision of Dr. Samir Kumar Pal at S. N. Bose National Centre for Basic Sciences, Kolkata, India. The focus of her current study is the exploration
of biomolecular recognition of medicinally important ligands (like some plant alkaloids) involving ultrafast spectroscopy.
Subrata Batabyal was born (1986) in Bishnupur near Kolkata, India. After receiving his B.Sc. (2007, University of Burdwan, India) and M.Sc. (2009, IIT Delhi, India) degrees in chemistry, he joined Ph.D. under supervision of Dr. Samir Kumar Pal at S. N. Bose National Centre for Basic Sciences, Kolkata, India. The focus of his current study includes
spectroscopic investigation on fluorescent probes in biologically relevant and engineered environments.
REPRINT

Tanumoy Mondol, Soma Banerjee, Subrata Batabyal, Samir Kumar Pal
Copyright © 2011 Praise Worthy Prize S.r.l. - All rights reserved International Review of Biophysical Chemistry, Vol. 2, N. 6
237
Samir Kumar Pal is presently associate professor in the Department of Chemical Biological and Macromolecular Sciences, S.N. Bose National Centre for Basic Sciences, Kolkata, India. He is also one of the investigators in the unit for Nano Science and Technology of the Centre. His fields of interest include experimental biophysics in molecular
recognition, bio-nano interface, biomedical instrumentation and environmental pollution. He has more than 130 research papers published in various international peer-reviewed journals. Recently, his group achieved 11 patents in environmental/biomedical instrumentations. E-mail: [email protected]
REPRINT

International Review of Biophysical Chemistry (IREBIC)
Aims and scope
The International Review of Biophysical Chemistry (IRe.Bi.C.) is a peer-reviewed journal that publishes original theoretical and applied papers on all physicochemical aspects of Biomolecules and Biological Systems. The scope of the Journal encompasses, but is not restricted to the following areas: quantitative analysis of the properties of biological macromolecules, macromolecular assemblies and cell components in terms of kinetics, thermodynamics, NMR, X-ray structural biology, single-molecule detection, fluorescence methods, advanced in vivo fluorescence microscopy; physical chemistry of native and engineered proteins, of natural and synthetic oligonucleotides, polysaccharides and phospholipids of biological and pharmaceutical interest; bioenergetics; molecular docking and dynamics simulation, protein structure prediction; physicochemical aspects in bio-nanotechnology. The Editorial policy is to maintain a reasonable balance between papers regarding different research areas so that the Journal will be useful to all interested scientific groups. The journal publishes invited tutorials or critical reviews; original scientific research papers (regular papers), letters to the Editor and research notes which should also be original presenting proposals for a new research, reporting on research in progress or discussing the latest scientific results in advanced fields; short communications and discussions, book reviews, reports from meetings and special issues describing research on all of physicochemical aspects of Biomolecules and Biological Systems.
Instructions for submitting a paper Contributions may consist of invited tutorials or critical reviews; original scientific research papers (regular paper); letters to the Editor and research notes which should also be original presenting proposals for a new research, reporting on research in progress or discussing the latest scientific results in advanced fields. All papers will be subjected to a fast editorial process. Any paper will be published within two months from the submitted date, if it has been accepted. Papers must be correctly formatted, in order to be published. Formatting instructions can be found in the last pages of the Review. An Author guidelines template file can be found at the following web address: www.praiseworthyprize.com/Template_of_IREBIC.doc Manuscripts should be sent via e-mail as attachment in .doc and .pdf formats to:
The regular paper page length limit is defined at 15 formatted Review pages, including illustrations, references and author(s) biographies. Pages 16 and above are charged 10 euros per page and payment is a prerequisite for publication. Subscription rates:
on Cd-Rom, per year: Print copy, per year: Institutional: 263* (euros) 263** (euros) Individual: 263* (euros) 263** (euros) Individual Article: 30 (euros) 40** (euros)
* To be downloaded ** Shipment costs to be charged
Abstracting and Indexing Information:
Academic Search Complete - EBSCO Information Services Cambridge Scientific Abstracts - CSA/CIG Copernicus
Autorizzazione del Tribunale di Napoli n. 30 del 12/04/2010
REPRINT

2038-0321(201112)2:6;1-T
REPRINT