international profile of foreign residential buyers in u.s., 2014 edition
TRANSCRIPT

2014 Profile of International Home Buying ActivitySummary of Report at
http://www.realtor.org/reports/profile-of-international-home-buying-activity
Lawrence Yun, Senior Vice President & Chief Economist
Jed Smith, Managing Director, Quantitative Research
Gay Cororaton, Research Economist
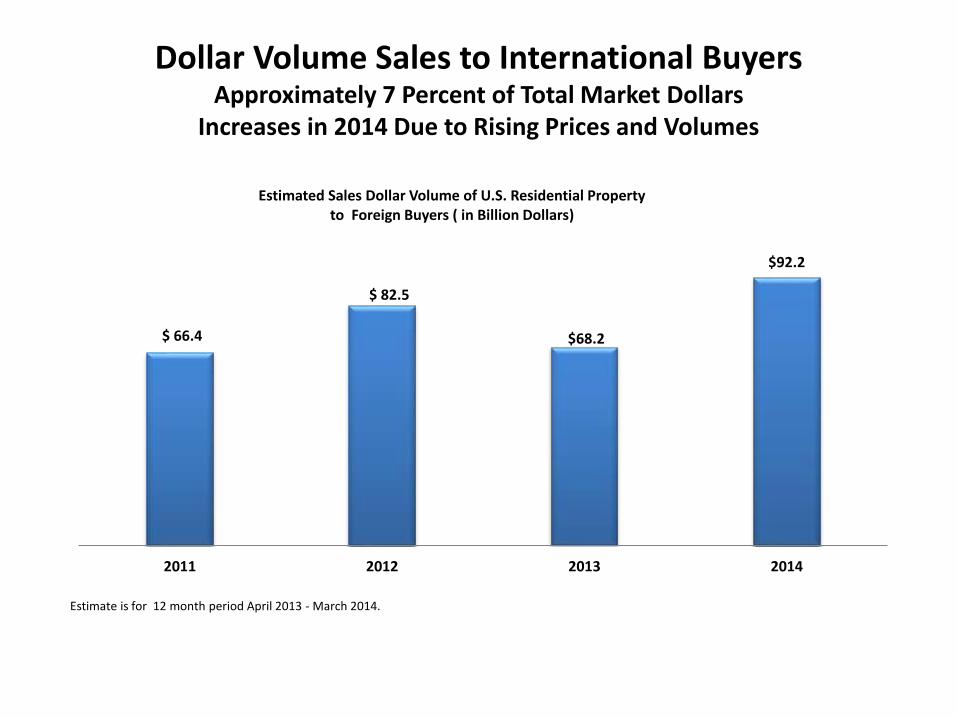
Dollar Volume Sales to International BuyersApproximately 7 Percent of Total Market Dollars
Increases in 2014 Due to Rising Prices and Volumes
$ 66.4
$ 82.5
$68.2
$92.2
2011 2012 2013 2014
Estimated Sales Dollar Volume of U.S. Residential Property to Foreign Buyers ( in Billion Dollars)
Estimate is for 12 month period April 2013 - March 2014.

Sales to Foreigners: Modest GrowthApproximately 5 percent of Total Residential Transactions
0
1000000
2000000
3000000
4000000
5000000
6000000
2010 2011 2012 2013 2014
Domestic International

International Buyers: 7% of $1.2 Trillion MarketFive Countries: 54 Percent of Total International Sales
Sales ($) % Share Sales ($) % Share
Canada $11.8 17% $13.8 15%
China $12.8 19% $22.0 24%
Mexico $3.6 5% $4.5 5%
India $3.9 6% $5.8 6%
United Kingdom $4.2 6% $5.8 6%
Total International Sales $68.2 $92.2
Estimate of International Sales from Major Buyers
2013 2014
( In Billion Dollars)

Canada Leads in Number of TransactionsChina Leads in Dollar VolumeCanada: $13.8 Billion; China: $22 Billion
Brazil Canada China* France Germany India Japan Mexico RussiaUnited
Kingdom
2010 1% 23% 9% 3% 4% 5% 1% 10% 3% 9%
2011 3% 23% 9% 4% 4% 7% 2% 7% 1% 7%
2012 3% 24% 12% 3% 3% 6% 1% 8% 2% 6%
2013 2% 23% 12% 2% 3% 5% 1% 8% 2% 5%
2014 2% 19% 16% 2% 3% 5% 2% 9% 1% 5%
0%
5%
10%
15%
20%
25%
30%
Distribution of International Transactions by Country of Origin

Transactions Concentrated in Four StatesPercent of Total Foreign Transactions by State

Foreign Purchasers: Geographic Preferences
Canadians: Las Vegas, Detroit, Los Angeles, Ft. Lauderdale, Miami, Orlando
40%
23%
10%
3% 3%
21%
Florida Arizona California Texas Washington OtherStates
Canadian Home Buyer Preferences Percent Distribution of Total Canadian Purchases
Chinese: Los Angeles, San Francisco, Irvine, New York, Las Vegas
35%
9%7% 6% 6%
36%
Chinese Home Buyer PreferencesPercent Distribution of Total Chinese Purchases

Foreign Purchasers: Geographic Preferences
Indians: Los Angeles, Las Vegas, Chicago, Dallas, New York
17%
8% 8% 8%6%
53%
Indian Home Buyer PreferencesPercent Distribution of Total Indian Purchases
U.K.: Los Angeles, Orlando, Houston, Las Vegas, Kissimmee
45%
12%
9%
6% 6%
21%
Florida California Texas Maine Maryland OtherStates
U.K. Home Buyer PreferencesPercent Distribution of Total U.K. Purchases

Florida Popular with Latin Americans, Canadians, and Europeans
1%
8%
28%
26%
34%
3% 2%
Africa Asia/Oceania Europe Latin America (incMexico)
North America (excMexico)
Middle East Unknown
Distribution of International Clients Purchasingin Florida

California: Popular with Asians and Canadians
0%
62%
16%
4%
13%
1%3%
Africa Asia/Oceania Europe Latin America (incMexico)
North America (excMexico)
Middle East Unknown
Region of Origin of International Clients Purchasingin California

Arizona: Particularly Popular with Canadians
0%
11%8%
3%
74%
3% 3%
Africa Asia/Oceania Europe Latin America (incMexico)
North America (excMexico)
Middle East Unknown
Region of Origin of International Clients Purchasingin Arizona

Texas: Popular with Latin Americans, Particularly Mexicans
4%
18%
9%
59%
5%3% 3%
Africa Asia/Oceania Europe Latin America (incMexico)
North America (excMexico)
Middle East Unknown
Region of Origin of International Clients Purchasingin Texas

Foreign Sales Tend to be at Higher End of Market
Mean Price Median Price
U.S. Existing Home Sales $247,417 $201,700
International Sales $396,180 $268,284
Average Mean and Median Prices from April 2013-March 2014
51%56% 54%
45%54%
46%
30%28%
28%
30%
23%
29%
12% 10% 13%
15%15%
16%
7% 7% 5%10% 7% 9%
0%
10%
20%
30%
40%
50%
60%
70%
80%
90%
100%
2009 2010 2011 2012 2013 2014
Pe
rce
nta
ge o
f R
esp
on
de
nts
Wit
h C
lien
ts
Purchase Price(Percentage Distribution)
up to $250,000 $250,001 to $500,000
$500,001 to $ 1M $ 1M up

Prices Paid by Buyers Vary by Country of Origin
Canada China India Mexico United Kingdom
Median Price $212,500 $523,148 $342,857 $141,071 $350,000
Mean Price $314,718 $590,826 $459,028 $224,123 $499,242
$-
$100,000
$200,000
$300,000
$400,000
$500,000
$600,000
$700,000
Purchase Prices of Top 5 International Homebuying Countries Based on Reported Transactions from Apr 2013-Mar 2014

Cash Sales Are in the Majority
28%
43%46%
55% 62% 62% 63% 60%
69%
54%52%
44%
36% 37% 35% 38%
0%
10%
20%
30%
40%
50%
60%
70%
80%
90%
100%
2007 2008 2009 2010 2011 2012 2013 2014
Pe
rce
nta
ge o
f R
esp
on
de
nts
Wit
h C
lien
ts
Type of Financing(Percentage Distribution)
All cash (no mortgage financing) With mortgage financing Don't know

Foreigners Buy for a Variety of Reasons
20% 18% 21% 21% 22% 25%
32%29% 27% 31% 31%
31%
40% 45% 43%40% 39% 37%
8% 8% 9% 8% 8% 7%
0%
10%
20%
30%
40%
50%
60%
70%
80%
90%
100%
2009 2010 2011 2012 2013 2014
Pe
rce
nta
ge o
f R
esp
on
de
nts
Wit
h C
lien
ts
Most Important Factor Influencing Purchase(Percentage Distribution )
U.S. real estate is viewed as a secure investment. U.S. real estate is viewed as profitable investment.
U.S. is viewed as a desirable location. Other

Not All Potential Foreign Clients Purchase a HouseForeigners Don’t Buy for a Variety of Reasons
10%18% 21% 26% 24% 25%1%
2%1%
1% 1% 2%30%26%
28%
33%29% 30%
9%8%
8%
6%7% 9%21%
25%22%
18%21% 19%
28%21% 20% 16% 17% 16%
0%
10%
20%
30%
40%
50%
60%
70%
80%
90%
100%
2009 2010 2011 2012 2013 2014
Pe
rce
nta
ge o
f R
esp
on
ses
Reasons for Not Buying(Percentage Distribution )
Could not find a property to purchase Loss of home country benefits Cost/taxes/ insurance
Immigration laws Financing issues Other

International Sales Tend to be Concentrated in Real Estate Practices
91% 91%87% 88% 87% 88%
6% 6%
9% 8% 9% 8%
3% 4% 4% 5% 4% 4%
80%
85%
90%
95%
100%
2009 2010 2011 2012 2013 2014
Pe
rce
nta
ge o
f R
esp
on
de
nts
Wit
h
Clie
nts
Number of International Clients, Whether or Not Client Purchased a Property (Percentage Distribution)
1 to 5 6 to 10 11 or more

Transactions Tend to be Concentrated in Specialists28 Percent of REALTORS® Have More than 10 Percent of Their Business with
International Clients
34%24% 22% 21% 16% 18%
49%54% 51% 52% 58% 54%
17% 22% 27% 27% 26% 28%
0%
20%
40%
60%
80%
100%
2009 2010 2011 2012 2013 2014
Pe
rce
nta
ge o
f R
esp
on
de
nts
Wit
h
Clie
nts
Percent of Transactions with International Clients for REALTORS® with International Clients(Percentage Distribution)
0% 1 to 10% more than 10%

REALTORS® Have Both Resident and Non-Resident Clients
41% 44% 38% 38% 35%
38% 33% 37%36% 34%
21% 23% 25% 26% 30%
0%
20%
40%
60%
80%
100%
2010 2011 2012 2013 2014
Types of International Clients(Percentage Distribution)
TypeA (Foreign Client) TypeB (Recent Immigrant) Both Types

Steady Net Growth in Number of Clients
15% 19% 19% 18% 21% 20%
57%56%
53% 55%
53%48%
9%10%
9% 9% 7%
6%
19% 15% 19% 17% 19%26%
0%
10%
20%
30%
40%
50%
60%
70%
80%
90%
100%
2009 2010 2011 2012 2013 2014
Pe
rce
nta
ge o
f R
esp
on
de
nts
Wit
h C
lien
ts
Change in International Clients: Past 5 Years
(Percentage Distribution )
Increased Stayed about the same Decreased Not applicable, have been in business less than 5 years

2014 Profile of International Home Buying ActivityMajor Conclusions
• International Sales a Niche Market.– 7 Percent of total U.S. Home Sales by Dollar Volume.– Slow Growth/Varies from Year to Year.– Specialized Experience in Serving Buy-Side Important: Knowledge of language, customs,
culture necessary in serving clients.
• A Concentrated Market.– States: 55 percent of Transactions Concentrated in Florida, California, Texas, and Arizona.– Countries: 54 percent of Transactions by Nationals from Canada China, India, Mexico, U.K.
• International Buyers are Diverse.– Motivations include investment, personal use (permanent or vacation), asset diversification.
• International Buyers Need Assistance.– U.S. real estate Practices Differ from Foreign Practices– Cultural as Well as Day-to-Day Differences Between U.S. and Other Countries.
• Sources of Clients– Generally Through Referral.– Websites Also a Source.