international pension papers 1/2016 2016 pension sustainability … · 2018-10-22 · allianz...
TRANSCRIPT

International Pension Papers 1/2016
2016 Pension Sustainability Index
Allianz International Pension Papers 1/2016
2
M A S T H E A D
Publisher Allianz SEKoeniginstrasse 2880802 Munich, GermanyPhone: +49 89 3800-0Fax: +49 89 3800-3425www.allianz.com
EditorsDr. Renate Finke, Senior [email protected] Mylène Sabatini, [email protected]
International [email protected]
Closing DateSeptember 2016
Cautionary Note Regarding Forward-Looking Statements
The statements contained herein may include statements of future expectations and other forward-looking statements that are based on management’s current views and assumptions and involve known and unknown risks and uncertainties that could cause actual results, performance or events to differ materially from those expressed or implied in such statements. In addition to statements which are forward-looking by reason of context, the words “may”, “will”, “should”, “expects”, “plans”, “intends”, “anticipates”, “believes”, “estimates”, “predicts”, “potential”, or “continue” and similar expressions identify forward-looking statements. Actual results, performance or events may differ materially from those in such statements due to, without limitation, (i) general economic conditions, including in particular economic conditions in the Allianz Group’s core business and core markets, (ii) performance of financial markets, including emerging markets, and including market volatility, liquidity and credit events (iii) the frequency and severity of insured loss events, including from natural catastrophes and including the development of loss expenses, (iv) mortality and morbidity levels and trends, (v) persistency levels, (vi) the extent of credit defaults, (vii) interest rate levels, (viii) currency exchange rates including the Euro/U.S. Dollar exchange rate, (ix) changing levels of competition, (x) changes in laws and regulations, including monetary convergence and the European Monetary Union, (xi) changes in the policies of central banks and / or foreign governments, (xii) the impact of acquisitions, including related integration issues, (xiii) reorganization measures, and (xiv) general competitive factors, in each case on a local, regional, national and / or global basis. Many of these factors may be more likely to occur, or more pronounced, as a result of terrorist activities and their consequences. The company assumes no obligation to update any forward-looking statement.
No duty to update
The company assumes no obligation to update any information contained herein.
CONTENTS
03 Introduction
04 Executive summary
05 Overall results
09 Results by region
19 Conclusion: Sustainability and beyond
21 Annex: Methodology and data
31 Glossary
33 Abbreviations
34 Sources
35 Recent publications

Allianz International Pension Papers 1/2016
3
Driven by unfavorable demographic developments and unsustainable, outdated or fragmented systems, pension reform has been at the top of political agendas across the globe for many years now. The reform process in each of the wide range of countries addressed by this survey differs considerably. The Allianz Pension Sustainability Index (PSI),1 which combines the various characteristics of pension systems with the factors that influence them, tracks and evaluates the policy changes made in different countries around the world. In addressing the sustainability of a country’s public pension system, the PSI provides an indication of a country’s need for reforms to maintain long-term financial sustainability. This can be difficult to assess given the many country-specific institutional, technical and legal framework, however, there are key variables that impact the sustainability of national pension systems regardless of a country’s distinct parameters. By taking a systematic approach to studying these dynamic variables, the PSI evaluates the long-term sustainability of national pension systems and thus the pressure on governments to reform them.
This edition is an updated and extended version of the PSI 2014.
Introduction
1 The basic concept of what was formerly called the Pension Reform Pressure Gauge was developed by Allianz Dresdner Economic Research and first published in Allianz Dresdner Asset Management’s Central and Eastern Europe Pensions: Reform trends and growth opportunities in 2004. It was further developed and updated in: Allianz Global Investors, 2007: Central and Eastern European Pensions 2007: Systems and markets; Allianz Global Investors, 2007: Asia-Pacific Pensions 2007: Systems and markets; Allianz Global Investors, 2008: Funded Pensions in Western Europe 2008; Allianz Global Investors, 2008: Retirement at Risk: The US pension system in transition. In 2009, Allianz combined the regional results into one report; Allianz Global Investors, 2009: Pension Sustainability Index 2009, International Pension Papers, No. 5. Since then, the results have been updated in 2011 and 2014.

Allianz International Pension Papers 1/2016
4
• A substantial majority of countries exhibit an improvement in their sustainability score even though the demographic outlook for many of these countries has deteriorated since 2014, following the release of new revised population projections by the UN in 2015.2
• This trend has been mainly driven by two factors: a general increase in the effective retirement age and downward revisions in pension expenditures’ forecasts for the coming decades. Both factors are the outcomes of pension reforms implemented in most of the cases about a decade ago, and which are slowly starting to bear fruit.
• China and Thailand are under the highest pressure to reform. Both countries lack a comprehen-sive pension system and the risk of retirees falling into poverty is high in both nations.
• At the other end of the table, Australia, Denmark, Sweden, the Netherlands, Norway and New Zealand top the ranking as in 2014 with pension systems that appear to be the most sustainable over the long term.
• The 2016 PSI study has been expanded to 54 countries and now includes Argentina, Colombia, Peru and the Philippines. All four countries have a large informal sector, so the coverage of the various pension systems is relatively limited and old-age poverty risk is elevated.
• Argentina, Peru and the Philippines are under relatively limited pressure to reform, largely because their populations are young and expected to remain so in coming decades. These countries also have relatively low general government debt levels. This means they can afford to spend more on pensions if necessary. The design of the pension systems of these countries is, however, poor overall, and the old-age provisioning schemes tend to be excessively complex. Colombia is under more immediate pressure to reform as its population is expected to age faster, and the government debt-to-GDP ratio is higher.
• Under the adjusted ranking (that is, excluding the newly added countries), five countries (Chile, France, Japan, Malaysia and Mexico) have moved up more than five places in the ranking compared to 2014. In contrast, Croatia, Ireland, Italy, Russia and Switzerland experienced a significant decline in their ranking compared to 2014.
Executive summary
2 For more information about the importance of demographics in Allianz Pension Sustainability Index, please refer to the “Methodology and data” section.

Allianz International Pension Papers 1/2016
5
The Pension Sustainability Index (PSI) systematically examines relevant elements of pension systems and the developments that influence them in order to evaluate the pressure govern-ments are under to undertake and implement reforms. In total, 54 countries have been analyzed according to a range of parameters in order to arrive at a country ranking that reflects the long-term sustainability of the pension system (Figure 1).
In the current study, the pension systems of China and Thailand were found to be the least sustainable in the long term. The population of both countries is expected to age quickly in coming decades, which is expected to weigh on public finances, especially as the retirement age (both legal and effective) is low. Both countries lack a comprehensive pension system and only a small share of the population is enrolled in a pension plan. The risk of retirees falling into poverty is elevated in both nations as the replacement rate is also low.
As in 2014, Australia appears to have the most sustainable system, followed by the same group of countries: Denmark, Sweden, the Netherlands and Norway. These five countries exhibit well-designed pension systems combining lean first pillar pensions with highly-developed funded pillars, and high legal and effective retirement ages which put them on a financially sustainable path over the long run.
In the broad middle, there are many countries with different systems and pre-conditions: “young” countries with fragmented pension systems challenged by a rapidly aging population; and “old” countries with developed pension systems, which have initiated reforms in an attempt to safeguard the financial sustainability of their old-age provisioning systems. These country results will be discussed in further detail in the section “Results by region.”
Overall results

Allianz International Pension Papers 1/2016
6
Figure 1: 2016 Pension Sustainability Index*
Source: Allianz Asset Management, International Pensions, September 2016 * Scale from 1 – high need for reforms to 10: minor need for reforms
0 2 4 6 8
NorwayNew Zealand
DenmarkAustralia
Latvia
Sweden
Estonia
Netherlands
ChileUnited States
United KingdomMexico
SwitzerlandHong Kong
CanadaLithuania
FinlandLuxembourg
PeruCzech Republic
MalaysiaArgentina
PhilippinesSingaporeGermany
RussiaAustria
BelgiumRomaniaBulgaria
TurkeySouth Korea
HungaryFrance
Slovak RepublicIreland
ColombiaTaiwan
IndonesiaCroatia
Cyprus
India
Portugal
Spain
MaltaItaly
BrazilGreece
SloveniaChina
Thailand
South Africa
Japan
Poland

Allianz International Pension Papers 1/2016
7
C H A N G E S I N T H E P S I S I N C E 2014In comparison with the 2014 edition, a large majority of countries exhibit an improvement in their sustainability score, even though the demographic outlook has deteriorated for most of them compared to 2014. This general increase in the sustainability of pension systems has been mainly driven by two factors: a general increase in the effective retirement age and downward revisions in the pension expenditures’ forecasts for the coming decades. Therefore, pension reforms initiated in many countries almost a decade ago seem to be bearing fruit.
In terms of methodology, one small change has been introduced: for countries characterized by a pension system composed of only one funded pillar3, the weight of demographics in the total score has been decreased. This is because the impact of population aging on the sustainability of the system is less important than in countries where the pension system includes a non-funded pillar.
The calculation of the PSI is based on figures that do not accord significance to small differences in underlying figures for the ranking. Therefore, countries with close values should be viewed as a group with similar results, as indicated by their color-coding. Nevertheless, some countries show major changes compared to their 2014 PSI ranking. First of all, it has to be noted that the number of countries in the green section of the ranking (indicating lower pressure to reform) increased from 23 in the 2014 edition to 31 in the current edition of the PSI.
Five countries (Chile, France, Japan, Malaysia and Mexico) moved up more than five places in the ranking compared to 20144 as the design of their pension systems improved and the burden of the pension system on public finances decreased (Figure 2). In comparison, Croatia, Ireland, Italy, Russia and Switzerland experienced a significant decline compared to 2014. In the case of Russia, the deterioration was mainly driven by the worsening fiscal situation. In the case of Switzerland, the worsening demographic situation (as a result of the revised UN population projections5) was the main driver. Finally, in Croatia, Ireland and Italy, the deterioration was not driven by any one single factor but rather was more broadly based. The country-specific results are discussed in more details in the section “Results by region.”
Canada, Luxemburg, Portugal, Romania, Sweden and the UK all fell one or more places in the ranking although their sustainability scores did not deteriorate. For these countries, the deterioration is relative. In absolute terms, the sustainability of their system remains unchanged, but it has not improved as much as in other countries. It is important to note that Portugal in particular has made significant reform progress over the past two years. There the legal retirement age has been increased and is now linked to life expectancy.
Denmark has also maintained its reform effort, which explains why the country moved up four places and joined the group of countries with highly sustainable pension systems. Belgium and France have also implemented important reforms that impacted their score and ranking positively. The legal retirement age in both countries has been increased, while Belgium has tightened the conditions for early retirement and France has increased the contribution rate. Greece has also announced new reforms, but these have not yet been implemented. Given
3 Hong-Kong, Malaysia and Singapore
4 Without considering the four countries introduced in the 2016 ranking.
5 United Nations, Population Division of the Department of Economic and Social Affairs, World Population Prospects, 2015 Revision, https://esa.un.org/unpd/wpp/publications/files/key_findings_wpp_2015.pdf

Allianz International Pension Papers 1/2016
8
the country’s poor track record in reform implementation, these announcements have not influenced Greece’s score and ranking significantly. Poland has recently announced several reforms that are likely to undermine the sustainability of the pension system in the long run. Further, policy reversal is a key risk to monitor in Poland.
In this update, the revised version of the UN population projection was used which suggests major changes in the old-age dependency ratio for 2050. Population projections have deterio-rated for most countries in focus, especially China, Singapore and Switzerland. Hong-Kong, Indonesia, Mexico and South Africa are the only countries where population projections have improved. The basis used for (current and projected) pension expenditures was the latest Global Aging Report (Standard & Poor’s, 20166). Projected pension expenditures as a share of GDP have been significantly revised downwards for a large number of countries, especially in Eastern and Western Europe.
However, the outlook for pension expenditures in Brazil, China, Poland, Russia and Thailand has worsened compared to two years ago. In Brazil and Russia, the ongoing economic and financial crisis and the lack of any reform are largely to blame for this development. In Poland, the increase in long-term pension expenditures as a share of GDP is mostly due to the recent decision to reduce the size of the funded pillar and to make participation in the private pension pillar voluntary.
Figure 2: Pension Sustainability Index – Rankings’ change between 2014 and 2016
Source: Allianz Asset Mangement, International Pensions
30
35
45
50
40
0 5 10 15 20 25 30 35 40 5045
15
25
10
20
5
0
R A N K I N G 2 0 1 6
Decline in ranking compared to 2014
Increase in ranking compared to 2014
R A N K I N G 2 0 14
Russia
Ireland
SwitzerlandMexico
Malaysia
Chile
Croatia
Italy
France
Japan
6 Standard & Poor’s, Global Aging 2016: 58 Shades Of Gray, April 2016, https://www.globalcreditportal.com/ratingsdirect/renderArticle.do?articleId=1624798&SctArtId=385548&from=CM&nsl_code=LIME&sourceObjectId=9616035&sourceRevId=1&fee_ind=N&exp_date=20260428-15:49:46&sp_mid=68614&sp_rid=22560

Allianz International Pension Papers 1/2016
9
W E S T E R N E U RO PE A N D N O R T H A M E R I C AWestern Europe continues to show a clear divide between Scandinavian and Nordic countries and the peripheral countries, which remain at the low end of the Western Europe’s ranking (Figure 3). The Scandinavian and Nordic countries continue to exhibit high sustainability scores while Greece, Ireland and Italy saw their score drop significantly compared to 2014.
In Greece, the government recently adopted measures to improve the sustainability of the system, but these have not yet been implemented. The Greek system remains under tremendous pressure, while the government debt-to-GDP ratio has deteriorated significantly since the last update. The 2050 old-age dependency ratio forecast has also been revised upwards, which also contributes to the poor ranking.
Results by region7
7 For details about the pension systems of all countries included in the study, please refer to Allianz International Pensions Country Factsheets published every year. http://projectm-online.com/app/uploads/PROJECTM-international-pensions-facts-and-figures-july-2016.pdf
Figure 3: Pension Sustainability Index for Western Europe and North America
Source: Allianz Asset Management, International Pensions* Scale from 1 – high need for reforms to 10: minor need for reforms
0 2 4 6 8
Netherlands
Sweden
Denmark
Norway
Latvia
Estonia
United States
United Kingdom
Switzerland
Canada
Finland
Luxembourg
Germany
Austria
Belgium
France
Ireland
Portugal
Cyprus
Spain
Malta
Italy
Greece
Allianz International Pension Papers 1/2016
10
Italy and Spain have both implemented recent reforms, but more needs to be done to make the pension systems more sustainable. The effective retirement age remains relatively low in both countries while pension expenditure as a percentage of GDP remains high, and the populations are expected to age quickly. Encouragingly, recent reforms undertaken by both countries mean that pension expenditure as a share of GDP is expected to increase significantly over the coming decades.
Ireland has been hit by a deterioration in the demographic outlook following the UN population projection revision and a significant change in the distance to social assistance level8, which means that the replacement rate (total mandatory) has declined significantly. As a result, the risk of retirees falling into old-age poverty has substantially increased. If retirees cannot afford basic needs, the State is likely to increase social spending in the coming years.
Denmark and the Netherlands saw their sustainability score improve, thanks to an increase in the legal retirement age. Interestingly, Sweden’s ranking improved despite a deterioration in its demographic outlook. Conversely, the deterioration of the demographic outlook of Switzerland had a negative impact on the sustainability score and ranking of the country. Nevertheless, Switzerland continues to compare favorably to peers thanks to a relatively low level of general government debt relative to GDP, a relatively high effective retirement age and a good coverage ratio. Moreover, pension expenditures as a share of GDP are not expected to increase dramatically in the coming decades.
In the middle of the index, the following countries have moved up: Austria (two places), Belgium (five), France (four), and Germany (three). The improvement is due to an increase in the effective retirement age in Austria, France and Germany and a positive revision of the 2050 pension expenditures-to-GDP forecast in Austria, Belgium and France.
Canada and the United States remain in the top 15 of the most sustainable pension systems. The slight deterioration of the demographic outlook in the US has had a negative impact on the sustainability score, but the American old-age provisioning system remains highly sustainable due to low pension expenditures and a young population that is expected to age slowly in the coming decades. As in previous years, Canada’s system remains highly sustainable with low pension expenditures as a share of GDP and a relatively favorable demographic outlook.
8 The distance to social assistance level is calculated using the (total mandatory) gross replacement rate. If the replacement rate is below 50% (that is, if retirees will on average receive less than 50% of the income they used to earn before they retired), additional welfare spending is likely to be needed so it has a negative impact on the overall sustainability score. If the replace-ment rate amounts to 50%, the impact on the score is neutral; if it is above 50%, it has a positive impact on the score.
Allianz International Pension Papers 1/2016
11
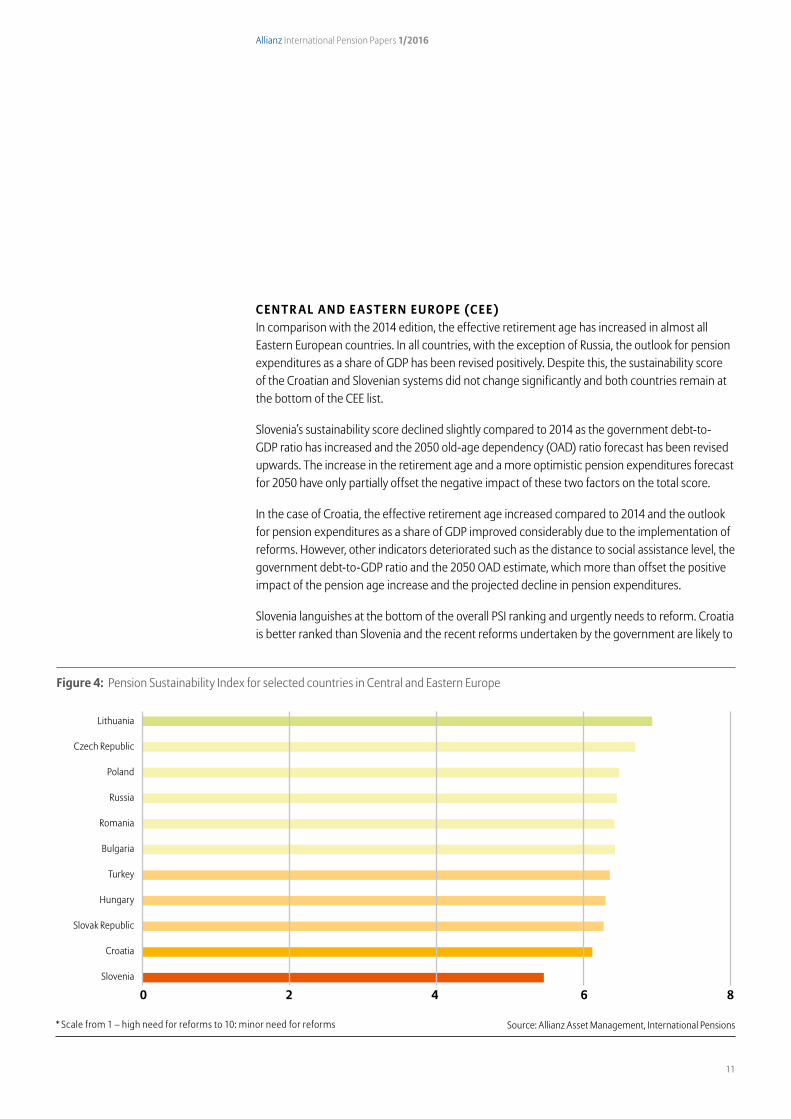
C E N T R A L A N D E A S T E R N E U RO PE (C E E) In comparison with the 2014 edition, the effective retirement age has increased in almost all Eastern European countries. In all countries, with the exception of Russia, the outlook for pension expenditures as a share of GDP has been revised positively. Despite this, the sustainability score of the Croatian and Slovenian systems did not change significantly and both countries remain at the bottom of the CEE list.
Slovenia’s sustainability score declined slightly compared to 2014 as the government debt-to-GDP ratio has increased and the 2050 old-age dependency (OAD) ratio forecast has been revised upwards. The increase in the retirement age and a more optimistic pension expenditures forecast for 2050 have only partially offset the negative impact of these two factors on the total score.
In the case of Croatia, the effective retirement age increased compared to 2014 and the outlook for pension expenditures as a share of GDP improved considerably due to the implementation of reforms. However, other indicators deteriorated such as the distance to social assistance level, the government debt-to-GDP ratio and the 2050 OAD estimate, which more than offset the positive impact of the pension age increase and the projected decline in pension expenditures.
Slovenia languishes at the bottom of the overall PSI ranking and urgently needs to reform. Croatia is better ranked than Slovenia and the recent reforms undertaken by the government are likely to
Source: Allianz Asset Management, International Pensions
Figure 4: Pension Sustainability Index for selected countries in Central and Eastern Europe
0 2 4 6 8
Lithuania
Czech Republic
Poland
Russia
Romania
Bulgaria
Turkey
Hungary
Slovak Republic
Croatia
Slovenia
* Scale from 1 – high need for reforms to 10: minor need for reforms
Allianz International Pension Papers 1/2016
12
improve the outlook in the coming years; nevertheless, the reform effort needs to be maintained as the pension system remains under financial pressure. Russia’s sustainability score also declined compared to 2014 due to the ongoing economic crisis that has led to a significant increase in the level of government debt and pension expenditures.
As in 2014, Latvia, Estonia and Lithuania top the list for CEE countries. Estonia managed to even enter into the top 10 in the overall ranking, right below Latvia, while Lithuania moved up one group. The score of all three countries has been positively impacted by the fact that the three Baltic States have continued to implement reforms in order to increase the effective retirement age and reduce the burden of the pension system on public finances.
Turkey and Slovakia’s sustainability scores have also improved significantly for similar reasons. However, these countries have less sustainable pension systems than the Baltic States and further reforms are needed to ensure the financial sustainability of both old-age provisioning systems. Moreover, Slovakia may face an increased risk to its long-term sustainability as the second-pillar pension pot has been depleted to reduce the fiscal deficit. The Czech Republic, Bulgaria, Hungary and Poland have followed suit, and the diminished pension pots may subsequently be unable to support the low level of public pensions they were designed to bolster. This could increase the risk of retirees falling below the poverty level, in which case the state may need to intervene with welfare assistance, which would burden public finances.

Allianz International Pension Papers 1/2016
13
A S I A The diverse pension situation in Asian countries creates widely varying needs for reform. Emerging Asian markets in particular are undergoing major structural changes. Strong eco-nomic growth has led to a prosperous middle class throughout the region; however, increased urbanization and a breakdown in traditional family structures have caused extreme socio-economic changes which are altering the entire retirement landscape.
Asia is the region where the overall regional score related to the design of the pension system improved the least compared to 2014. In most of Asia, further initiatives will be required to establish comprehensive pension systems. Increasing the coverage of the public pension system also remains a challenge. Therefore, many Asian governments have begun to implement a multi-pillar system by introducing a variety of funded pensions. Countries with a strong funded pillar rank best in the PSI. The financial burden of the pension system in such cases is low as people have to rely on their own accumulated assets, as we see is the case in Hong Kong, Malaysia and Singapore.
China remains at the bottom of the list of Asian countries and the sustainability score of its pension system deteriorate significantly compared to 2014 as the revised UN population projections indicate that the Chinese population will age faster than expected. Furthermore, pension expenditure as a share of GDP has risen and is expected to further increase significantly
Figure 5: Pension Sustainability Index for selected countries in Asia
Source: Allianz Asset Management, International Pensions* Scale from 1 – 10: 10 minor need for reforms, 1 high need for reforms
Malaysia
Hong Kong
0 2 4 6 8
Philippines
Singapore
South Korea
Indonesia
Taiwan
Japan
India
China
Thailand

Allianz International Pension Papers 1/2016
14
in the coming decades. In addition, the government debt-to-GDP ratio has also increased since 2014. China compares similarly to Thailand, whose score remains unchanged compared to 2014 and both countries dwell at the bottom of the overall ranking. Thailand and China both lack a comprehensive pension system and the risk of retirees falling into poverty is high in both nations.
India, Indonesia and Japan score higher than China and Thailand, but remain in the low end of the overall ranking and under pressure to reform. In the case of Japan, the government has taken measures to reduce the burden of the pension system on public finances: the legal retirement age has been increased to 69 while pension benefits’ adjustments have been linked to life expectancy and the evolution of the number of contributors. These changes have positively impacted the sustainability score of the Japanese pension system. Nevertheless, the old-age provisioning system remains under significant pressure and the reform effort needs to be maintained as the effective retirement age remains much lower than the statutory age, the population is aging rapidly and old-age poverty remains quite elevated in Japan compared to the average for the group of countries that make up the Organization for Economic Cooperation and Development (OECD).
With respect to India, the retirement age is low and old-age poverty a serious source of concern as India lacks a comprehensive pension system. For those who are eligible for the pension, the replacement rate is low by international standards. Nevertheless, India’s population is young and projected to remain so for the foreseeable future, so even though the country scores poorly in terms of sustainability, it has time to adjust.
Indonesia is planning to gradually increase the retirement age: this will rise to 57 in 2019 and, afterwards, increase by one year every three years until it reaches 65 in 2043. The burden of the pension system remains relatively low, but the system remains fragmented. The coverage and replacement rates are also low which means that old-age poverty is a key risk, especially as the population is expected to age quickly. Nevertheless, Indonesia has recently introduced a new multi-pillar pension system aimed at increasing the coverage and improving the functioning of the scheme which might counteract this risk and lead to an improvement in the country’s score and ranking.
Hong Kong, Malaysia and Singapore remain the region’s top-ranked countries. They display a similar and rather atypical system based mostly on one funded pillar that requires people to rely on accumulated assets for their retirement income. Although such systems do not weigh significantly on public finances, they bear a higher risk of old-age poverty.
In Singapore, mandatory annuitization has been recently introduced in order to limit that risk. The sustainability score of the Singaporean pension system remains broadly unchanged compared to 2014, although the demographic outlook has deteriorated as a result of the revised UN population projections and the coverage ratio has declined. Singapore has moved down the ranking mostly because new entrants to the Index jostled it out of the way and because countries like Mexico have seen a significant improvement in their sustainability score. In the end, Singapore’s pension system remains under low pressure to reform.
Allianz International Pension Papers 1/2016
15
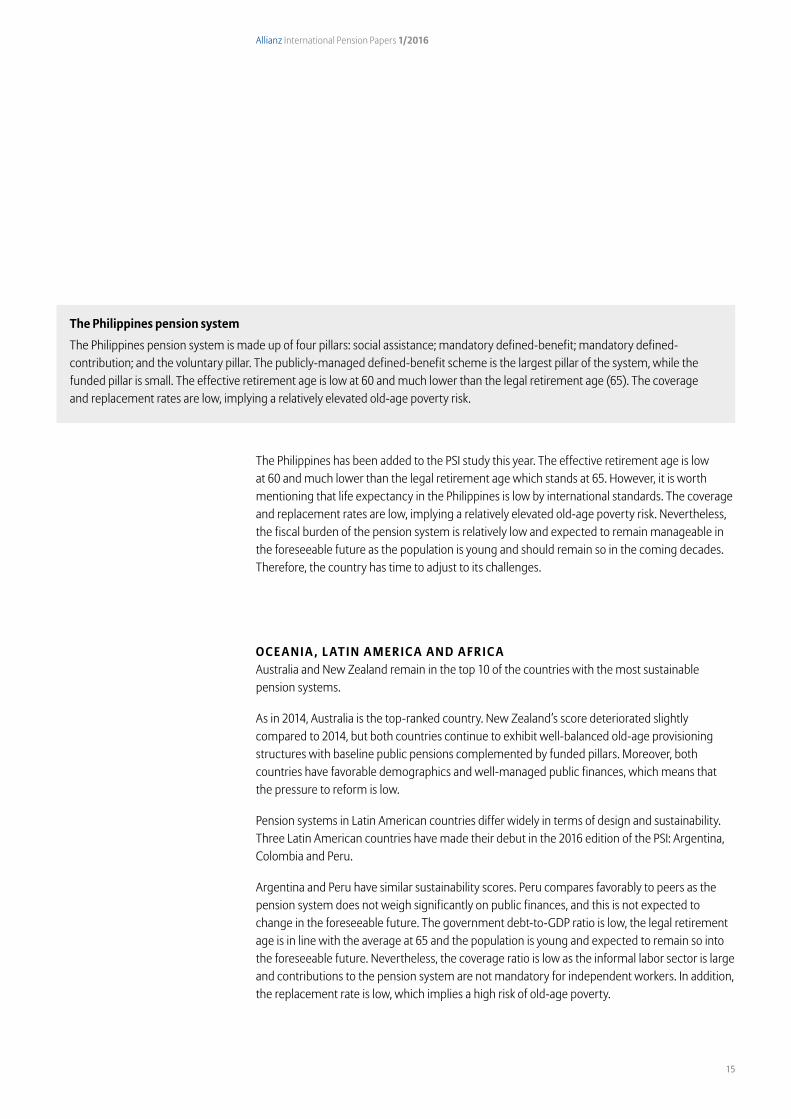
The Philippines has been added to the PSI study this year. The effective retirement age is low at 60 and much lower than the legal retirement age which stands at 65. However, it is worth mentioning that life expectancy in the Philippines is low by international standards. The coverage and replacement rates are low, implying a relatively elevated old-age poverty risk. Nevertheless, the fiscal burden of the pension system is relatively low and expected to remain manageable in the foreseeable future as the population is young and should remain so in the coming decades. Therefore, the country has time to adjust to its challenges.
O C E A N I A , L AT I N A M E R I C A A N D A F R I C A Australia and New Zealand remain in the top 10 of the countries with the most sustainable pension systems.
As in 2014, Australia is the top-ranked country. New Zealand’s score deteriorated slightly compared to 2014, but both countries continue to exhibit well-balanced old-age provisioning structures with baseline public pensions complemented by funded pillars. Moreover, both countries have favorable demographics and well-managed public finances, which means that the pressure to reform is low.
Pension systems in Latin American countries differ widely in terms of design and sustainability. Three Latin American countries have made their debut in the 2016 edition of the PSI: Argentina, Colombia and Peru.
Argentina and Peru have similar sustainability scores. Peru compares favorably to peers as the pension system does not weigh significantly on public finances, and this is not expected to change in the foreseeable future. The government debt-to-GDP ratio is low, the legal retirement age is in line with the average at 65 and the population is young and expected to remain so into the foreseeable future. Nevertheless, the coverage ratio is low as the informal labor sector is large and contributions to the pension system are not mandatory for independent workers. In addition, the replacement rate is low, which implies a high risk of old-age poverty.
The Philippines pension system
The Philippines pension system is made up of four pillars: social assistance; mandatory defined-benefit; mandatory defined-contribution; and the voluntary pillar. The publicly-managed defined-benefit scheme is the largest pillar of the system, while the funded pillar is small. The effective retirement age is low at 60 and much lower than the legal retirement age (65). The coverage and replacement rates are low, implying a relatively elevated old-age poverty risk.

Allianz International Pension Papers 1/2016
16
In the broad middle of the ranking, Argentina also compares relatively favorably to peers, despite the structure of its pension system (see the breakout box: “The Argentinian pension system”). As the population is relatively young, pension expenditures as a share of GDP remain manageable. In addition, Argentina’s government debt level relative to GDP remains moderate, which contributes positively to the overall score of the country.9 The effective retirement age is 65, slightly above the average. Nevertheless, pensions expenditures relative to GDP are expected to increase significantly over the coming decades and the coverage ratio is low, which means that old-age poverty is a key source of risk in Argentina.
Colombia ranks lower than Peru and Argentina as the retirement age and coverage ratio are low and the replacement rate is high. Old-age poverty is a real issue in Colombia, which the government has tried to address – but with limited success. On the positive side, Colombia has a young population that is expected to age slowly in the coming decades. As a result, the fiscal burden of the pension system is low and expected to remain so.
The Peruvian pension system
Two pension schemes have coexisted in Peru since the nineties: one publicly-managed, the other a privately-managed defined contribution plan. When an individual starts employment, the default option offered by the employer is the private system (SPP). However, the newly-employed worker can request to join the public pension scheme (SNP). As the public system offers a guaranteed benefit and privately-managed funds have the reputation of charging high fees, a majority of workers opt for the publicly-managed scheme. The coverage is low as the informal labor sector is significant and contributions to the pension system are not mandatory for independent workers. In 2012, it was decided that all independent workers under the age of 40 would be required to contribute from August 2014, but the regulation was repealed a month later.
The Argentinian pension system Argentina does not have a multi-pillar system and relies exclusively on a defined-benefit scheme. In the 1990s, Argentina reformed the pay-as-you-go scheme introduced at the beginning of the 20th century and created a funded private scheme. However, in 2008 Argentina reverted to a publicly managed defined-benefit scheme. The retirement age – both legal and effective – is set at 65, which is slightly above the average retirement age of the countries included in the study. While the replacement rate is high, the coverage ratio is below 50%, hence old-age poverty is a key risk.
9 Nevertheless, it is worth mentioning that Argentina defaulted on its government debt at the beginning of this century (the debt restructuring process started in 2005) which led to a significant decline in the general government debt-to-GDP ratio of the country.

Allianz International Pension Papers 1/2016
17
Both Chile and Mexico have seen their already high sustainability score improve since 2014. Both countries substituted their traditional PAYG systems with a system of individual accounts more than two decades ago. As a result, the fiscal burden of the pension systems is light and expected to remain so. Nevertheless, both countries have low replacement rates, which means old-age poverty is a risk, especially in Mexico where the coverage of the pension system is also low. The Chilean government has introduced an additional solidarity pension system for the poorest segment of the population, conditional on residency. The population of both countries is still young but expected to age quickly in coming decades.
The Colombian pension systemThe OECD reported in its 2015 Pension Policy Note on Colombia* that “the pension system [in Colombia] is very complex. Its structure is unusual as it comprises two parallel mandatory systems, a public PAYG defined-benefit scheme and a private defined-contribution scheme. Workers are allowed to switch between the two every five years up until ten years before retirement age … Since 2014 the retirement age is 62 years for men and 57 for women, with no possibility for late retirement in the public scheme.”
The retirement age is low by international standards. The replacement rate is high at 70% as the monthly minimum pension is equal to the legal minimum wage, although coverage is low. According to the OECD, “the system tends not to benefit low-income workers as they are typically not covered.” Old-age poverty is thus a real issue. In its report, the OECD adds that “a means-tested contributory scheme (Beneficios Ecónomicos Periódicos) has recently been introduced to provide retirement income support for informal and irregular workers.” Nevertheless, the OECD views the recent reforms as insufficient to reduce old-age poverty risks.
H T T P :// W W W.O E C D.O RG/E L S/P U B L I C - P E N S I O N S/O E C D - P E N S I O N - P O L I C Y- N O T E S - C O L O M B I A . P D F
Figure 6: 2016 Pension Sustainability Index for selected countries in Latin America, Oceania and Africa
Source: Allianz Asset Management, International Pensions* Scale from 1 – 10: 10 minor need for reforms, 1 high need for reforms
0 2 4 6 8
Australia
New Zealand
Chile
Mexico
Peru
Argentina
Columbia
South Africa
Brazil

Allianz International Pension Papers 1/2016
18
Brazil continues to occupy the lower end of the overall ranking with a low sustainability score. The score has been positively impacted by an increase in the effective retirement age and a decline in public pension expenditures as a share of GDP, but these developments are far from enough to ensure the sustainability of the system. While the effective retirement age has risen to 60, it still falls well short of the legal retirement age of 65, which itself remains too low. In addition, pension expenditures remain elevated and are expected to increase significantly over the coming 40 years (Standard & Poor’s expects public pension expenditures to amount to 16.8% of GDP in 2050) as the population is expected to age quickly. The country is also experiencing its worst economic crisis since the 1930s, which is having a significant impact on public finances. In response, the new government has promised to unveil a reform project before the end of the year.
Finally, the ranking of South Africa reflects its low sustainability score. The country lacks a comprehensive system, while the coverage ratio, replacement rates and retirement age all remain low. The low life expectancy and young population means that the fiscal burden of the pension system remains light and the country has time to adapt though. Given the other factors, old-age poverty is nevertheless a key risk in South Africa.

Allianz International Pension Papers 1/2016
19
Pension reforms have gained pace in Europe, particularly after the global financial crisis had a severe impact on public finances in many countries. These reforms have resulted in a general increase in the legal and effective retirement ages which are now better linked to life expectancy increases. Moreover, and partly as a result of this increase in the retirement age in many countries, the expected increase in pension expenditures (as a share of GDP) has been successfully reduced and the burden of the pension systems on public finances seems to be more under control (although further reforms are necessary in many countries and the reform effort should be maintained). This general improvement is visible in the latest PSI results which show that the sustainability of the pension systems of many countries has improved compared to 2014.
The PSI assesses the financial sustainability of pension systems over the long term without taking into account the adequacy of retirement income. 10 Retirement income adequacy is another dimension of pension reform that needs to be taken into consideration while reforming a pension system, as increasing the sustainability of a pension system may come at the expense of the adequacy of retirement income. A declining perception of income adequacy creates social tensions, makes reforms unpopular and increases the risk of policy reversal – all of which endangers the financial sustainability of the system. Policymakers around the world face the difficult task of balancing sustainability and adequacy.
In a previous study, Allianz International Pensions developed a second indicator (the Retire- ment Income Adequacy Index – RIA) which ranks countries according to their potential to provide adequate retirement income. It is interesting to contrast the country ranking according to the sustainability criteria with the ranking obtained when the system is viewed through the adequacy lenses.11 Figure 7 plots the PSI (sustainability) ranking of the countries included in both studies against the RIA (adequacy) ranking.
Few countries manage to score high both in terms of sustainability and adequacy; exceptions include the Netherlands, Norway and New Zealand. Many countries score well on one dimen-sion, but not the other. For example, many Southern European countries (namely Cyprus, Italy, Malta, Portugal, Slovenia and Spain) plus Japan and Brazil have a public pillar that generates an adequate retirement income, but at the cost of the financial sustainability of the system, while their second and third pillars generate only limited additional income. These countries stand at the bottom left corner of the table.
In the top right corner of the graph, stand Australia, Chile, Estonia and Mexico where the pension systems are highly sustainable, but the income provided by the old-age provisioning scheme is far from sufficient. Finally, China, India and Thailand score poorly on both dimensions: their system is not financially sustainable, and at the same time they fail to provide an adequate pension to the vast majority of their citizens.
The Allianz Retirement Income Adequacy Index will be updated next year.
Conclusion: Sustainability and beyond
10 Allianz (2015). The RIA index is based on a wider approach which takes into account not only various income sources, but also additional factors (like spending needs) which influence income adequacy. http://projectm-online.com/app/uploads/adequacy-how-much-retirement-income-is-enough.pdf
11 To gain an easier overview, both the PSI and the RIA rankings have been combined in three groups, indicating high, moderate and low degrees of financial sustainability or retirement income adequacy respectively.

Allianz International Pension Papers 1/2016
20
Figure 7: Comparing sustainability and adequacy
Source: Allianz Asset Management, International Pensions
RIA 2015 Ranking
PSI 2
016
Rank
ing
DKNL
NO
USUK
SE
NZ
FICA
CH
00
5
5
10
15
20
25
30
35
40
45
50
2515 3510 3020 40 45 50
JP
BR
ESPT
ITMT
SK
KR
PLSG
MY
TR
IETW
ID
RF
GR
TH
IN
CN
EECL
HKMX
AU
SI
RO
FR
BEBG
HR
CZ
LT
AT
DE
LU
LV
HU

Allianz International Pension Papers 1/2016
21
12 We reversed the scale in order to align ourselves with a more intuitive perspective: low sustainability = small number; high sustainability = large number.
The PSI uses a range of sub-indicators – such as demographic developments, public finances and pension system designs – to systematically measure the long-term sustainability of a pension system. The sub-indicators include various parameters for the present status and future outlook of the system.
The individual variables of the sub-indicators are given a score of 1 to 10, with 1 indicating the lowest end of the valuation (e.g. high debt ratios, high replacement rates, high old-age dependency ratios or low legal retirement ages) and 10 indicating the highest.12 The variables are combined into a single score between 1 and 10 for each sub-indicator; the sub-indicators are then combined into a final score. A country with an overall score of 1 would indicate there is major need for reform as the system seems largely unsustainable; 10 would indicate no need for reform.
Here is an overview of sub-indicators that would weigh positively on the result:
• The national pension system has been designed to meet the needs of an aging society, for example, the:
• first pillar PAYG system offers moderate benefits and covers a large percentage of the workforce;
• legal retirement age is high and/or is based on long life expectancies; • funded pillars are in place to provide additional old-age income.
Annex: Methodology and data
Figure 8: Pension Sustainability Index sub-indicators
Source: Allianz Asset Management, International Pensions
Sub-indicators Status (0.75)** Dynamics (0.25)**
Demographics Old-age dependency ratio (OAD)* Change in OAD* until 2050
Pension system
Level of pension benefit from 1st pillar and coverage of workforce Change in level of pension benefit
Legal / effective retirement age
Reforms passedStrength of funded pillar and reserve fund (as % of GDP)
Public finances
Pension payments / GDP
Change of pension payments / GDP until 2050Public indebtedness / GDP
Need for welfare support
* Ratio of ≥ 65 years of age to 15 to 64 years of age ** Weighting

Allianz International Pension Papers 1/2016
22
• National demographics do not put much pressure on reform, for example: • the old-age dependency ratio is favorable; • any changes in the work-to-retirement balance are expected to be moderate.
• The government is in a position to cushion reform pressures, for example: • public pension payments are low; • the state has deep pockets so that it can either take on more debt or increase the burden on the economy to finance rising pension payments.
It is important to note that the PSI uses an intervallic scale to determine the ranking. Since the index does not have a cardinal order or a metric value, results cannot be used for calculations. Therefore minor differences in weightings cannot be fully differentiated between countries.
A D E E P D I V E I N TO T H E S U B - I N D I C ATO R S:
SU B - I N D I C ATO R “ D E M O GR A PH I C S”: One of the main factors undermining the long-term sustainability of a pension system is the population aging process, which has been one of the main driving forces for reform over the past three decades. Although population aging is a worldwide phenomenon, the current status and speed of this process can differ substantially from one country to another. This evolution can be monitored and analyzed using the old-age dependency (OAD) ratio, which measures the number of people aged 65 or older (retired population) as a share of the number of people aged 15 to 64 (working population). This indicator gives a clear indication of a country’s demographic profile. In the PSI, we look at both the current and the future situation. A country with a young population may be in a relatively comfortable position today, but a rapidly aging society may swiftly place such a country in hardship, as the time horizon to implement reforms is relatively short. We therefore included the projected 2050 OAD ratio to reflect the direction of change in each respective country and the urgency for political intervention. The data was taken from the 2015 revision of the UN “World Population Prospects” report (medium variant).
The OAD ratio is already quite high in Western Europe, which has seen a steady decline in birth rates and increase in life expectancy over the past decades. To put this into perspective, the OAD ratio is close to 30% in Western Europe, around 10% in emerging South-East Asia and South America, and slightly below 6% in Sub-Saharan Africa (Figure 9). Some countries with a relatively young population, however, are expected to see significant changes to their age structure in the coming decades – particularly in Asia and Latin America. By 2050, the OAD ratio will have almost tripled in South America, more than doubled in Asia, and increased by about 80% in North America and Europe. The median age of the global population is expected to increase to 36 years by 2050 from 30 in 2015, according to the latest projections of the UN. In 2015, Europe had the

Allianz International Pension Papers 1/2016
23
oldest population in the world, with a median age of 42 years in 2015, which is expected to reach 46 years in 2050.
The rapid change expected in Asia is due to a dramatic increase in life expectancy, which has jumped from 42 in 1950 to 68 years at the beginning of the 21st century – the biggest leap of any region in the world. This 26-year increase in longevity compares to increases of 10 in Europe, 10 in North America and 18 in Africa. With an increase of 20 years in longevity, Latin America follows Asia closely. Increased life expectancy, however, is not the only driver of this aging process. Over the last 50 years, Asia has seen a steep decrease in its fertility rate. On average, every woman in Asia gives birth to 2.3 children, roughly 60% less than in 1950. Again, only Latin America is facing such a similarly steep decline.
It is also important to highlight that the dynamics of aging differs considerably from country to country.13 For example, with an OAD ratio of 36%, the population of Japan is already considered as very “old.” Moreover, Japan’s OAD ratio is expected to double by 2050. This doubling, however, seems less significant when compared with increases in the OAD ratio of Asian countries characterized by a young population such as Hong Kong and Singapore, where the ratio is expected to increase fourfold. In Korea, Taiwan and Thailand, an even greater increase is anticipated (Figure 10). The OAD ratio in Hong Kong is expected to reach 64.6% by 2050 and will thus be close to the OAD of Japan and higher than the OAD of most Western European countries.
Figure 9: Old–age dependency ratios for different world regions
Sources: UN population division (2015), Allianz Asset Management14 *Population aged 65 and older to population aged 15 to 64
Western Europe and North America
Oceania Latam Emerging Asia
CEE Sub-Saharan Africa
30
35
50
20
25
40
45
10
5
15
0
2015 2050
World
13 For more details on old-age dependency ratios, see Allianz Asset Management 2014, Demographics in focus II-update, International Pension Papers 1/2014. http://projectm-online.com/app/uploads/demographics-in-focus-aging-2014-update.pdf
14 Western Europe and North America: Austria, Belgium, Canada, Cyprus, Denmark, Finland, France, Germany, Greece, Ireland, Italy, Luxemburg, Malta, the Netherlands, Norway, Portugal, Spain, Sweden, Switzerland, UK, USA – Oceania: Australia, New Zealand – Emerging Asia: Thailand, China, India, Vietnam, Sri Lanka, Indonesia, Mongolia, South Korea, Philippines, Malaysia – Latin America (Latam): Brazil, Uruguay, Colombia, Argentina, Peru, Mexico, Chile, Paraguay – CEE: Estonia, Latvia, Slovenia, Croatia, Slovakia, Hungary, Turkey, Bulgaria, Romania, Russia, Poland, Czech Republic, Lithuania – Sub-Saharan Africa: all countries in Africa except Algeria, Egypt, Libya, Morocco, Sudan, Tunisia.

Allianz International Pension Papers 1/2016
24
Some European countries also face a rapid aging process, such as Portugal, Slovenia and Spain (Figure 10).
SU B - I N D I C ATO R “ PE NSI O N S Y S T E M ”: This section includes features of the national pension systems and their future designs.
The amount of retirement income a pensioner receives has a strong impact on a given system’s financial sustainability. By comparing a large number of countries, the differences in replacement rate can indicate how generously a system is designed. We included this parameter, as well as its projected future change. There is, however, a flip side to reducing replacement rates. When retirement income is too low, old-age poverty becomes an issue. Financing welfare programs may then put more pressure on public finances than any relief gained by lowering the replace-ment rate. This in turn affects the PSI. Countries that don’t have additional funded systems in place to buttress their low replacement rates will score poorly on this sub-indicator. Therefore, to take this effect into account, we have included the importance of the funded system in a country, measured by assets in percentage of GDP, as part of this sub-indicator.
Public pension systems fall broadly into two categories. In countries such as Australia, Ireland, the United Kingdom and United States the public pillars cover only the most basic requirements in order to prevent old-age poverty; the replacement rate from the public mandatory pillar is thus very low. Any additional income needed to maintain a certain standard of living must be
Figure 10: Old-age dependency ratio – 2015 vs 2050
Sources: UN Population Prospects 2015, Allianz Asset Management
60
70
80
30
50
20
40
10
0DE
ATFR
FICH
MTCY
CAHR
SLCZ
RU TRKR
MYCN
BR ZAITSE
BEES
NLLU
NZUS
EELT
ROJP
IDTH
AG MKTWPH PEGR
PTDK
UKNO
IEAU
BGHU
LVPL SK
HKIN
SGCL CO
See p. 31 for abbreviations
Western Europe Eastern Europe Asia LatamOceania & North America
2015 data 2050 forecast

Allianz International Pension Papers 1/2016
25
generated through funded sources. On the other hand, the public pillars in continental Europe – particularly in France, Greece, Italy and Spain – take a much more generous approach and replacement rates remain relatively elevated.
In the context of the transition from communism to social democracies, CEE countries have implemented fundamental reforms to their pension systems. As a result, the average public pension has been significantly reduced while funded pension systems (either mandatory or voluntary) have been created to help fill the gap.
In African, Asian and Latin American countries, large discrepancies in replacement rates of the first pillar have a wide variety of explanations, such as a lack of a comprehensive pension system in India or South Africa, or a strong focus on the funded pillar in Chile, Malaysia or Mexico. (Figure 11)
In the case of Pay-As-You-Go (PAYG) systems, the ratio of retired beneficiaries to the contributors in the workforce is crucial for financing the system. Retirement entry age defines and distinguishes these groups. We have therefore included this parameter in the PSI variable spectrum. As there are various early-retirement options in place in many countries, we had to include the effective retirement age as well as the legal one. Both have a strong effect on a country’s ranking. For instance, to address the glut of 20th-century baby boomers in Western Europe’s workforce, many countries initiated early-retirement incentives to relieve the pressure on the job market. The result, however, was that large numbers of people left the workforce well below the legal requirement age, which then put pressure on public finances. In contrast, other countries raised
Sources: OECD, European Commission, national sources, Allianz Asset ManagementSee p. 31 for abbreviations *Income from first pillar pensions as % of pre-retirement income
Figure 11: Gross replacement rate,* first pillar pensions only
60
70
80
30
50
20
40
10
0ES
PTMT
NOBE
UKNL
CAPL
SLLV
RU HRTW
HKSG
CO ZALUAT
FIDE
GRCH
NZUS
SKRO
HUIN
PHKR
BR CLCNID PEIT
FRCY
DKSE
IEAU
TREE
LTCZ BG
THMY
JPAG MX
Western Europe
Eastern Europe Asia Latam
Oceania & North America

Allianz International Pension Papers 1/2016
26
the legal retirement age in order to lower the old-age dependency ratio – a move that generally has a positive effect on the long-term sustainability of the system. Although most countries set the retirement age at 65 or above, the effective retirement age can differ considerably – as is the case in Austria, Brazil, Croatia, Finland, Italy, Luxembourg, Malaysia and Turkey (Figure 12).
Over the past two decades, many countries implemented parametric reforms to their pension systems. Apart from increasing the retirement age, they designed measures to lower replace-ment rates (for example: changing the pension calculation, broadening the assessment base and changing the adjustment mechanism). In this way, countries sought to improve the long-term sustainability of their pension systems. Therefore, in the sub-indicator “pension system,” we have included a qualitative approach for the reform progress.
For example, if radical reforms had been introduced in the past to address dramatic demographic changes, thereby laying the groundwork for a solid and sustainable pension system in the future, the pressure to reform will not be high. In such instances, even though an aging population would normally trigger the need for reform to improve long-term sustainability, planned changes or those already in place would reduce the pressure for further reforms. An increasing retirement
Figure 12: Legal and effective retirement ages by region (years)
Sources: OECD, European Commission, National sources, Allianz Asset Management
62
64
66
68
70
56
60
54
58
52
50CH
CYDK
NOFR
GRIE
USTR
LTHU
PL EEID
PHHK
MX ZALUMT
SEDE
ITUK
NZCA
SKRO
SLIN
SGCN
CO PEMYJP BRAT
PTNL
BEES
FIAU
RUHR
BGCZ LV
THTW
KRCL AG
See p. 31 for abbreviations
legal retirement age (incl. expected increases) effective retirement age
Western Europe
Eastern Europe Asia Latam
Oceania & North America

Allianz International Pension Papers 1/2016
27
age, a reduction in a previously high replacement ratio or the strengthening of the funded system are all indications that reform is in progress. We therefore factor in reforms that have either already been introduced or have been agreed, but not yet carried out.
Datasets from the European Commission’s report on aging in 2015 were used for these variables in European countries. Data from the OECD and the World Bank filled in any information missing on pension parameters. Where necessary, national sources and statistics were added.
SU B - I N D I C ATO R “ P U B L I C F I N A N C E S”: Public finances is another sub-indicator used in the PSI to rank countries.
The parameters considered here are a) the pension expenditures as a percentage of GDP as well as the changes expected by 2050 and b) general government debt as a percentage of GDP.
Public spending on pensions (relative to GDP) is very useful to gauge the pressure exerted by the publicly managed part of the pension system on public finances. An aging society will
Figure 13: Current and projected public pension expenditures as % of GDP (2015 and 2050)
Sources: Standard & Poor’s, national sources, Allianz Asset Management
12
14
16
18
6
10
4
8
2
0GR
PTBE
DELU
XENL
CAPL
BGRO
TR LVTH
IDKR
CL ZAITAT
ESDK
MTUK
NZUS
HURU
SKJP
PHHK
BR PECNSG COFR
FINO
CHCY
IEAU
SLHR
CZEE LT
TWIN
MYAG MX
See p. 31 for abbreviations
2015 data forecast (2050)
Western Europe
Eastern Europe Asia Latam
Oceania & North America

Allianz International Pension Papers 1/2016
28
naturally cause pension expenditures to increase over the years. Many governments have already introduced reforms to lower pension levels, thereby decreasing the overall financial burden. If pension expenditures are already high, or if a dramatic increase is expected in the coming decades, it will have a negative overall effect on public finances. In a PAYG pension system, workers’ current contributions pay for pensioners’ current benefits. In addition, governments are obliged to provide for their retired civil servants. Countries with small PAYG systems – such as Australia, Canada, Ireland, New Zealand, the US and most Asian countries – are usually considered to be under less financial stress. Also, countries with a strong focus on the funded pillar – such as Chile, Malaysia, Mexico and Singapore – are in a more comfortable situation with regard to financial pressure (Figure 13). Asia as a whole, however, has yet to initiate comprehensive old-age provisioning systems, thus putting it at greater risk of having to subsidize public welfare programs.
General government debt as a percentage of GDP is factored into the PSI to indicate how far public finances can be stretched. The financial crisis and its successive economic stimulus packages have put pressure on public finances. In some European countries, general government debt has exploded in the last couple of years – so much that there is little room left to address increasing old-age expenditures.
The IMF’s World Economic Outlook database of October 2015 (see sources) provided the debt data; the Standard & Poor’s Global Aging Report 201615 was used for current and projected pension expenditure data. Where necessary, national sources and statistics were added.
15 https://www.globalcreditportal.com/ratingsdirect/renderArticle.do?articleId=1624798&SctArtId=385548&from=CM&nsl_code=LIME&sourceObjectId=9616035&sourceRevId=1&fee_ind=N&exp_date=20260428-15:49:46&sp_mid=68614&sp_rid=22560
Allianz International Pension Papers 1/2016
29
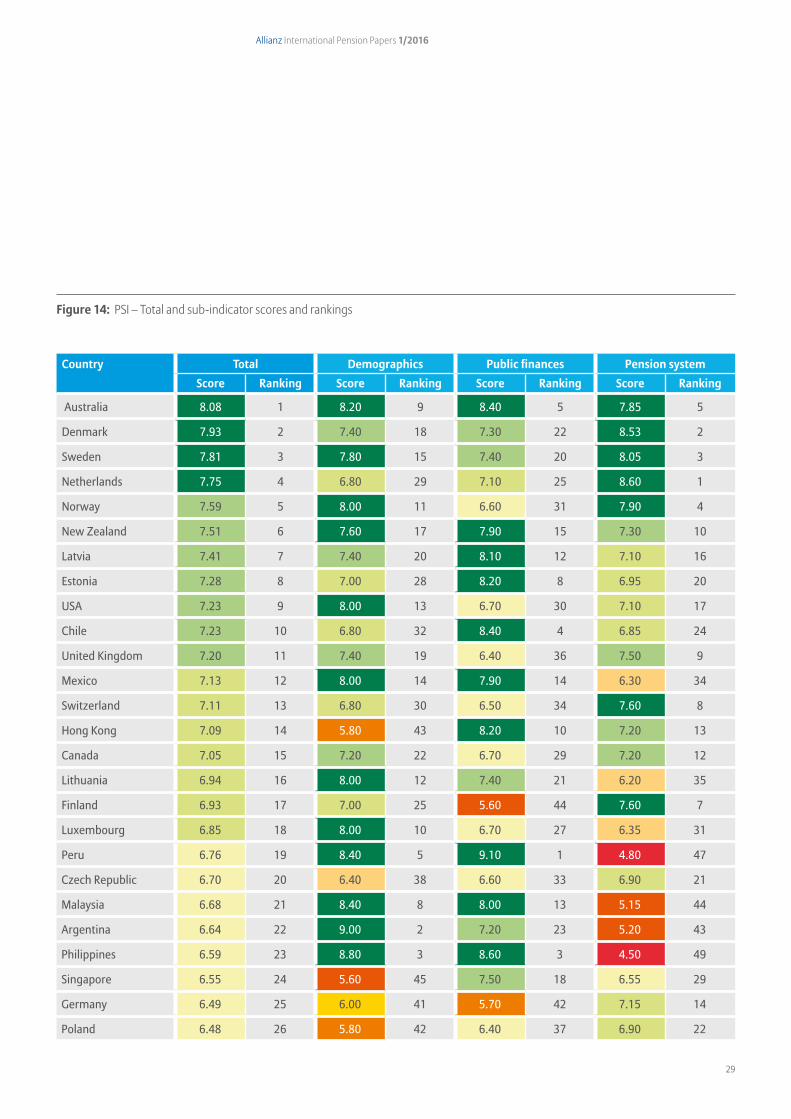
Country Total Demographics Public finances Pension systemScore Ranking Score Ranking Score Ranking Score Ranking
Australia 8.08 1 8.20 9 8.40 5 7.85 5
Denmark 7.93 2 7.40 18 7.30 22 8.53 2
Sweden 7.81 3 7.80 15 7.40 20 8.05 3
Netherlands 7.75 4 6.80 29 7.10 25 8.60 1
Norway 7.59 5 8.00 11 6.60 31 7.90 4
New Zealand 7.51 6 7.60 17 7.90 15 7.30 10
Latvia 7.41 7 7.40 20 8.10 12 7.10 16
Estonia 7.28 8 7.00 28 8.20 8 6.95 20
USA 7.23 9 8.00 13 6.70 30 7.10 17
Chile 7.23 10 6.80 32 8.40 4 6.85 24
United Kingdom 7.20 11 7.40 19 6.40 36 7.50 9
Mexico 7.13 12 8.00 14 7.90 14 6.30 34
Switzerland 7.11 13 6.80 30 6.50 34 7.60 8
Hong Kong 7.09 14 5.80 43 8.20 10 7.20 13
Canada 7.05 15 7.20 22 6.70 29 7.20 12
Lithuania 6.94 16 8.00 12 7.40 21 6.20 35
Finland 6.93 17 7.00 25 5.60 44 7.60 7
Luxembourg 6.85 18 8.00 10 6.70 27 6.35 31
Peru 6.76 19 8.40 5 9.10 1 4.80 47
Czech Republic 6.70 20 6.40 38 6.60 33 6.90 21
Malaysia 6.68 21 8.40 8 8.00 13 5.15 44
Argentina 6.64 22 9.00 2 7.20 23 5.20 43
Philippines 6.59 23 8.80 3 8.60 3 4.50 49
Singapore 6.55 24 5.60 45 7.50 18 6.55 29
Germany 6.49 25 6.00 41 5.70 42 7.15 14
Poland 6.48 26 5.80 42 6.40 37 6.90 22
Figure 14: PSI – Total and sub-indicator scores and rankings

Allianz International Pension Papers 1/2016
30
Country Total Demographics Public finances Pension systemScore Ranking Score Ranking Score Ranking Score Ranking
Russia 6.46 27 8.60 4 6.50 35 5.40 41
Austria 6.45 28 6.60 33 5.20 47 7.00 19
Belgium 6.43 29 7.00 24 4.30 51 7.25 11
Bulgaria 6.43 30 6.60 35 6.60 32 6.30 33
Romania 6.43 31 6.40 39 6.70 28 6.35 32
Turkey 6.36 32 7.60 16 8.20 9 4.85 46
South Korea 6.36 33 3.80 53 8.20 11 6.75 25
Hungary 6.30 34 7.20 21 5.70 43 6.15 37
France 6.28 35 7.00 26 4.90 48 6.60 27
Slovakia 6.28 36 6.60 36 7.00 26 5.75 39
Ireland 6.24 37 6.60 34 5.40 46 6.50 30
Colombia 6.23 38 7.20 23 8.60 2 4.55 48
Indonesia 6.15 39 8.40 7 8.30 7 4.00 50
Taiwan 6.15 40 3.60 54 7.60 17 6.70 26
Croatia 6.13 41 6.20 40 6.10 38 6.15 36
Portugal 6.09 42 5.00 49 3.90 52 7.75 6
South Africa 5.95 43 9.20 1 7.70 16 3.45 53
Cyprus 5.89 44 7.00 27 5.80 41 5.40 40
Spain 5.83 45 4.60 51 5.50 45 6.60 28
Japan 5.78 46 4.60 52 4.40 50 7.10 18
Malta 5.76 47 6.40 37 6.00 39 5.35 42
India 5.76 48 8.40 6 8.30 6 3.20 54
Italy 5.68 49 4.80 50 3.70 53 7.10 15
Brazil 5.64 50 6.80 31 5.90 40 4.95 45
Greece 5.49 51 5.00 48 3.30 54 6.85 23
Slovenia 5.46 52 5.20 46 4.70 49 6.00 38
China 4.98 53 5.60 44 7.20 24 3.55 51
Thailand 4.94 54 5.20 47 7.50 19 3.55 52
Allianz International Pension Papers 1/2016
31
Glossary
All definitions are from the World Bank (Discussion paper 1211, International Patterns of Pension Provision II, 201216), unless indicated otherwise.
Adequacy of a pension system: An adequate system is one that provides benefits sufficient to prevent old-age poverty (at a country-specific level) to the full breadth of the population in addition to providing a reliable means to smooth lifetime consumption for the vast majority of the population, taking into account the retirees’ (non-pension) wealth and their spending needs. (World Bank, The World Bank Pension Conceptual Framework17)
Annuity: A stream of payments at a specified rate, which may have some provision for inflation proofing, payable until some contingency occurs, usually the death of the beneficiary or a surviving dependent.
Coverage rate: The number of workers actively contributing to a publicly mandated contributory or retirement scheme, divided by the estimated labor force or by the working age population.
Defined-benefit plan: A pension plan with a guarantee by the insurer or pension agency that a benefit based on a prescribed formula will be paid.
Defined-contribution plan: A pension plan in which the periodic contribution is prescribed and the benefit depends on the contribution plus the investment return.
Effective retirement age: Average effective age at which older workers withdraw from the labor force18.
Funded pillar: pension scheme in which liabilities are 100% matched by assets.
General government: All government units and all nonmarket, nonprofit institutions that are controlled and mainly financed by government units comprising the central, state, and local governments; includes social security funds, and does not include public corporations or quasi-corporations19.
Legal retirement age: The age at which employees become eligible for pension benefits, excluding early‐retirement provisions.
Multi-pillar pension system20: In the mid-1990’s, the World Bank published a seminal paper on pension systems in the context of rapidly aging societies. In this paper, the World Bank came to the conclusion that traditional pension systems set up in the 20th century would not be able to cope with the rapidly aging process that most countries were facing at the time (and continue to face today) and outlined a new framework as the basis for new pension systems: the multi-pillar framework. It is structured as follows:
• the first pillar is mandatory, contributory and publicly managed. First pillars address, among others, the risks of individual myopia, low earnings, and inappropriate planning horizons due to the uncertainty of life expectancies, and the lack or risks of financial markets. They are typically financed on a pay-as-you-go basis.
16 https://openknowledge.worldbank.org/bitstream/handle/10986/13560/703190NWP0SPL000Box370035B00PUBLIC0.pdf
17 http://siteresources.worldbank.org/INTPENSIONS/Resources/ 395443-1121194657824/PRPNoteConcept_Sept2008.pdf
18 OECD
19 IMF Fiscal monitor, April 2016
20 http://siteresources.worldbank.org/INTPENSIONS/Resources/ 395443-1121194657824/PRPNoteConcept_Sept2008.pdf

Allianz International Pension Papers 1/2016
32
• The second pillar is mandatory, contributory, funded and can be either publicly managed (by a provident fund) or privately managed (by pension funds). Its objective is to enable individuals to avoid any major loss in their standard of living upon retirement.
• The third pillar is optional and privately managed. It gives the opportunity to save more money to individuals who want it.
A “zero pillar” is also recommended and consists in a non-contributory publicly managed plan. Its objective is to prevent old-age income poverty and to “ensure that people with low lifetime incomes are provided with basic protection in old age, including those who only participate marginally in the formal economy” 21.
Notional defined-contribution plan: A defined benefit pension plan that mimics the structure of (funded) defined contribution plans but remains unfunded (except for a potential reserve fund).
Old-age (income) poverty: the OECD considers people over 65 living with an income below half the national median as poor.22
Old-age dependency ratio (OAD): The ratio of older persons to working‐age individuals. The old‐age dependency ratio may refer to the number of persons over 60 divided by, for example, the number of persons aged 15–59, the number of persons over 60 divided by the number of persons aged 20–59, and so forth. For the calculation of Allianz Pension Sustainability Index, the OAD refers to the numbers of persons over 65 divided by the numbers of persons aged 15-64.
Pay-as-you-go scheme: Pension scheme in which benefits of current retirees are paid with contribution of current workers.
Pension expenditures: Usually defined as old‐age retirement, survivor, death, and invalidity/disability payments based on past contribution records plus noncontributory, flat universal, or means‐tested programs specifically targeting the old.
Pension fund: A fully funded, defined contribution scheme in which funds are managed by a private entity.
Provident fund: A fully funded, defined contribution scheme in which funds are managed by the public sector.
Replacement rate: The value of a pension as a proportion of a worker’s wage during a base period, such as the last year or two before retirement or more, or the entire lifetime average wage. Also denotes the average pension of a group of pensioners as a proportion of the average wage of the group.
Sustainability of a pension system: A sustainable system is one that is financially sound and can be maintained over a foreseeable horizon.
21 ibid
22 OECD, Pensions at Glance, 2013

Allianz International Pension Papers 1/2016
33
AR . . . . . . . . . .Argentina
AT . . . . . . . . . .Austria
AU . . . . . . . . . .Australia
BE . . . . . . . . . .Belgium
BG . . . . . . . . . .Bulgaria
BR . . . . . . . . . .Brazil
CA . . . . . . . . . .Canada
CEE . . . . . . . . .Central and Eastern Europe
CH . . . . . . . . . .Switzerland
CL . . . . . . . . . .Chile
CO . . . . . . . . . .Colombia
CN . . . . . . . . . .China
CZ . . . . . . . . . .Czech Republic
CY . . . . . . . . . .Cyprus
DB . . . . . . . . . .Defined benefit
DC . . . . . . . . .Defined contribution
DE . . . . . . . . . .Germany
DK . . . . . . . . . .Denmark
EC . . . . . . . . . .European Commission
ECB . . . . . . . . .European Central Bank
EE . . . . . . . . . .Estonia
ES . . . . . . . . . .Spain
FI . . . . . . . . . . .Finland
FR . . . . . . . . . .France
GDP . . . . . . . .Gross domestic product
GR . . . . . . . . . .Greece
HK . . . . . . . . . .Hong Kong
HR . . . . . . . . . .Croatia
HU . . . . . . . . .Hungary
IE . . . . . . . . . . . Ireland
IMF . . . . . . . . . International Monetary Fund
IN . . . . . . . . . . India
ID . . . . . . . . . . Indonesia
IT . . . . . . . . . . . Italy
JP . . . . . . . . . . . Japan
KR . . . . . . . . . .South Korea
Latam . . . . . .Latin America
LT . . . . . . . . . .Lithuania
LU . . . . . . . . . .Luxemburg
LV . . . . . . . . . .Latvia
MT . . . . . . . . .Malta
MX . . . . . . . . .Mexico
MY . . . . . . . . .Malaysia
NL . . . . . . . . . .Netherlands
NO . . . . . . . . .Norway
NZ . . . . . . . . . .New Zealand
OECD . . . . . . .Organization for Economic Co-operation and Development
PAYG . . . . . . .Pay-as-you-go
PE . . . . . . . . . .Peru
PH . . . . . . . . . .Philippines
PL . . . . . . . . . .Poland
PSI . . . . . . . . . .Pension Sustainability Index
PT . . . . . . . . . .Portugal
RIA . . . . . . . . .Retirement Income Adequacy
RU . . . . . . . . . .Russian Federation
RO . . . . . . . . . .Romania
SE . . . . . . . . . .Sweden
SG . . . . . . . . .Singapore
SI . . . . . . . . . . .Slovenia
SK . . . . . . . . . .Slovak Republic
TH . . . . . . . . .Thailand
TR . . . . . . . . . .Turkey
TW . . . . . . . . .Taiwan
UK . . . . . . . . .United Kingdom
UN . . . . . . . . .United Nations
USA . . . . . . . .United States
ZA . . . . . . . . .South Africa
Abbreviations
Allianz International Pension Papers 1/2016
34
Sources
Allianz Asset Management 2014, Demographics in Focus II-update, International Pension Papers 1/2014
Allianz Asset Management 2014, Pension Sustainability Index, International Pensions Papers 1/2014
Allianz Asset Management 2015, Retirement Income Adequacy Indicator, International Pension Papers 1/2015
European Commission, 2015: The 2015 Ageing Report: Economic and budgetary projections for the 28 EU Member States (2013-2060).
European Commission, 2015: 2015 Report of the Social Protection Committee, Review of recent social policy reforms
Eurostat database
International Labour Organization 2015: World Social Protection Report, 2014-2015
International Monetary Fund 2015: Fiscal Monitor October 2015, The Commodities Roller Coaster, A Fiscal Framework for Uncertain Times
International Social Security Association: Country Profiles
OECD, 2013: Pensions at a Glance 2013: OECD and G20 indicators
OECD 2014: Annual Survey of Large Pension Funds and Public Pension Reserve Funds, Report on Pension Funds’ Long-Term Investments, 2014
OECD, 2015: Pensions at a Glance 2015: OECD and G20 indicators
OECD 2015: 2015 Pension Policy Notes – Colombia
OECD 2015: Pension Markets in Focus, 2015
Social Security Administration and ISSA, 2014: Social Security Programs throughout the World: Asia and the Pacific
Social Security Administration and ISSA, 2014: Social Security Programs throughout the World: Europe
Social Security Administration and ISSA, 2015: Social Security Programs throughout the World: Africa
Social Security Administration and ISSA, 2015: Social Security Programs throughout the World: the Americas
Standard & Poor’s 2016: Global Aging 2016: 58 Shades Of Gray, April 2016
United Nations 2015: Population Division of the Department of Economic and Social Affairs of the UN Secretariat, 2015: World Population Prospects: The 2015 Revision (Medium Variant)
World Bank 2012: Pallares-Miralles, Montserra; Romero, Carolina and Whitehouse, Edward, International Patterns of Pension Provision II, A Worldwide Overview of Facts and Figures; World Bank, Discussion Paper No.1211
World Bank Pension database

Allianz International Pension Papers 1/2016
35
Recent publications
International Pension Papers
Country Factsheets . . . . . . . . . . . . . . . . . . . . . . . . . . . . . . . . . . . . . . . . . . . . . . . . . . . . . . . . . . . . 2016Retirement Income Adequacy Indicator . . . . . . . . . . . . . . . . . . . . . . . . . . . . . . . . . . . . . . . . 2015Security – Trust – Solidarity Perception of retirement: a cross-country comparison . . . . . . . . . . . . . . . . . . . . . . . . . . . 2014 2014 Pension Sustainability Index . . . . . . . . . . . . . . . . . . . . . . . . . . . . . . . . . . . . . . . . . . . . . . 2014Demographics in focus III: “60 is the new 50” . . . . . . . . . . . . . . . . . . . . . . . . . . . . . . . . . . . . 2014 Demographics in focus II-update: Aging . . . . . . . . . . . . . . . . . . . . . . . . . . . . . . . . . . . . . . . . 2014Demographics in Focus I-update: Population growth . . . . . . . . . . . . . . . . . . . . . . . . . . . . 2014 Preparing for Retirement – Financial Strategies of the Affluent 50+ Generation in European Countries . . . . . . . . . . . . . . . . . . . . . . . . . . . . . . . . . . . . . . . . . . . . . . . . . . . . . . . . . 2013 Impact of the Euro Debt Crisis on the Investment Behavior of 50+ European Investors . . . . . . . . . . . . . . . . . . . . . . . . . . . . . . . . . . . . . . . . . . . . . . . . . . . . . 2013Retirement Attitudes and Financial Strategies of the Affluent 50+Generation in Asia . . . . . . . . . . . . . . . . . . . . . . . . . . . . . . . . . . . . . . . . . . . . . . . . . . . . . . . . . . . . . . . . . . . . . . . . 2012Routes to Private Pensions in China – A Scenario Analysis of China’s Private Pension Market . . . . . . . . . . . . . . . . . . . . . . . . . . . . . . . . . . . . . . . . . . . . . . 2012Why Saving on a Regular Basis may be Wise! . . . . . . . . . . . . . . . . . . . . . . . . . . . . . . . . . . . 2012Wanted: Flexibility in Retirement Entry . . . . . . . . . . . . . . . . . . . . . . . . . . . . . . . . . . . . . . . . . 20122011 Pension Sustainability Index . . . . . . . . . . . . . . . . . . . . . . . . . . . . . . . . . . . . . . . . . . . . . . 2011Pensions in Turkey – A Race against Informality and Low Retirement Ages . . . . . . . . 2011
International Pension Issues
What’s happening in Poland? . . . . . . . . . . . . . . . . . . . . . . . . . . . . . . . . . . . . . . . . . . . . . . . . . . 2016 What’s happening in Turkey? . . . . . . . . . . . . . . . . . . . . . . . . . . . . . . . . . . . . . . . . . . . . . . . . . . 2014 What’s happening in Germany? . . . . . . . . . . . . . . . . . . . . . . . . . . . . . . . . . . . . . . . . . . . . . . . . 2014What’s happening in Japan? . . . . . . . . . . . . . . . . . . . . . . . . . . . . . . . . . . . . . . . . . . . . . . . . . . . 2014What’s happening in India? . . . . . . . . . . . . . . . . . . . . . . . . . . . . . . . . . . . . . . . . . . . . . . . . . . . . 2013What’s happening in Malaysia? . . . . . . . . . . . . . . . . . . . . . . . . . . . . . . . . . . . . . . . . . . . . . . . . . 2013 What’s happening in the Netherlands . . . . . . . . . . . . . . . . . . . . . . . . . . . . . . . . . . . . . . . . . . 2012Germany – Slight increase in gross financial assets . . . . . . . . . . . . . . . . . . . . . . . . . . . . . . 2012UK – On course for an innovative pension system . . . . . . . . . . . . . . . . . . . . . . . . . . . . . . . 2011Focus: Germany – Financial assets continued to rise in 2010 . . . . . . . . . . . . . . . . . . . . . 2011
http://projectm-online.com/research
