international migration and poverty: a cross country analysis
TRANSCRIPT

1
International Migration and Poverty: a Cross Country Analysis
Cristina Cattaneo∗
Abstract
The objective of the paper is to empirically investigate the effect of migration on poverty in origin countries, using data from a cross country analysis. Moreover, the research aims to indirect ascertain whether migrants are selected in terms of welfare levels, through the comparison of the effects of international migration on different income quintiles of the population. The relationship between migration and poverty is as well analysed for different sizes of the network of relatives and friends, in order to cast some light on the importance of the network effect. To proxy the level of international migration, the variable stock of migrants is computed from a new data set, personally constructed, which contains bi-lateral information on the number of migrants produced by 149 origin nations and resident in 23 OECD destinations.
JEL Classification: F22, I32, O11
∗ Università degli studi di Milano; Università Carlo Cattaneo –LIUC; University of Sussex

2
1. Introduction The role of international migration, both as a source for development in the labour sending
countries, as well as a mean for redistribution of both between and within country welfare, has
been recently recognized. International migration has rapidly grown and continues to rise: in
particular, according to the UN estimates (UN, 2004), the stock of migrants increased by 13.5
percent in the last 10 years; moreover, the stable increase in migration movement is accompanied
by a considerable flow of remittances, which now constitute one of the largest sources of
external funding for developing countries.
The potential role of remittances relies on the fact that they directly benefit the
households, rather than being transferred to public institutions. Through increasing consumption,
for example, they might be a valid candidate for reducing transient poverty, in particular in cases
of adverse shocks affecting poor households. Moreover, they might boost investments and
consequently affect structural poverty through freeing capital constraints. International migration
and remittances may constitute, therefore, a visible instrument to reshape the countries of origin.
In the World Development Report 2006, which extensively covers equity and development
issues, international migration is listed among a range of institutions and policies for lower world
inequality.
However, regardless of the high expectations attached to international migration, its
effect on structural poverty and its impact on inequality are far from understood. Because of the
political sensitivity of the topic, in fact, the research interest mainly focused on the impact of
migration on receiving countries’ economy whereas its effect on origin countries has been under-
researched. There have been some empirical contributions at a micro-level, which, however,
failed to provide some common view and agreement on the actual benefits of migration on
labour sending economies.
The objective of the following analysis, therefore, is to empirically investigate the effect
of migration on poverty in labour sending countries, using data from a cross country analysis.
Moreover, the research aims to provide insights on the existence of a selective mechanism
driving the migration decisions. The above concept refers to a process, which triggers people
with some specific characteristics rather than others to migrate; if this selection occurs, migrants
may be endowed with specific features: for example they may be mainly drawn from the upper
or from the lower tail of the income and skill distribution. Understanding the selectivity of
migration is quite crucial, because the specific characteristics of migrants, in terms of welfare
and education in particular, determine how the potential benefits of migration distribute among

3
the population and how these effects spread among the non-migrants families. If only high
income households sent migrants abroad, families at the bottom tail of the income distribution
are likely to be excluded from the beneficial effects of migration: international migration,
therefore, would fail to impact on poverty and would constitute a source of inequality for
developing countries. The very poor have the most to gain by migration to high wage countries,
but they are the least able to meet the resources to complete the migration process: migration in
fact is a costly investment. The poor likely face credit constraints, and incur in higher borrowing
expenditures than would do the well-off individuals, because of default risks. As a consequence,
the high costs may constitute an impediment to the migration of the poor people. At the same
time, however, the constraint induced by poverty may have declined over the first global century,
due to transport revolutions, which lowered the costs for travelling and reduced the time lost in
transit from home to destination and therefore foregone earnings.
To date, the extent to which migration flows are selecting individuals in a non systematic
way has never been explored at a macro level, mainly because of the lack of reliable data on
migrant stocks as well as migrants’ characteristics at an aggregate level.
The remainder of the paper is organized as follows. Section 2 reviews the empirical
findings on the effects of migration in labour exporting countries. Section 3 analyses the figures
on migration, drawn from a new data set. Section 4 outlines the methodology adopted. Section 5
presents the econometric analysis and Section 6 provides summary and conclusions.
2. The Empirical Literature on the Effects of Migration
The effects of migration on poverty and income distribution depend on two factors: first, on the
welfare characteristics of the migrants’ families and second on the existence of spillovers effects
from migrants’ to non-migrants’ households. First, one of the existing hypotheses is that at the
beginning of the migration process only limited elite are likely to migrate, adding the effect of
migration to the pre-existing inequality, whereas for a longer migration experience at a
community level, a wider social spectrum might be able to move, proving a more equalizing
result. Stark, Taylor and Yitzhaki (1986; 1988), confirm this prediction, comparing the
experience of two Mexican villages at different stages of migration: in particular, they conclude
that in the village where many households are engaged in internal migration, and only few
households in Mexico-to-United States migration, internal remittances have an equalizing effect,
while international remittances increase inequality. On the contrary, in the second village with
longer history of international migration, external remittances dampen inequality while internal
remittances worsen the Gini Coefficient. Jones (1998) finds a negative correlation between

4
inequality and migration in those Mexican towns where less than 30 percent of the families have
long term experience in migration, whereas he finds that the relationship reverses in town with
more than 30 percent of long term migrant households. From this follows that migration and
inequality show an inverted U-relationship.
The importance of the network effect reveals in both the contributions: the network of
family, friends or community members, in fact, helps reducing the emigration costs, which deter
initially poor migrants from emigration and it represents a mean to limit the risks involved in the
process. In communities which offer a high migration network, migration becomes accessible to
poor people and hence remittances prove equalizing. The role of network in shaping the link
between remittances and inequality is crucial in the analysis of McKenzie and Rapoport (2004),
where a measure of prevalence ratio proves significant and negative in an inequality regression.
In agreement with Massey et al. (1994) they compute the prevalence ratio as the proportion of
community members that moved internationally and this variable is interpretable as a measure of
relative network size. The authors test for the existence of nonlinearity in the inequality and
network relationship, but the quadratic term in the regression did not result in a significant effect:
the result, therefore, suggests that an increase in the prevalence ratio reduces inequality, with no
distinction between low and high migration communities. On the contrary, McKenzie (2005)
finds that migration reduces inequality only in high migration communities, whereas migration
has a positive, though insignificant effect on inequality, in low migration areas.
There is a second factor influencing the effect of migration: the existence of spillovers
effect from migrants’ non-migrants’ families; for example the remittances sent back from
migrants can generate a stimulus to the economy, via the consumption multiplier, producing
indirect effects which do not accrue solely to migrant’s families, but do expand to non-migrant’s
households as well. Adelman and Taylor (1990), using a computable general equilibrium (CGE)
model, quantify that for every dollar remitted to Mexico, the GDP increases by $2.9. The authors
find that the multiplier effect is maximized when remittances benefit rural households because
the money favours consumption of goods produced domestically. Moreover, the multiplier effect
ensures that remittances not only raise incomes of migrant sending families, but they also
increase incomes in non-migrant’s households. Spillover mechanisms to non-migrant’s
households are also found in Yang and Martinez (2005) for Philippines, where the effects of an
increase in remittances are transmitted to families without migrant members. Taylor, Zabin and
Eckhoff (1999) applying a CGE model in rural El Salvador, quantifies the outcomes of
international migration: although the short run effect of emigration on production is negative, the
total village income increases. The overall higher income augments demand for nationally

5
produced goods, generating rural-urban linkages and encourages savings. The positive effects are
transmitted in the medium-long run via the increased investment, which augments the stock of
capital and raises the productivity of other factors in production, such as labour. However, it
should be noted that the net effect on non-migrant household is negative, as the group is
adversely affected by the contraction in local production, without being compensated through the
inflow of remittances.
The existence of multiplier effects and the role of the network in spreading the migration
opportunities to the less well off people affect as well the relationship between migration and
poverty. Generally, the empirical literature which examines the effect of international migration
on poverty produce optimistic results; among the studies which are based on household surveys,
can be quoted Adams (1991), which predicts relief from poverty for 9.8 percent of poor
households in Egypt, if they were able to acquire remittances from migration. Adams (2005)
predicts household expenditure excluding and including remittances and reports that both
internal and international remittances have a dampening effect on three measures of poverty,
which capture the level, depth and severity of poverty in Guatemala. Moreover, a distinct effect
of internal and international remittances on poverty does not reveal. On the contrary, in Mora
and Taylor (2004), international remittances in Mexico dampen the three measures of poverty
more than do internal remittances. Moreover, the effect of this income source on poverty is
stronger in those rural areas with larger proportion of households receiving remittances. Lopez
Cordova (2005) agrees with the finding that municipalities with a higher number of families with
a migrant member show a lower measure of the poverty headcount. Yang and Martinez (2005),
compute the effect of an increase in international remittances on poverty and it results that
remittances reduce the household’s likelihood of being in poverty in the Philippines. Moreover,
the beneficial impacts of remittances transmit to non-migrants family, in part through gifts and in
part via a general increase in the economic activity.
The first and unique attempts to address the relationship between migration and poverty
at an aggregate cross-country level are represented by Adams and Page (2003a; 2003b). After
controlling for the level of income and for the income inequality, the authors test the effects of
the stock of migrants per capita or the level of remittances per capita on the three measures of
poverty. In Adams and Page (2003b) a poverty reducing impact of both migration variables
feature, though, sometimes, they are poorly determined; in particular, a 10 percent increase in the
share of migrants per capita reduces the proportion of people living in poverty by 1.9 percent and
decreases the depth of poverty by 1.5 percent. A 10 percent increase in the remittances variable

6
reduces the head count by 1.6 percent, and both the poverty gap and the severity index by 2 per
cent.
3. Migration Figures
The empirical literature focusing on international migration has been historically constrained by
the lack of comprehensive figures on migrants’ stocks and flows, due to difficulties in collecting
the data, and no big improvements have been achieved recently on the ground. The major
limitation is that only a few of the main labour exporting countries accumulate evidence and
publish accurate records on outflows of natives: therefore, it is impossible to establish how many
international migrants are produced every year, in particular by developing countries and what is
the exact stock of migrants living around the world.
A second best approach, which has been used to collect international information, is to
access destination countries’ registers and censuses: rather than monitoring the outflow of
nationals from source countries, it has been analysed the inflow of foreigners into destination
countries, classified by regions of origin. For example, it is known the exact number of
immigrants living in US in various years and this information can be disaggregated according to
the countries of origin: the collection of information, however, can by no means be complete,
requesting details of the migration flows from every country of the world toward every other
country of the world; therefore, the gathering of the information is constrained to a restricted
number of destinations, typically OECD destinations (Carrington and Detragiache (1998),
Adams and Page, 2003b; Docquier and Marfouk, 2005).
A similar approach has been followed and a new data set has been personally
constructed: the data set contains bi-lateral information on the stock of migrants for 149 and 86
developing and transition economies in 2001 and 1991 respectively, resident in 23 destination
nations; a variable measuring the stock of migrants is then computed, aggregating the
information for the same country of origin. The data set shows some advantages with respect to
the previous data sets available, published by Adams and Page (2003b) and Carrington and
Detragiache (1998): in fact, the first includes only 42 origin countries for an irregular number of
years, whereas the second provides information for 61 developing countries for 1991 only. There
is another data set published by Docquier and Marfouk (2005), which comprehends 201 origin
countries and details the information on the stock of migrants for different educational levels.
However, the data set became available some months later the end of the personal construction.

7
3.1 Preliminary Analysis
Overall, in 2001 the stock of migrants from developing and transition countries and resident in
OECD nations1 corresponds to 45.6 million people. The country with the largest number of
nationals abroad is Mexico, which produces more than nine millions emigrants. The figure is
impressive if compared to other major labour exporting states: Mexico has three times as much
migration as the second largest emigration nation. In fact, as shown in Table 1, Turkey provides
2.7 millions migrants while China and Philippines contribute to more than 2 millions each. There
are some countries, such as El Salvador, Jamaica, Albania and Bosnia-Herzegovina, which rank
among the main labour exporting countries, not only in absolute terms but also in relation to their
home country population. With reference to Tables 1-2, it can be reported that 736 thousands
individuals from Jamaica emigrate to OECD nations and this figure corresponds to nearly 30
percent of total home population; 21 percent of the Albanians reside outside the national borders
and El Salvador as well as Bosnia-Herzegovina lose more than 13 percent of their citizens.
In the literature, two hypotheses have been discussed upon the relationship between
migration and level of development: however, the empirical support on either the two opinions is
only limited, given the lack of reliable migration data. The first view is that economic
development does not act or perhaps plays a perverse role in stimulating migration and therefore,
income increases and poverty relief do not itself ensure a lower rate of out-migration (Lucas,
2004). The second view, which is now replacing the former, proposes the existence of an
inverted U-relationship between development and migration, and for this reason the concept of
migration hump has been introduced: “migration pressures actually increase as development
proceeds from low levels of economic development, while at higher levels of development the
process is reversed” (Lucas, 2004, p.4).
A rational explanation for such a trend is that, given that migration is an expensive
investment, in countries with low average incomes and low wages, few households can afford
sending members abroad and therefore the level of emigration is limited. At higher income,
when financial constraints are not binding, the existence of earning gaps between home and
destination creates the incentives for emigration prospects. The micro level empirics, for
example, provide evidence that economic opportunities abroad, though not exclusively,
contribute positively to migration streams. Therefore, development process stimulates migration,
while the convergence of income differentials at the end of the process leads to weaker migration 1 The selected destinations are: Australia, Austria, Belgium, Canada, Czech Republic, Denmark, Finland, France, Germany, Greece, Iceland, Italy, Japan, Korea, Netherlands, New Zealand, Norway, Portugal, Spain, Sweden, Switzerland, United Kingdom and United States.

8
pressure. It follows that development and migration display an initially positive and a subsequent
negative relationship. Faini and Venturini (1994) provide empirical support to this relationship
for southern Europe countries: in fact, they find that while in poor countries economic growth
has a positive impact on emigration rates, in middle-income countries the effect is negative. Table 1: Stock of Migrants, from Main Labour Table 2: Stock of Migrants per Capita, from Exporting Nations, 2001 (thousands) Main Labour Exporting Nations, 2001
Code Country Migrants
MEX Mexico 9246.6 TUR Turkey 2763.1 CHN China 2428.8 PHL Philippines 2066.5 IND India 1715.3 KOR Korea,
Republic of 1681.2 VNM Vietnam 1511.0 POL Poland 1252.7 MAR Morocco 1242.6 CUB Cuba 915.1 SLV El Salvador 872.1 DOM Dominican
Republic 741.2 JAM Jamaica 736.3 YUG Serbia and
Montenegro 714.6 ALB Albania 650.6 RUS Russian
Federation 645.8 HKG China,
Hong Kong 618.9 BRA Brazil 610.4 COL Colombia 598.6 DZA Algeria 572.2
Code Country Percent of Population
GUY Guyana 41.6 TON Tonga 41.6 GRD Grenada 36.2 WSM Samoa 34.8 BRB Barbados 33.4 ATG Antigua
and Barbuda 30.7 KNA Saint Kitts
and Nevis 29.2 DMA Dominica 28.8 JAM Jamaica 28.4 VCT Saint Vincent
and Granadine 26.3 TTO Trinidad
and Tobago 22.1 ALB Albania 20.8 CPV Cape Verde 19.0 BLZ Belize 18.2 FJI Fiji 15.2 SLV El Salvador 13.8 TUV Tuvalu 13.4 BIH Bosnia-
Herzegovina 13.3 LCA St.Lucia 10.9 HRV Croatia 10.2
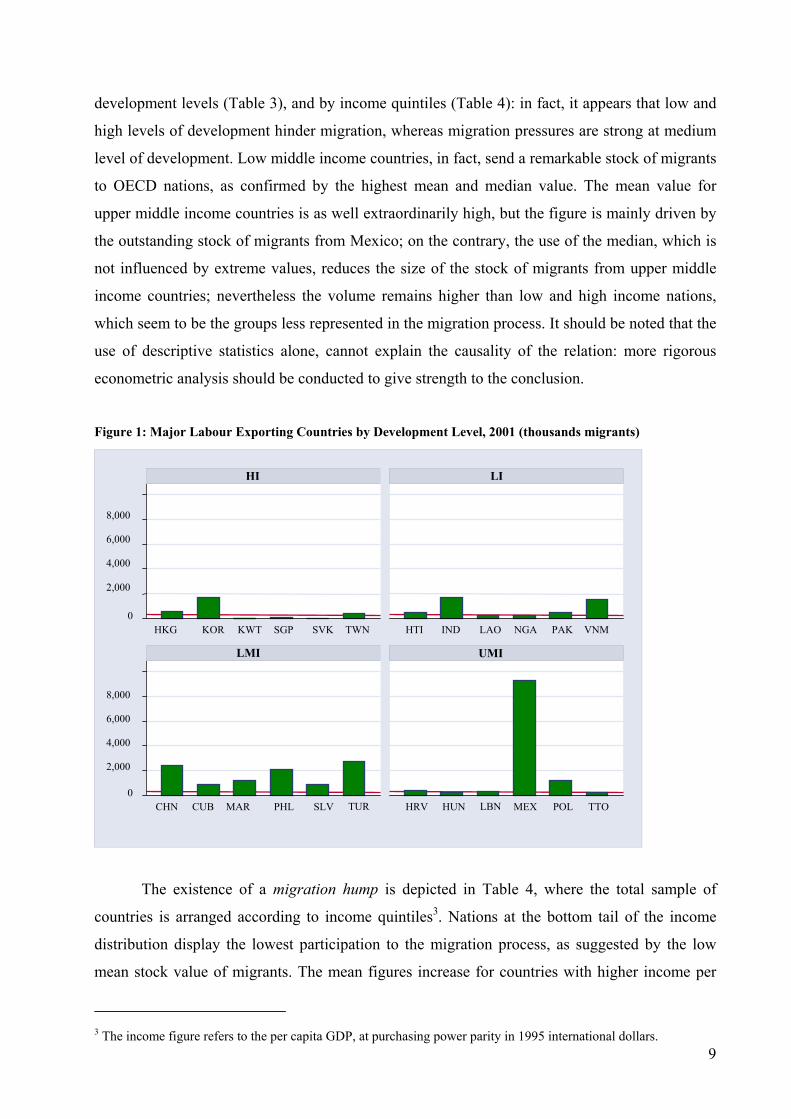
The data available in this study provides support to the second view: in fact, it appears
that the level of migration is maximized at an intermediate level of development. As it appears in
Figure 1, lower middle income (LMI) and marginally upper middle (UMI) nations offer the
largest contribution to migration stocks, while in low (LI) and in high income (HI) economies
the stock of migrants is lower2. The red line underlines the average value of stock of migrants
among the entire set of nations: while the sample of low middle income nations is well above the
mean value, the poorest and wealthiest nations only reach the average figure and remain well
above in many cases.
More clear evidence in favour of the inverted U-relationship comes from the comparison
of the mean and median stock of migrants for the different groups of nations, organized by
2 The income division follows the World Bank classification reported in the World Development Indicators-WDI, (World Bank, 2004).
9
development levels (Table 3), and by income quintiles (Table 4): in fact, it appears that low and
high levels of development hinder migration, whereas migration pressures are strong at medium
level of development. Low middle income countries, in fact, send a remarkable stock of migrants
to OECD nations, as confirmed by the highest mean and median value. The mean value for
upper middle income countries is as well extraordinarily high, but the figure is mainly driven by
the outstanding stock of migrants from Mexico; on the contrary, the use of the median, which is
not influenced by extreme values, reduces the size of the stock of migrants from upper middle
income countries; nevertheless the volume remains higher than low and high income nations,
which seem to be the groups less represented in the migration process. It should be noted that the
use of descriptive statistics alone, cannot explain the causality of the relation: more rigorous
econometric analysis should be conducted to give strength to the conclusion.
Figure 1: Major Labour Exporting Countries by Development Level, 2001 (thousands migrants)
The existence of a migration hump is depicted in Table 4, where the total sample of
countries is arranged according to income quintiles3. Nations at the bottom tail of the income
distribution display the lowest participation to the migration process, as suggested by the low
mean stock value of migrants. The mean figures increase for countries with higher income per
3 The income figure refers to the per capita GDP, at purchasing power parity in 1995 international dollars.
0
2,000
4,000
6,000
8,000
0 2,000
4,000
6,000
8,000
HKG KOR KWT SGP SVK TWN HTI IND LAO NGA PAK VNM
CHN CUB MAR PHL SLV TUR HRV HUN LBN MEX POL TTO
HI LI
LMI UMI

10
capita, suggesting that a financial constraint is potentially eased. The initial up-ward movement
has a maximum among the nations of the third quintile, while after this peak the stock of
migrants declines monotonically.
Table 3: Mean and Median Stock of Migrants, by Development Level, 2001 (thousands)
HI UMI LMI LI
Mean Stock of migrants
109.3 444.9 456.2 124.8
Median 19.4 53.4 303.7 25.2
Obs 12 30 48 59
Another point of analysis is the link between migration figures and geographical location.
In the literature it is well established that costs do represent an important factor influencing the
decision to migrate. The empirical studies on the determinants of migration within a gravity type
model suggest that distance to destination and other country level characteristics such as
landlocked or common borders with the host nation strongly influence migration incentives, as
they proxy the cost of migrating (Karemera et al., 2000; Clark et al., 2002). Therefore, the
location of the origin country may considerably matter in the outcome of a migration decision. Table 4: Mean and Median Stock of Migrants, by Income Level, 2001 (thousands)
Bottom Income Quintile
Second Income Quintile
ThirdIncome Quintile
FourthIncome Quintile
TopIncome Quintile
Mean Stock of migrants
43.3 152.4 551.2 305.8 243.3
Median 18.2 39.2 320.1 86.0 76.7
Obs 25 26 26 26 25
Within this perspective, it can be noted that Sub-Saharan countries are those with the
lowest mean and median level of migration, as shown in Table 5 and represented in Figure 2. On
the one hand, the low income of these countries may be the principal factor responsible for such
low international movements. However, a more rigorous analysis can show that another region,
South Asia, despite offering the lowest level of income, reports respectable out migration levels4.
Therefore, other factors, such as weak transportation infrastructure, isolation or absence of
communication and network system may contribute in the case of African countries to high costs
of emigration and hence to the poor participation in migration process.
4 The low level of GDP per capita in 2001 may also be the consequence of the Asian financial crisis of 1997.

11
Table 5: Mean and Median Stock of Migrant, by Geographical Area, 2001 (thousands)
East Asia and Pacific
Europe and Central Asia
Latin America
Middle East and North Africa
South Asia
Sub-Saharan Africa
Mean Stock of migrants
476.6 346.2 536.5 229.8 377.1 48.3
Median 161.1 58.8 172.1 74.5 213.4 16.2
Mean Gdp per capita
6658 5588 6385 6727 1971 2560
Obs 22 24 33 17 8 46
The flows of migration directed toward OECD nations can be divided according to the
geographical location of the origin countries: there is one flow which groups Eastern Europe
countries, as well as countries originated on the ground of the former URSS, by the newly
independent states of the former Yugoslavia and by Turkey. This stream is mainly directed
toward Europe and in particular to Germany where, for example, the historical introduction of
the guest worker system attracted a large flow of citizens from Turkey. The short distance with
the host countries largely influenced the course of this group of migrants: Albanian mainly
moved to Greece and Italy; from Estonia migration was mainly directed toward nearby Finland;
citizens from countries of the former Yugoslavia primarily migrated to Germany but also to
Austria and Switzerland. Finally, Germany is the major destination for states of the former soviet
bloc, such as Kazakhstan, Kyrgyz Republic, Tajikistan and Turkmenistan and it is the second
largest destination after United States for Azerbaijan, Poland, Hungary, Romania and Republic
of Moldova.
There is a second group of migrants, originally from Latin American countries, whose
key destination is the United States. This host country alone absorbs the majority of the flows:
for example, more than 90 percent of the outflows from Mexico, Honduras, Guatemala, Panama,
Cuba, Nicaragua, Bahamas, Belize, Costa Rica and El Salvador move to US and between 80 and
90 percent from Antigua and Barbuda, Haiti, Colombia, Ecuador, Dominica and Bolivia.
A third group of migrants is drawn from Middle East and North Africa; there are different
important destinations for this kind of flow. The first is the nearby Europe and in particular
France, which gives residence to nearly 1.2 million citizens from North Africa. According to the
census figure, in fact, in France 478’000 citizens from Algeria, more than 500’000 from
Morocco and 154’000 from Tunisia are registered as foreigners. Secondly, for nationals from
Yemen, Jordan, Bahrain, Kuwait, Saudi Arabia, Iran, Syria, Egypt, Lebanon and Iraq US is the
main location choice. It is also known that international migration from this region is directed to
the Persian Gulf area (Adams and Page, 2003a; Adams, 1991). Members of the Gulf
Cooperation, in fact, after the first shock to world oil prices, introduced a system of labour

12
recruiting for temporary jobs. Therefore, this new regime attracted in the early stages a lot of
migrants from nearby countries, though later the recruitment turned largely to South and South
East Asian countries. Figure 2: Mean and Median of Stock of Migrants by Geographical Area, 2001 (thousands)
Note: the mean value for Latin American countries have been computed without the figure from Mexico. EAP is East Asia and Pacific; ECA is Europe and Central Asia, LAC is Latin America, MENA is Middle East and North Africa, SA is South Asia and SSA is Sub-Saharan Africa.
Asian emigration is directed toward Canada and Australia, although United States
represents the leading location choice. For example, 22.5 percent of the total stock of foreign
born resident in US, which reached nearly 31 million in 2000, was born in South and East Asia.
In particular, the largest communities are originally from Philippines and India with more than a
million emigrants residing in US. There are also substantial groups from China, Vietnam and the
Republic of Korea. The notable characteristic of Asian emigration is the high level of education
of the movers: in fact, among the foreign students resident in US, 30 percent are from Asia,
while China and India alone account for 21 percent of the foreign students registered in degree-
renting institutions. Moreover, US immigration policies, after a long tradition of encouragement
of permanent settlement, have been shifting toward the admission of highly skilled workers,
under some form of temporary admission programs: the consequence of the recent expansion of
H1 visas was the enlargement of the inflow of information technology engineers from India
(OECD, 2003). After the introduction of the labour recruitment scheme in the Persian Gulf
region, moreover, increasing flows of Asian migrant are also directed toward this area.
0
100
200
300
400
500
EAP ECA LAC MENA SA SSA
Mean of migrant stock Median of migrant stock

13
Finally Sub-Saharan countries, although being the major absentee of the international
migration process, have maintained emigration flows, reflecting the past colonial links.
As already mentioned, physical as well as psychological costs influence largely the
decision of migrating: for example, the mass migration occurred in the early years of the 20th
century was influenced by the shift in ocean transport from sail to steam, which considerably
reduced the travel time. Moreover, the drastic decline in the transport costs, resulting from the
shift from sea to air travel as well as the fall in the costs of information and communication
boosted international migration in the post II World War period. An important component of
costs, however, is represented by psychological costs: the effort to acquire living and job
information at destination, the disadvantage for moving away from friends and family, cultural
change and language differences have a strong impact on migration decisions. However, the
existence of a network of nationals and friends in the destination countries contribute positively
to alleviate the disadvantage of moving. It is not surprising, therefore, that in many cases
individuals are willing to move in countries where their ethnic group represents a big proportion
of the destination area population.
The choice of location seems sometimes to follow a nationality pattern: the same ethnic
group of emigrants can be concentrated in some specific states, while being completely absent in
other countries: for example, nationals from Kyrgyz Republic selected Germany as principal
destination while they are nearly absent in any other OECD member states and the same is true
for other countries of the former soviet bloc, as well as for North Korea and Mongolia.
Emigrants from United Arab Emirates and Qatar are primarily in Canada; there is a large
community of people from Cote d’Ivoire in Italy, from Gambia in Spain, from Brazil in Japan
and from Burkina Faso in Austria and Italy.
The concentration of migrants from one single origin can be very high so that the new
entrants become a considerable fraction of the host community: as already reported, in Greece
the community of emigrants from Albania represents more than 4 percent of the country
population; in US Mexicans are the 3.2 percent; in Austria foreigners from Serbia and
Montenegro and Bosnia-Herzegovina reach respectively the 2.5 and 1.6 percent of the
population; another important community of nationals from Serbia and Montenegro is in
Switzerland where they represent the 2.4 percent; citizens from Turkey are mainly concentrated
in Germany, Austria and Switzerland (Table 6).

14
Table 6: Migrant Community Size- Proportion of Migrants from Selected Origins over total Host Country Population, 2001
Code Country Major Destination
Proportion
ALB Albania Greece 4.2 MEX Mexico United States 3.2 YUG Serbia and Montenegro Austria 2.5 YUG Serbia and Montenegro Switzerland 2.4 TUR Turkey Germany 2.4 TUR Turkey Austria 1.6 CHN China Thailand 1.4 BIH Bosnia-Herzegovina Austria 1.3 CHN China Canada 1.1 TUR Turkey Switzerland 1.1 MAR Morocco Belgium 1.0 IND India Canada 1.0
The perpetuation of an already existing critical mass of co-nationals can determine the
location of the successive waves of migrants. But, which factors do determine the selection of
the destination countries in the first place? Clearly geographical proximity is one of these
elements: for example, emigrants from Central America chose to move to the US in more than
90 percent of the cases (Table 7); 68 out of 100 Albanians migrate to Greece; Australia
represents the principal destination for 94 percent of the emigration flows from Papua New
Guinea. Table 7: Network Size- Stock of Migrants toward the Most Important Destination over total Migration Stock, 2001
Code Country Major Destination
Proportion
MEX Mexico USA 99.3 HND Honduras USA 97.5 GTM Guatemala USA 96.7 PAN Panama USA 96.3 CUB Cuba USA 95.4 NIC Nicaragua USA 94.7 BHS Bahamas USA 94.7 BLZ Belize USA 93.9 CRI Costa Rica USA 93.7 SLV El Salvador USA 93.7
Historical connections and cultural ties are a second important factor: 91 percent of
emigrants from Malawi move to United Kingdom; 83 percent of Algerian chose France and 63
percent of Tunisian chose the same destination; 96 percent of foreigners coming from Guinea-
Bissau reside in Portugal. Germany is the main goal for 86 percent of migrants from Togo.
15
4. Methodology
The broad purpose of the paper is to study whether there is a relationship between migration and
poverty in the origin countries. The literature has well emphasized the importance of absolute as
well as relative poverty indices: according to the former, the definition of poor people depends
on an absolute poverty line, which has a “fixed purchasing power, determined so as to cover
physically and socially essential needs” (Bourguignon, 2004, p.1); this definition emphasizes the
intuition that the amount of goods required for a basic survival does not vary around the world.
On the contrary, according to the latter definition, the poor are those owing a fixed proportion of
the mean or median country income and therefore, their well being is measured relative to the
whole society. Poor are identified not on the basis of a cut-off point, which is the poverty line,
but on the basis of the entire resources of the population.
In the present analysis, in line with the seminal study from Dollar and Kraay (2002) and
Gallup et al. (1999), a relative rather than absolute index is applied and the poor are defined as
the bottom 20 per cent of the population, ranked according to the country income distribution.
Across nations, poor people are identified in a fixed proportion, and what varies is how much
they share of the country income. The dependent variable in the first equation is the average per
capita income of the bottom 20 percent of the population and it is calculated by applying the
following formula:
Pi
ipip
i yYshare
Y =
=
2.0*
ln)ln( i=1,…,I (1)
where pshare is the income share of the bottom quintile of the population, Y is the GDP per
capita, based on purchasing power parity (PPP), measured in constant 1995 international dollars5
and ln (.) is the natural log operator.
The poverty equation includes the variable stock of international migrants, resident in
OECD member states6 and it enlarges the matrix of the covariates with the determinants of the
income of the poor, as specified in the literature (Klansen, 2003; Lopez, 2004; Dollar and Kraay,
2002; Gallup et al. 1999; Mosley et al., 2004; Lundberg and Squire, 2003). The effect resulting is
the average and ceteris paribus impact of the stock of migrants on the average income of the
poor.
),,( iiipi XMigrantIncomefy = i=1, …, I (2)
5 The adjustment for the population share, which represents no more than a rescaling of the income of the poor, is done for comparable reasons with the previous literature. See Gallup et al. (1999) and Dollar and Kraay (2002). 6 A variable which measures the volume of official remittances, published in the IMF Balance of Payment Yearbooks is alternatively used, but it did not exert a significant effect on poverty.
16
The poverty impact of migration is not unambiguous, given the dubious participation of the poor
households to the migration investment. The empirical, micro-level literature, for example,
suggests that members of well educated households are over represented in the migration
process: provided that education and income are often highly correlated, it can be expected that
migration selects mainly upper income individuals. The existence of an empirical relationship
between international migration and poverty, on the contrary, would represent evidence that the
less well off people are not excluded from the migration process or at least from the migration
benefits.
Moreover, a more distinct picture of the welfare characteristics of migrants can be
presented applying a joint analysis of the effect of migration on different income quintiles of the
population: given that the welfare effect of emigration is highly influenced by the participation
of the households’ members in the process, namely by the selectivity of migration, any
statistically distinct relationship between the migration variables and the income of different
quintiles can indirectly inform upon the existence of a selection process in migration. An
analysis of the variation of the coefficients in two alternative estimations, using the average
income of the bottom and top quintile of the population is computed. Given the average per
capita income of the top quintile, qiy :
),,( iiiqi XMigrantIncomefy = q=1, 5 i=1, …, I (3)
5. Data and Estimation
5.1 The Poverty Equation
Cross-country data are used to estimate how international migration affects poverty. The poverty
equation is:
ig
igi
iiiiiiiP
i
ADEMO
INSTROADGOVEDUMIGGYY
εξψ
ϑπγϕφδβα
+++
++++++++=
∑=
5
1,
)ln()ln()ln( (4)
According to the literature, a poverty equation should include the overall country average
income (Y) and level of the initial inequality (G). The specification, moreover, allows the
identification of specific policy variables which affect poverty over and above their effect on
overall growth. As stated in the empirical literature (Klansen, 2003; Dollar and Kraay, 2002;
Lopez, 2004; Kraay 2004; Gallup et al. 1999; Mosley et al., 2004; Lundberg and Squire, 2003)
the decline in poverty can be achieved through policies that promote growth and policies that
improve the income distribution: high level of education (EDU), public spending (GOV), good
level of infrastructure (ROAD), good governance and institutional quality (INST), and high level

17
of democracy may ensure a type of growth which benefits the poor. It would be expected, for
example, that on average, in countries which provide a more generalized primary education, a
higher public spending, a greater level of democracy, a better institutional quality and a higher
level of infrastructure, the poor would benefit more from economic growth. Regional dummies
(A) are introduced to control for possible regional effects on poverty7. In order to proof the
robustness of the coefficients to alternative definitions of income, both the per capita GDP and
the per capita expenditure are included. Table A.1 in the Appendix details the sources of the
variables.
Ordinary least squares are applied on a sample of 61 countries, which comprises each
major area of the developing and transition world: 7 countries are drawn from East and South
Asia (ESA), 18 from Eastern Europe and Central Asia (ECA), 6 from Middle East and North
Africa (MENA), 11 from Sub-Saharan Africa (SSA) and 19 from Latin America (LAC).
Table 8 reports the outcome of the regression. First of all, the stock of international
migrants exerts a significant effect on poverty reduction, through increasing the income of the
poor. The coefficient, in fact, appears to be robust to the alternative specifications both in terms
of magnitude and in terms of significance: controlling for the level of expenditure, a 10 percent
increase in the stock of migrants resident in OECD states, augments the income of the poor by 1
percent on average and ceteris paribus, whereas, controlling for GDP per capita, a 10 percent
rise in the stock of migrants increases the income of the poor by 0.65 percent.
The income coefficients are well determined and positive; the effect of the expenditure
variable is half the size of the effect of GDP: a 1 percent increase in expenditure per capita is
augmenting the dollar value of the poor by 0.3 percent on average and ceteris paribus, while the
same increase in the GDP per capita is affecting the income of the poor by nearly 0.6 percent.
This would suggest that the growth in overall income is ensuring a growth rate in the income of
the poor, which is positive but less than unitary. In agreement with Dollar and Kraay (2002),
government consumption has a negative effect on the income of the poor, though the effect is not
statistically significant. This may be due to the inability of government spending in developing
countries to target the less well off people. Mosley et al. (2004), on the contrary, find that an
indicator, comprising public spending in primary education, health care, housing and agriculture,
7 Other variables have been recognized as determinants of poverty through their effect on growth or inequality: the relative productivity in agriculture, for example, is responsible for reducing inequality: however, the variable was constraining the regression sample size. Financial development may exert a positive impact on growth; fiscal and monetary policies that act to stabilize the macroeconomic environment may contribute to long-run growth. International trade openness is another factor which could be positively related to growth. However, the three variables did not exert any impact on the level of poverty and were therefore excluded from the equation.

18
is highly significant as a mean for poverty reduction as well as for curtailing infant mortality. In
Gallup et al. (1999), it appears a positive relationship between growth of the income of the poor
and social spending in health and education.
Table 8: The Determinants of the Income of the Poor: Stock of International Migrants
Dependent variable: ln (income of the poor) Variables GDP Expenditure ln (per capita GDP) 0.631 (0.101)*** ln (per capita Expenditure) 0.307 (0.134)** ln (Migrants) 0.065 0.101 (0.021)*** (0.027)*** Inequality -0.007 -0.007 (0.010) (0.015) Government Consumption -0.011 -0.010 (0.007) (0.009) Primary Education -0.002 0.008 (0.004) (0.004)* Democracy 0.084 0.153 (0.073) (0.093) Policy Effectiveness 0.207 0.407 (0.107)* (0.133)*** Paved Road 0.004 0.006 (0.002)*** (0.002)** Constant 1.366 3.963 (0.652)** (0.606)*** N 61 61 R-squared 0.94 0.90 Diagnostic Skewness/Kurtosis tests: P-Value 0.66 0.04 Breusch-Pagan / Cook-Weisberg test: P-Value 0.32 0.68 Ramsey test: P-Value 0.11 0.07 Notes: Standard Errors in parentheses. * significant at 10%; ** significant at 5%; *** significant at 1%. All regressions include regional dummies
Controlling for the level of expenditure, primary education has a positive and significant
influence on the income of the poor. This result supports some previous findings, for example
from Lopez (2004) and Lundberg and Squire (2003), who report that education is good for the
poor. The measure capturing the degree of democracy has no impact on the well being of the
poor at conventional statistical levels: Dollar and Kraay (2002) on the contrary, report that this
variable enters positively and significantly in a poverty equation. The coefficient of institutional
quality strongly confirms that better policies ensure lower levels of poverty. Previous findings
show that good governance is boosting growth, with no disproportional effect on the poor
(Dollar and Kraay, 2002); on the contrary in Lopez (2004) better quality governance seems to
lead to more unequal societies. The importance of infrastructure for the well being of the poor is
19
proved by the coefficient of paved road: in fact, the variable enters positively and the effect is
statistically significant. The same result appears in Lopez (2004), where public infrastructure
benefits the poor more than other groups in the society.
Diagnostic tests were conducted suggesting, overall, adequate specifications and a
satisfaction of the core assumptions of OLS.
The previous finding suggests that the poorest people in the society are not excluded from
the overall benefits of migration, despite the greater hurdles introduced by poverty constraints:
this result, in fact, establishes the well determined role of international migration in poverty
alleviation. It may be the case that the information and the assistance provided by pioneer
migrants and the establishment of a social network may later limit the migration risks and reduce
the costs, making successively the movement accessible to individuals in lower part of the
income distribution. However, it is still not clear, whether the poor people benefit directly or
only indirectly from the migration process. In fact, the overall effect of international migration
can be decomposed into the short term, direct effect, resulting in particular from the transfer of
remittances to the migrants’ families, and the medium-long term indirect effect originated by the
specific use of remittances: because consumption of domestic goods and services has a
multiplicative impact on the national economy, any first round effect of migration can be
transmitted through consumption into the entire local economy, despite the original beneficiary
of remittances. Moreover, the more the pattern of consumption favours the expenditures of
domestically produced goods, with relatively labour intensive production technologies rather
than imports, the higher is the income multiplier effect and the higher is the link between
migration and poverty alleviation. Unfortunately, the direct effect cannot be disentangled from
the indirect effect, and the observed outcome is the combination of the two mechanisms: in other
words, it cannot be sharply asserted that poor people participate in the migration flows, but only
that poor people share the positive outcomes of the migration flows.
However, one possible way to examine the source of the relationship between
international migration and poverty, involves the introduction of a variable proxing the level of
network. The existence of a network at a community level is found to increase the emigration
chances: for example, in Mora and Taylor (2005) the network variable, ceteris paribus, increases
the probability of migrating, with a stronger effect in a context of international migration than in
internal migration. The network, in fact, favours the diffusion of migration opportunities
throughout the community and provides additional insurance in case of unanticipated events:
therefore it plays as a catalyst in easing the costs and the risks of moving, augmenting the
likelihood of migration. Moreover, it is likely that large migrants’ networks benefit particularly

20
poor migrants, because the presence of credit constraints binds more for the poor than for the
rich households. For example, McKenzie (2005) finds a stronger impact of migration network on
the probability of emigration for the poor than for the wealthy people, when the network size is
already big. Munshi (2003) finds that the network is disproportionately valuable for less skilled
individuals. These findings have evident implications in terms inequality as well as poverty: in
fact first, in some studies, the relationship between migration and inequality is found to follow an
inverted U-shape because of the network effect, and second this patter it is likely to translate into
a specific dynamic between migration and poverty. Therefore, it is expected that the effect of
migration on poverty varies according to the size of the network.
To test this hypothesis, different attempts are conducted. First, an interaction term
between the stock of migrants and a measure of the network is added. In agreement with Massey
et al. (1994), the network is proxied by the prevalence ratio, computed as the number of people
who migrated internationally over the total number of people alive, which in turn defines the
stock of migrants per capita. The estimated equation becomes:
ig
igiiii
iiiiiiP
i
ADEMOINSTROADGOV
EDUNETWORKMIGMIGGYY
εξψϑπγ
ϕζφδβα
++++++
++++++=
∑=
5
1,
)ln(*)ln()ln()ln()ln( (5)
If the hypothesis is correct, it would be expected 0>φ and 0>ζ , suggesting that the higher the
network size, the stronger the (direct) effect of international migration on poverty. The results,
however, are disappointing being the coefficients of the interaction term statistically insignificant
in all the specifications, as reported in Table A.2.
The second method is performed distinguishing the sample into high and low network:
the prevalence ratio is divided according to the median value and two regressions are run, for
low and high values of the variable. According to the hypothesis, it would be expected a frail
relationship between migration and poverty in the low network sample and a strong and positive
link in the high network sample. However, the results are counterintuitive and opposite to the
predictions, as shown in Table A.3. In fact the coefficients of the migration variable in the high
sample network are non-statistically significant; on the contrary, in those countries with
relatively low network, the effect of migration on poverty is stronger and well defined.
It should be noted, however, that the size of the international migration experience
captured by the prevalence ratio and by the variable stock of migrants is the same, given that
both variables are computed on the basis of international migration. The similarity between the
two measures, therefore, is likely to make the prevalence ratio inadequate to capture the effect of
the network in this analysis.

21
5.2 The Quintile Analysis
The overall impact of international migration highly depends on where migrants are drawn with
respect to the wealth distribution, and this has clear implications in terms of who benefits the
most from the process. The following analysis, therefore, widens the inspection beyond the
bottom quintile of the population and access the effect of migration on the income of the richest
group as well. Equation (4) is estimated applying the average incomes of the fifth quintile, as
dependent variable, maintaining an identical set of covariates: this allows us a direct comparison
of the effects of migration on different income groups, through the analysis of the estimated
coefficients in the alternative equations.
Even if the alternative inclusion of both the level of Gdp per capita and the expenditure
per capita represents a way to test the robustness of the findings to different definitions of
income, for statistical reason, expenditure should be preferable to Gdp. In fact, given that the
dependent variables are computed as shares of the country Gdp per capita, the existence of a well
defined effect of Gdp on the average income of different quintiles would not come as a surprise.
Therefore, the following specifications include only the level of expenditure as control.
The estimated results of the quintile analysis are reported in Table 9. A clear fall in the
coefficient of the migration variable results between the bottom and the top quintile: in fact,
while the effect of international migration on the income of the top group is not statistically
different from zero, it is well defined and positive in the bottom quintile. Different
interpretations of the result can be provided. First of all, if the richest people do not migrate, the
effect of international migration on the income of the top quintile would be null or at least
minimum. This interpretation is consistent with the theoretical finding of McKenzie and
Rapoport (2004), where people above a certain wealth threshold, do not migrate because of the
high opportunity costs of migration: in fact, the higher the level of wealth, the greater the returns
to domestic production and the greater the loss in terms of decline in household production.
Moreover, greater wealth makes migration less attractive, because the earning gaps between
origin and destination countries are smaller. The finding in Faini and Venturini (1994), that
growth represents a disincentive to emigration in relatively richer nations, suggests that lower
income gaps reduce the migration participation, and this can be read as evidence that rich people
might not migrate.
The second interpretation, on the contrary, would suggest that rich people migrate, but
they either do not remit or they remit a part of their earning, such that the effect on their families’
income is only marginal. In Faini (2002) for example, it results that the higher the share of
migrants with tertiary education, the lower the level of remittances. In fact, despite earnings are

22
positively correlated with skills, which would suggest greater transfers, highly educated migrants
tend to move more permanently abroad and are often accompanied by their families, being the
reunification easier for these migrants: this lower attachment to home country is likely to
diminish remitting. On the contrary, Rodriguez (1996) reports that remittances from contract
workers increase for higher level of education, both in absolute terms and as a share of predicted
earnings: however, this is not true for university graduates, who remit less than migrants with
college education.
Table 9: Stock of International Migrants and the Incomes of Different Quintiles
Dependent variable: ln income of the 1st and 5th quintile
Variables ln(Q1) ln(Q5) ln (per capita Expenditure) 0.307 0.695 (0.134)** (0.139)*** ln (Migrants) 0.101 0.044 (0.027)*** (0.028) Inequality -0.007 0.013 (0.015) (0.016) Gov. Consumption -0.010 0.005 (0.009) (0.010) Primary Education 0.008 0.016 (0.004)* (0.004)*** Democracy 0.153 0.101 (0.093) (0.097) Effectiveness 0.407 0.245 (0.133)*** (0.137)* Paved Road 0.006 0.001 (0.002)*** (0.002) Constant 3.963 4.070 (0.606)*** (0.627)*** Observations 61 61 R-squared 0.90 0.88 Diagnostic Skewness/Kurtosis tests: P-Value 0.04 0.28 Breusch-Pagan / Cook-Weisberg test: P-Value 0.68 0.66 Ramsey test. P-Value 0.07 0.09 Hausman Test: P-Value 0.60 0.27 Sargan Test: P-Value 0.55 0.23 Shea Partial R2 Test: P-Value 0.00 0.00 Notes: Standard Errors in parentheses. * significant at 10%; ** significant at 5%; *** significant at 1%. All regressions include regional dummies.
While unambiguous support to the first hypothesis comes from the literature, it remains
unclear whether the highly educated (rich) migrants remit less or nothing, casting some doubts
on the second hypothesis. Moreover, even if they tend to remit a lower share of their earnings,
the transfer from skilled migrants can still remain greater, in absolute terms, than what low
skilled migrants would remit.

23
What is clear, on the contrary, is that poor people are not excluded from migration
opportunities. The existence of direct and indirect effects, with the latter coming from spillovers
to non migrants’ households in terms of gifts but also and in terms of general increases in
economic activities, ensures that international migration is positively associated with the income
of the poor.
A brief comment is required on the coefficients of the other covariates: the initial level of
expenditure follows an up-ward pattern from the bottom to the top quintile and the size of the
coefficients more than double. The inequality among the poor, as well as the government
consumption and the level of democracy has no effect on the income of both quintiles.
Enrolment rate in primary education boosts disproportionately the income of the top quintile, as
it is proven by the increase in the elasticity: human capital, even if at minimum levels, enhances
growth and consequently benefits those quintiles which gain from growth more than
proportionately. On the contrary, the bottom quintile is the one benefiting the most from good
governance and institutional quality: the elasticity, in fact, decrease moving between the fifth and
the first quintile. Good infrastructures fail to impact on the income of the richest group, whereas
they exert a positive effect on the income of the bottom quintile. Finally, the equations are well
specified and pass almost all the relevant diagnostic tests.
The above results are robust to the use of a different migration variable, which is
aggregated using the data set from Docquier and Marfouk (2005). The estimated coefficients of
this second migration variable are perfectly in line with the coefficients reported in Table 9, both
in terms of sign and in terms of magnitude.
5.2.1 Emigration toward non-OECD Nations
The data set used in this analysis takes into account only a limited proportion of the global
migration stock, which is the fraction moving to OECD member nations, whereas another
important portion of emigration directed to non-OECD states remains excluded. In order to test
whether the existence of an un-captured flow of migrants toward non-OECD destinations has
some critical consequences on the previous outcome, the regression residuals, standardized
residuals and leverage have been under scrutiny. In fact, if for some emigration countries, the
captured figures dramatically understate the true stock of movers, the residuals for these
observations can turn quite large. This can be true, in particular, for those countries which send
migrants to Arab Gulf States, which are known to collect considerable stocks of labour force
from neighbouring African states, but also from East Asian countries (Lucas, 2005; Adams and
Page, 2003a).

24
Scatter plot, density plot, standardized normal probability plot as well as the quantiles
plot of the residuals show no indication of non-normality of the error terms and no indication of
problematic outliers. Moreover, the analysis of the leverage suggests that no observations are
particularly influential, and the number of high standardized residuals which exceeds the critical
interval of -2 and +2 do not exceed the tolerance percentage. Finally an investigation of the
residuals for cluster of observations has been performed: in fact, if the truncation is particularly
relevant for some geographical area, the mean of the residuals of some cluster of countries may
differ from the one of another group. To compute statistical tests on the mean, first the
observations are listed according to their geographical location and their proximity with the
Gulf-States and secondly the mean of the estimated residuals are calculated by cluster of
observations. The average values computed for each cluster, however, do not statistically differ,
and this casts some confidence on the validity of the study. In fact, even if the analysis focuses
only on a limited part of international migration, the outlier analysis shows that the reported link
between poverty and emigration toward OECD member states is not biased by critical
truncation.
5.2.2 The Endogeneity Problem
An important aspect that deserves particular attention is the assumption of exogeneity of the
migration variable: in fact, it may be true that some factors triggering migration are also likely to
be affected by it. The micro level empirics, for example, show that earnings gaps between origin
and destination countries contribute positively to migration streams, whereas macro level
analysis suggests that migration pressures increase as development shifts from low to higher
level: therefore, poverty and low development may represent push factors in migration decisions,
introducing an endogeneity problem in the poverty and migration estimation: if the error
distribution cannot be considered independent from the regressors’ distribution, the OLS
coefficients turn inconsistent.
However, since poverty is measured with data for a single year, while the migration
variable includes subsequent flows of migrants, which adds in a plurality of years, the
endogeneity issue might not occur. It is also true however that the economic gap between
developing countries and OECD member nations was quite persistent in time and this is also true
for the level of poverty of origin countries if compared to destinations. Only relevant test can
cast some light on this point.
To test for the presence of endogeneity and to correct for potential limitations of the OLS
estimation, the IV technique is called for, using an appropriate set of instruments. The validity of
the IV technique relies on the respect of two conditions: first, the instruments have to be

25
correlated with the endogenous, instrumented variable, which is the stock of migrants in this
specific case and second, the instruments have to be orthogonal to the error process. The
instruments selected for the first stage estimation are: a measure of openness, a measure of
financial development and a dummy variable capturing if a country is land-locked. The empirical
literature which studies the determinants of migration highly emphasizes the link between
emigration rates and political, economic as well as demographic and geographical characteristics
of the source countries (Clark et al., 2002; Karemera et al. 2000).
The instrumental variable regression is used in both the bottom and top quintile analysis:
as it is shown in Table 9, it results that the instruments satisfy the two essential requirements, as
proved by the partial R2 measure proposed by Shea (1997), which tests the explanatory power of
the variables, and by the Sargan statistics (1958), which tests whether the instruments are
independent from the error process. Finally, the Hausman test (1978) for the endogeneity of the
stock of migrants is conducted: the Durbin-Wu-Hausman test cannot reject the null hypothesis
that the instrumented variable is exogenous in both the regressions and the OLS coefficients are
consistent8.
Given that the variable stock of migrants does not result endogenous, the estimated
coefficients of the OLS estimation can be considered consistent; moreover, the use of the
instruments does not yield particular distinctions in the estimated coefficients of the migration
variable.
6. Conclusions This paper aims to analyse the capability of international migration to reach the poor and
increase their income levels in a cross country analysis. To date, the extent to which migration
has a dampening effect on poverty has been under-researched at a macro level, mainly because
of the lack of reliable data on migrant stocks as well as migrants’ characteristics at an aggregate
level. The existing micro-level evidence on the link between migration and poverty seems to
suggest that migration and in particular remittances, reduce both the level and the severity of
poverty: this paper aims to provide confirmation upon this finding, extending the analysis to a
macro level.
Given no previous reliable information on the stock of migrants a data set was personally
constructed: the final outcome comprises bilateral information on the stock of migrants from 149
source countries to 23 OECD destinations. Exploring the information contained in the data set,
8 Pagan-Hall general tests for heteroskedasticity are performed: Chi-sq(15)=8.77 and Chi-sq(15)=13 suggest that the hypothesis of homoskedastic disturbance is supported by the data. Provided that the residuals are homoskedastic, IV would be preferable to GMM, as GMM can have poor small sample properties.

26
some conclusions can be drawn: first, the data available in this study highlights the existence of
an inverted U-relationship between development and migration: in fact, it appears that the level
of migration is maximized at an intermediate level of development, whereas low and high
income economies marginally participate in the migration process. Second, the existence of a
network of nationals and friends appears: in fact, the choice of location of successive waves of
migrants seems to be influenced by a pre-existing critical mass of co-nationals; for example,
some nationalities are concentrated in some specific states, while being completely absent in
other countries; in some cases the community of migrants represent a large fraction of the home
country population and sometimes more then 90 per cent of the emigration flow is directed
toward the same destination country.
The econometric analysis is conducted aggregating in a single variable the bi-lateral
information on the stock of migrants relative to the same labour exporting country. A poverty
equation is estimated in order to assess the effect of the stock of migrants on a country poverty
measure. What appears is that the stock of migrants has a well determined, dampening effect on
poverty, and the relationship is robust to alternative specifications. The departure of labour force
can potentially produce detrimental consequences to the countries of origin, reducing production
and decreasing the overall income, but this effect results only if there is no surplus of labour. On
the contrary, if there is surplus of labour, and this is quite likely in developing countries, the
labour resource has zero opportunity cost and the production loss due to emigration approaches
zero. The results seem to be in line with this scenario, at least among the poor: emigration,
therefore, may proxy the opportunities generated by new investment and greater economic
activities, which overcome and compensate for the reduced input of labour. The empirical
finding, in fact, shows that, controlling for the level of expenditure, a 10 percent increase in the
stock of migrants resident in OECD states augments the income of the poor by 1 percent on
average and ceteris paribus. This result might be the combination of direct as well as indirect
spillover effects from migrants’ to non migrants’ households.
The importance of the network has been as well assessed, although the analysis provides
poor results: this may be due to the lack of adequate measure of the network.
Finally, the comparison of the effect of migration on the bottom and top quintile of the
population might suggest that rich people do not migrate, given the low emigration incentives
consequent to smaller wage differentials between origin and destination and eventually to the
high opportunity costs of migration for the well-off people.
The policy implication of this result is straightforward: the higher the level of migration
from developing to developed countries, the lower the level of poverty in labour sending nations;

27
therefore, allowing a higher degree of mobility into OECD nations can be an efficient instrument
to poverty reduction.
References
Adams R.H. (1991) “The Effects of international remittances on poverty, inequality and development in rural Egypt” Research Report 86. International Food Policy Research Institute. Washington D.C.
Adams R.H. (2005) “Remittances, Poverty and Investment in Guatemala” in Ozden C. and M. Schiff International Migration, Remittances and the Brain Drain, World Bank and Palgrave Mcmillan
Adams, R. H. and J. Page (2003a) “Poverty, Inequality and Growth in Selected Middle East and North Africa Countries, 1980-2000” World Development, vol 31, pp 2027-2048
Adams, R. H. and J. Page (2003b) “International Migration, Remittances and Poverty in Developing Countries” Policy Research Working Paper 3179. The World Bank, Washington D.C.
Adelman I and J. E.Taylor (1990) “Is structural Adjustment with Human Face Possible? The Case of Mexico”. Journal of Development Studies, vol 30(1), pp 146-67
Bourguignon, F. (2004) “The Poverty-Growth-Inequality Triangle”, paper presented in the Indian Council for Research in International Economic Relations
Carrington W.J. and E. Detragiache (1998) “How Big is the Brain Drain?” IMF Working Paper n.98/102, International Monetary Fund, Washington
Clark X.,T.J. Hatton and J.G. Williamson (2002) “Where do US Immigrants Come From, and Why? NBER Working Paper 8998. National Bureau of Economic Research, Cambridge.
Docquier F. and Marfouk A. (2005) “International Migration by Educational Attainment (1990-200)- Release 1.1, in Ozden C. and M. Schiff International Migration, Remittances and the Brain Drain, World Bank and Palgrave Mcmillan
Dollar D. and A. Kraay (2002) “Growth is Good for the Poor?” Journal of Economic Growth, Vol 7, pp 357-82
Faini R. (2002) “Migration, Remittances and Growth”, paper presented at the Conference on Poverty, International Migration and Asylum, Helsinki, September 27-28
Faini R. and A. Venturini (1994) “Migration and Growth: The Experience of Southern Europe” CEPR Discussion Paper n. 964, Centre For Economic Policy Research, London
Gallup J.L., S.Radelet and A. Warner (1999) “Economic Growth and the Income of the Poor”. Discussion Paper 36, Harvard Institute for International Development
Hausman J. (1978) “Specification tests in econometrics” Econometrica, vol.46(3) pp.1251-1271
Jones R. (1998) “Remittances and Inequality: A Question of Migration Stage and Geographic Scale” Economic Geography, vol. 74(1), pp. 8-25
Karemera D., V.I. Oguledo and B. Davis (2000) “A Gravity Model Analysis of International Migration in North America” Applied Economics, vol. (32), pp. 1745-1755
Kaufmann D.; A. Kraay and M. Mastruzzi (2003) “Governance Matters III: Governance Indicators for 1996-2002” World Bank Policy Research Department Working Paper
28
Klansen S. (2003) “In search of the Holy Grail: How to Achieve Pro-Poor Growth? in B. Tungodden, N. Stern and I. Kolstad, Toward Pro-Poor Policies: Aid, Institutions and Globalization, Proceedings from the Annual World Bank Conference on Development Economics Europe Conference 2003, Washington, D.C.
Lopez H. (2004) “Pro-growth, Pro-poor: Is there a Trade Off?” The World Bank, Policy Research Working Paper n. 3378
López Cordova E. (2005) “Globalization,Migration and Development: The Role of Mexican Migrant Remittances” Mimeo, August 31. Inter-American Development Bank, Washington, DC.
Lucas R.E.B. (2004) “International Migration to the High Income Countries”. Paper presented at the Annual Bank Conference on Development Economics, Brussels, 10-11 May
Lucas R.E.B. (2005) “International Migration Regimes and Economic Development” Edward Elgar Publishing.
Lundberg M. and L. Squire (2003) “The Simultaneous Evolution of Growth and Inequality” The Economic Journal, vol. 113, pp.326-344.
Massey D. S., L. Goldring and J. Durand (1994) “Continuities in Transnational Migration: An Analysis of Nineteen Mexican Communities.” American Journal of Sociology, vol. 99(6), pp. 1492–1533.
McKenzie D.J. and H. Rapoport (2004) “Network Effects and the Dynamics of Migration and Inequality: Theory and Evidence from Mexico” Bureau for Research in Economic Analysis of Development (BREAD) Working Paper 063. Cambridge, MA.
McKenzie D. J. (2005) “Beyond Remittances: The Effects of Migration on Mexican Households” in Ozden C. and M. Schiff International Migration, Remittances and the Brain Drain, World Bank and Palgrave Mcmillan
Mora J. and J. E.Taylor (2004) “Remittances, Inequality and Poverty: Evidence from Rural Mexico” International Migration and Development Research Program, Development Economics Research Group. Mimeo, World Bank, Washington, DC.
Mora J. and J. E.Taylor (2005) “Determinants of Migration, Destination and Sector Choice: Disentangling Individual, Household and Community Effects” in Ozden C. and M. Schiff International Migration, Remittances and the Brain Drain, World Bank and Palgrave Mcmillan
Mosley P, J.Hudson and A. Vershoor (2004) “Aid, Poverty Reduction and the New Conditionality” The Economic Journal, vol. 114, F217-F243
Munshi K. (2003) “Networks in the Modern Economy: Mexican Migrants in the US Labour Market” The Quarterly Journal of Economics, vol. 118(2), pp. 549-599
OECD (2003) Trends in International Migration. Annual Report, 2002 Edition, Paris, OECD
Rodriguez E.R. (1996) “International Migrants’ Remittances in the Philippines”, Canadian Journal of Economics, vol.29, pp.S427-432.
Sargan J. (1958) “The Estimation of Economic Relationship using instrumental variables Econometrica, vol. 26(3), pp. 393-415
Shea J. (1997) “Instruments Relevance in Multivariate Linear Models: a Simple Measure” Review of Economic and Statistics, vol.79 (2), pp. 348-352
Stark O., J.E. Taylor and S. Yitzhaki (1986) “Remittances and Inequality” The Economic Journal, vol 96, pp 722-740
29
Stark O., J.E. Taylor and S. Yitzhaki (1988) “Migration, Remittances and Inequality: A Sensitivity Analysis Using the Extended Gini Index” Journal of Development Economics” vol 28, pp 309-322
Taylor J.E., C. Zabin and K. Eckhoff (1999) “Migration and rural development in El Salvador: a micro economywide perspective” North American Journal of Economics and Finance, vol 10, pp 91-114
United Nations (2002) International Migration Report 2002, New York, Department of Economic and Social Affairs, Population Division, UN
United Nations (2004) Trends in Total Migrant Stock: the 2003 Revision, New York, Department of Economic and Social Affairs, Population Division, UN
World Bank (2004) World Development Indicators 2004, The World Bank, Washington D.C
World Bank (2005) World Development Report 2006: Equity and Development, The World Bank, Washington D.C.
Yang D. and C.A. Martinez (2005) “Remittances and Poverty in Migrants’ Home Areas: Evidence from the Philippines” Ozden C. and M. Schiff International Migration, Remittances and the Brain Drain, World Bank and Palgrave Mcmillan

30
Appendix 1 Table A.1: Sources and Description of the Variables
Variables Source Description
First and Fifth Quintile Share World Development Indicators, 2004
Real GDP per Capita World Development Indicators, 2004 PPP constant, 1995 international dollars
Real Expenditure per Capita Global Poverty Monitoring Database PPP constant, 1993 international dollars
Inequality Global Poverty Monitoring Database Squared Poverty Gap
Education World Development Indicators, 2004 Primary School Enrolment
Public Spending World Development Indicators, 2004 General government final consumption expenditure as a percent of GDP
Infrastructure World Development Indicators, 2004 Proportion of paved roads
Institutional Quality Kaufmann, Kraay and Mastruzzi, 2003 Index of Government Effectiveness
Democracy Kaufmann, Kraay and Mastruzzi, 2003 Degree of Democracy
Stock of Migrants Author’s compilation Table A2: Elasticity of Poverty with Respect to the Stock of International Migrants: Interaction with Network
Dependent variable: ln (income of the poor) Variables GDP Expenditure ln (per capita GDP) 0.649 (0.103)*** ln (per capita Expenditure) 0.307 (0.136)** ln (Migrants) 0.041 0.105 (0.034) (0.042)** ln(Mig)*ln(Prevalence Ratio) 0.005 -0.001
(0.006) (0.007)
Inequality -0.004 -0.007 (0.011) (0.016) Government Consumption -0.013 -0.009 (0.007)* (0.010) Primary Education -0.003 0.008 (0.004) (0.005)* Democracy 0.075 0.155 (0.073) (0.095) Effectiveness 0.207 0.405 (0.108)* (0.134)*** Road 0.004 0.006 (0.002)*** (0.002)*** Constant 1.352 3.947 (0.653)** (0.622)*** Observations 61 61 R-squared 0.94 0.90 Diagnostic Skewness/Kurtosis tests: P-Value 0.58 0.04 Breusch-Pagan / Cook-Weisberg test: P-Value 0.24 0.67 Ramsey test: P-Value 0.12 0.06
Notes: Standard Errors in parentheses. * significant at 10%; ** significant at 5%; *** significant at 1%. All regressions include regional dummies

31
Table A3: Elasticity of Poverty with Respect to the Stock of International Migrants: Low Network and High Network
Dependent variable: ln (income of the poor) Variables Low Network High Network Sample Sample ln (per capita GDP) 0.507 0.265 (0.130)*** (0.232) ln (per capita Expenditure) 0.366 -0.066 (0.177)* (0.158) ln (Migrants) 0.092 0.143 0.017 0.025 (0.030)*** (0.034)*** (0.035) (0.035) Inequality -0.023 -0.028 -0.041 -0.051 (0.013) (0.017) (0.023)* (0.031) Government Consumption -0.018 -0.017 0.001 -0.00003 (0.010)* (0.013) (0.010) (0.010) Primary Education 0.007 0.018 0.005 0.009 (0.006) (0.006)*** (0.006) (0.006) Democracy -0.280 -0.282 0.114 0.135 (0.127)** (0.160)* 0.092) (0.093) Effectiveness 0.341 0.331 0.402 0.612 (0.144)** (0.182)* (0.193)* (0.132)*** Road 0.007 0.010 0.005 0.006 (0.003)** (0.003)*** (0.002)** (0.002)*** Constant 1.818 3.159 3.473 5.445 (0.725)** (0.706)*** (1.564)** (0.798)*** N 30 30 31 31 R-squared 0.96 0.93 0.96 0.96 Diagnostic Skewness/Kurtosis tests P-Value 0.40 0.11 0.02 0.03 Breusch-Pagan / Cook-Weisberg test P-Value 0.85 0.93 0.28 0.03 Ramsey test P-Value 0.31 0.72 0.34 0.40
Notes: Standard Errors in parentheses. * significant at 10%; ** significant at 5%; *** significant at 1%. All regressions include regional dummies