international knowledge diffusion and its impact on the ... · international knowledge diffusion...
TRANSCRIPT
WORKING PAPER
June/2014
International knowledge diffusion and its impact on the cost-effective clean-up of the Baltic Sea
Katarina Elofsson Economics
Sveriges lantbruksuniversitet, Institutionen för ekonomi Working Paper Series 2014:06 Swedish University of Agricultural Sciences, Department of Economics Uppsala 2014
ISSN 1401-4068 ISRN SLU-EKON-WPS-1406-SE Corresponding author:
[email protected] _____________________________________________________________________________________________

2
International knowledge diffusion and its impact on the cost-
effective clean-up of the Baltic Sea
Katarina Elofsson
Abstract
This paper analyzes the implications of international knowledge diffusion for the costs of Baltic-
wide policy to reduce nutrient emissions to the Baltic Sea. In particular, the impact on the
distribution of abatement and costs over time and space is investigated, and the relative
importance of knowledge spillovers between countries and nutrient spillovers between marine
basins is examined. Using a spatial and dynamic cost-effectiveness model over the Baltic Sea
drainage basin, it is shown that theoretically, the presence of knowledge spillovers could imply
that abatement can be cost-effective even if the cost is comparatively high and the impact on
water quality is zero. The empirical simulations show that a more likely outcome is that higher
knowledge dispersal leads to a further concentration of abatement to countries with large, low-
cost abatement opportunities.
Keywords: knowledge spillovers, learning-by-doing, Baltic Sea, nitrogen, phosphorus, cost-
effectiveness
Introduction
Eutrophication of the Baltic Sea has been recognized as a major problem since the 1960s
(Boesch et al., 2006). Excessive nutrient loads are considered a major explanation to the current
situation. Over the last decade, there has been a downward trend in nutrient inputs to the sea, but
the internationally agreed targets for nutrient reductions have not been reached and still seem far
away (HELCOM, 2013). Possible reasons for limited action in the countries surrounding the sea
are the large costs of significant load reductions and the political difficulties to distribute these
costs among different countries and stakeholders (Gren, Elofsson and Jannke, 1997; Gren, 2001;
Markovska and Zylicz, 1999; Wulff et al., 2014; Ahlvik and Pavlova, 2013). Moreover, it is well
known that it takes considerable time for the sea to respond to changes in nutrient inputs, for
nitrogen the adjustment to a new steady state could occur over a few decades, but for phosphorus
this could take much longer time, more than a half century (Savchuk and Wulff, 2007). The high
cost of achieving agreed nutrient reductions in combination with the long time scale to be
considered before the ecosystem is restored raises the question of whether abatement costs will
fall over time. If they do, this would facilitate achieving the Baltic Sea water quality targets,
while also having implications for the allocation of costs and abatement over time and across
countries.
Costs for pollution abatement can be expected to fall over time due to successively
increased knowledge, achieved either through investment in research and development, R&D, or
through learning from experience (Newell, 2009; Löschel, 2002; Ek and Söderholm, 2010).
Learning by experience, also called learning-by-doing, can reduce abatement costs over time as
the cost of using a particular technology may depend both on the extent to which a particular
user has, himself, applied the technology before, and on the number of other users which have
already adopted the technology. The learning-by-doing concept is since long established in the
literature (Wright, 1936; Arrow, 1962), where the impact of learning on costs is typically
measured empirically as learning or experience curves, which identify the relationship between
abatement costs and the cumulative use of the technology (McDonald and Schrattenholzer,
2001). Most empirical studies on endogenous learning in partial models have been applied to the
energy sector (see Berglund and Söderholm, 2006 for a review), and corresponding analyses of
the costs for environmental technologies in the agricultural and wastewater sectors, which are the
major sources of nutrient emission to the Baltic Sea, seems not to be available. Studies applied to
agri-environmental issues instead typically investigate determinants of the adoption of agri-
environmental technologies while focusing on farmer and farm characteristics (Morris and
Potter, 1995; Vanslembrouck et al., 2002; Hynes and Garvey, 2009; Fuglie and Kascak, 2001;
Defrancesco et al., 2008; Buckley et al., 2012). Some also take into account from who the farmer
4

gets technical advice, and whether they have previous experience of the measure (Defrancesco et
al., 2008; Morris and Potter, 1995; Vanslembrouck et al., 2002; Buckley et al., 2012), but do not
model adoption as a consequence of the cumulative experience. For wastewater, there is very
limited research on technology adoption. An exception to the rule is Kemp (1998), which
investigates the impact of economic incentives on wastewater technology adoption, but does not
take into account the role of knowledge or experience.
Whereas the above studies focus on the role of learning or technology adoption within a
specific country or region, there is also a literature which investigates cross-country diffusion of
knowledge. This literature concentrates on diffusion of knowledge achieved through R&D.
Examples include Popp (2006), which examines the link between regulatory stringency and
innovation across countries for coal fired plants in USA, Japan and Germany. He shows that
innovative activity mainly responds to regulation stringency within the home country, and that
adaptive research and development is typically necessary for a new technology to be adopted in
another country. Openness to trade is shown to be important for the cross-country diffusion of
new technologies (Lovely and Popp, 2008). Countries’ could learn more rapidly about new
technologies and their use if they import relatively more from countries with larger technological
knowledge, if technology is embodied in the imported products (Keller, 2004; Coe and Helpman,
1995). Hypothetically, larger exports could imply that more knowledge is acquired through
interaction with foreign customers, which might require different product standards, but there is
stronger empirical evidence on the role of imports compared to the role of exports for technology
diffusion (Keller, 2004; Bernard and Jensen, 1999). Other factors of potential importance for
technology diffusion are the geographical distance between countries (Keller, 2002; Bottazi and
Peri, 2003) and human capital in the receiving country (Eaton and Kortum, 1996; Xu, 2000).
Van Meijl and van Tongeren (2004) draw on the experience of the above literature to model the
role of knowledge spillovers for GMO uptake in different world regions, including
simultaneously several of the above mentioned drivers of knowledge diffusion in a static general
equilibrium model, with an aim to compare modeled and actual GMO.
5
The purpose of this paper is to investigate the implications of international knowledge
diffusion for the costs of Baltic-wide policy to reduce nutrient emissions to the Baltic Sea. In
particular, the aim is to identify the implications of international knowledge diffusion for the
distribution of abatement and costs over time and space. Moreover, we note that there are two
different diffusion processes of relevance for the management of Baltic Sea eutrophication, that
of knowledge dispersal between countries and that of nutrient dispersal between different marine
basins. We contrast and compare these two processes with regard to their impact on the
distribution of abatement and costs over time and across space.
The role of information and learning has earlier been investigated in the Baltic Sea
context by Lindqvist and Gren (2013), which model the implications of domestic learning but
abstract from knowledge dispersal between countries, and by Elofsson (2007), where a two-agent
sequential game is used to investigate incentives for acting as a fore-runner in order to reduce
abatement cost uncertainty for followers. Compared to Lindqvist and Gren (2013), this study
contributes through the inclusion of cross-country diffusion of knowledge. When modelling of
cross-country dispersal of knowledge, the present study draws on the above mentioned literature
on determinants of cross-country knowledge spillovers, in a similar manner as in van Meijl and
van Tongeren (2004), but this study differs from van Meijl and van Tongeren (2004) through the
focus on the implications for a dynamically cost-effective pollutant abatement scheme.
The paper is organized as follows; in the following section, the analytical model is
presented. This is followed by a presentation of first data, and then results. The paper ends with
discussion and conclusions.
Model
Consider an aquifer that is negatively affected by nitrogen emissions from human activities in the
surrounding watershed. The watershed is divided into i=1,…,n regions. There are two different
nutrients r emitted to the aquatic environment, nitrogen and phosphorus, implying that we have
6

r=N,P, where N denotes nitrogen and P phosphorus. The aquifer itself consists of several,
coupled marine basins b, with b=1,...,m different basins.
The emissions of a nutrient from land-based sources in region i to a marine basin b at a
given time t are defined as ibrtQ . The total nutrient load to a given marine basin consists of
discharges from its own catchment, ibrti
Q∑ , and nutrient transports from other sea basins.
Following Gren, Savchuk and Jansson (2013), it is assumed that nutrient transports among basins
can be described by a coefficient matrix, where each coefficient blrα in the matrix shows the
transports of nutrient loads from basin l to basin b as a share of total emissions to basin l. Total
nutrient load to a sea basin b, btL , is then written as:
bt blr ilrtl i
L Qα=∑ ∑ (1)
where birα is the fraction of emissions to basin l that enter basin b. The transport term birα is
assumed to be constant, and hence independent of the emissions, loads and nutrient
concentrations in the sea.
The time required for adjustments to a change in emissions differs between sea basins
and nutrients. Phosphorus is stored in bottom sediments, but can be released into the water body
if phosphorus loadings are reduced, hence slowing down the adjustment of phosphorus
concentration in the water body. Some of the nitrogen in the sea is denitrified into harmless
nitrogen gas and thus disappears from the water body, while nitrogen can also be taken up by the
sea from the atmosphere through nitrogen-fixing cyanobacteria. The magnitude of these
processes varies between sea basins and affects response times. Further, nitrogen and phosphorus
pools can be interdependent, and their response to emissions changes is potentially non-linear
7
(Savchuk and Wulff, 2009), implying difficulties to identify optimal solutions. For tractability,
we follow Gren, Savchuk and Jansson (2013) by assuming a simple linear relationship between
the stock of nutrient in period t+1 in basin b, , 1br tS + , and the nutrient stock and load in the
foregoing time period t according to:
( ), 1
0 0
1and
br t br brt brt
br br
S S L
S S
τ+ = − +
=
, (2)
where ( )0,1brτ ∈ is the decay rate of the nutrient stock. Assuming that policy makers have
decided on an environmental target in terms of maximum tolerable nutrient pools, *bTS , where
this target should be achieved in year T, the environmental target for each nutrient and marine
basin can be defined as:
*brt brTS S≤ (3)
It is assumed that national policy makers want to reach these targets at minimum cost. There are
assumed to be several littoral countries f, with f=1,…,h, in the watershed, and each region i
belongs to a particular country f. Furthermore, it is assumed that there are cost functions for
nutrient reductions, which are determined by the reductions made in the same time period and by
the knowledge stocks of the two nutrients frtK . The cost of abatement of nutrient r in country f
can then be written as ( ),frt irt frtc Q K i f∀ ∈ . The cost functions are assumed to be increasing and
8

convex in irtQ , and decreasing and convex in frtK , and the instantaneous abatement cost is
assumed to be additively separable in nitrogen and phosphorus knowledge stocks (Bramoullé and
Olson, 2005). We thus exclude the possibility that knowledge about nitrogen abatement
technologies would lower the abatement cost for phosphorus. This is a simplification, as some
abatement measures in the agricultural sector, such as wetlands, and measures to improve
manure management, affect both nitrogen and phosphorus emissions to the sea (Gren, Elofsson
and Jannke, 1997; Elofsson, 2010). The simplification is motivated by the aim to investigate the
role of knowledge diffusion between countries. Also, there are difficulties to identify the possible
relationship between knowledge stocks for the two nutrients, given that such interdependent
knowledge stocks have not earlier been modeled in the empirical literature.
Following Bramoullé and Olsson (2005) we parameterize the cost function as
( ) ( ), , frt irt frt frt irt frtc Q K c Q K i fµ−= ∀ ∈ . (4)
This formulation of the cost function exhibits the standard learning curve properties where a
doubling of the knowledge stock leads to a reduction of costs by a fixed factor (1-2-μ), also called
the learning rate. The knowledge stock in (4) is assumed to differ between countries and
nutrients.
We assume that the cumulative level of abatement of nutrients determines the knowledge
stock and following, e.g., Keller (2004), we also assume that there is a diffusion of knowledge
from country g to country f, expressed by a parameter fgβ . The development of the knowledge
stock is then defined by:
9
( ), 1fr t frt fg ir irtg f i g
K K Q Qβ+≠ ∈
= + −∑ ∑ , (5)
where 0frK = 0frK is the exogenously determined knowledge stock at time t=0, and irQ is the
maximum reduction that can be achieved for a particular nutrient from a given country.
As shown in the literature, observed reductions in abatement costs could be the result of
both learning from experience and efforts spent on R&D. Many studies include only one of these
factors but attempts have been made to empirically disentangle the relative importance of those
for certain energy technologies (Söderholm and Sundqvist, 2007; Söderholm and Klaassen,
2007; Klaassen et al., 2005; Nemet, 2006). The assumption made here about cost reductions
being determined only by experience is thus a simplification, motivated by our focus on
international knowledge spillovers and the lack of knowledge about the impact of R&D on the
costs of nutrient abatement.
The decision problem of the environmental agent who wants to reduce nutrient loads to
the aquifer can then be written as:
( )
( )
( )
, 1
, 1
0 0*
Max ,
s.t.
1and
irt
tfrt irt frtQ f r t
fr t frt fg ir irtg f i g
brt blr ilrrtl i
br t br brt brt
br br
brt brT
irt ir
c Q K
K K Q Q
L Q
S S L
S SS SQ Q
ρ
β
α
τ
+≠ ∈
+
−
= + −
=
= − +
=
≤
≤
∑∑∑
∑ ∑
∑ ∑ (6)
10
where ( )( )1 1ttρ δ= + is the discount factor, in which δ is the discount rate. The optimal
allocation of load reductions can be determined from the solution to the above cost minimization
problem. Setting up the discrete time dynamic Lagrangian gives:
( ) ( )
( ) ( )
( )
, 1 , 11
1
, 1 , 1
*
,
1
frt irt frt ir t frt fg ir irt fr tTf i r g f i gt
br t br brt brl ilrt br t irt irt irb r l i r
TbrT brT brT
b r
c Q K K Q Q KL
S Q S Q Q
S S
ρ µ βρ
ρ λ τ α η
ρ λ
+ +−≠ ∈
+ +
− − + − − −
= − + − − −
− −
∑ ∑∑ ∑ ∑∑
∑∑ ∑ ∑ ∑
∑∑
(7)
where 0rtλ ≥ and 0irtµ ≥ are the co-state variables for the nutrient and knowledge stocks,
respectively, and 0itη ≥ is the Lagrange multiplier for the emission reduction capacity
constraints. The objective function is concave, according to assumptions made about cost
functions. The constraints are differentiable and quasi-convex, implying that the Lagrangian is
concave in irtQ . Assuming that there exists an interior point *irtQ that satisfies the conditions in
(6), the following conditions are necessary and sufficient for a global solution to the problem
stated in (6).
, 1 , 1 0,
0, 0
frttgr t gf br t blr
g b lirt irt
tirt irt
irt
cLQ QL Q Q
Q
ρ ρ µ β ρ λ α
ρ
−+ +
−
∂∂= − + − ≤
∂ ∂
∂= ≥
∂
∑ ∑ ∑ (8)
11

, 1 0frttir t irt
frt frt
cLK K
ρ ρµ µ−+
∂∂= − − + =
∂ ∂ (9)
( ), 1 1 0tbr t br brt
brt
LS
ρ ρλ τ λ−+
∂= − − + =
∂ (10)
( ) , 1, 1
1 0tbr brt blr ilrt br t
l ibr t
L S Q Sρ τ αρλ
−+
+
∂= − + − =
∂ ∑ ∑ (11)
( ) *, 1 , 11 0
0, 0
tbr br T brl irl T brT
l ibrT
tbrT brT
brT
L S Q S
L
ρ τ αρλ
ρ ρλ ρλρλ
−− −
−
∂ = − + − ≤ ∂
∂= ≥
∂
∑ ∑ (12)
( ) , 1, 1
0tfrt frg ir irt fr t
g f i gir t
L K Q Q Kρ βρµ
−+
≠ ∈+
∂= + − − =
∂ ∑ ∑ (13)
0tirt ir
irt
L Q Qρη
− ∂= − ≤
∂ (14)
Equation (8) tells that the optimal emission reduction is determined such that the marginal cost
of nutrient emission reductions in country i to basin b equals the discounted shadow value of the
12
future impact on the knowledge stock in all countries, plus the discounted shadow value of the
impact on the nutrient stock in all basins. Thus, if a region is located in a country with large
knowledge spillovers on other countries, more abatement should be undertaken in that region.
Similarly, if emission reductions in a region has a large impact on nutrient stocks in marine
basins with stringent nutrient targets, more abatement should be undertaken in that region.
Hence, it can be cost-effective to undertake nutrient abatement in regions with little impact on
nutrient stocks in the sea, if the knowledge spillovers on other countries are large enough.
Equation (9) shows that the current value of the knowledge stock in country i at time t,
which is determined by its marginal cost-reducing impact and its shadow value in the same time
period, must equal the discounted shadow value of the knowledge stock in the following time
period. Equation (10) tells that the current shadow cost of the stock of nutrient r in basin b must
equal the economically and biologically discounted shadow cost of the same stock in the next
time period. Equations (11) and (12) restate, respectively, the equation of motion for nutrient
stocks, and the stock restriction in the final time period. Equation (13) and (14) restate,
respectively, the equation of motion of the knowledge stock and the capacity constraint on load
reductions.
Compared to a situation where there is only domestic learning but no diffusion of
knowledge, i.e. 𝛽𝑓𝑔 = 0,∀𝑔 ≠ 𝑓, the allocation of abatement between regions and countries will
change. First, more abatement will be undertaken in regions where the marginal cost of
additional abatement is low, and where the diffusion of knowledge from that country to other
countries is high. However, it is not sufficient that the diffusion terms, fgβ , for country g where
the regions is located are high, but the countries f, which receive the knowledge should also be
countries that would abate much even if there were no knowledge spillovers between countries.
This is because knowledge spillovers affect the costs of all abatement made in country f. When
knowledge spills over, the average abatement cost falls in country f, and the cost saving made
due to the spillover will be larger the larger is total abatement in country f. Moreover, the cost
saving which results from knowledge spillovers is the largest if the receiving country f has a flat
13
marginal cost function, implying that the country will increase its abatement considerably when
there is knowledge diffusion, thereby reducing the need for more costly abatement in other
countries.
Data
Data on unregulated loads, irQ are measured as the biologically available fractions of nutrient
loads, which affect eutrophication. Unregulated loads are here measured as contemporary loads
1997–2003, and data have been obtained from Gren, Savchuk and Jansson (2013). Data on initial
nutrient stock in each marine basin, decay rates, target nutrient stocks, and transports among
marine basins have been obtained from the same source, where estimates have been obtained
from simulations made with an oceanographic model, SANBALTS, which is further described in
Savchuk and Wulff (2007, 2009). The decay rates are, in reality, determined by biogeochemical
processes, such as primary production, mineralization of organic matter, nitrogen fixation,
denitrification, and hypoxia variations, which affect nutrient cycling. Gren, Savchuk and Jansson
(2013) approximate decay rates by nutrient residence time. The nutrient transports among marine
basins are described by transport matrices. All data described in this section can be found in the
Appendix.
Cost functions were approximated for each country and basin using data on costs for
different levels of load reductions from the programming model used in Elofsson (2000). The
programming model includes data on abatement costs at the sources in different regions and
countries, and their associated impact on the coastal load. Many of the abatement measures
typically considered to reduce nutrient runoff are included, such as: increased nutrient cleaning
capacity at sewage treatment plants, catalysts in cars and ships, flue gas cleaning in stationary
combustion sources, reductions in fertilizer consumption and manure deposition, a change in
spreading time of manure from autumn to spring, cultivation of catch crops, energy forests, and
ley grasses, and creation of wetlands. When using the programming model to calculate costs for
14

a certain load reduction, it is assumed that nitrogen and phosphorus are reduced separately. From
the programming model, output is generated as pairwise combinations of load reductions and the
associated minimum costs. These data are used to approximate a quadratic cost function,
( ) ( )2
irt ir ir irt ir ir irtc a Q Q b Q Q= − + − , which is estimated using OLS. The linear coefficient of this
function was excluded when negative, in order to ensure that 0ritc > and 0ritc′ > for all levels of
load reductions, i.e. that cost functions obey standard assumptions. The estimated parameters of
the cost functions can be found in the Appendix. The maximum reduction, which can be
achieved by a certain region to a specific marine basin, is also obtained from the same
programming model.
The choice of discount rate is important when costs are distributed over time. It is widely
accepted that the discount rate should be based on individuals’ preferences for present versus
future consumption. When public expenses displace private investment, the possible opportunity
cost of fund raising should be taken into account. For situations where the costs and benefits of a
project or policy stretches of several generations, such as is often the case for environmental
policies, there are different views on how the discount rate should be treated, e.g. by having the
same, constant discount rate as for intra-generational policies in combination with directly
addressing inter-generational issues through introduction of intergenerational weights in the
social objective function (Moore et al., 2004). Based on the observation that future economic
growth is more uncertain the further ahead in the future, it is also suggested that the discount rate
should be lowered successively over time. However, lowering the discount rate over time
through hyperbolic discounting implies dynamically inconsistent preferences (Laibson, 1997),
wherefore we do not use this approach here in spite of the considerable time for the Baltic Sea to
adjust to a change in nutrient loads. Boardman et al. (2003) suggest that a 3 percent discount rate
is used for public projects, which is consistent with Weitzman’s (2007) suggestion for a discount
rate of 2-4 per cent for climate change. Weitzman (2007) motivates his estimate with the need to
account for uncertainty about the future consequences of environmental degradation, which is
relevant also in the case of the Baltic Sea. We assume that there is no displacement of private
15

investment due to a Baltic Sea policy, which is motivated by the size of international capital
markets where financial resources for the policy could be borrowed without any impact on the
interest rate. Therefore, we do not take into account costs of fund raising, but follow Boardman
(2003) and Weitzman (2007) by using a 3 percent discount rate.
Finally, we here describe the data used for the learning curve in equation (4), and the
knowledge stock function in equation (5). Beginning with the learning curve, such curves for
nutrient abatement measures are not available in the literature. Instead, most of the earlier work
on learning curves deals with the energy sector. When controlling for the effect of R&D, Jamasb
(2007) find a learning rate, which results from learning-by-doing, of between 0.48-41.5 per cent
for different energy technologies. In a review of 77 different estimates of learning-by-doing
rates, Kahouli-Brahmi (2008) finds learning rates varying between 1% and 41.5%. Rubin et al.
(2004) estimate the learning-by-doing rates to 11% for sulphur dioxide and 12% for nitrogen
oxide control technologies, and subsequently apply these estimates to the carbon capture and
sequestration (CCS) technology to assess the learning potential for CCS and the associated
reduction in costs of carbon mitigation. We follow the approach in Rubin et al. (2004) by
extrapolating results from other technologies to that of nutrient abatement, assuming that the
learning-by-doing rate is 3 percent, implying that 𝜇 = 0.044, i.e. a relatively conservative rate.
With an exponential learning curve as described in equation (4), the impact of experience
on abatement costs is very high for technologies that have not been applied earlier, or have only
been applied to a very limited extent. For the Baltic Sea, policies to reduce nutrients have been
applied for several decades, wherefore it is necessary to take this into account. We therefore
follow Nemet (2006) and Marangoni and Tavoni (2013) by normalizing the knowledge capital
stock with regard to the initial capital stock. We the have that
frtK = ( ) ( )cumulative abatement at time cumulative abatement at =0t t .
16
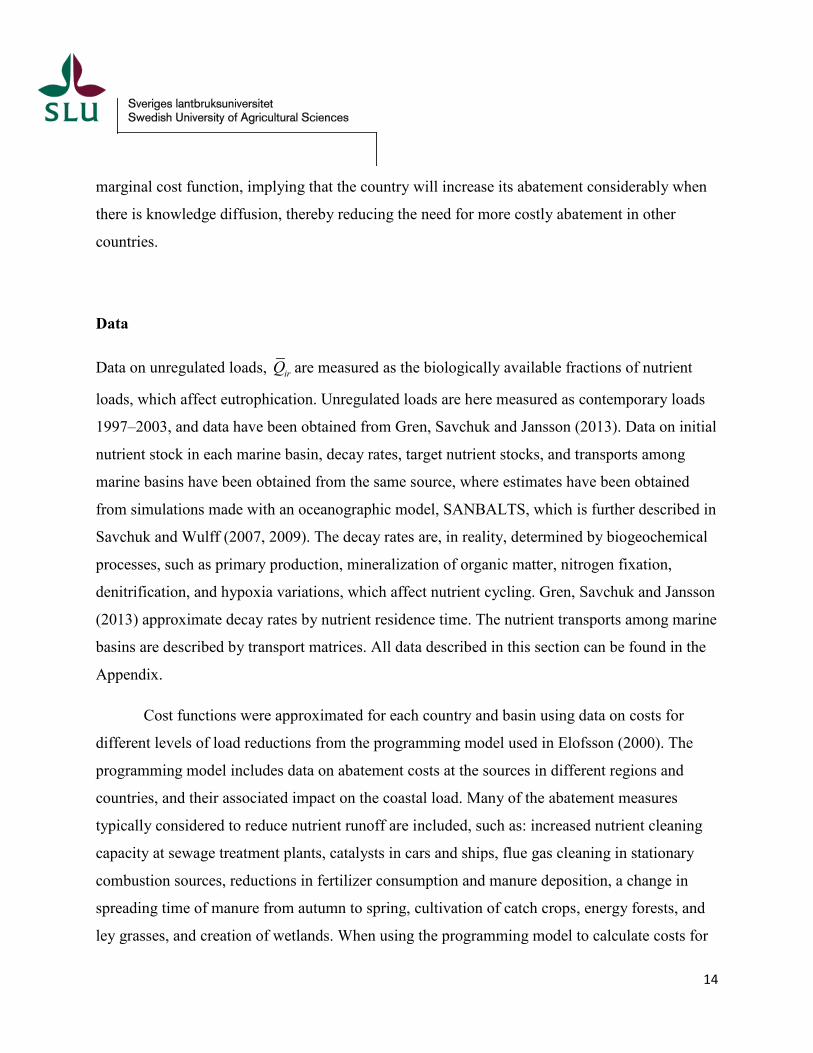
The cumulative abatement at time zero is calculated based on the difference in flow-
normalized annual riverine loads of nutrients between the two periods 1997-2003 and 2006-
2008. The percentage reduction between the two time periods is calculated from data in
HELCOM (2011), and assumed to apply to the unregulated loads, see table A1 in the Appendix1.
For all countries with zero reduction between the time periods, the initial knowledge stock is
normalized to one for nitrogen and 0.01 for phosphorus. The so obtained initial knowledge
stocks are available in table 1.
0frK Denmark Estonia Finland Germany Latvia Lithuania Poland Russia Sweden
kton N 50.5 1 1 6.3 1 17.2 1 1 13.3
kton P 0.42 0.11 0.04 0.14 0.01 2.1 1.93 6.06 1.44
Table 1. Knowledge stock at t=0, measured as cumulative abatement between 1997-2003 and
2006-2008.
Parameters defining the dispersal of knowledge among countries, fgβ , have been chosen based
on the literature on international knowledge spillovers. In this literature, different factors have
been identified as determinants of knowledge diffusion, and we therefore compare the outcome
for several, alternative sets of fgβ . The first set is one where the knowledge stock is only built up
within the own country, i.e. 1ffβ = and 0 for fg f gβ = ∀ ≠ , similarly as assumed in Lindqvist
and Gren (2013). This is also to some extent consistent with the conclusions in Bottazi and Peri
(2003) in their study of the spillovers of R&D on the development of patents for European
regions. They show that knowledge spillovers are highly localized and exist only within a
distance of 300 km.
1 It is assumed that the reductions have been made over seven years, and that they have increased linearly over time.
17
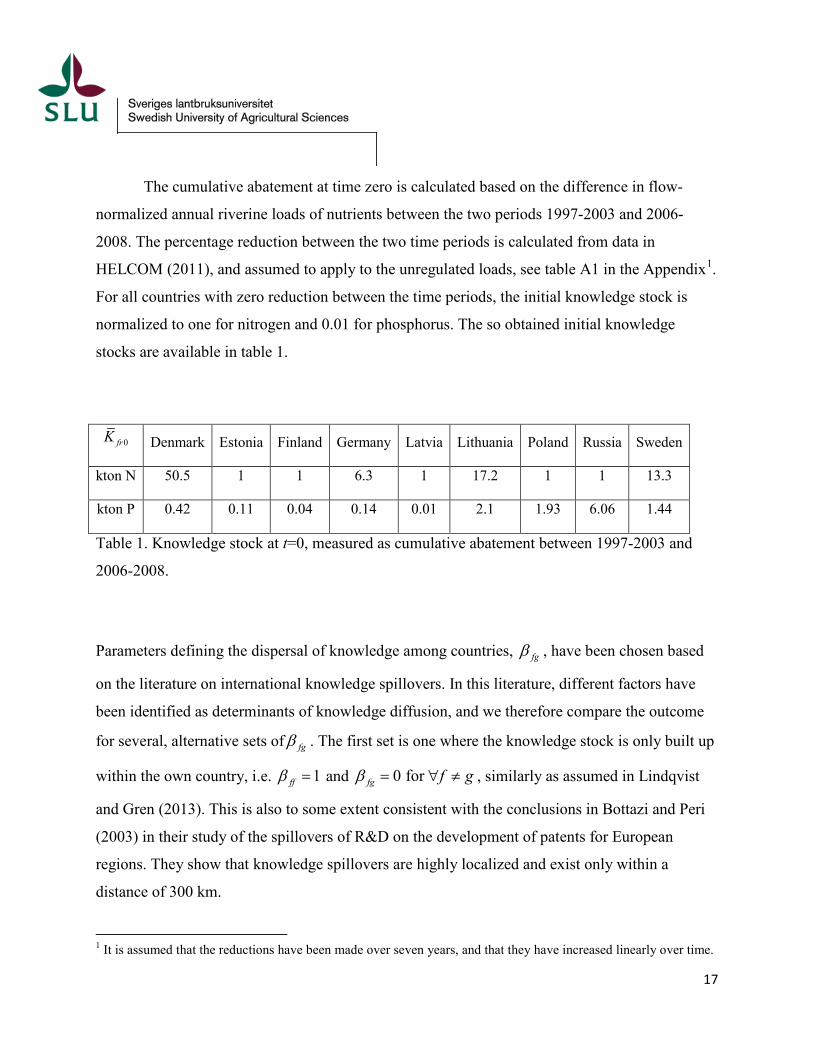
The second set of fgβ is based on the observation in Keller (2002) that technology
spillovers drops by 50% for every 1200 km increase in distance. The estimate was derived for
the impact of R&D expenditures on total factor productivity, and is here assumed to apply also
for the dispersal of knowledge acquired through learning-by-doing. The distance between
countries is measured as the flight distance between the capital cities, and the resulting fgβ
matrix is found in table 2.
Denmark Estonia Finland Germany Latvia Lithuania Poland Russia Sweden
Denmark 1.00 0.65 0.62 0.88 0.69 0.66 0.72 0.34 0.78
Estonia 0.65 1.00 0.95 0.53 0.86 0.77 0.66 0.63 0.84
Finland 0.62 0.95 1.00 0.50 0.81 0.72 0.62 0.61 0.83
Germany 0.88 0.53 0.50 1.00 0.60 0.58 0.69 0.25 0.65
Latvia 0.69 0.86 0.81 0.60 1.00 0.90 0.80 0.64 0.80
Lithuania 0.66 0.77 0.72 0.58 0.90 1.00 0.85 0.67 0.70
Poland 0.72 0.66 0.62 0.69 0.80 0.85 1.00 0.52 0.67
Russia 0.34 0.63 0.61 0.25 0.64 0.67 0.52 1.00 0.48
Sweden 0.78 0.84 0.83 0.65 0.80 0.70 0.67 0.48 1.00
Table 2. Knowledge diffusion, fgβ , determined by distance between countries. Impact of
column country on row country.
Countries’ total factor productivity depends not only on domestic R&D capital but also on
foreign R&D capital, and the impact of foreign R&D capital is stronger the more open an
economy is to foreign trade (Coe and Helpman, 1995). When estimating international knowledge
18

diffusion, Coe and Helpman (1995) weigh foreign R&D by the fraction of imports from the
foreign country in GDP. This general relationship between import shares and knowledge
spillovers is also made use of in, e.g., van Meijl and van Tongeren (2004) with a purpose to
investigate the role of knowledge spillovers for GMO adoption. Here, we follow the same logic,
by calculating fgβ as the value of agricultural products imports from the foreign country g
relative to the total value of agricultural production in the domestic country f. Values of
agricultural import and production are chosen because of the large importance of this sector for
nutrient reductions to the Baltic Sea (Gren et al., 1997; Elofsson, 2010; Wulff et al., 2014). Data
on agricultural import and production value has been obtained from the FAOSTAT database for
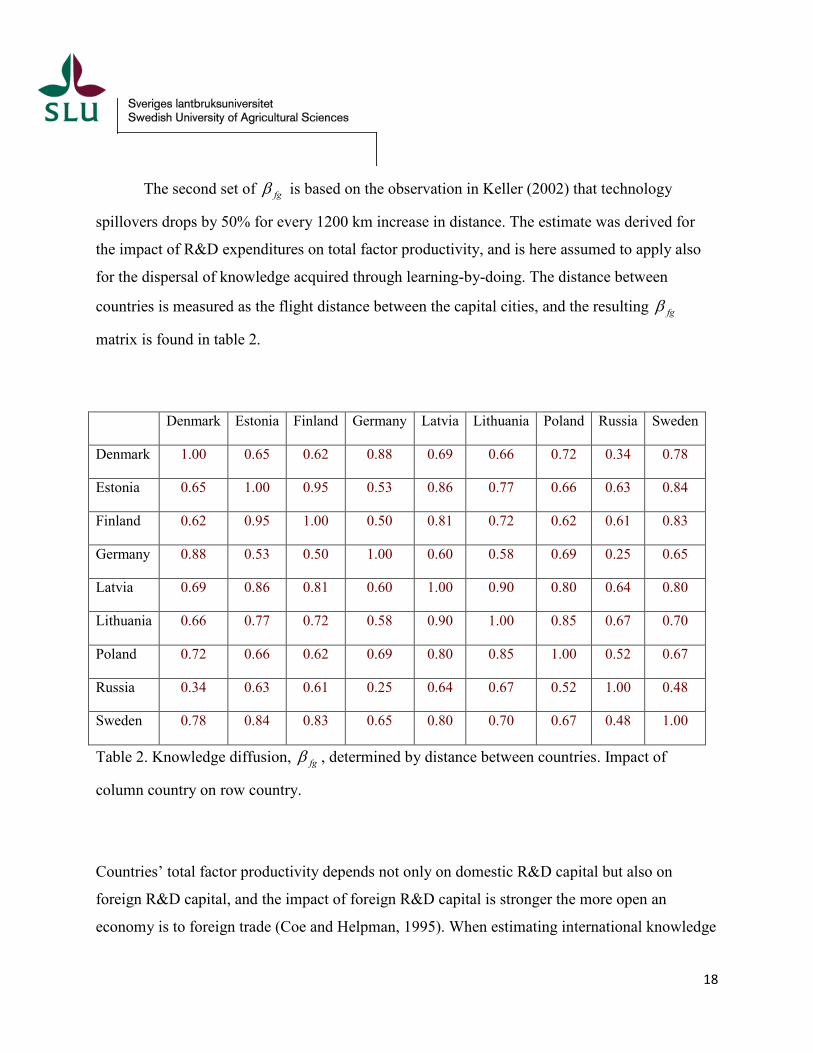
2011. It is assumed that ffβ =1, and the calculations give 0 for fg f gβ < ∀ ≠ , see table 3. With
knowledge spillovers calculated this way, there is thus a larger impact of one country on another
if it is more dependent on agricultural food imports from that country.
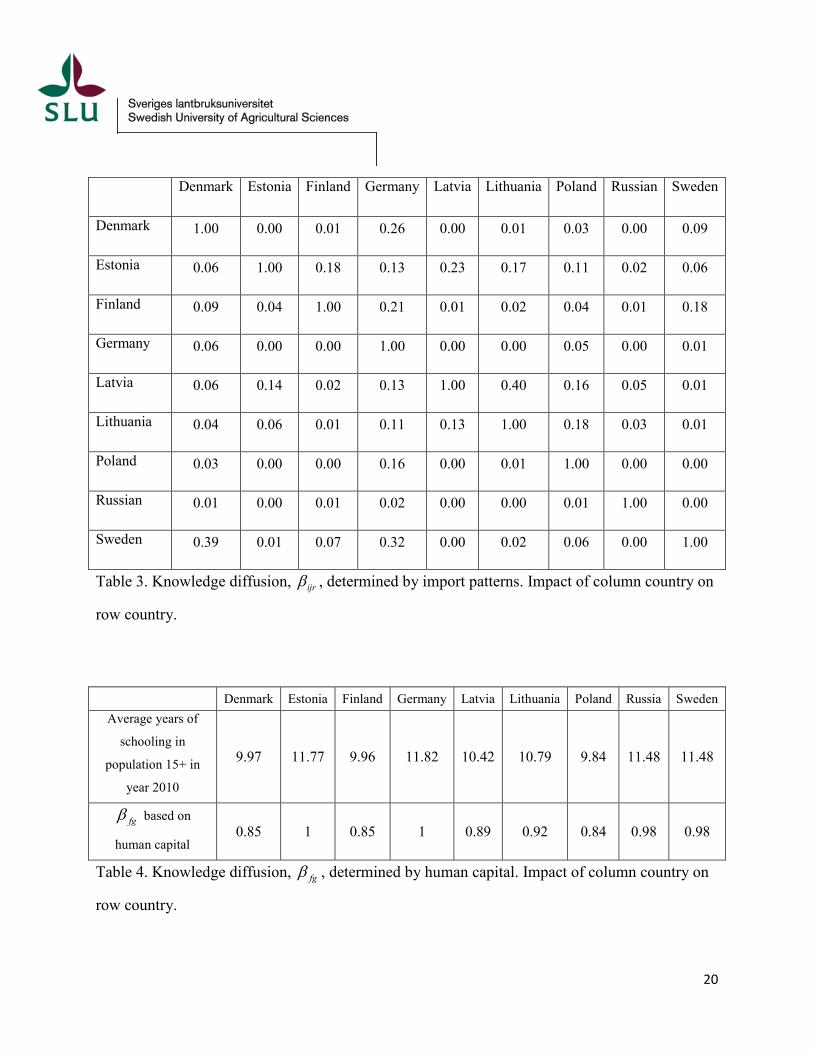
The level of human capital is argued to facilitate the adoption of new technologies
(Keller, 2004; Eaton and Kortum, 1996; Xu, 2000). Similarly as most studies investigating the
role of human capital for knowledge diffusion, we use educational attainment in the adult
population as a measure of human capital, for which data have been obtained from Barro and
Lee (2014). Given our focus on distributional effects, our main interest is in the relative ability to
absorb new knowledge. We therefore normalize fgβ to one for the country i with the highest
educational attainment, and calculate fgβ for the other countries as the proportional level of
educational attainment, compared to the country with the highest level, see table 4. There are
small differences in educational attainment across the Baltic Sea countries, implying that there
would be small differences in knowledge dispersal parameter which is consistent with the
observation in Eaton and Kortum (1996) that there are modest differences in the impact of R&D
on domestic productivity compared to that on productivity abroad.
19
Denmark Estonia Finland Germany Latvia Lithuania Poland Russian Sweden
Denmark 1.00 0.00 0.01 0.26 0.00 0.01 0.03 0.00 0.09
Estonia 0.06 1.00 0.18 0.13 0.23 0.17 0.11 0.02 0.06
Finland 0.09 0.04 1.00 0.21 0.01 0.02 0.04 0.01 0.18
Germany 0.06 0.00 0.00 1.00 0.00 0.00 0.05 0.00 0.01
Latvia 0.06 0.14 0.02 0.13 1.00 0.40 0.16 0.05 0.01
Lithuania 0.04 0.06 0.01 0.11 0.13 1.00 0.18 0.03 0.01
Poland 0.03 0.00 0.00 0.16 0.00 0.01 1.00 0.00 0.00
Russian 0.01 0.00 0.01 0.02 0.00 0.00 0.01 1.00 0.00
Sweden 0.39 0.01 0.07 0.32 0.00 0.02 0.06 0.00 1.00
Table 3. Knowledge diffusion, ijrβ , determined by import patterns. Impact of column country on
row country.
Denmark Estonia Finland Germany Latvia Lithuania Poland Russia Sweden Average years of
schooling in
population 15+ in
year 2010
9.97 11.77 9.96 11.82 10.42 10.79 9.84 11.48 11.48
fgβ based on
human capital 0.85 1 0.85 1 0.89 0.92 0.84 0.98 0.98
Table 4. Knowledge diffusion, fgβ , determined by human capital. Impact of column country on
row country.
20
Results
In the following, we first investigate how knowledge diffusion across countries affects total net
present cost and total abatement, and the distribution of costs and abatement across countries.
This is done comparing five different scenarios, which differ only in assumptions made about the
magnitude of knowledge diffusion between countries. First, we have two scenarios beta=0,
beta(f,f)=1, referring to the cases when there is no learning-by-doing at all and only domestic
learning, respectively. Second, we also look the cases when knowledge diffusion instead depends
on distance, imports and human capital, denoted by beta=DIST, beta=IMP and beta=HUM,
respectively.
We then compare the role that the two different diffusion processes described above, i.e.
diffusion of knowledge between different countries, and diffusion of nutrients between different
marine basins, play for total costs and the distribution of costs across countries. For this
investigation three different scenarios are compared, which differ in assumptions made about
parameters for the two diffusion processes. In these scenarios, beta=0 indicates zero learning-by-
doing, beta(f,f)=1 indicates only domestic learning by doing and zero knowledge diffusion
between countries, beta=DIST indicates that knowledge diffusion is assumed to be proportional
to distance between countries. For nitrogen transport among marine basins, alfa=DEF indicates
that default values for nitrogen transports are used and alfa=1/0 indicates that all emission stay in
the basin to which they are emitted, i.e. diagonal elements of transport matrix equal one, and off-
diagonal elements equal zero. The different scenarios are summarized in Table 5.
21

Scenarios for investigation of assumptions about knowledge diffusion
Scenarios for investigation of the relative importance of knowledge and marine diffusion
No learning by doing beta=0 No learning by doing & default parameters for marine diffusion between basins
beta=0, alfa=DEF
Only domestic learning by doing
beta(f,f)=1 No learning by doing & all emission remain in the basin to which they are emitted
beta=0, alfa=1/0
Knowledge diffusion between countries proportional to distance
beta=DIST Only domestic learning by doing & default parameters for marine diffusion between basins
beta(f,f)=1, alfa=DEF
Knowledge diffusion between countries proportional imports
beta=IMP Only domestic learning by doing & all emission remain in the basin to which they are emitted
beta(f,f)=1, alfa=1/0
Knowledge diffusion between countries proportional to human capital
beta=HUM Knowledge diffusion between countries proportional to distance & default parameters for marine diffusion between basisn
beta=DIST, alfa=DEF
Knowledge diffusion between countries proportional to distance & all emission remain in the basin to which they are emitted
beta=DIST, alfa=1/0
Table 5. Scenarios in the numerical calculations.
22

The role of knowledge diffusion for abatement costs
How are costs and nutrient abatement, and the distribution of those across countries, affected by
knowledge diffusion between countries? First, as can be seen in Fig. 1, already domestic
learning-by-doing from experience in the own country, i.e. beta(f.f) =1, has a considerable
impact on total net present cost, reducing it by 16 percent. Compared to the case with only
domestic learning-by-doing, knowledge diffusion between countries further reduces the net
present cost by 1-8 percent, depending on the set of parameters chosen for cross-country
knowledge diffusion. The smallest impact on net present costs occurs if knowledge is assumed to
be embodied in imports, as this is linked to lower values of the diffusion parameters. The larger
impact on net present cost, 8 percent, is achieved when knowledge diffusion is assumed to be
proportional to either distance or to human capital. The impact is approximately equally large in
the two latter cases in spite of the diffusion parameters have a considerably larger value on
average when assumed to mirror human capital. The reason is that the human capital-based
parameter affects not only accumulation foreign knowledge but also accumulation of knowledge
from domestic abatement. Lower accumulation of knowledge from domestic abatement then
counteracts the effect of larger knowledge diffusion between countries.
Poland carries a large share of the abatement cost under cost-effectiveness, independently
of assumptions made about learning rate and knowledge diffusion, similarly as shown in earlier
studies (Gren, Elofsson and Jannke, 1997; Elofsson, 2010), see Fig. A1 in the Appendix. Under
solely domestic learning-by-doing the unit cost of Polish abatement falls considerably due to the
large abatement carried out in the country. This implies that Poland increases its share in total
abatement.
23

Fig. 1. Total net present cost under different assumption about knowledge diffusion.
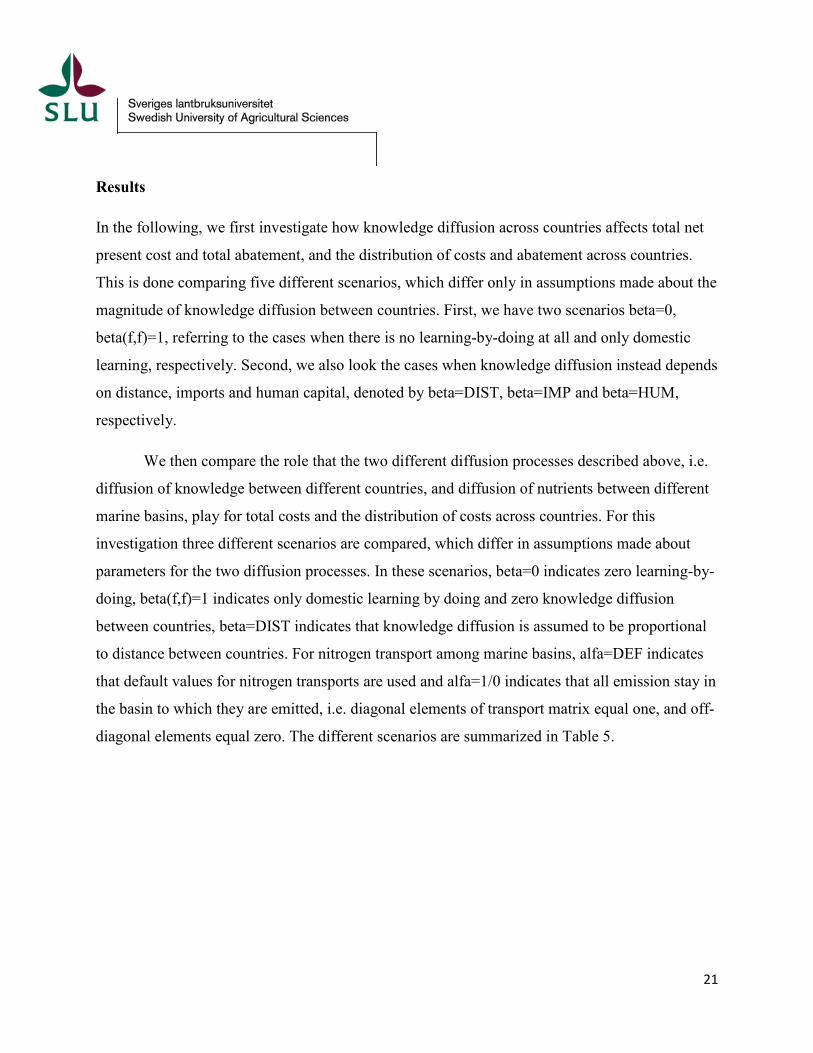
With knowledge diffusion between countries, costs fall in all countries compared to a situation
where there is only domestic learning, see Fig. 2 below. When knowledge diffusion between
countries is assumed proportional to distance, the reduction in costs is relatively similar in all
countries. The impact on costs in a given country is determined by its distance from countries
which abate much nutrients and the shape of the cost functions in the countries, as discussed
above. Costs fall the most in Latvia and the least in Germany and Russia. Latvia is centrally
located in the drainage basin, close to countries with major quantities of nutrients being abated,
such as Poland and Russia. Substantially lower costs in Latvia are associated with a large
increase of phosphorus abatement, suggesting that the changes in abatement in Latvia are
explained mainly by the impact of other countries on Latvia, and not vice versa. Germany and
Russia are located at a larger distance from the center of the catchment, implying a lower impact
on costs in these countries from abatement made in other countries, as well as the opposite.
0
100000
200000
300000
400000
500000
600000
700000
800000
beta=0 beta(f,f)=1 beta=DIST beta=IMP beta=HUM
Mill
ion
SEK
24
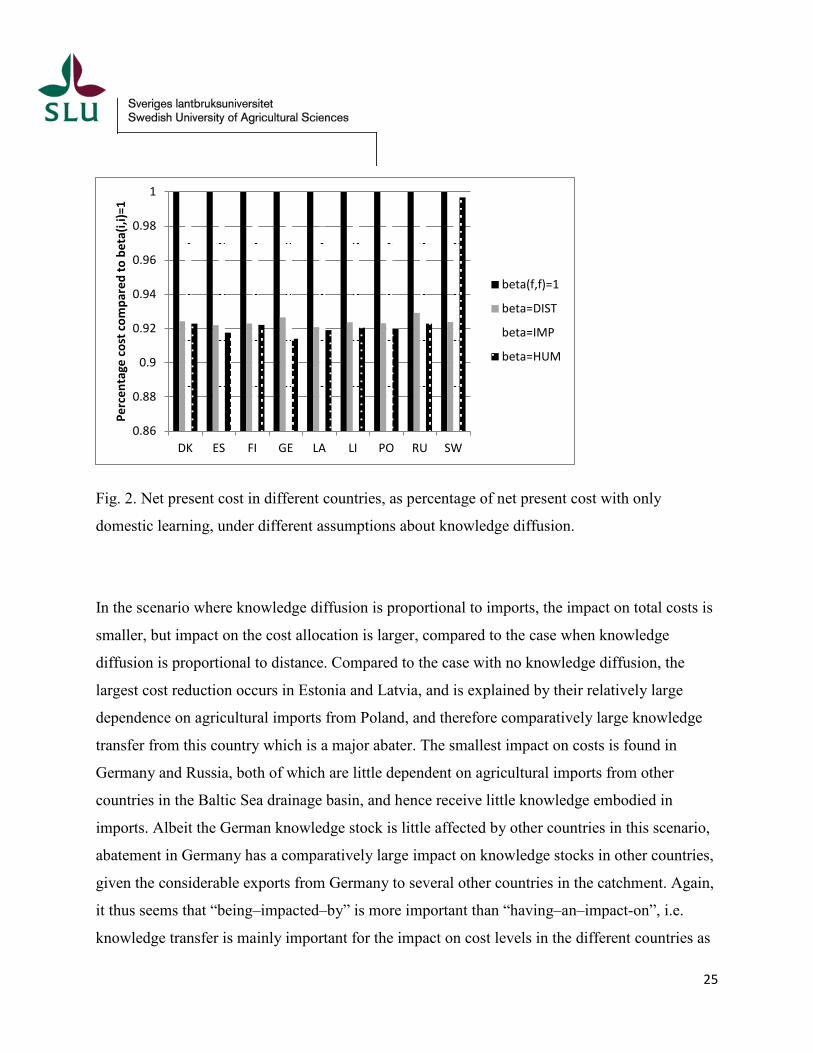
Fig. 2. Net present cost in different countries, as percentage of net present cost with only
domestic learning, under different assumptions about knowledge diffusion.
In the scenario where knowledge diffusion is proportional to imports, the impact on total costs is
smaller, but impact on the cost allocation is larger, compared to the case when knowledge
diffusion is proportional to distance. Compared to the case with no knowledge diffusion, the
largest cost reduction occurs in Estonia and Latvia, and is explained by their relatively large
dependence on agricultural imports from Poland, and therefore comparatively large knowledge
transfer from this country which is a major abater. The smallest impact on costs is found in
Germany and Russia, both of which are little dependent on agricultural imports from other
countries in the Baltic Sea drainage basin, and hence receive little knowledge embodied in
imports. Albeit the German knowledge stock is little affected by other countries in this scenario,
abatement in Germany has a comparatively large impact on knowledge stocks in other countries,
given the considerable exports from Germany to several other countries in the catchment. Again,
it thus seems that “being–impacted–by” is more important than “having–an–impact-on”, i.e.
knowledge transfer is mainly important for the impact on cost levels in the different countries as
0.86
0.88
0.9
0.92
0.94
0.96
0.98
1
DK ES FI GE LA LI PO RU SW
Perc
enta
ge c
ost c
ompa
red
to b
eta(
i,i)=
1
beta(f,f)=1
beta=DIST
beta=IMP
beta=HUM
25

well as in total, but implies only small changes of the allocation of abatement which are
motivated by the associated increase in knowledge diffusion. This has similar to the observation
made in studies which investigate only domestic learning-by-doing and its impact on the
abatement path over time (Goulder and Mathai, 2000; Rasmussen, 2001). However, a difference
here is that the impact on the cost level differs across countries, implying a change in the
allocation of abatement and the associated cost.
The role of knowledge diffusion for abatement quantity
The cost-effective, aggregate abatement of the two nutrients, i.e. the total abatement over all time
periods, can be higher or lower when knowledge diffusion is taken into account, see Fig. 3.
There are two reasons why aggregate abatement is affected by knowledge dispersal, one of those
is the reallocation of abatement in time, and the other the reallocation across space. The net
effect is determined by empirical factors.
The impact on aggregate abatement is small in all investigated scenarios. For nitrogen,
the aggregate abatement is higher in all scenarios with knowledge diffusion, compared to the
case with only domestic abatement. First, with knowledge diffusion, more of the nitrogen
abatement is allocated to Poland. This tends to reduce aggregate abatement, because abatement
of emissions directly to the Baltic Proper basin have a larger impact on the nitrogen stocks in that
basin compared to abatement made to basins further away. However, in the presence of
international knowledge diffusion there are also larger benefits from early abatement, because
early abatement reduces abatement costs in later periods also in other countries than the home
country. This implies that with international knowledge diffusion, more nitrogen abatement is
done earlier in time. This early abatement has a smaller impact on the nitrogen stock at time T
compared to abatement carried out in later time periods, implying that in total more nitrogen
abatement must be carried out. For nitrogen, the latter effect outweighs the former.
26

For phosphorus, the effect is similar as that for nitrogen if knowledge diffusion is
proportional to distance or imports, i.e. the tendency towards more early abatement outweighs
that of the increased concentration of abatement to Poland. If, instead, knowledge diffusion is
proportional to human capital less abatement is carried out in total. There is no significant
difference in the allocation in abatement over time between different scenarios. Instead, the
lower aggregate abatement when knowledge diffusion is assumed proportional to human capital
is explained by a reallocation in space. In particular, costly phosphorus reductions in Swedish
catchments, other than that which drains to the Baltic Proper, are reduced and replaced by further
reductions in countries emitting directly to the Baltic Proper. This is explained by the
considerably higher international diffusion of knowledge in combination with the lower domestic
learning which implies that cost reductions occur more uniformly across all countries compared
to the other scenarios.
Fig. 3. Aggregate abatement of N and P emissions in kton under different assumptions about
knowledge dispersal.
983.5
984.0
984.5
985.0
985.5
986.0
575
576
577
578
579
580
581
582
beta(f,f)=1 beta=DIST beta=IMP beta=HUM
kton
P
kton
N
N P
27

The role of marine nutrient transports vs knowledge diffusion
Two different diffusion processes are considered in the above described model, diffusion of
knowledge between countries and diffusion of nutrients between marine basins. Figure 4
compares the sensitivity of net present costs to assumptions made about the two different
dispersal processes. It shows that if it is incorrectly assumed that emissions only affect nutrient
stocks in the basin to which they are emitted (i.e. alfa(f,f)=1) will lead to the conclusion that net
present abatement costs are only half of what they would be, had nutrient dispersal between
basins been correctly accounted for. This can be seen as the bars to the right in Fig. 4 are only
half of those to the left. Compared to that, assumptions made about learning and knowledge
dispersal has a smaller, but still considerable impact on the net present cost. Only domestic
learning reduces net present cost by about 16%, while learning in combination with knowledge
dispersal reduces net present cost by 22%, compared to the case with zero learning. The impact
on net present cost is similar in relative terms independently of assumptions made about marine
nutrient dispersal.
Assumptions about the two diffusion processes affect the allocation of abatement and
cost in time and space. If there is diffusion of knowledge this can, in principle, imply that cost-
effective abatement becomes spatially more or less concentrated compared to the case without
knowledge diffusion. For the Baltic Sea, there is a clear tendency towards more spatially
concentrated abatement. The reason is that learning-by-doing implies a scale advantage in
abatement. If one country already abates more than other countries, even more of the abatement
will be allocated to this country if there is learning-by-doing. Knowledge spillovers generally
enhance this effect, i.e. lead to a higher concentration of abatement as long as diffusion to/from
that country is not substantially lower than for other countries. The concentration effect can
however be smaller or even zero if the large abater’s marginal cost curve increases rapidly in the
interval of interest. When there is marine diffusion of nutrients between basins, this generally
implies that the cost-efficient abatement is distributed over space to larger extent compared to
when this is not the case.
28
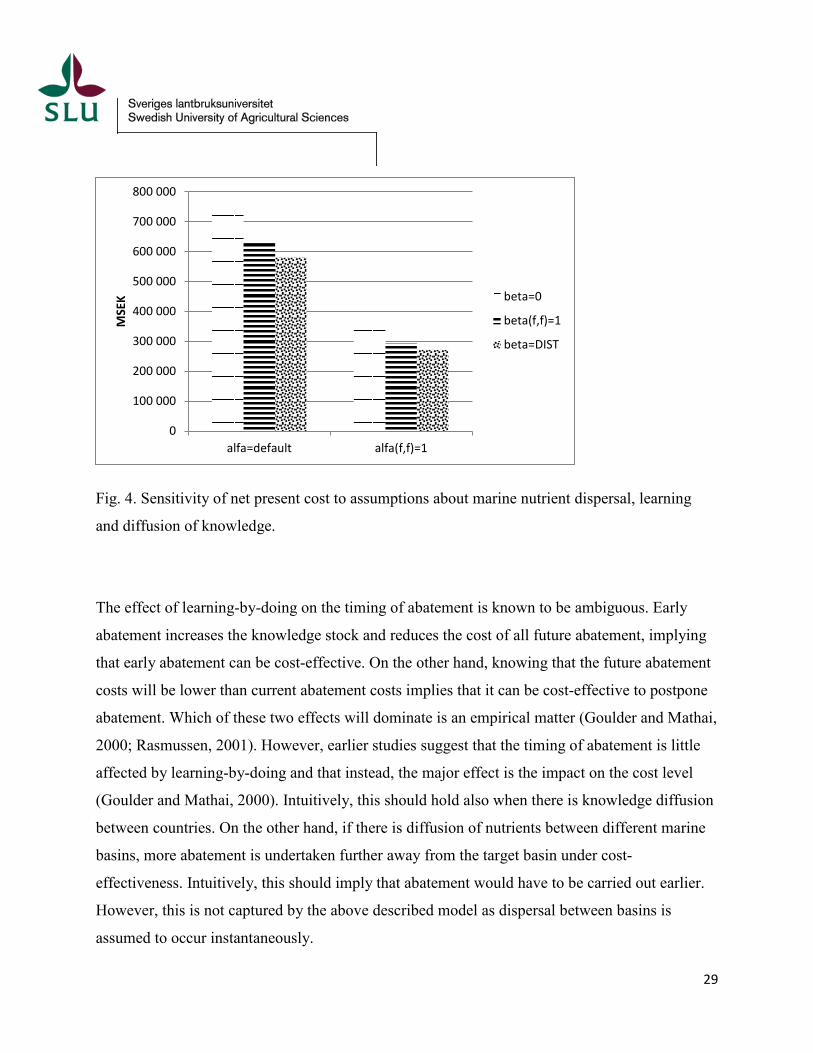
Fig. 4. Sensitivity of net present cost to assumptions about marine nutrient dispersal, learning
and diffusion of knowledge.
The effect of learning-by-doing on the timing of abatement is known to be ambiguous. Early
abatement increases the knowledge stock and reduces the cost of all future abatement, implying
that early abatement can be cost-effective. On the other hand, knowing that the future abatement
costs will be lower than current abatement costs implies that it can be cost-effective to postpone
abatement. Which of these two effects will dominate is an empirical matter (Goulder and Mathai,
2000; Rasmussen, 2001). However, earlier studies suggest that the timing of abatement is little
affected by learning-by-doing and that instead, the major effect is the impact on the cost level
(Goulder and Mathai, 2000). Intuitively, this should hold also when there is knowledge diffusion
between countries. On the other hand, if there is diffusion of nutrients between different marine
basins, more abatement is undertaken further away from the target basin under cost-
effectiveness. Intuitively, this should imply that abatement would have to be carried out earlier.
However, this is not captured by the above described model as dispersal between basins is
assumed to occur instantaneously.
0
100 000
200 000
300 000
400 000
500 000
600 000
700 000
800 000
alfa=default alfa(f,f)=1
MSE
K beta=0
beta(f,f)=1
beta=DIST
29

Fig. 5 below shows the percentage of the net present costs incurred in the first 10 years
for the different scenarios in Table 5. The smallest cost share in the early phase of the policy
period can be found in the scenario with zero learning and when emissions only affect the basin
to which they are emitted. The share of total cost in this scenario is approximately half of that in
the scenarios with default data on marine dispersal and either only domestic learning or
knowledge dispersal proportionate to distance. As Fig. 5 shows, results obtained from the model
suggest that learning-by-doing leads to a higher share of abatement costs being allocated to
earlier time periods, whereas if emissions affect only the marine basin to which they are emitted,
the abatement costs are delayed.
To further understand the timing of abatement, we also look at the share of net present
costs allocated to the last 10 time periods, see Fig. 6. This Figure shows that relatively larger
costs are incurred closer to the final date if there is no learning-by-doing, and that knowledge
spillovers do not affect the time path compared to only domestic learning-by-doing. There are
also relatively smaller costs in the last time periods in the scenarios where emissions only affect
the receiving basin. The latter is explained by a larger share of costs being allocated to
intermediate time periods. This can be explained as follows. In all scenarios, there is a tendency
towards postponement of abatement costs, explained by discounting of future costs. This
postponement can go on for a longer time if emissions only affect the “home” basin than when
there is dispersal because emission reductions are then assumed to have a larger impact on
nutrient concentrations in the “home” basin. However, at a certain point in time, it becomes
necessary to rapidly increase abatement to a high level in order to meet the nutrient concentration
targets in the target year. This point in time occurs earlier when only reductions around the
“home” basin are assumed to have an impact, given that close to the maximum abatement
potential has to be used to meet the target. Summing up, if there is learning and knowledge
dispersal, this tends to imply larger early abatement efforts albeit the impact on timing is modest.
If there is nutrient dispersal between marine basins, this implies that abatement costs are more
evenly distributed over time than would be the case without such dispersal.
30
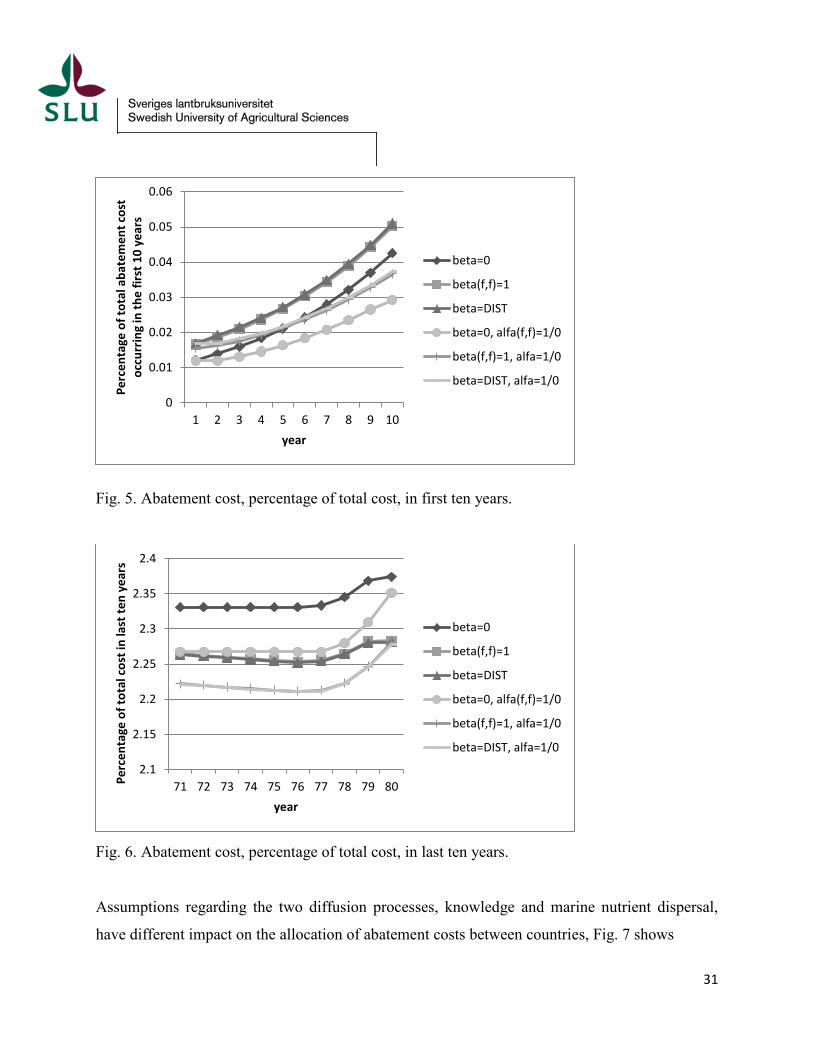
Fig. 5. Abatement cost, percentage of total cost, in first ten years.
Fig. 6. Abatement cost, percentage of total cost, in last ten years.
Assumptions regarding the two diffusion processes, knowledge and marine nutrient dispersal,
have different impact on the allocation of abatement costs between countries, Fig. 7 shows
0
0.01
0.02
0.03
0.04
0.05
0.06
1 2 3 4 5 6 7 8 9 10
Perc
enta
ge o
f tot
al a
bate
men
t cos
t oc
curr
ing
in th
e fir
st 1
0 ye
ars
year
beta=0
beta(f,f)=1
beta=DIST
beta=0, alfa(f,f)=1/0
beta(f,f)=1, alfa=1/0
beta=DIST, alfa=1/0
2.1
2.15
2.2
2.25
2.3
2.35
2.4
71 72 73 74 75 76 77 78 79 80Perc
enta
ge o
f tot
al c
ost i
n la
st te
n ye
ars
year
beta=0
beta(f,f)=1
beta=DIST
beta=0, alfa(f,f)=1/0
beta(f,f)=1, alfa=1/0
beta=DIST, alfa=1/0
31
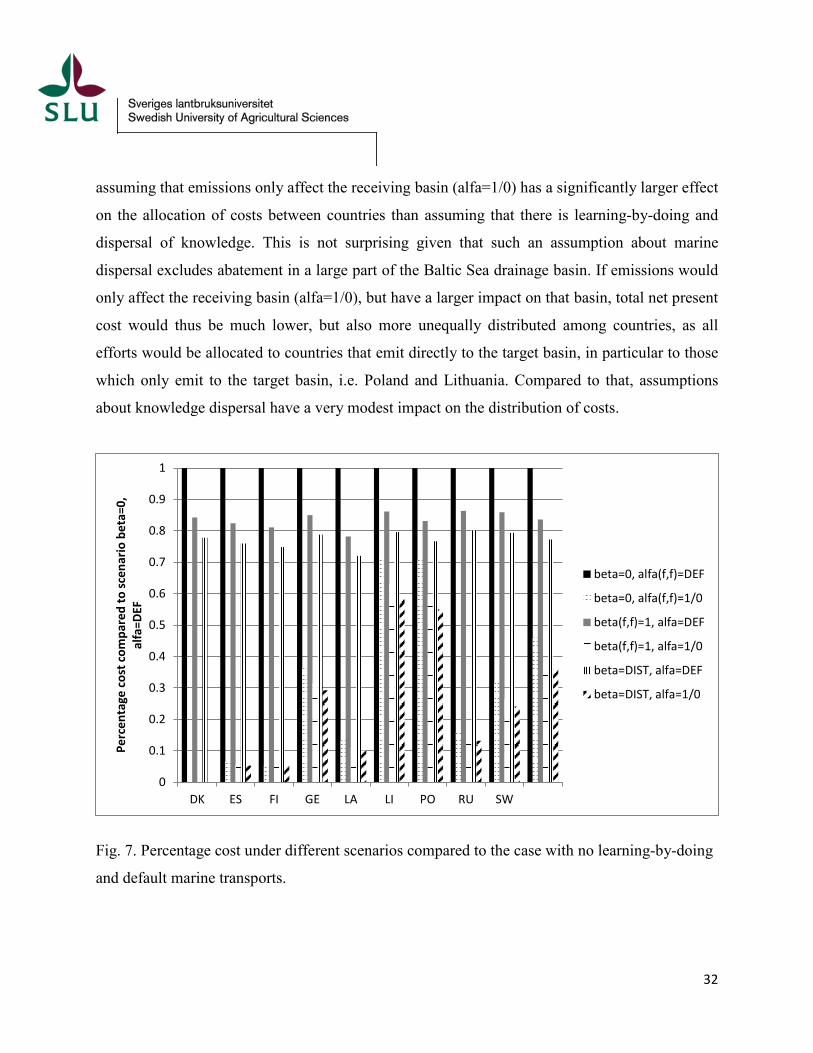
assuming that emissions only affect the receiving basin (alfa=1/0) has a significantly larger effect
on the allocation of costs between countries than assuming that there is learning-by-doing and
dispersal of knowledge. This is not surprising given that such an assumption about marine
dispersal excludes abatement in a large part of the Baltic Sea drainage basin. If emissions would
only affect the receiving basin (alfa=1/0), but have a larger impact on that basin, total net present
cost would thus be much lower, but also more unequally distributed among countries, as all
efforts would be allocated to countries that emit directly to the target basin, in particular to those
which only emit to the target basin, i.e. Poland and Lithuania. Compared to that, assumptions
about knowledge dispersal have a very modest impact on the distribution of costs.
Fig. 7. Percentage cost under different scenarios compared to the case with no learning-by-doing
and default marine transports.
0
0.1
0.2
0.3
0.4
0.5
0.6
0.7
0.8
0.9
1
DK ES FI GE LA LI PO RU SW
Perc
enta
ge c
ost c
ompa
red
to sc
enar
io b
eta=
0,
alfa
=DEF
beta=0, alfa(f,f)=DEF
beta=0, alfa(f,f)=1/0
beta(f,f)=1, alfa=DEF
beta(f,f)=1, alfa=1/0
beta=DIST, alfa=DEF
beta=DIST, alfa=1/0
32
Discussion and conclusions
Increased experience with abatement technologies in the home country and abroad can reduce
future costs of their use. The purpose of this paper is to investigate the implications of
international knowledge diffusion for the costs of Baltic-wide policy to reduce nutrient
concentrations in the Baltic Sea. The effect of international knowledge diffusion on the
distribution of abatement and costs over time and space is analyzed and compared to the effect of
nutrient diffusion between different marine basins. To this end, a numerical, dynamic cost-
effectiveness model covering the Baltic Sea drainage basin is used. The novelty of the study is
the analysis of knowledge dispersal and its role for a cost-effective policy to reduce nutrient
pollution.
The analysis shows that the cost-effective abatement choices are determined not only by
the impact of the abatement on nutrient emissions and concentration, and the costs incurred, but
also by the potential of the abatement to add to the stock of experience in the domestic country as
well as abroad. In a hypothetical situation, this could imply that abatement can be cost-effective
even though costs are comparatively high, and the impact on water quality low, provided that the
abatement contributes much enough to abatement knowledge stocks. However, more plausible is
that compared to a situation where there is no knowledge dispersal between countries,
knowledge dispersal will lead to a further concentration of abatement to countries with large,
low-cost abatement opportunities, unless the knowledge stock in these countries is unaffected by
abatement experiences made in other countries.
Earlier research suggests that knowledge diffusion between countries is related to the
distance between countries, countries’ openness to trade, and human capital. The relative
importance of these factors is not well known. The empirical analysis in this paper shows that it
matters which one of these factors is assumed to determine knowledge diffusion. If knowledge
diffusion is associated to distance, this has a smaller impact on the distribution of costs and
abatement than if it is associated with imports or human capital. When comparing the
consequences of knowledge diffusion between countries and diffusion of nutrients between
33

marine basins, the results show that learning and knowledge diffusion tends to motivate larger
early abatements efforts, compared to a situation without these processes. False beliefs regarding
the dispersal of nutrients, e.g. believing that nutrient have a strong impact on the basin to which
they are emitted, but no impact on other basins, would lead a policy-maker to postpone
abatement, but that in medium term rapidly increase abatement to levels close to the maximum
potential. This contrasts with the smoother development of the abatement path in the presence of
knowledge diffusion.
Whereas this study provides further understanding of the role of knowledge diffusion for
an international cost-effective policy for abatement of stock pollutants, there are several
limitations to the analysis. These limitations include uncertainty about learning rates for
technologies to reduce nutrient pollution and about the magnitude of international knowledge
spillovers associated with experience of pollution abatement. Moreover, the study does not take
into account the role of technological innovation as another determinant of future pollution
abatement cost. Further research in these areas would improve the understanding of knowledge
in relation to pollution abatement costs.
There are several policy implications from the study. First, it suggests that larger early
abatement efforts can be motivated by their role for increasing experience, and hence reducing
future costs, compared to what is suggested in studies that ignore the role of learning and
knowledge diffusion, such as Gren, Savchuk and Jansson (2013), Laukkanen and Huhtala (2008)
and Ahlvik et al. (2014). However, internationally agreed policies for the Baltic Sea build on the
presumption of even larger early abatement efforts, given that they are based on the idea that a
fixed level on nutrient reductions should be made in every year. The resulting emission level
should then lead to the desired nutrient concentration in the Sea in the long run, albeit there is no
explicit restriction on how long time should be allowed until the targeted nutrient concentration
is actually achieved (HELCOM, 2007). Such a policy is likely to imply higher costs that the one
analyzed in this paper, while there is also a risk that the target is met at a later date. Moreover,
and perhaps contrasting to expectation, the study shows that if there is knowledge diffusion, this
34

further strengthens the concentration of abatement efforts to Poland under a cost-effective policy
scheme. This confirms and strengthens the conclusion regarding Poland’s role in this context
(Gren, Elofsson and Jannke, 1997; Markowska and Zylicz, 1999; Elofsson, 2010; Wulff et al.,
2014; Hasler et al., 2014), pointing to the need to solve the cost distribution problem that arises
as a consequence of the large Polish abatement burden. Finally, the study shows that the role of
individual countries in a cost-effective abatement scheme depends on whether other countries
will also engage in abatement and on whether there is a high degree of spillover and
transferability of learning across countries. Consequently, internationally policies supporting
nutrient pollution abatement, such as agri-environmental schemes within the EU rural
development programs, should take into account the potential for learning and dispersal of
knowledge through prioritization of measures and regions.
References
Acemoglu D, Aghion P, Bursztyn L, Hemous D. 2012. The environment and directed technical
change. American Economic Review 102: 131–166.
Ahlvik L, Pavlova Y. 2013. A strategic analysis of eutrophication abatement in the Baltic Sea.
Environmental and Resource Economics 56: 353-378.
Ahlvik L, Pitkänen H, Ekholm P, Hyytiäinen K. 2014. An economic-ecological model to valuate
impacts of nutrient abatement in the Baltic Sea. Environmental Modelling & Software
55: 164-175
Arrow K.J. 1962. The economic implications of learning by doing. Review of Economic Studies
29:155-173.
Barro R, Lee J-W. 2013. A New Data Set of Educational Attainment in the World, 1950-2010.
Journal of Development Economics 104: 184–198.
Berglund C, Söderholm P. 2006. Modeling technical change in energy system analysis:
analyzing the introduction of learning-by-doing in bottom-up energy models. Energy
Policy 34(12): 1344–56.
35
Bernard A, Jensen JB. 1999. Exceptional exporter performance: cause, effect, or both? Joumal of
Intemational Economics 47: 1-25.
Boardman AE, Greenberg, DH, Vining AR, Weimar DL. 2011. Cost-benefit analysis: concepts
and practice. 4th ed. Upper Saddle River, N.J., Prentice Hall.
Boesch D, Hecky R, O’Melia C, Schindler D, Seitzinger S. 2006.. Eutrophication of the Swedish
seas. Report no. 5509, Swedish Environmental Protection Agency, Stockholm.
Bottazzi L, Peri, G. 2003. Innovation and Spillovers in Regions: Evidence from European patent
data. European Economic Review 47: 687-710.
Bramoullé Y, Olson LJ. 2005. Allocation of pollution abatement under learning by doing.
Journal of Public Economics 89: 1935-1960.
Buckley C, Hynes S, Mechan S. 2012. Supply of an ecosystem service - Farmers’ willingness to
adopt riparian buffer zones in agricultural catchments. Environmental Science and Policy
24(12): 101–109.
Coe DT, Helpman E. 1995. International R&D spillovers. European Economic Review 39: 859-
887.
DeFrancesco E, Gatto P, Runge F, Trestini S. 2008. Factors affecting farmers’ participation in
agri‐environmental measures: a northern Italian perspective. Journal of Agricultural
Economics 59(1): 114‐131.
Eaton J, Kortum S. 1996. Trade in ideas: patenting and productivity in the OECD. Journal of
International Economics 40: 251-278.
Ek K, Söderholm P. 2010. Technology learning in the presence of public R&D: the case of
European wind power. Ecological Economics 69(12): 2356–62.
Elofsson K, 2007. Cost uncertainty and unilateral abatement. Environmental and Resource
Economics 36(2): 143-162.
Elofsson K. 2010. Cost-effectiveness of the Baltic Sea Action Plan. Marine Policy 34: 1043–
1050.
36
Fuglie KO, Kascak CA. 2001. Adoption and diffusion of natural-resource-conserving
agricultural technology. Review of Agricultural Economics 23: 386-403.
Gren I-M, Elofsson K, Jannke P. 1997. Cost effective nutrient reductions to the Baltic Sea.
Environmental and Resource Economics 10(4): 341-362.
Gren I-M. 2001. International versus national actions against pollution of the Baltic Sea.
Environmental and Resource Economics 20(1): 41-59.
Gren, I-M. 2009. A numerical model for dynamic cost effective mitigation of eutrophication with
spatial heterogeneity in the Baltic Sea. Technical Report. Working paper 2009:3.
Department of Economics, Swedish University of Agricultural Sciences.
Gren I-M, Savchuk OP, Jansson T. 2013. Cost-effective spatial and dynamic management of a
eutrophied Baltic Sea. Marine Resource. Economics 28: 263–284.
Goulder LH, Mathai K. 2000. Optimal CO2 abatement in the presence of induced technological
change. Journal of Environmental Economics and Management 39: 1–38.
Hasler B, Smart JCR, Fonnesbech-Wulff A, Andersen HE, Thodsen H, Blicher-Mathiesen G,
Smedberg E, Göke C, Czajkowski M, Was A, Elofsson K, Humborg C, Wolfsberg A,
Wulff F. 2014. Hydro-economic modelling of cost-effective transboundary water quality
management in the Baltic Sea. Water Resources and Economics 5: 1–23.
HELCOM. 2007. Approach for setting country-wise allocations of nutrient reduction targets in
the 2007 Helcom Baltic Sea Action Plan. HELCOM, Helsinki.
http://helcom.fi/Documents/Baltic%20sea%20action%20plan/Nutrient%20reduction%20
scheme/Background%20on%20target%20setting/BSAP%20approach%20for%20setting
%20CART.pdf [As available June 5, 2014]
HELCOM. 2011. Fifth Baltic Sea Pollution Load Compilation (PLC-5). Baltic Sea Environment
Proceedings No. 128. Helsinki Commission, Helsinki.
HELCOM. 2013. Overview of implementation of the HELCOM Baltic Sea Action Plan (BSAP).
Document prepared for the 2013 HELCOM Ministerial Meeting in Copenhagen.
Available 2014-04-23 at
37

http://helcom.fi/Documents/Ministerial2013/Associated%20documents/Supporting/BSA
P_Overview_with%20cover.pdf
Hynes S, Garvey E. 2009. Modelling farmers‟ participation in an agri-environmental scheme
using panel data: an application to the rural environment protection scheme in Ireland.
Journal of Agricultural Economics 60(3): 546–562.
Jamasb T. 2007. Technical change theory and learning curves: patterns of progress in energy
technologies. The Energy Journal 28(3): 45-65.
Kahouli-Brahmi S. 2008. Technological learning in energy-environment-economy modeling: a
survey. Energy Policy 36: 138–162.
Keller W. 2002. Geographic localization of international technology diffusion. American
Economic Review 92: 120-142.
Keller W. 2004. International Technology Diffusion. Journal of Economic Literature 42(3): 752–
782.
Kemp R. 1998. The diffusion of biological waste-water treatment plants in the Dutch food and
beverage industry. Environmental and Resource Economics 12: 113–136.
Klaassen G, Miketa A, Larsen K, Sundqvist T. 2005. The impact of R&D on innovation for wind
energy in Denmark, Germany and the United Kingdom. Ecological Economics 54(2–3):
227–240.
Laibson D. 1997. Golden eggs and hyperbolic discounting. Quarterly Journal of Economics
112:. 443–77.
Laukkanen, M. and Huhtala, A. 2008. Optimal management of a eutrophied coastal ecosystem:
balancing agricultural and municipal abatement measures. Environmental and Resource
Economics 39: 139-159.
Lindqvist M, Gren I-M. 2013. Cost effective nutrient abatement for the Baltic Sea under
learning-by-doing induced technical change. Working Paper 01/2013. Swedish
University of Agricultural Sciences, Department of Economics, Uppsala.
38
Lovely M, Popp D. 2008. Trade, technology and the environment: why do poorer countries
regulate sooner? NBER Working Paper, 14286. National Bureau of Economic Research,
Cambridge, MA, USA.
Löschel A. 2002. Technological change in economic models of environmental policy: a survey.
Ecological Economics 43(2-3): 105-26.
Marangoni G, Tavoni M. 2013. The clean energy R&D strategy for 2°C. FEEM Working Paper
93.2013, Fondazione Eni Enrico Mattei (FEEM).
Markowska A. Zylicz T. 1999. Costing an international public good: the case of the Baltic Sea.
Ecological Economics 30: 301-316.
McDonald A, Schrattenholzer L. 2001. Learning rates for energy technologies. Energy Policy
29(4): 255–261.
Moore MA, Boardman AE, Vining AR, Weimer DL, Greenberg, DH. 2004. Just give me a
number! Practical values for the social discount rate. Journal of Policy Analysis and
Management 23(4): 789-812.
Morris C, Potter C. 1995. Recruiting the new conservationists: farmers' adoption of agri-
environmental schemes in the UK. Journal of Rural Studies 11: 51–63.
Nemet GF. 2006. Beyond the learning curve: Factors influencing cost reductions in
photovoltaics. Energy Policy 34(17): 3218-3232.
Newell RG. 2009. Literature review of recent trends and future prospects for innovation in
climate change mitigation. OECD Environment Working Papers, No. 9, OECD
Publishing, OECD. doi:10.1787/218688342302.
Popp D. 2006. International innovation and diffusion of air pollution control technologies: The
effects of NOX and SO2 regulation in the U.S., Japan, and Germany. Journal of
Environmental Economics and Management 51(1): 46-71.
Rasmussen TN. 2001. CO2 Abatement Policy with Learning-by-doing in Renewable Energy.
Resource and Energy Economics 23: 297–325.
Rubin ES, Taylor MR, Yeh S, Hounshell DA. 2004. Learning curves for environmental
technologies and their importance for climate policy analysis. Energy 29: 1551-1559.
39
Savchuk O, Wulff F. 2007. Modeling the Baltic Sea ecosystem in a decision support system for
management of marine eutrophication. Ambio 36: 141-148.
Savchuk O, Wulff F. 2009. Long-term modeling of large-scale nutrient cycles in the entire Baltic
Sea. Hydrobiologia 629: 209–224.
Söderholm P. Klaassen G. 2007. Wind power in Europe: A simultaneous innovation-diffusion
model. Environmental and Resource Economics 36: 163-190.
Söderholm P, Sundqvist T. 2007. Empirical challenges in the use of learning curves for assessing
the economic prospects of renewable energy technologies. Renewable Energy 32: 2559-
78.
van Meijl H, van Tongeren F. 2004. International diffusion of gains from biotechnology and the
European Union's Common Agricultural Policy. Agricultural Economics 31: 307–316.
Vanslembrouck I, van Huylenbroeck G, Verbeke W. 2002. Determinants of the willingness of
Belgian farmers to participate in agri-environmental measures. Journal of Agricultural
Economics 53(3): 489–511.
Weitzman ML. 2007. The Stern review of the economics of climate change. Journal of
Economic Literature 45(3): 703–724.
Wright TP. 1936. Factors affecting the costs of airplanes. Journal of Aeronautical Sciences 3:
122-128.
Wulff F, Andersen HE, Blicher-Mathiesen G, Czajkowski M, Elofsson K, Fonnesbech-Wulff A,
Hasler B, Hong B, Humborg C, Jansons V, Mörth C-M, Smart JCR, Smedberg E,
Stålnacke P, Swaney DP, Thodsen H, Was A, Żylicz T. 2014. Reduction of Baltic Sea
nutrient inputs and allocation of abatement costs within the Baltic Sea catchment. Ambio
43(1): 11-25.
Xu B. 2000. 'Multinational enterprises, technology diffusion, and host country productivity
growth. Journal of Development Economics 62: 477-493.
40
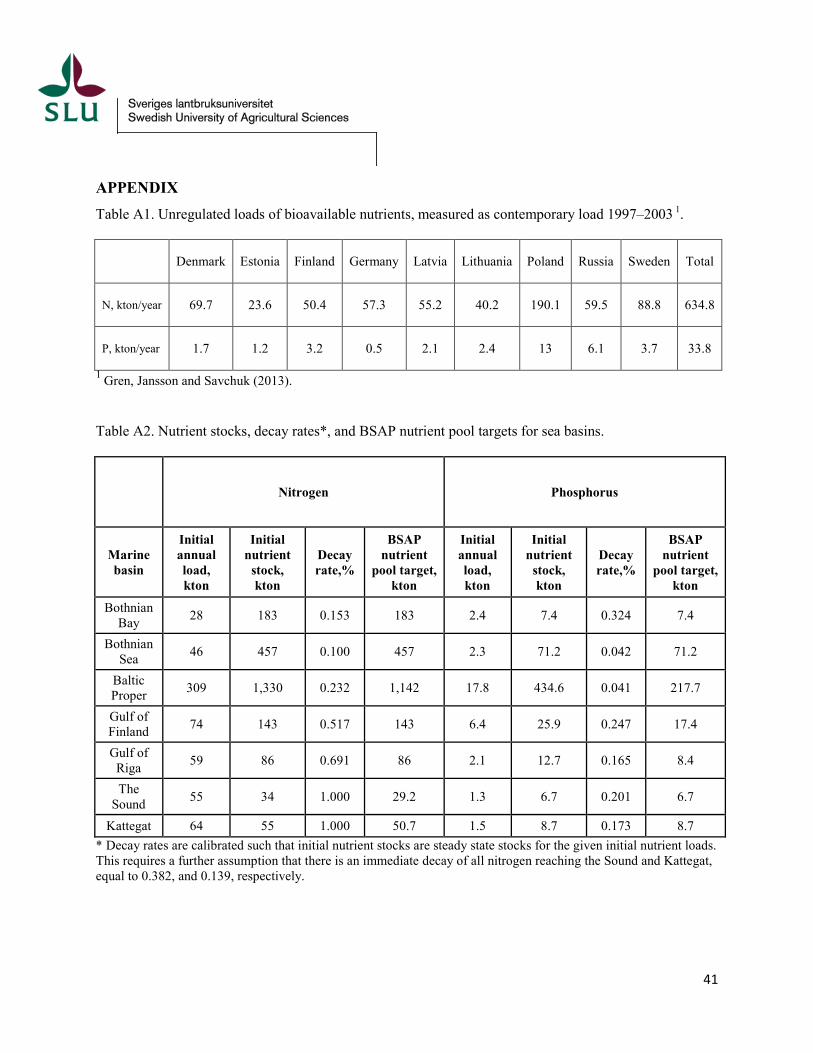
APPENDIX Table A1. Unregulated loads of bioavailable nutrients, measured as contemporary load 1997–2003 1.
Denmark Estonia Finland Germany Latvia Lithuania Poland Russia Sweden Total
N, kton/year 69.7 23.6 50.4 57.3 55.2 40.2 190.1 59.5 88.8 634.8
P, kton/year 1.7 1.2 3.2 0.5 2.1 2.4 13 6.1 3.7 33.8
1 Gren, Jansson and Savchuk (2013). Table A2. Nutrient stocks, decay rates*, and BSAP nutrient pool targets for sea basins.
Nitrogen Phosphorus
Marine basin
Initial annual load, kton
Initial nutrient
stock, kton
Decay rate,%
BSAP nutrient
pool target, kton
Initial annual load, kton
Initial nutrient
stock, kton
Decay rate,%
BSAP nutrient
pool target, kton
Bothnian Bay 28 183 0.153 183 2.4 7.4 0.324 7.4
Bothnian Sea 46 457 0.100 457 2.3 71.2 0.042 71.2
Baltic Proper 309 1,330 0.232 1,142 17.8 434.6 0.041 217.7
Gulf of Finland 74 143 0.517 143 6.4 25.9 0.247 17.4
Gulf of Riga 59 86 0.691 86 2.1 12.7 0.165 8.4
The Sound 55 34 1.000 29.2 1.3 6.7 0.201 6.7
Kattegat 64 55 1.000 50.7 1.5 8.7 0.173 8.7 * Decay rates are calibrated such that initial nutrient stocks are steady state stocks for the given initial nutrient loads. This requires a further assumption that there is an immediate decay of all nitrogen reaching the Sound and Kattegat, equal to 0.382, and 0.139, respectively.
41
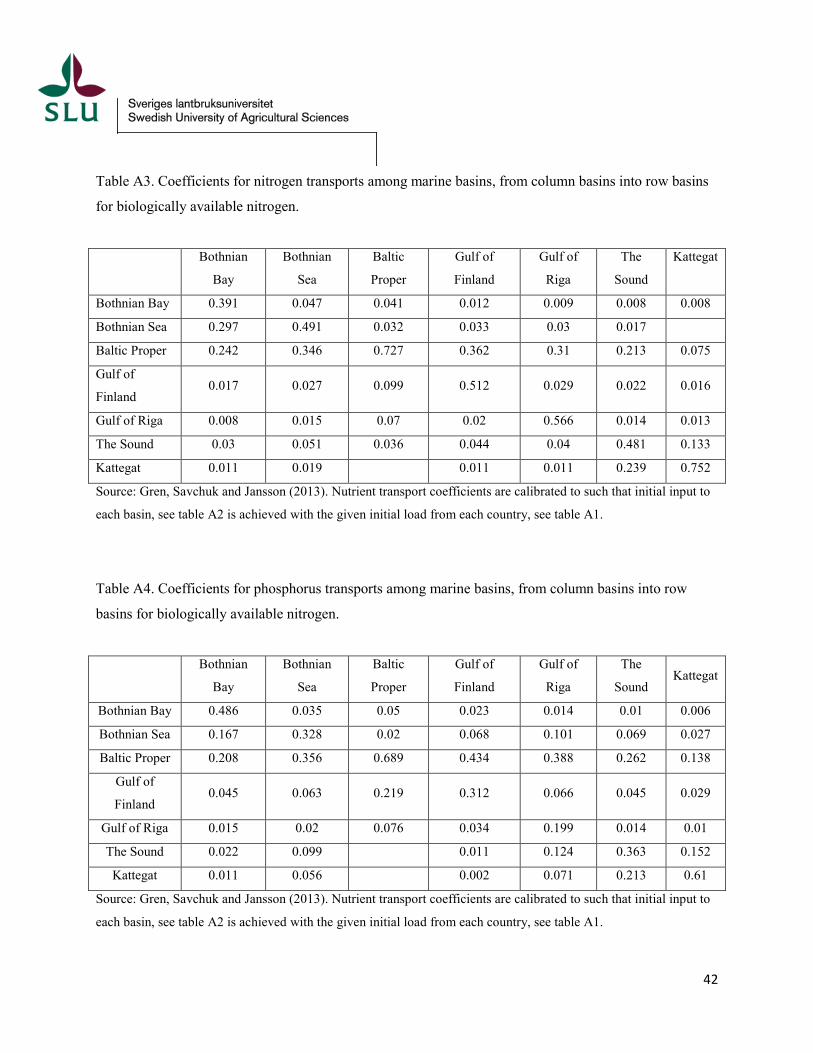
Table A3. Coefficients for nitrogen transports among marine basins, from column basins into row basins
for biologically available nitrogen.
Bothnian
Bay
Bothnian
Sea
Baltic
Proper
Gulf of
Finland
Gulf of
Riga
The
Sound
Kattegat
Bothnian Bay 0.391 0.047 0.041 0.012 0.009 0.008 0.008
Bothnian Sea 0.297 0.491 0.032 0.033 0.03 0.017
Baltic Proper 0.242 0.346 0.727 0.362 0.31 0.213 0.075
Gulf of
Finland 0.017 0.027 0.099 0.512 0.029 0.022 0.016
Gulf of Riga 0.008 0.015 0.07 0.02 0.566 0.014 0.013
The Sound 0.03 0.051 0.036 0.044 0.04 0.481 0.133
Kattegat 0.011 0.019 0.011 0.011 0.239 0.752
Source: Gren, Savchuk and Jansson (2013). Nutrient transport coefficients are calibrated to such that initial input to
each basin, see table A2 is achieved with the given initial load from each country, see table A1.
Table A4. Coefficients for phosphorus transports among marine basins, from column basins into row
basins for biologically available nitrogen.
Bothnian
Bay
Bothnian
Sea
Baltic
Proper
Gulf of
Finland
Gulf of
Riga
The
Sound Kattegat
Bothnian Bay 0.486 0.035 0.05 0.023 0.014 0.01 0.006
Bothnian Sea 0.167 0.328 0.02 0.068 0.101 0.069 0.027
Baltic Proper 0.208 0.356 0.689 0.434 0.388 0.262 0.138
Gulf of
Finland 0.045 0.063 0.219 0.312 0.066 0.045 0.029
Gulf of Riga 0.015 0.02 0.076 0.034 0.199 0.014 0.01
The Sound 0.022 0.099 0.011 0.124 0.363 0.152
Kattegat 0.011 0.056 0.002 0.071 0.213 0.61
Source: Gren, Savchuk and Jansson (2013). Nutrient transport coefficients are calibrated to such that initial input to
each basin, see table A2 is achieved with the given initial load from each country, see table A1.
42

Table A5. Coefficients of cost functions in MSEK and kton, standard error within parenthesis.
Nitrogen Nitrogen Nitrogen Nitrogen Phosphorus Phosphorus Phosphorus Phosphorus
Adj R2 Max red.
(% of BAU)
Adj R2 Max red.
(% of BAU)
Denmark
The Sound -- 21.37
(0.48) 0.91 50 -- 3609 0.92 50 (93)
Kattegat -- 40.93 (0.48) 0.92 40 -- 21433
(2250) 0.8 40
Estonia
Baltic Proper
43.62 (0.98)
17.20 (1.89) 0.92 50
486 154925 (10423) 0.87 30
(249)
Gulf of Finland
47.66 (1.14)
1.17 (0.22) 0.92 50 --
6829 0.92 50
(166)
Gulf of Riga
31.52 (7.27)
9.68 (2.05) 0.91 50
566 23583 (1912) 0.92 50
(152)
Finland Bothnian
Bay 156.03 (9.18)
21.33 (2.02) 0.92 50 -- 14625
(707) 0.9 50
Bothnian Sea
72.10 (10.54)
32.43 (2.35) 0.92 50 --
6468 0.92 50
(139)
Gulf of Finland -- 19.61
(1.18) 0.88 50 -- 3550
0.91 50 (130)
Germany
Baltic Proper -- 11.32
(0.46) 0.91 50 394 1061
0.92 50 (16) (204)
The Sound
56.07 (14.55)
35.26 (4.87) 0.91 50
261 2838 0.92 50
(36) (304)
Latvia
Baltic Proper
56.07 (14.55)
35.26 (4.87) 0.91 45
1721 11119 0.92 50
(108) (901)
Gulf of Riga
92.77 (5.92)
3.52 (0.33) 0.92 50
1870 1524 0.92 50
(122) (171)
43
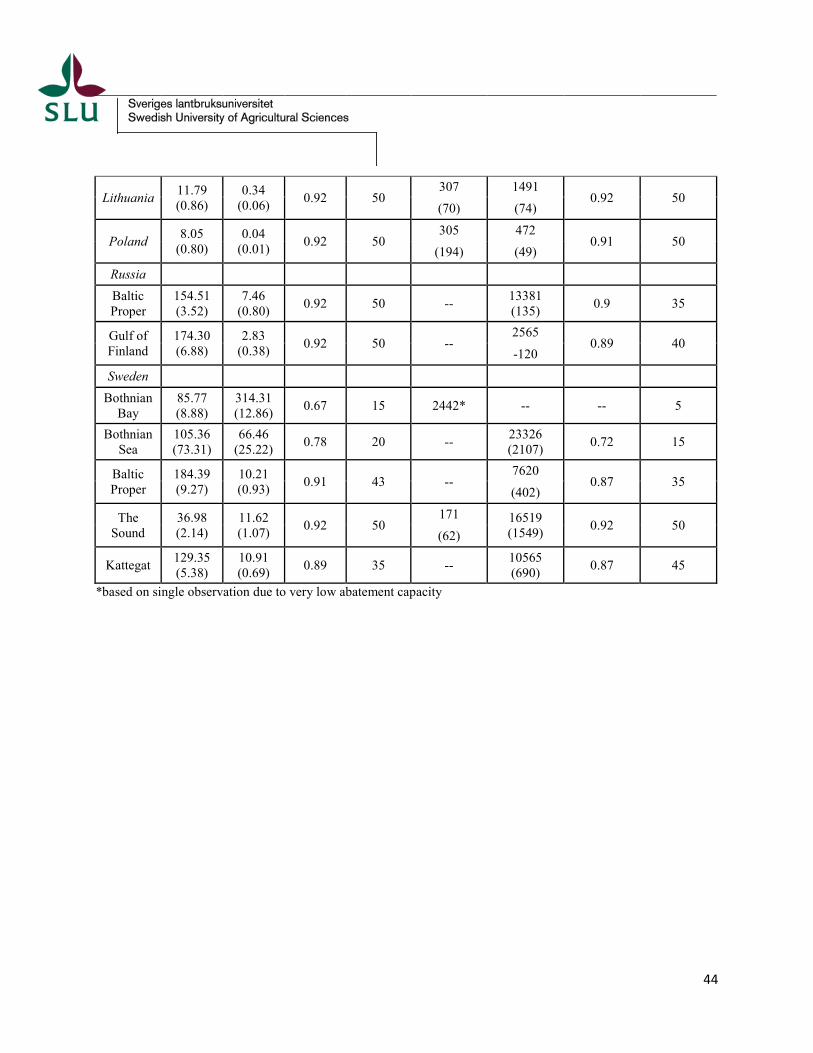
Lithuania 11.79 (0.86)
0.34 (0.06) 0.92 50
307 1491 0.92 50
(70) (74)
Poland 8.05 (0.80)
0.04 (0.01) 0.92 50
305 472 0.91 50
(194) (49)
Russia Baltic Proper
154.51 (3.52)
7.46 (0.80) 0.92 50 -- 13381
(135) 0.9 35
Gulf of Finland
174.30 (6.88)
2.83 (0.38) 0.92 50 --
2565 0.89 40
-120
Sweden Bothnian
Bay 85.77 (8.88)
314.31 (12.86) 0.67 15 2442* -- -- 5
Bothnian Sea
105.36 (73.31)
66.46 (25.22) 0.78 20 -- 23326
(2107) 0.72 15
Baltic Proper
184.39 (9.27)
10.21 (0.93) 0.91 43 --
7620 0.87 35
(402)
The Sound
36.98 (2.14)
11.62 (1.07) 0.92 50
171 16519 (1549) 0.92 50
(62)
Kattegat 129.35 (5.38)
10.91 (0.69) 0.89 35 -- 10565
(690) 0.87 45
*based on single observation due to very low abatement capacity
44

45

Department of Economics Institutionen för ekonomi Swedish University of Agricultural Sciences (SLU) Sveriges lantbruksuniversitet P.O. Box 7013, SE-750 07 Uppsala, Sweden Box 7013, 750 07 Uppsala Ph. +46 18 6710 00, Fax+ 46 18 67 35 02 Tel. 018-67 10 00, fax 018 67 35 02 www.slu.se www.slu.se www.slu.se/economics www.slu.se/ekonomi