international journal on working conditionsricot.com.pt/artigos/1/ijwc.8_rodriguez et...
TRANSCRIPT

INTERNATIONAL JOURNAL ON WORKING CONDITIONS
ISSN 2182-9535
Publicação editada pela RICOT (Rede de Investigação sobre Condições de Trabalho) Instituto de Sociologia da Universidade do Porto Publication edited by RICOT (Working Conditions Research Network) Institute of Sociology, University of Porto
http://ricot.com.pt
Publicação editada pela RICOT (Rede de Investigação sobre Condições de Trabalho) Instituto de Sociologia da Universidade do Porto
Publication edited by RICOT (Working Conditions Research Network) Institute of Sociology, University of Porto
http://ricot.com.pt
Field study on visual and cognitive stressors in Visual Display Terminal office work
Roberto Germán Rodriguez1, Clarisa Dumit2, Roxana Del Rosso2, Augusta Peterle2, Alejandra Staneloni2, Andrea Pattini3 1Human and Built Environment Laboratory – INCIHUSA – CONICET / Faculty of Architecture, Urbanism and Design - University of Mendoza,
Mendoza, Argentina. Email: [email protected] ; 2Faculty of Architecture, Urbanism and Design - University of Mendoza,
Mendoza, Argentina; 3 Human and Built Environment Laboratory – INCIHUSA – CONICET.
Estudo de campo sobre stressores visuais e cognitivos no trabalho de escritório com ecrãs de visualização de dados
Resumo: O Trabalho de escritório com Ecrãs de Visualização de Dados (EVD) é um caso paradigmático de sistema de trabalho onde a adoção de uma nova tecnologia introduz novos riscos associados: visuais, músculo-esqueléticos e cognitivos. Fizemos uma Avaliação Pós-Ocupação (APO) nas áreas administrativas da Universidade de Mendoza, para fazer um diagnóstico dos riscos visuais, cognitivos e posturais associados ao trabalho com EVD. Os nossos resultados mostram uma iluminação média no plano de trabalho inferior à exigida pela legislação vigente, regulamentação que, por outro lado, precisa ser revista e atualizada. 32% dos participantes expressaram um nível inaceitável de carga mental de trabalho. Exploramos o papel hipotético das fontes de iluminação presentes no campo visual dos trabalhadores como distratores ambientais, encontrando uma correlação linear estatisticamente significativa entre o nível de iluminância vertical e a dimensão do efeito Stroop. Este estudo exploratório descreveu o comportamento das nossas variáveis de interesse na presença de fatores de confusão específicos numa situação de trabalho real, propondo um modelo geral de trabalho com EVD a partir do grau de correlação entre as variáveis avaliadas. Palavras-chave: Atenção Dividida, Ergonomia de Escritório, Ofuscamento inibidor, Estudo Observacional.
Abstract: Office Visual Display Terminal (VDT) work is a paradigmatic case of a work system in which the adoption of a new technology introduces new associated risks of different natures: visual, musculoskeletal and cognitive. We carried out a Post Occupancy Evaluation at University of Mendoza administrative offices, and made a diagnosis of visual, cognitive and postural risks associated with VDT office work. Our results showed levels of horizontal illuminance lower than the legally required by our legislation, whose regulations need to be revised and updated. We found that 32% of our participants were outside the acceptable range of mental workload. Also, we explored the hypothetical role of glare sources as environmental distractors, finding a statistically significant linear correlation between vertical illuminance level and Stroop interference. This exploratory study described the behavior of many variables of interest in actual work situations, allowing us to propose a general model of VDT office. Keywords: Office Ergonomics, Discomfort Glare, Divided Attention, Post Occupancy Evaluation.

International Journal on Working Conditions, No.8, December 2014
129
Fie
ld s
tudy o
n v
isua
l a
nd c
ogn
itiv
e s
tressors
in
Vis
ua
l D
ispla
y T
erm
ina
l off
ice w
ork
R
oberto
Germ
án R
odrig
uez e
t al.
1. Introduction
From the early 1980s high levels of musculoskeletal and visual problems, as well as
concerns regarding psychosocial stress among Visual Display Terminal (VDT) workers
had been described in the literature (e.g., Smith et al., 1981; WHO, 1988, Bergquist et al.,
1995). More recent publications indicate that musculoskeletal, visual, and psychosocial
issues still appear to cause problems for VDT workers (Aarås et al., 2000; Helland et al.,
2008; Portello et al., 2012). Thus, VDT work is a paradigmatic case of a work system in
which the adoption of a new technology introduces new risks associated with it, as well as
their interaction effects (Aarås et al., 1998; Johnston et al., 2010). These risks depend on
multiple factors derived from the specific requirements of the task, the job characteristics
and the worker.
Visual Risks: The electronic office introduced in the 1980s new concerns about
lighting. Office work with VDT has two sources of information: the computer screen and
paper. Both have different optical characteristics, and may impose high visual adaptation
and accommodation demands. When visual adaptation mechanisms are exceeded glare
occurs. A large body of knowledge has been developed to predict discomfort glare (Clear,
2012) caused by natural and artificial light. Glare is caused by an unsuitable luminance
distribution, or by high luminance contrasts within the visual field (CIE, 1987). Disability
glare is the effect associated with a reduction in visual performance due to the masking
effect caused by light scattered in the ocular media which produces a veiling luminance
over the field of view, reducing the contrast and hence the visibility of the object (Stiles,
1929; Vos, 2002). Discomfort glare refers to the sensation perceived which is not
necessarily tied to a reduction in visual performance. It is the distracting effect of peripheral
light sources in the field of view. Glare is a factor that contributes to visual discomfort,
along with lighting levels, lighting uniformity, veiling reflections, shadows, and flicker.
Around 90% of workers using the computer for more than three hours a day, experience
some form of visual impairment (Blehm et al., 2005). Computer Vision Syndrome (CVS) is
a set of symptoms associated with the use of computers: eyestrain, eye fatigue, irritation,
burning sensation, redness, blurred vision and double vision, among others (Weevers et
al., 2005).
Musculoskeletal Risks: Musculoskeletal disorder (MSD) is a set of health problems
associated to muscles, tendons, bones, cartilage, ligaments and nerves. It covers all kinds
of illnesses, from mild and temporary discomfort to irreversible and disabling injuries. Its
occurrence is associated with certain risk factors: excessive mechanical stress, duration of
exposure, the frequency of repetition, or postures. It has multi-factorial origins including
inadequate furniture design, hard and monotonous working hours, the lack of rest periods
and other psychosocial aspects such as work style, perception of time pressure and high
workload (del Río Martínez & González Videgaray, 2007). Working with VDT may lead to
the maintenance of awkward postures, to static muscular effort or to the execution of
repetitive tasks such as typing or using the mouse. Most common MSD are (OHSCO,
2007): back pain, carpal tunnel syndrome, epicondylitis, muscle tension, tension neck
syndrome, tendinitis, and tenosynovitis. Symptoms are often similar, regardless of the
body part: pain with or without motion, swelling, decreased motion range, stiffness,
tingling, and numbness in nerve-related injuries.
Psychosocial Risks: Many VDT work is characterized by high pressure and little
decision making by the user, inadequate work organization, repetitive and monotonous

International Journal on Working Conditions, No.8, December 2014
130
Fie
ld s
tudy o
n v
isua
l a
nd c
ogn
itiv
e s
tressors
in
Vis
ua
l D
ispla
y T
erm
ina
l off
ice w
ork
R
oberto
Germ
án R
odrig
uez e
t al.
activities, and little support from colleagues and supervisors. Prolonged and daily use of
computer systems may lead to psychological disorders often grouped under the term
technostress, such as techno fatigue, techno anxiety and techno addiction (Salanova et
al., 2013). Some of the technostress risk factors are: the perception of high working
demands in terms of time and quality; a perceived lack of control over work pacing; little
social support from other workers and supervisors; imbalance between workload and
remuneration or recognition; perfectionist or obsessive work style of some individuals; lack
of rest, among others.
Also, VDT work often requires great attention and cognitive effort. The introduction of
Information and Communication Technologies (ICT) in the office has imposed a constant
cognitive processing load on the individual (Wästlund, 2007) under a multi-task paradigm
(Hashizume, Kurosu & Kaneko, 2007). Work places with widespread use of technology
usually provide complex work environments with network based information and computer-
mediated interactions and communication. The amount of information available to ICT
users is huge and it constantly flows between people, digital media, and paper (Sellberg &
Susi, 2014). In this context, mental workload is a risk factor present in this group of
workers. Research in this field has proposed different definitions of mental workload
depending on the underlying attentional model (Cain, 2007). We define mental workload
as the difference between the capacity of the individual and the demands of the task
(Wickens, 1984). Thus, mental load occurs when task demands exceed the capacity of the
person.
The interaction between the user and a computer is mainly visual, by means of the
VDT. While working with a computer, it is essential that only the relevant information be
processed while irrelevant information is either suppressed or ignored while in presence of
potential interference from secondary environmental distractors (Cowan, 2010), such as
flicker, veiling reflections, or glare. It has been hypothesized that certain desirable
outcomes can be increased in likelihood by directing the viewer’s attention to particular
elements in the environment. For example, theatrical lighting designs use spotlights to
direct audience attention to the important characters on stage. Luminance distributions are
the luminous characteristic thought to be most likely to trigger the attention (positive or
negative) response (Veitch, 2001).
Our literature review summarized both laboratory and field studies that established
models of VDT office work by means of multiple regression analysis, with different
predictor and outcome variables. From an office ergonomics perspective, musculoskeletal
risks as an independent variable has received much more attention (i.e Faucett & Rempel,
1994; Dainoff, Cohen & Dainoff, 2005) and more recently, the cognitive variables of work
(Bridger & Brasher, 2011). Office ergonomics must not only provide design guidance to
minimize or eliminate health and safety issues; increasingly, the discipline needs to
embrace the interdependencies of the human body as a dynamic biomechanical system
through models that seek to combine mechanistic, motivational, perceptual and biological
elements of human-at-work systems (Genaidy, Salem, Karwowski, Paez, & Tuncel, 2007).
In order to meet such ambitious demands, a broader, systems view for office ergonomics
must be adopted (e.g., Malone, Savage-Knepshield & Avery, 2007). Coincidently, our
research is framed within this paradigm. Our objective was to sketch a model of
interactions among visual, musculoskeletal, cognitive and ergonomic risks in VDT office
work. We gathered data about those risks in actual workspaces by means of a Post
Occupancy Evaluation (POE) (Federal Facilities Council, 2001). Most of the existing

International Journal on Working Conditions, No.8, December 2014
131
Fie
ld s
tudy o
n v
isua
l a
nd c
ogn
itiv
e s
tressors
in
Vis
ua
l D
ispla
y T
erm
ina
l off
ice w
ork
R
oberto
Germ
án R
odrig
uez e
t al.
research in this topic was performed in central western countries. However, we found a
growing body of literature concerning the effects of the increasing VDT use among office
workers in developing countries (i.e. Shahnavaz, 1987; Rocha & Debert-Ribeiro, 2004;
Eltayeb, Staal, Hassan, Awad & de Bie, 2008; Das & Ghosh, 2010; Ranasinghe et al.,
2011; Rodriguez & Pattini, 2011; Boogar & Mirkouhi, 2013; Loghmani, Golshiri, Zamani,
Kheirmand & Jafari, 2013). Our research gathered data from a Latin American context,
and there lays its novelty.
2. Materials and Method
An observational study (von Elm et al, 2008) was carried out in the administrative
offices of the University of Mendoza. The University of Mendoza is located in the
metropolitan area of Mendoza, Argentina (32° 52' S, 68° 51' W, elevation 801 m) in a mid-
density built area with abundant trees. Its façade faces approximately to the north. The
different academic units (Architecture and Design, Law, Engineering, Medicine, Law) and
their corresponding administrative areas are distributed in different buildings which are
interconnected around an access courtyard.
We assessed the ergonomic exposures by using multiple methods: direct
measurement (via instrumentation), observational (on-site and digital photography), and
self-report methods (questionnaires). Table 1 summarizes the variables and methods used
during the POE: Table 1 - Relevant variables for VDT office work.
Variable Operationalization Method
Visual Discomfort Glare Glare Sensation Vote Evalglare
Cognitive Divided attention Stroop task Mental Workload NASA RTLX
Work System Postural Habits Ergolab Work equipment Environmental Comfort Psychosocial aspects
Photometric Lighting levels Grid Horizontal Illuminance Vertical Illuminance VDT
Luminance Mapping HDRI
The design of this study is a between-persons one. For such studies, samples of
more than 20 people are recommended, as far as they constitute a relatively
homogeneous group in terms of age, training and functions within the organization (SHCP,
1999). All participants in our study worked in non-specialist roles (general administration or
management) and had similar backgrounds.
We carried out the POE in a two-step approach:
1. Walkthrough (October 2012): In this stage we selected our case studies by means of a
specific checklist. The Case Study Checklist helps to obtain physical and morphological
information, data regarding occupancy of the space and to describe the natural and artificial
lighting. This checklist also allows describing the activities performed by the worker, the
workstation equipment and the user postures.
International Journal on Working Conditions, No.8, December 2014
132
Fie
ld s
tudy o
n v
isua
l a
nd c
ogn
itiv
e s
tressors
in
Vis
ua
l D
ispla
y T
erm
ina
l off
ice w
ork
R
oberto
Germ
án R
odrig
uez e
t al.
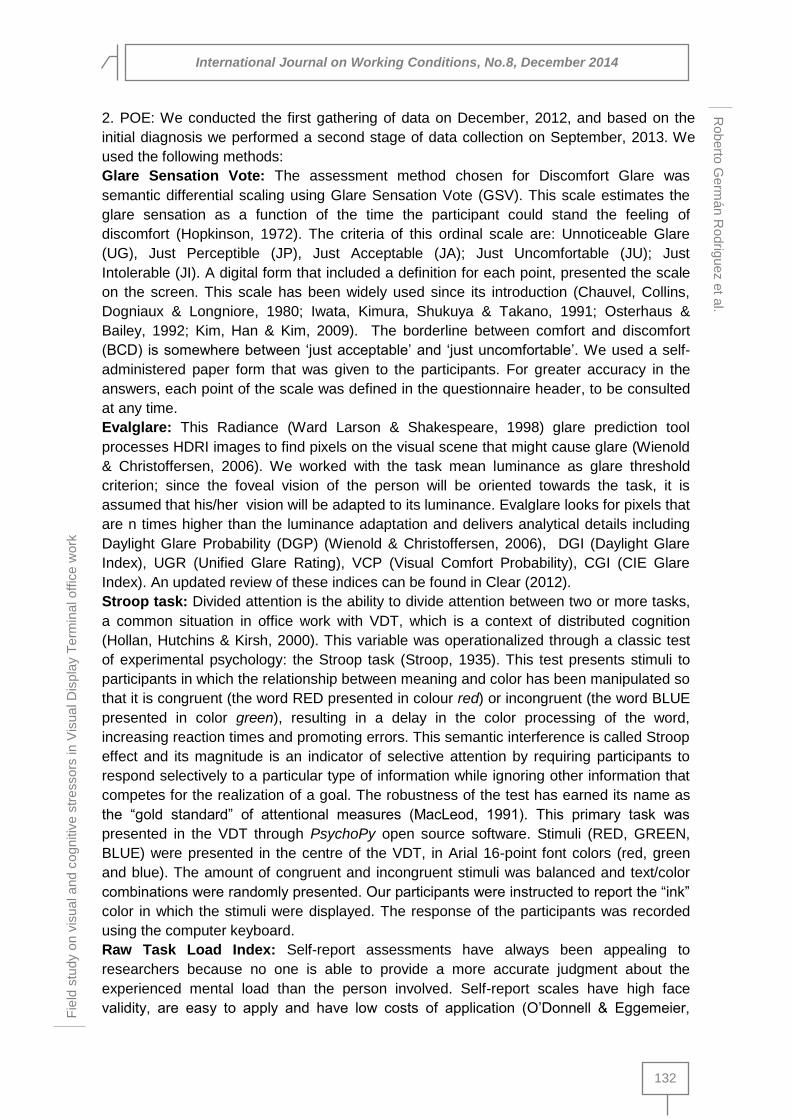
2. POE: We conducted the first gathering of data on December, 2012, and based on the
initial diagnosis we performed a second stage of data collection on September, 2013. We
used the following methods:
Glare Sensation Vote: The assessment method chosen for Discomfort Glare was
semantic differential scaling using Glare Sensation Vote (GSV). This scale estimates the
glare sensation as a function of the time the participant could stand the feeling of
discomfort (Hopkinson, 1972). The criteria of this ordinal scale are: Unnoticeable Glare
(UG), Just Perceptible (JP), Just Acceptable (JA); Just Uncomfortable (JU); Just
Intolerable (JI). A digital form that included a definition for each point, presented the scale
on the screen. This scale has been widely used since its introduction (Chauvel, Collins,
Dogniaux & Longniore, 1980; Iwata, Kimura, Shukuya & Takano, 1991; Osterhaus &
Bailey, 1992; Kim, Han & Kim, 2009). The borderline between comfort and discomfort
(BCD) is somewhere between ‘just acceptable’ and ‘just uncomfortable’. We used a self-
administered paper form that was given to the participants. For greater accuracy in the
answers, each point of the scale was defined in the questionnaire header, to be consulted
at any time.
Evalglare: This Radiance (Ward Larson & Shakespeare, 1998) glare prediction tool
processes HDRI images to find pixels on the visual scene that might cause glare (Wienold
& Christoffersen, 2006). We worked with the task mean luminance as glare threshold
criterion; since the foveal vision of the person will be oriented towards the task, it is
assumed that his/her vision will be adapted to its luminance. Evalglare looks for pixels that
are n times higher than the luminance adaptation and delivers analytical details including
Daylight Glare Probability (DGP) (Wienold & Christoffersen, 2006), DGI (Daylight Glare
Index), UGR (Unified Glare Rating), VCP (Visual Comfort Probability), CGI (CIE Glare
Index). An updated review of these indices can be found in Clear (2012).
Stroop task: Divided attention is the ability to divide attention between two or more tasks,
a common situation in office work with VDT, which is a context of distributed cognition
(Hollan, Hutchins & Kirsh, 2000). This variable was operationalized through a classic test
of experimental psychology: the Stroop task (Stroop, 1935). This test presents stimuli to
participants in which the relationship between meaning and color has been manipulated so
that it is congruent (the word RED presented in colour red) or incongruent (the word BLUE
presented in color green), resulting in a delay in the color processing of the word,
increasing reaction times and promoting errors. This semantic interference is called Stroop
effect and its magnitude is an indicator of selective attention by requiring participants to
respond selectively to a particular type of information while ignoring other information that
competes for the realization of a goal. The robustness of the test has earned its name as
the “gold standard” of attentional measures (MacLeod, 1991). This primary task was
presented in the VDT through PsychoPy open source software. Stimuli (RED, GREEN,
BLUE) were presented in the centre of the VDT, in Arial 16-point font colors (red, green
and blue). The amount of congruent and incongruent stimuli was balanced and text/color
combinations were randomly presented. Our participants were instructed to report the “ink”
color in which the stimuli were displayed. The response of the participants was recorded
using the computer keyboard.
Raw Task Load Index: Self-report assessments have always been appealing to
researchers because no one is able to provide a more accurate judgment about the
experienced mental load than the person involved. Self-report scales have high face
validity, are easy to apply and have low costs of application (O’Donnell & Eggemeier,
a b c

International Journal on Working Conditions, No.8, December 2014
133
Fie
ld s
tudy o
n v
isua
l a
nd c
ogn
itiv
e s
tressors
in
Vis
ua
l D
ispla
y T
erm
ina
l off
ice w
ork
R
oberto
Germ
án R
odrig
uez e
t al.
1986). The NASA task load index (TLX) (Hart & Staveland, 1988) is a multidimensional
scale that uses six dimensions to assess mental workload: mental demand, physical
demand, temporal demand, performance, effort, and frustration. This procedure requires a
weighting procedure to combine the six individual scale ratings into a global score. Byers
and others (1989) proposed a raw task load index (RTLX) that does not require task paired
comparison weights. The RTLX is a simple average of the six TLX scales. Based on the
high correlations between the traditional TXL and the raw TLX (r=0.95) we decided to
derive the overall workload ratings using the simpler and less time consuming RTLX
method.
ErgoLab: We gathered data on the components of the VDT workstations by means of
Ergolab questionnaire (Monteoliva, 2009). This tool allows a self-assessment of many
ergonomic aspects of the VDT work system in four categories of analysis: postural habits
(workstation geometry, postures), environmental comfort (lighting, temperature/ventilation),
furniture, and psychosocial aspects (software usability, work organization). It has an
acceptable reliability of 0.793 Cronbach's alpha.
Illuminance: We measured the vertical illuminance on the centre of the VDT. Also, the
indoor illuminance on the work plane was monitored with a LMT Pocket Lux 2 light meter.
Several measuring points at regular distances formed a grid at 0.80 m from the floor. This
allowed us to calculate the mean illuminance on the work plane and its uniformity:
Emin ≥ Emean /2 Where: (1)
Emin:Minimum Illuminance
Emean :Mean Illuminance
Luminance Mapping: We generated luminance maps from High Dynamic Range Images
(HDRI) (Mann & Picard, 1995; Inanici & Galvin, 2004). A series of Low Dynamic Range
Images (LDRI) were taken with a Nikon Coolpix 5400 camera with a Nikon FC-E9 Fish Eye
lens mounted on a tripod. Each image was taken from approximate position of the
participants’ eyes, pointing to the center of the VDT. The LDRIs were processed with
Photosphere for MAC OS. As every pixel within the HDRI corresponds to photometric
values of luminance, this technique replaces point measurements taken with a luminance
meter. However, we used a Minolta LS100 luminance meter to obtain control luminances
in order to calibrate the scenes.
3. Results and Discussion
As a result of the walkthrough stage, we selected 22 cases in eight different
administrative offices of the University of Mendoza (Table 2).
Table 2 - Summary of the selected cases. Faculty Locals Workstations
Architecture and Design 4 10
Medicine 2 7
Law 1 4
Ingeneering 1 1
Grid illuminance: Table 3 shows mean illuminance values for each local. All of them were
below the 750 lx required by local legislation. Only one workstation at local 6 reached the a
b a

International Journal on Working Conditions, No.8, December 2014
134
Fie
ld s
tudy o
n v
isua
l a
nd c
ogn
itiv
e s
tressors
in
Vis
ua
l D
ispla
y T
erm
ina
l off
ice w
ork
R
oberto
Germ
án R
odrig
uez e
t al.
lighting level required for reading in paper (500 lx). Also, half of the locals had non-uniform
distribution of lighting.
Table 3 - POE. Horizontal Illuminance (Eh) and Vertical Illuminance (Ev) results (lx)
Local Eh
Mean Eh Min
SD Eh
Uniformity P1 P2 P3 P4 P5
1 334.9 350 67.02 Yes Eh 330 Ev 315
- - - -
2 181 84 78.27 No Eh 212 Ev 93
Eh 179 Ev 108
- - -
3 278.5 183 120.90 Yes Eh 225 Ev 285
- - - -
4 268.7 113 118.60 No Eh 113 Ev 21
Eh 143 Ev 53
Eh 128 Ev 56
- -
5 259 158 96.87 No Eh 370 Ev 140
Eh 182 Ev 84
- - -
6 668.4 150 571.76 Yes Eh 240 Ev 160
Eh 530 Ev 250
Eh 1390 Ev 1440
Eh 140 Ev 120
Eh 160 Ev 130
7 187.3 49 120.03 No Eh 335 Ev 268
Eh 242 Ev 242
Eh 210 Ev 173
- -
8 198.2 137 54.41 Yes Eh 153 Ev 74
Eh 254 Ev 124
Eh 243 Ev 82
Eh 112 Ev 21
Eh 284 Ev 124
Table 3 also shows vertical illuminance levels at the centre of the VDT, with only one
workstation reaching the 750 lx required by Argentinean legislation. An early conclusion
could lead to inadequate environmental conditions in relation to lighting levels due to the
poor compliance of current legislation. However, the role of ergonomists should not be
reduced to a mere verifier of legal regulations. An uncomfortable question arises: Are the
specifications given by the local legislation correct? An analysis of the historical
development of the Argentinean legal framework shows how lengthy this process was. The
Law of health and safety at work was created in 1972 and it was regulated in 1979, while
the appearance of the specific protocol for verifying regulatory framework for lighting at
work appeared in 2012 (Rodríguez, Pattini & Villarruel, 2013). Considering the
technological, social and economic changes that affect work characteristics (i.e. in 1972
computers were in their infancy) along with the scientific and technical advances in the
areas of lighting, vision and human factors, there is evidence of a divergence between
present legal requirements in Argentina and the current needs of lighting in office
environments, in terms of productivity health and safety.
Furthermore, there is no agreement among countries on lighting levels for specific
tasks, varying in time and influenced by the technological, political and economic context
(Mills & Borg, 1999). For example, while in Spain the minimum value for VDT work should
be 750 lx, in the United States values should reach 300 lx, while in Australia 350 lx is
required. The European Community is trying to unify that value on 500 lx. Our empirical
evidence indicates that the lighting levels measured in this study are the usually ones
found in this region, and the 750 lx required by law is perceived by the occupants as too
bright. It is necessary to review the criteria for defining the adequate lighting levels in
workspaces, although some claim it is impossible (Boyce, 1996). Instead, a new approach
was proposed, one that widens attention to the appearance of the space rather than
fixating on the lighting of a horizontal working plane (Boyce, 2013). In recent years the

International Journal on Working Conditions, No.8, December 2014
135
Fie
ld s
tudy o
n v
isua
l a
nd c
ogn
itiv
e s
tressors
in
Vis
ua
l D
ispla
y T
erm
ina
l off
ice w
ork
R
oberto
Germ
án R
odrig
uez e
t al.
prime advocate for this approach has been Cuttle (2010) who argues that, over the last 30
years many visually difficult tasks, e.g. reading a fifth carbon copy, have disappeared and,
where they do occur, technology often provides a better way of either doing the task or
making it more visible than simply increasing the illuminance. Further, more and more
information is being viewed on self-luminous devices such as smart phones and computer
screens which higher illuminances make more difficult to see. Cuttle (2013) has already
suggested metrics and a design procedure for first lighting the space and then any
significant objects in it. Interestingly, this procedure can still lead to an installation
producing uniform illumination of a horizontal working plane but now it will be the result of
a considered opinion rather than unthinking obedience to a schedule of illuminance
recommendations (Boyce, 2013).
Work System: Ergolab results (Table 4) show a lower percentage of compliance for the
environmental factors, followed by the characteristics of the furniture characteristics and by
the computer equipment. The best scores were achieved in the psychosocial aspects.
Table 4 - ERGOlab scores
N % Min % Max Mean SD
Postural Habits 21 42 89 61.53 10.81
Workstation Design 21 41 76 60.53 8.87
Environmental Comfort 21 6 67 41.84 14.47
Psychosocial Aspects 21 38 88 66.26 12.33
Postural habits: Furniture is the main component that positions the worker while using a
computer, followed by the characteristics of the computer itself. Computer work is
essentially static and it is usually performed in a sitting posture. Indeed, Goossens,
Snijders, Roelofs & van Buchem (2003), stated that more people sit all day in an office
now than ever before.). Whilst there have been gradual changes in seat design over recent
years (Pynt, 2014), the increasing numbers of people exposed to longer periods of
sedentary work have shown that the current concept of a work seat is inadequate to
reduce the physical consequences of these long periods (Corlett, 2008). Staffel (1884)
defined the rules of the modern work chair: a horizontal seat with vertical support where
the person is sitting with body and legs at right angles. Ergonomic requirements for office
seats still use this approach, despite it imposes unwanted biomechanical demands on
people. A review of a catalogue book (Friel & Friel, 2005) shows that every one of the
large number of chairs presented as for office use had a substantially horizontal seat.
Moreover, during our study we found 66.6% of people with their legs in an angle consistent
with Staffel posture. A photographic monitoring of our participants´ postures (figure 1)
complemented the analytical information obtained by means of Ergolab.

International Journal on Working Conditions, No.8, December 2014
136
Fie
ld s
tudy o
n v
isua
l a
nd c
ogn
itiv
e s
tressors
in
Vis
ua
l D
ispla
y T
erm
ina
l off
ice w
ork
R
oberto
Germ
án R
odrig
uez e
t al.
Figure 1- Photographic monitoring of sitting postures
Radiological studies show that the transition from a standing position to a
conventional Staffel posture involves a hip flexion of 60° and a flexion of the lumbar spine
of 30°, to achieve the 90° angle between the trunk and legs (Keegan, 1953). This effect
has been noted in several studies since then (see the survey by Bridger & Bendix (2004)).
Studies of pressures (Andersson et al., 1975) evaluated the inter-discs load in different
seated positions, showing that the charge on L3-L4 disc represented 140% of body weight
in Staffel position. Mandal (1981) proposed a bent forward position of legs that keep the
spine´s physiological curvatures, reducing the intra-discal pressure in the lumbar area. It
requires a specially designed seat and a table to work in this position. Medical research
currently supports the case that a neutral posture maintaining some degree of lumbar
lordosis in sitting, as well as movement while in the seated position, is less damaging to
spinal postural health than sustained kyphosed postures (Pynt, 2014). However, it should
be noted that there is not an optimal posture for all situations of VDT work. Even a
biomechanically correct posture (the one that maintains the natural curves of the spine and
allows mobility to the body without disturbing the respiratory or circulatory systems nor
producing discomfort): no position is good if maintained over time.
Time is yet another factor to consider: at a computer terminal where long periods of
sitting are required, in a relatively static position, recovery from pain becomes more than
proportionally longer as the exposure time increases. Changing the organization of work to
reduce the time spent in a sitting position without disrupting the work process is an
attractive proposition. Reducing monotonous positions (e.g., sitting or standing) can curtail
static muscle work and its narrow and negative impact on the musculoskeletal system
(Alkhajah et al., 2012). Although this section discusses the contribution of the seat to
working health, it is only a part of the ergonomics of sitting at work. The desk, work
activities and organisation, as well as the environment are all part of the equation. But
these can be adjusted. What cannot be altered, once bought, is the seat. Hence it can be a
dangerous component of the workplace if it is not selected with knowledge and care.
Workstation Design: The characteristics of the workstation allowed us to understand the
results obtained in postural habits. Almost all of the seats we monitored had the basic
regulations to adapt to a wide user anthropometry: the position of the backrest (angular
and longitudinal), and the seat height. A percentage of 90.5% of the seats had a star-type
base with five points of support, but only a small fraction of them (9.5%) had armrests. We

International Journal on Working Conditions, No.8, December 2014
137
Fie
ld s
tudy o
n v
isua
l a
nd c
ogn
itiv
e s
tressors
in
Vis
ua
l D
ispla
y T
erm
ina
l off
ice w
ork
R
oberto
Germ
án R
odrig
uez e
t al.
detected few accessories: there were 4.8% of workstations with wrist-rests and the same
percentage of foot-rests. We found no document-stands during this POE, despite that two
information sources coexist in VDT work: the computer screen and paper. Eye movements
between VDT, keyboard and manuscript can occur up to 30,000 times per day (Osterhaus,
2005).
We found that the computer equipment was adequate: The VDT allowed regulations
in tilt and rotation (81.0% of cases) and most of them were LED/LCD, which are essentially
flicker-free. We found no disturbing reflections on the computer screen on 71.4% of cases.
Most of keyboards (over 90%) met basic ergonomic guidelines and 66.7% of workers felt
that the mouse size was suited to their hands.
Environmental factors: Approximately half of our participants (52.6%) considered the
lighting in the workplace as adequate. The mean horizontal illuminance in their
workstations was 429 lx. This value is below the 750 lx prescribed by our regulations (Act
19587 regulated by ordinance 351/79, Appendix IV). The horizontal illuminance on the
workplace of those who considered the lighting levels as inadequate was 264 lx. We
performed a t-test for independent samples to verify the statistical significance of this
difference, which was not confirmed (df=13, T=1.163, p=0.266). We detected a lack of
control of the lighting environment by workers, for both natural (87.9%) and artificial
lighting (63.2%). To be able to control the physical and environmental variables is an
important predictor of environmental satisfaction for office workers (Becker, 1986; Leaman
& Bordass, 2001; Veitch, Charles, & Newsham, 2004). However, to have control of lighting
is not always ranked as the highest priority. The importance given to the control of an
environmental variable is related to the degree of dissatisfaction with that variable: the
greater dissatisfaction, an increased need for control. It is widely accepted that that lighting
and other aspects of the physical environment in general influence work outcomes through
the mediation of work attitudes and other psychosocial factors (Newsham et al., 2009).
However, office ergonomists must also communicate with workers about the possible
benefits of ambient and task lighting and how they might best adjust these for their
changing needs (e.g., Akashi & Neches, 2005).
The design of lighting has also experienced a shift from direct guidelines to the
importance of the larger context for understanding user-centred design. Research and
practice in office lighting have thus changed focus somewhat from an emphasis on
prescriptive, static design recommendations to an appreciation for the entire user and
organizational context(s) for which lighting is needed.
Air quality was affected by inadequate ventilation as referred by 63.2% of our
participants. In relation to noise, this factor did not appear to be critical to most of the
participants (57.9%). Finally, 57.9% of respondents felt that the temperature in summer
was not pleasant. The temperature and humidity were registered by means of a LMT 8000
environmental measurement instrument. The average temperature recorded was 28.2°C
(SD=1.411) with an average humidity of 36.4% (SD=3.207). The percentage of people
dissatisfied with the thermal environment was consistent with the theoretical predictions,
considering the thermo-hygrometric conditions, the metabolic equivalent of the task (1.2
met) and the insulation level (0.6 clo) registered.

International Journal on Working Conditions, No.8, December 2014
138
Fie
ld s
tudy o
n v
isua
l a
nd c
ogn
itiv
e s
tressors
in
Vis
ua
l D
ispla
y T
erm
ina
l off
ice w
ork
R
oberto
Germ
án R
odrig
uez e
t al.
Psychosocial Aspects: On the one hand, we evaluated the software usability (Shackel,
1991), which was rated very positively: 90.5% of our participants considered the software
interface design as appropriate. Moreover, all of our respondents felt that the computer
helped them in their daily activities and that the computers were easy to use. In addition,
90.5% of our sample indicated that the computer programs used by them provide some
kind of help and allow them to recover from errors.
On the other hand, we asked about aspects related to work organization and training
activities for workers. We found that 76.2% of workers admitted to suffer peaks of mental,
visual or postural workload. To overcome such workload, 85.7% of our participants usually
take breaks, with freedom to decide when to take them in 81.0% of cases. Some of them
(42.9%) make those pauses active and exercise and stretch during their breaks. We found
gaps in awareness of office ergonomics (66.6% of our participants) and 61.9% of our
participants who had no specific training in work safety and health standards. The value of
basic ergonomics information within applied settings often depends on the effectiveness of
such training/orientation programs (Levitt & Hedge, 2006).
Discomfort Glare: We gathered GSV and DGP data from 10 workstations. The most
frequent response of GSV (Graphic 1, left) was “not perceptible”, in 40% of the cases.
Considering that the borderline between comfort and discomfort is somewhere between
“just acceptable” and “just disturbing”, only 10% of the participants who participated in this
subjective glare assessment felt some level of discomfort caused by a lighting source in
their visual field. Based on these results, discomfort glare seems to have a little impact as
an environmental stressor in the workstations included in this study.
Graphic 1 - Left: Glare Sensation Vote results. Right: Evalglare DGP results
We complemented glare subjective analysis with objective predictions by means of
HDR images and Evalglare software (graphic 1, right). The output of this Radiance-based
tool is a set of discomfort glare indices, among them the recently developed DGP. Based
on the proposed DGP–GSV correlation (Wienold & Christoffersen, 2006), DGP qualifies a
glare source as disturbing when the calculated scores for the scene are above 0.4. The
red line marks DGP glare threshold. We analyzed 12 workstations and found that 4 of
International Journal on Working Conditions, No.8, December 2014
139
Fie
ld s
tudy o
n v
isua
l a
nd c
ogn
itiv
e s
tressors
in
Vis
ua
l D
ispla
y T
erm
ina
l off
ice w
ork
R
oberto
Germ
án R
odrig
uez e
t al.
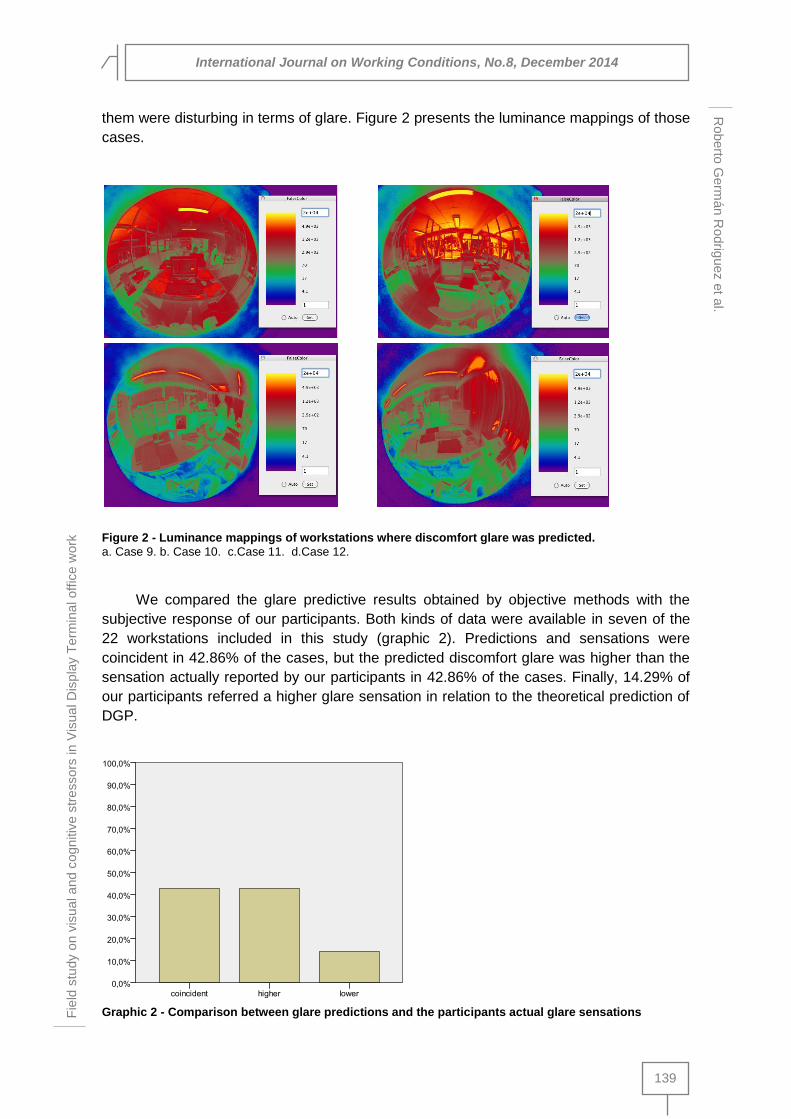
them were disturbing in terms of glare. Figure 2 presents the luminance mappings of those
cases.
Figure 2 - Luminance mappings of workstations where discomfort glare was predicted.
a. Case 9. b. Case 10. c.Case 11. d.Case 12.
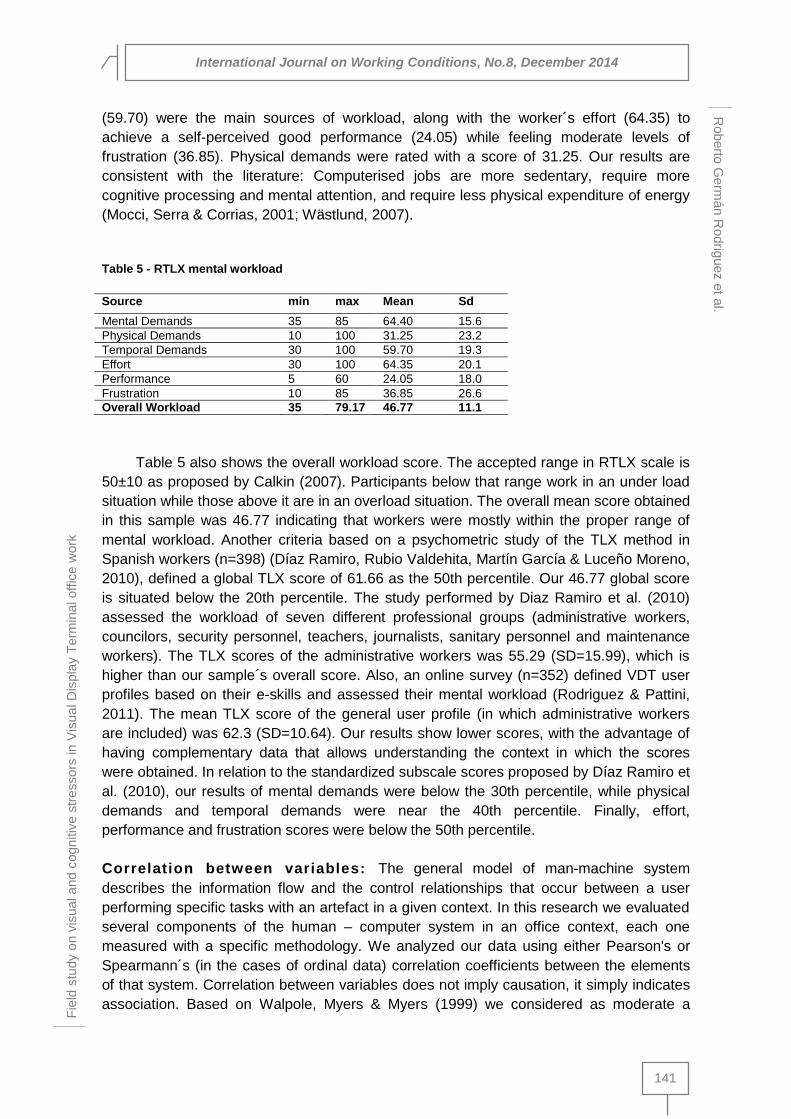
We compared the glare predictive results obtained by objective methods with the
subjective response of our participants. Both kinds of data were available in seven of the
22 workstations included in this study (graphic 2). Predictions and sensations were
coincident in 42.86% of the cases, but the predicted discomfort glare was higher than the
sensation actually reported by our participants in 42.86% of the cases. Finally, 14.29% of
our participants referred a higher glare sensation in relation to the theoretical prediction of
DGP.
Graphic 2 - Comparison between glare predictions and the participants actual glare sensations
International Journal on Working Conditions, No.8, December 2014
140
Fie
ld s
tudy o
n v
isua
l a
nd c
ogn
itiv
e s
tressors
in
Vis
ua
l D
ispla
y T
erm
ina
l off
ice w
ork
R
oberto
Germ
án R
odrig
uez e
t al.
We calculated two statistical measures of the performance of DGP: Sensitivity and
Specificity. Sensitivity (also called the true positive rate), measures the proportion of actual
positives which are correctly identified as such (i.e. the percentage participants disturbed
by glare who are correctly identified as having the condition, defined by their actual glare
sensation). Specificity (or true negative rate) measures the proportion of negatives which
are correctly identified as such. A perfect predictor would be described as 100% sensitive
and 100% specific. Our results showed that DGP sensitivity was 50% and its specificity
was 60%, indicating that in the context of this study, DGP had a moderate sensitivity and
performed better when ruling out discomfort glare.
This mismatch between actual sensations and predictions is consistent with previous
studies (Iwata et al., 1991; Rodriguez & Pattini, 2012) and highlights the need to consider
other factors than the existing ones in current discomfort glare models, for instance the
visual content of windows, cultural aspects, or habituation to the luminous climate (Kittler,
Miroslav & Darula, 2012), in order to achieve a systemic approach to the problem of
discomfort glare.
Divided attention: Our Stroop task results are consistent with previous studies (MacLeod,
1991; van Maanen, van Rijn & Borst, 2009), showing longer reaction times when stimuli
were incongruent (mean=1.006, SD=0.304), in relation to congruent stimuli (mean=0.939,
DS=0.322). There is empirical evidence from two studies that lighting can influence
attention (Hopkinson & Longmore, 1959; LaGiusa & Perney, 1973), so we explored the
relationship between discomfort glare and divided attention. Raynham, Osterhaus &
Davies (2007) proposed a study in which observers were presented with a relatively easy
task in terms of size and contrast, carried out in a ‘neutral environment’ and then in the
presence of discomfort glare. They proposed the change in the time taken to perform the
task as a metric in assessing the significance of the glare stimulus as an attentional
distractor. Comparing the magnitude of the Stroop effect between workers who reported
discomfort glare (n=4, mean=0.975, SD=0.337) and those who did not reported discomfort
glare (n=18, mean=0.972, SD=0.312), we found a slightly higher semantic interference in
the former group. This increased interference, would be indicative of greater demands of
divided attention. In order to verify the statistical significance of this result we performed a
T-test for independent samples, that could not confirm the existence of statistically
significant differences in reaction times between glare disturbed participants and not glare
disturbed ones (t=-0.017, df=20, p=0.987). Regarding Stroop task error rates, we found no
statistically significant differences between groups, both presenting a 2% error rate. In this
study we found a visual environment that produced moderate levels of glare, which were
overestimated by glare prediction equations. It is possible that in presence of higher visual
discomfort, differences in reaction times between glare disturbed and not glare disturbed
people would be statistically significant.
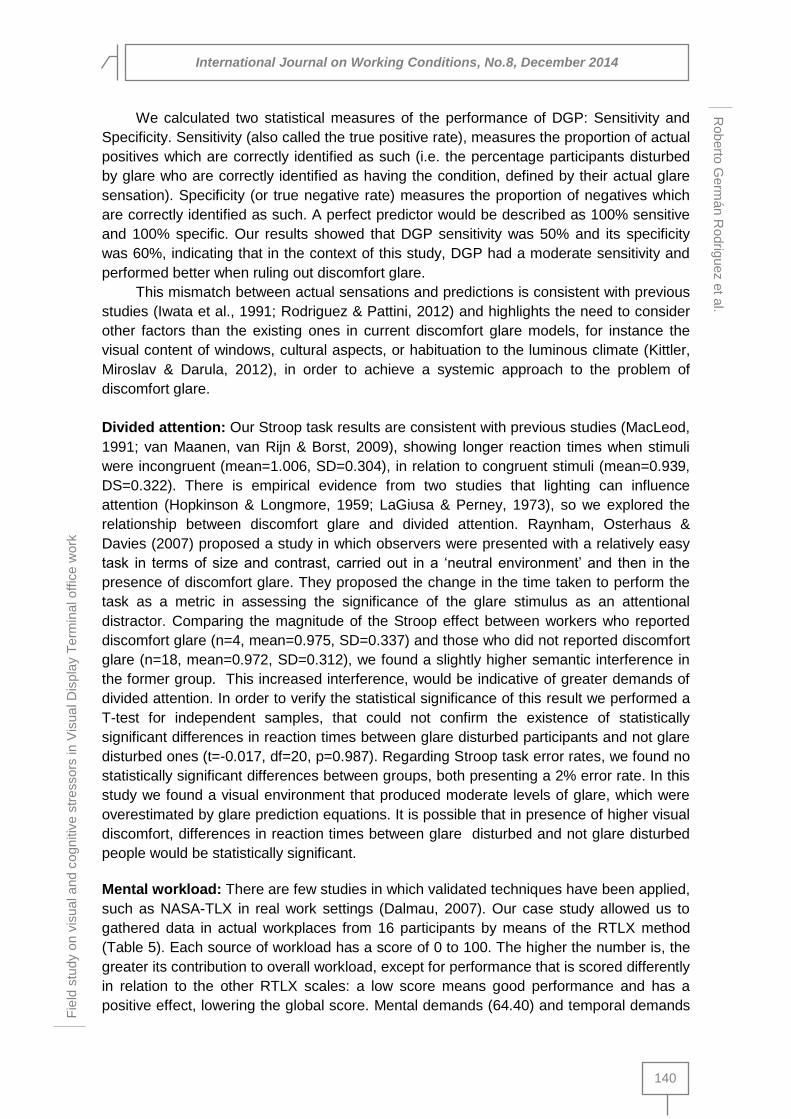
Mental workload: There are few studies in which validated techniques have been applied,
such as NASA-TLX in real work settings (Dalmau, 2007). Our case study allowed us to
gathered data in actual workplaces from 16 participants by means of the RTLX method
(Table 5). Each source of workload has a score of 0 to 100. The higher the number is, the
greater its contribution to overall workload, except for performance that is scored differently
in relation to the other RTLX scales: a low score means good performance and has a
positive effect, lowering the global score. Mental demands (64.40) and temporal demands
International Journal on Working Conditions, No.8, December 2014
141
Fie
ld s
tudy o
n v
isua
l a
nd c
ogn
itiv
e s
tressors
in
Vis
ua
l D
ispla
y T
erm
ina
l off
ice w
ork
R
oberto
Germ
án R
odrig
uez e
t al.
(59.70) were the main sources of workload, along with the worker´s effort (64.35) to
achieve a self-perceived good performance (24.05) while feeling moderate levels of
frustration (36.85). Physical demands were rated with a score of 31.25. Our results are
consistent with the literature: Computerised jobs are more sedentary, require more
cognitive processing and mental attention, and require less physical expenditure of energy
(Mocci, Serra & Corrias, 2001; Wästlund, 2007).
Table 5 - RTLX mental workload
Source min max Mean Sd
Mental Demands 35 85 64.40 15.6
Physical Demands 10 100 31.25 23.2
Temporal Demands 30 100 59.70 19.3
Effort 30 100 64.35 20.1
Performance 5 60 24.05 18.0
Frustration 10 85 36.85 26.6
Overall Workload 35 79.17 46.77 11.1
Table 5 also shows the overall workload score. The accepted range in RTLX scale is
50±10 as proposed by Calkin (2007). Participants below that range work in an under load
situation while those above it are in an overload situation. The overall mean score obtained
in this sample was 46.77 indicating that workers were mostly within the proper range of
mental workload. Another criteria based on a psychometric study of the TLX method in
Spanish workers (n=398) (Díaz Ramiro, Rubio Valdehita, Martín García & Luceño Moreno,
2010), defined a global TLX score of 61.66 as the 50th percentile. Our 46.77 global score
is situated below the 20th percentile. The study performed by Diaz Ramiro et al. (2010)
assessed the workload of seven different professional groups (administrative workers,
councilors, security personnel, teachers, journalists, sanitary personnel and maintenance
workers). The TLX scores of the administrative workers was 55.29 (SD=15.99), which is
higher than our sample´s overall score. Also, an online survey (n=352) defined VDT user
profiles based on their e-skills and assessed their mental workload (Rodriguez & Pattini,
2011). The mean TLX score of the general user profile (in which administrative workers
are included) was 62.3 (SD=10.64). Our results show lower scores, with the advantage of
having complementary data that allows understanding the context in which the scores
were obtained. In relation to the standardized subscale scores proposed by Díaz Ramiro et
al. (2010), our results of mental demands were below the 30th percentile, while physical
demands and temporal demands were near the 40th percentile. Finally, effort,
performance and frustration scores were below the 50th percentile.
Correlation between variables: The general model of man-machine system
describes the information flow and the control relationships that occur between a user
performing specific tasks with an artefact in a given context. In this research we evaluated
several components of the human – computer system in an office context, each one
measured with a specific methodology. We analyzed our data using either Pearson's or
Spearmann´s (in the cases of ordinal data) correlation coefficients between the elements
of that system. Correlation between variables does not imply causation, it simply indicates
association. Based on Walpole, Myers & Myers (1999) we considered as moderate a

International Journal on Working Conditions, No.8, December 2014
142
Fie
ld s
tudy o
n v
isua
l a
nd c
ogn
itiv
e s
tressors
in
Vis
ua
l D
ispla
y T
erm
ina
l off
ice w
ork
R
oberto
Germ
án R
odrig
uez e
t al.
correlation higher than 0.4 and as high correlation coefficients above 0.7. Table 6 shows
the statistically significant correlations.
Table 6 - Paired correlation coefficients between VDT work variables
Variable 1 Variable 2 Correlation p-value
Divided Attention VDT Illuminance 0.396 0.025
VDT Illuminance Horizontal Illuminance 0.410 0.020
Performance Mental Demands -0.614 0.011
Performance Temporal Demands -0.533 0.033
Performance Effort -0.611 0.012
Effort Temporal Demands 0.498 0.05
Effort Physical Demands 0.788 <0.01
Temporal Demands Physical Demands 0.505 0.046
Physical Demands Discomfort Glare 0.781 0.038
Workstation Design Environmental Comfort 0.490 0.024
We found a statistically significant low to moderate correlation between Stroop effect
and the vertical illuminance measured at the centre of the screen: higher VDT illuminance
was associated to higher Stroop interference. This performance variation points to a
distracting effect of the illuminance levels of the screen. However, we have no evidence
that attention was the mechanism involved in the observed decrease of performance.
Previous research has addressed the possible effect of the lighting environment on
attention. Hopkinson & Longmore (1959) observed a tendency to turn towards the light,
which the defined as human phototropism. They reported that attention on a vertical visual
task was best when the task was locally lit, than when it was lit from general illumination
alone. According to Veitch (2001), this early study missed important details about the
methods and data, and lacked appropriate statistical tests. One extension of the attention
hypothesis is the notion that task lighting can focus attention on desk work, thereby
improving task performance. This hypothesis has been tested for paper-based clerical
work (e.g. McKennan & Parry, 1984; Slater, Perry & Carter, 1993). Our results provided
data for VDT clerical work.
We found several correlations between RTLX subscales: Performance showed a
negative correlation with mental demands, temporal demands and effort. This is consistent
with a strain – stress model of human performance that equate workload with the
magnitude of the demands imposed on the operator, physical, mental, and emotional
responses to those demands or the operator’s ability to meet those demands. Effort
showed a positive correlation with physical demands and temporal demands while
temporal demands also showed a positive correlation with physical demands. These
correlations between RTLX subscales is usually found in the literature and, according to
Hart (2006), it simply illustrates the fact they are all measuring some aspect of the same
underlying entity. It is assumed that the NASA Task Load Index (NASA-TLX) consists of
six subscales that represent somewhat independent clusters of variables and that some
combination of these dimensions are likely to represent the “workload” experienced by
most people performing most tasks. However, a psychometric analysis of NASA-Task
Load revealed a factorial structure formed by two components (Díaz Ramiro et al., 2010).
The first of the two components was formed by all of the NASA-TLX dimensions except
International Journal on Working Conditions, No.8, December 2014
143
Fie
ld s
tudy o
n v
isua
l a
nd c
ogn
itiv
e s
tressors
in
Vis
ua
l D
ispla
y T
erm
ina
l off
ice w
ork
R
oberto
Germ
án R
odrig
uez e
t al.
frustration. The second was formed only by frustration dimension. Coincidentally, we found
no statistically significant correlations between frustration and the other workload
dimensions.
Discomfort glare (GSV) showed a high correlation with physical demands measured
by means of RTLX. This visual variable did not show significant correlations with any of the
measured photometric variables included in this study (horizontal desk illuminance and
VDT illuminance). Luminance, which we measured by means of HDRI technique, is the
main photometric variable affecting discomfort glare. We calculated DGP from the
luminance maps and found no correlation between DGP (that includes our luminance
readings) and GSV. The differences we observed between the predicted discomfort glare
outcomes and the actual sensations of our participants caused this lack of correlation.
Mocci et al. (2001) studied the contribution of several variables to visual symptoms
(asthenopia) reported by users of VDT workstations and obtained a similar result. They
found that lighting conditions were not correlated with eye discomfort, but that asthenopia
was significantly and positively correlated with the presence of discomfort relative to noise
and smoke instead. However, the same study showed that physical workload was the only
factor not significantly correlated with asthenopia, which was a result not expected by the
authors. Eye discomfort is a concept broader than discomfort glare, but our literature
research was unable to find studies concerning the relationship between the physical
component of work and discomfort glare.
Workstation design (desk, chair, and computer characteristics and their layout) had a
statistically significant moderate correlation with the environmental comfort (lighting, noise,
thermal environment, air quality). It is generally accepted that workstation design, as well
as the environmental factors are related to musculoskeletal, visual and general physical
symptoms (Lu & Aghazadeh, 1996; Brand, 2008) in a direct or an indirect way (Isen &
Baron, 1991).
The statistically significant correlations we found are based on a limited
observational study with a small sample. This initial model based on correlations will allow
the selection of the best variables to include in further multiple regression analysis with a
larger sample, model the relative contribution of these factors to the visual,
musculoskeletal and cognitive symptoms reported by the users of office workers in the
context of a developing country.
4. Conclusions
Office VDT work is a paradigmatic case of a work system in which the adoption of a
new technology introduces new associated risks of different nature: visual,
musculoskeletal and cognitive. The constant evolution of VDT work mainly caused by the
introduction of new technology in terms of hardware and user interfaces, as well as new
communication paradigms makes this research topic always timely. Most of the existing
research in VDT office work has been conducted in central countries. Our research, which
gathered data from a Latin American country, is part of a growing body of literature
concerning the effects of the increasing VDT use among office workers in developing
countries.
In this context, we carried out a POE at the administrative offices of the University of
Mendoza (Argentina), performing a diagnosis of visual, cognitive and postural risks
International Journal on Working Conditions, No.8, December 2014
144
Fie
ld s
tudy o
n v
isua
l a
nd c
ogn
itiv
e s
tressors
in
Vis
ua
l D
ispla
y T
erm
ina
l off
ice w
ork
R
oberto
Germ
án R
odrig
uez e
t al.
associated with VDT office work. We framed our research in a broad, systemic view for
office ergonomics to embrace the interdependencies of the human body as a dynamic
biomechanical system through models that seek to combine mechanistic, motivational,
perceptual and biological elements of human-at-work systems.
Observational studies provide valuable information from the worker´s perspective
allowing the researcher to detect the type and magnitude of detrimental demands and
efforts. However, observational studies have a lack of control of variables by the
researcher, and each study of this kind tends to be unique, making it difficult to reproduce
the results that therefore lack of generalizability. The value of exploratory studies such as
the present one is that they make it possible to describe the behaviour of the variables of
interest in context, a very difficult situation to achieve in laboratory studies, thus ensuring
that ergonomics research and recommendations will reflect the evolving, organic realities
that influence people within contemporary organizations.
Our study shifted in focus from merely promoting safety to demonstrating value to the
entire organization for human factors/ergonomics designs and interventions. Certainly
health and safety will never diminish in importance, but they have begun to be integrated
into a larger systems perspective. This change comes from an increased interest in using
ergonomics design principles to improve the quality of work life in addition to employee
productivity.
Acknoledgments
The researchers thank to Andino, Marcos; Moreno, Lucía; Fioquetta, Emilia for their
collaboration in the data gathering during this research.
References
Aarås, A., Horgen, G., Bjorset, H.H., Ro, O. & Thoresen, M. (1998) Musculoskeletal, visual and psychosocial stress in VDU operators before and after multidisciplinary ergonomic interventions. Applied Ergonomics, 29(5): 335-54.
Aarås, A., Horgen, G., Ro, O. (2000) Work with the visual display unit: Health consequences. International Journal of Human–Computer Interaction, 12: 107–134.
Akashi, Y. & Neches, J. (2005) Potential recommendations for illuminance reductions by load-shedding. Lighting Research and Technology, 37(2): 133–153.
Alkhajah, T.A., Reeves, M.M., Eakin, E.G., Winkler, E.A., Owen, N. & Healy, G.N. (2012) Sit–Stand workstations: a pilot intervention to reduce office sitting time. American journal of preventive medicine, 43(3): 298-303.
Andersson, B.J., Ortengren, R., Nachemson, A.L., Elfström, G. & Broman, H. (1975) The sitting posture: an electromyographic and discometric study. Orthopedic Clinics of North America, 6(1): 105-20.
Becker, F.D. (1986) Quality of work environment: Effects on office workers. Prevention in Human Services, 4(1–2): 35–57.
Bergquist, U.O., Knave, B.G., Voss, M., Wibom, R. (1992) A longitudinal study of VDT work and health. International Journal of Human–Computer Interaction, 4: 197–219.
Blehm, C., Vishnu, S., Khattak, A., Mitra, S. & Yee, R.W. (2005) Computer Vision Syndrome: A Review. Survey of Ophthalmology, 50: 253-262.
Boogar, I.R. & Mirkouhi, M.G. (2013) Psychosocial and Occupational Risk Factors of Musculoskeletal Pains among Computer Users: Retrospective Cross-Sectional Study in Iran. International Journal of Occupational Hygiene, 5(2): 46-52.
International Journal on Working Conditions, No.8, December 2014
145
Fie
ld s
tudy o
n v
isua
l a
nd c
ogn
itiv
e s
tressors
in
Vis
ua
l D
ispla
y T
erm
ina
l off
ice w
ork
R
oberto
Germ
án R
odrig
uez e
t al.
Boyce, P. (1996) Illuminance selection based on visual performance - and other fairy stories. Journal of the Illuminating Engineering Society, 25(2): 41-49.
Boyce, P. (2013) Lighting Quality For All. CIBSE & SLL International Lighting.
Brand, J.L. (2008). Office ergonomics: Pertinent research and recent developments (245-282). In: C.M. Carswell (Ed.), Reviews of human factors and ergonomics, Vol. 4. Santa Monica: Human Factors and Ergonomics Society.
Bridger, R.S. & Bendix, T. (2004) Pelvis and neighbouring segments. In: Delleman, Nico J., Haslegrave, Christine M., Chaffin, Don (Eds.), Working Postures and Movements. CRC Press, Boca Raton, pp. 168–184, Chapter 7.3.
Bridger, R.S. & Brasher, K. (2011) Cognitive task demands, self-control demands and the mental well-being of office workers. Ergonomics, 54(9): 830-839.
Byers, J., Bittner, A. & Hill, S. (1989) Traditional and raw task load index (TLX) correlations: are paired comparisons necessary?. Advances in industrial ergonomics and safety, 1: 481-485.
Cain, B. (2007). A Review of the Mental Workload Literature. Toronto: Defence Research and Development Canada.
Calkin, B. (2007) Parameters affecting mental workload and the number of simulated ucavs that can be effectively supervised. Department of Psychology. Ohio, Wright State University. Master: 114.
Chauvel, P., Collins, J.B., Dogniaux, R. & Longniore, J. (1980) Glare from windows: current views of the problem. In Symposium on Daylight, Berlin, Germany.
CIE (1987). Vocabulaire international de l’éclairage. CEI Publication Geneve, Suisse, CIE 50 (845): 379.
Clear, R. (2012) Discomfort glare: What do we actually know? Lighting Research & Technology, 0, 1-18.
Corlett, E.N. (2008) Sitting as a hazard. Safety Science, 46(5): 815-821.
Cowan, N. (2010) The magical mystery four: How is Working Memory capacity limited, and why? Current Directions in Psychological Science, 19(1): 51-57.
Cuttle, C. (2010). Towards the third stage of the lighting profession. Lighting Research and Technology, 42: 73-93.
Cuttle, C. (2013). A new direction for general lighting practice. Lighting Research and Technology, 45(1): 22-39.
Dainoff, M.J., Aarås, A., Horgen, G., Konarska, M., Larsen, S., Thoresen, M. & Cohen, B.G. (2005) The effect of an ergonomic intervention on musculoskeletal, psychosocial and visual strain of VDT entry work: organization and methodology of the international study. International Journal of Occupational Safe and Ergonomics, 11(1): 9-23.
Dalmau, I. (2007). Evaluación de la carga mental en tareas de control: técnicas subjetivas y medidas de exigencia. PhD Thesis. Barcelona: UPC.
Das, B. & Ghosh, T. (2010) Assessment of ergonomical and occupational health related problems among VDT workers of West Bengal, India. Asian Journal of Medical Sciences, 1: 26-31.
Del Río Martínez, J.H. & González Videgaray, M.C. (2007) Trabajo prolongado con computadoras: consecuencias sobre la vista y la fatiga cervical. Actas IX Congreso Internacional de Ergonomía México, D.F.
Díaz Ramiro, E., Rubio Valdehita, S., Martín García, J. & Luceño Moreno, L. (2010) Estudio Psicométrico del Índice de Carga Mental NASA-TLX con una Muestra de Trabajadores Españoles. Revista de psicología del trabajo y las organizaciones, 26(3): 191-199.
Eltayeb, S.M., Staal, J.B., Hassan, A.A., Awad, S.S. & de Bie, R.A. (2008) Complaints of the arm, neck and shoulder among computer office workers in Sudan: a prevalence study with validation of an Arabic risk factors questionnaire. Environmental Health, 7:33.
Faucett, J., & Rempel, D. (1994) VDT‐related musculoskeletal symptoms: Interactions between work posture and psychosocial work factors. American journal of industrial medicine, 26(5): 597-612.
Friel, C. & Friel, P. (2005) 1000 Chairs. Taschen, D-50672, Köln.
Federal Facilities Council (2001) Learning from our buildings. Technical report no. 145. Washington, D.C.: National Academy Press.

International Journal on Working Conditions, No.8, December 2014
146
Fie
ld s
tudy o
n v
isua
l a
nd c
ogn
itiv
e s
tressors
in
Vis
ua
l D
ispla
y T
erm
ina
l off
ice w
ork
R
oberto
Germ
án R
odrig
uez e
t al.
Genaidy, A., Salem, S., Karwowski, W., Paez, O., & Tuncel, A. (2007) The work compatibility improvement framework: An integrated perspective of the human-at-work system. Ergonomics, 50: 3–25.
Goossens, R.H.M., Snijders, C.J., Roelofs, G.Y. & van Buchem, F. (2003). Free shoulder space requirements in the design of high backrests. Ergonomics, 46: 518–530.
Hart, S. & Staveland, L. (1988) Development of NASA-TLX (Task Load Index): results of empirical and theoretical research. Human Mental Workload. P. A. Hancock and N. Meshkati. Amsterdam: North-Holland: 139-183.
Hart, S.G. (2006) NASA-task load index (NASA-TLX); 20 years later. In Proceedings of the Human Factors and Ergonomics Society Annual Meeting, 50(9): 904-908.
Hashizume, A., Kurosu, M. & Kaneko, T. (2007) Multi-window System and the Working Memory. In Springer Berlin / Heidelberg (Ed.) Engineering Psychology and Cognitive Ergonomics (pp. 297–3056). Berlin.
Helland, M., Horgen, G., Kvikstad, T.M., Garthus, T., Richard Bruenech, J. & Aarås, A. (2008) Musculoskeletal, visual and psychosocial stress in VDU operators after moving to an ergonomically designed office landscape. Applied ergonomics, 39(3): 284-295.
Hollan J., Hutchins, E. & Kirsh, D. (2000) Distributed cognition: Toward a new foundation for human-computer interaction research. ACM Transactions on computer-human interaction, 7(2):174-196
Hopkinson, R.G. & Longmore, J. (1959) Attention and distraction in the lighting of work-places. Ergonomics, 2: 321-334.
Hopkinson, R.G. (1972) Glare from daylighting in buildings. Applied Ergonomics, 3(1): 206–215.
Inanici, M. & Galvin, J. (2004) Evaluation of High Dynamic Range Photography as a Luminance Mapping Technique, Lawrence Berkeley National Laboratory: 29.
Isen, A.M. & Baron, R.A. (1991) Positive affect as a factor in organizational-behavior. Research in organizational behavior, 13: 1-53.
Iwata, T., Kimura, K., Shukuya, M. & Takano, K. (1991) Discomfort caused by wide source glare. Energy and Buildings, 15(3-4): 391–398.
Johnston, V., Jull, G., Souvlis, T. & Jimmieson, N.L. (2010) Interactive effects from self-reported physical and psychosocial factors in the workplace on neck pain and disability in female office workers, Ergonomics, 53(4): 502-513.
Keegan, J.J. (1953) Alterations of the lumbar curve related to posture and seating. Journal of Bone and Joint Surgery, 35A: 589–603.
Kim, W., Han, H. & Kim, J.T. (2009) The position index of a glare source at the borderline between comfort and discomfort (BCD) in the whole visual field. Building and Environment, 44(7): 1017-1023.
Kittler R., Miroslav, K. & Darula, S. (2012) The neurophysiology and psychophiysics of visual perception. In Daylight Science and Daylighting Technology. Springer.
LaGiusa, F.F. & Perney, L.R. (1973) Brightness patterns influence attention spans. Lighting Design + Application, 3(5): 26-30.
Leaman, A., & Bordass, B. (2001). Assessing building performance in use. 4: The Probe occupant surveys and their implications. Building Research and Information, 29(2): 129–143.
Levitt, M.K. & Hedge, A. (2006). Incomplete recuperation of WMSDs after an office ergonomics intervention. In Proceedings of the Human Factors and Ergonomics Society 50th Annual Meeting (pp. 825–829). Santa Monica, CA: Human Factors and Ergonomics Society.
Loghmani, A., Golshiri, P., Zamani, A., Kheirmand, M. & Jafari, N. (2013). Musculoskeletal symptoms and job satisfaction among office-workers: A Cross-sectional study from Iran. Acta medica academica, 42(1), 46-54.
Lu, H. & Aghazadeh, F. (1996). Risk factors and their interactions in VDT workstation systems. In Proceedings of the Human Factors and Ergonomics Society Annual Meeting, 40(13): 637-641.
MacLeod, C.M. (1991) Half a century of research on the Stroop effect: An integrative review. Psychological Bulletin, 109: 163–203.
Malone, T., Savage-Knepshield, P. & Avery, L. (2007). Human-systems integration: Human factors in a systems context. HFES Bulletin, 50(12): 1-3.

International Journal on Working Conditions, No.8, December 2014
147
Fie
ld s
tudy o
n v
isua
l a
nd c
ogn
itiv
e s
tressors
in
Vis
ua
l D
ispla
y T
erm
ina
l off
ice w
ork
R
oberto
Germ
án R
odrig
uez e
t al.
Mandal, A.C. (1981) The seated man (Homo Sedens) the seated work position. Theory and practice. Applied Ergonomics, 12(1): 19-26.
Mann, S., & Picard, R.W. (1995) On Being “undigital” With Digital Cameras: Extending Dynamic Range by Combining Differently Exposed Pictures. Proceedings of IST, (323), 422-428.
Mills, E. & Borg, N. (1999) Trends in recommended illuminance levels: An international comparison. Journal of the Illuminating Engineering Society, 28(1): 155-163.
McKennan, G.T. & Parry, C.M. (1984) An investigation of task lighting for offices. Lighting Research and Technology, 16: 171-186.
Mocci, F., Serra, A., & Corrias, G. A. (2001). Psychological factors and visual fatigue in working with video display terminals. Occupational and environmental medicine, 58(4): 267-271.
Monteoliva, J.M. (2009) Diseño de un software de autoevaluación ergonómica aplicada a puestos de trabajo con computadoras. In Resúmenes ORP 2009 VII Congreso Internacional de Prevención de Riesgos Laborales. Santiago, Chile.
Newsham, G., Brand, J., Donnelly, C., Veitch, J., Aries, M. & Charles, K. (2009) Linking indoor environment conditions to job satisfaction: a field study. Building Research & Information, 37(2): 129-147.
O’Donnell, R., & Eggemeier, F. (1986). Workload assessment methodology. In K.R. Boff, L. Kaufman & J.P. Thomas II (Eds.), Handbook of perception and human performance, New York: Wiley, pp. 1-49.
OHSCO (2007). Resource Manual for the MSD Prevention Guideline for Ontario. Musculoskeletal Disorders Prevention Series [Manual].
Osterhaus, W.K., & Bailey, I.L. (1992). Large area glare sources and their effect on visual discomfort and visual performance at computer workstations. In Industry Applications Society Annual Meeting, 1992., Conference Record of the 1992 IEEE (pp. 1825-1829).
Osterhaus, W. (2005) Discomfort glare assessment and prevention for daylight applications in office environments. Solar Energy, 79: 140-158.
Portello, J.K., Rosenfield, M., Bababekova, Y., Estrada, J.M. & Leon, A. (2012). Computer‐related visual symptoms in office workers. Ophthalmic and Physiological Optics, 32(5): 375-382.
Pynt, J. (2014). Rethinking design parameters in the search for optimal dynamic seating. Journal of Bodywork and Movement Therapies. In press.
Ranasinghe, P., Perera, Y.S., Lamabadusuriya, D.A., Kulatunga, S., Jayawardana, N., Rajapakse, S., & Katulanda, P. (2011). Work related complaints of neck, shoulder and arm among computer office workers: a cross-sectional evaluation of prevalence and risk factors in a developing country. Environmental Health, 10, 70.
Raynham, P., Osterhaus, W. & Davies, M. (2007). Mapping of brain functions and spatial luminance distributions as innovative tools for assessing discomfort glare in the built environment. ARCC Journal, 4(1): 87-92.
Rocha, L.E. & Debert-Ribeiro, M. (2004) Working conditions, visual fatigue, and mental health among systems analysts in Sao Paulo, Brazil. Occupational and environmental medicine, 61(1): 24-32.
Rodriguez, R.G., & Pattini, A. (2011). An online tool to identify white-collar worker profiles in relation to their ICT skills and mental strain. Cognition, Technology & Work, 13(2): 81-91.
Rodriguez, R. & Pattini, A. (2012). Deslumbramiento molesto causado por ventanas: comparación entre predicciones y sensaciones. In Resúmenes Luxamerica 2012. Cartagena, Colombia.
Rodríguez, R., Pattini, A., Villarruel, C. (2013) Protocolo para la medición de la iluminación en el ambiente laboral de la Superintendencia de Riesgos de Trabajo. Aplicación y análisis de una propuesta complementaria. AVERMA, 17.
Salanova M., Llorens S., & Cifre E. (2013). The Dark Side of Technologies: Technostress among users of Information and Communication Technologies. International Journal of Psychology, 48(3): 422-436.
Sellberg, C., & Susi, T. (2014).Technostress in the office: a distributed cognition perspective on human–technology interaction. Cognition, technology & work, 16(2): 187-201.

International Journal on Working Conditions, No.8, December 2014
148
Fie
ld s
tudy o
n v
isua
l a
nd c
ogn
itiv
e s
tressors
in
Vis
ua
l D
ispla
y T
erm
ina
l off
ice w
ork
R
oberto
Germ
án R
odrig
uez e
t al.
Shackel, B. (1991). Usability – context, framework, definition, design and evaluation. En: Shcakel, B., Richardson, S. (Eds.), Human Factors for Informatics Usability. Cambridge University Press, Cambridge, UK.
Shahnavaz, H. (1987). Workplace injuries in the developing countries. Ergonomics, 30(2): 397-404.
SHCP Task 21 (1999). Post occupancy evaluation of daylight in buildings. International Energy Agency.
Slater, A.I., Perry, M.J. & Carter, D.J. (1993). Illuminance differences between desks: Limits of acceptability. Lighting Research and Technology, 25: 91-103.
Smith, M.J., Stammerjohn, L.W., Cohen, B. & Happ, A. (1981). Investigation of health complaints and job stress in video display terminals operators. Human Factors, 23: 387–400.
Staffel, F. (1884). Allgem Gesundheitspfleg, 3: 403-411.
Stiles, W.S. (1929). The effect of glare on the brightness difference threshold. Proceedings of the Royal Society of London (104) 731: 322-355.
Stroop, J.R. (1935). Studies of interference in serial verbal reactions. Journal of Experimental Psychology, 18: 643–662.
van Maanen, L., van Rijn, H. & Borst, J.P. (2009). Stroop and picture-word interference are two sides of the same coin. Psychonomic Bulletin and Review, 16(6): 987–99.
Veitch, J.A. (2001). Psychological processes influencing lighting quality. Journal of the Illuminating Engineering Society, 30(1): 124-140.
Veitch, J.A., Charles, K.E. & Newsham, G.R. (2004). Workstation design for the open-plan office (Construction Technology Update No. 61). Ottawa, ON: NRC Institute for Research in Construction.
von Elm, E., Altman, D.G., Egger, M., Pocock, S.J., Gøtzsche, P.C. & Vandenbroucke, J.P. (2008). The Strengthening the Reporting of Observational Studies in Epidemiology (STROBE) statement: guidelines for reporting observational studies. Journal of Clinical Epidemiology, 61(4): 344-349.
Vos, J.J. (2003). Reflections on glare. Lighting Research and Technology, 35(2): 163-176.
Walpole, R., Myers, R. & Myers, S. (1999) Probabilidad y estadística para ingenieros. Mexico, Pearson Education.
Ward Larson, G., & Shakespeare, R. (1998). Rendering with Radiance, Morgan Kaufmann.
Wästlund, E. (2007) Experimental Studies of Human-Computer Interaction: Working memory and mental workload in complex cognition. PhD. Gothenburg University.
Weevers, H.J.A., van der Beek, A.J., Anema, J.R., van der Wal, G. & van Mechelen, W. (2005). Work-related disease in general practice: a systematic review. Family Practice, 22(2): 197-204.
Wickens, C.D. (1984). Processing resources in attention. In R. Parasuraman and D.R. Davies (Eds.). Varieties of attention. (pp. 63-102). London: Academic Press.
Wienold, J. & Christoffersen, J. (2006). Evaluation methods and development of a new glare prediction model for daylight environments with the use of CCD cameras. Energy and Buildings, 38: 743–757.
World Health Organization (1988). Visual Display Units. Geneva, Switzerland: WHO; 1988.