international journal of scientific & technology … · gnss chipsets, modules and boards. it...
TRANSCRIPT

INTERNATIONAL JOURNAL OF SCIENTIFIC & TECHNOLOGY RESEARCH VOLUME 9, ISSUE 01, JANUARY 2020 ISSN 2277-8616
1935 IJSTR©2020
www.ijstr.org
Evaluation of Low-cost GNSS Single Frequency Receiver Using Satrack Software
D.Abhishek Reddy, K.Dinesh Reddy, V. Appala Raju, A. Purna Sai Chandra Reddy, GSV Prasad
ABSTRACT: Satrack is an evaluation software, providing system integrators and end users with a quick and simple way to interface with ALLYSTAR GNSS chipsets, modules and boards. It supports easy Satellite communication, geographical information, logging data receiving, GNSS messages analysing, satellite tracking and graphical representation of signalling. Satrack is designed to communicate with ALLYSTAR’s Cynosure GNSS receiver
via serial port or USB port. It provides general GNSS functions as well as real time and playback evaluation tools. The tested modes of operations are Static and Dynamic. The data required for evaluation were obtained from low-cost Global Navigation Satellite System (GNSS) receiver. The low-cost receivers used were Allystar TAU1302. Information including raw carrier phase measurements are provided by this receiver. Cent imetre-level precision
of positioning can be achieved by this receiver. Keywords: GNSS Receiver, Low-cost, Evaluation, Tracking, Static, Dynamic.
—————————— ——————————
I. INTRODUCTION Global Navigation Satellite System(GNSS) at present includes many satellites that revolve around Earth without interruption. With the help of a code or pseudo range signal, the users of GNSS can establish their position, example: latitude, longitude, and height on the Earth by measuring distance from satellite for a minimum of 4 satellites at a time. GNSS is used in many applications with accuracy ranging from several meters to millimeters [1, 2]. The receiver for geodetic survey that has a dual frequency will give positioning accuracy up to mm. But this mentioned equipment is of high cost. Now a day’s receivers are available for GNSS users at a very low cost. These receivers can be easily handled and embedded [3, 4]. Real Time Kinematic (RTK) is also equipped with the receiver which is one of the precise positioning methods which can secure accuracy of position up to centimeter level utilizing phase data measurement in real time. Only single frequency is supported by low cost receivers. Using a low-cost receiver namely RTKLIB, an open source program package for RTK is developed by [5]. This program enables the receivers to acquire measurement of raw of GPS data. By Using RTK approach, the low cost GPS can be improved to secure a good accuracy. In this paper, we will analyze the working of single frequency low cost receiver: Allystar TAU1302. Thus, we contrast their performance with the survey-grade receiver: Topcon GB-1000.
II. DESCRIPTION OF SOFTWARE AND
HARDWARE Software Satrack is an evaluation software figure [1], which gives end users and system integrators a quick and simple way to interface with ALLSTAR GNSS board modules and chipset. It can give information about logging data receiving, satellite communication, GNSS message analyzing, satellite tracking and Graphical representation of signaling & information. It provides general GNSS functions as well as play back evaluation tools and in real time. Satrack is designed such that, communication with ALLYSTAR’S cynosure GNSS receiver via USB port or serial port. Most of the GNSS users have sensors which are at low cost. The benefit of purchasing or using a low cost receiver is they are small in size, embedding and easy handling [9]. We use RTK-library file to plot the signals that are received by the receiver and compare the position, velocity and error rate. GOOGLE EARTH is used
in observing the position of an object while in resting position and in motion.
Figure1.Satrack Main Screen Position Information: ―Aero Position Information‖, this platform includes all the information of aero position. Here we can see the latitude and longitudinal positions of the receiver [12] as well as the altitude, mode, PDOP, HDOP, VDOP, Satellites in visibility and satellites in usage. The heading point and the UTC is also calculated by receiving the signals from the satellites. That information is displayed as below
Figure 2. Position Information Port Monitor: This platform allows user to view ASCII message data. A

INTERNATIONAL JOURNAL OF SCIENTIFIC & TECHNOLOGY RESEARCH VOLUME 9, ISSUE 01, JANUARY 2020 ISSN 2277-8616
1936 IJSTR©2020
www.ijstr.org
sample figure of the monitor can be seen in Figure 3.
Figure 3. Port Monitor with NMEA messages (ASCII) Signal Quality: The Signal Strength platform shows the information of signal quality. It uses the GSV NMEA messages to extract the signal to noise ratio (SNR C/No) and GSA NMEA messages to extract to satellites in use. The number of SNR bars will vary according to the number of satellites in view [14]. SNR values are displayed above each corresponding bar. Full scale is considered for any SNR value of 55 dB or above. Satellite IDs are displayed to identify respective satellites below the signal bars. Signal bars are displayed in brighter colour if the satellite in view is in used as well. Otherwise, signal bars will be displayed with a transparent colour.
Figure 4. Signal Strength
Satellites’ azimuth and elevation: The sky plot can adjust its forward side (upper side) according to the heading direction provided by the GNSS receiver. The Sky Plot platform shows the information of azimuth and elevation. It shows satellite position and the physical antenna mask angle. The satellite position is represented using azimuth, ranging from 0° to 360°, and elevation, ranging from 0° to 90° where 0° is the horizon[11]. Similar to the Signal Bar platform, Sky Plot platform uses the GSV NMEA messages to extract azimuth and elevation for each satellite that is in view and GSA NMEA messages to extract the in-use satellites. Satellite IDs are displayed near the ―X‖ plot to identify respective satellites [13]. Plots are displayed in a brighter colour for the in used satellites while with transparent colour for the not in use ones.
Figure 5. Sky Plots with plots HARDWARE: Allystar technology co-limited have developed and launched a multi-band, multi-GNSS module TAU1302 which integrates HD9310 chipset and comes in size of 12 x 16 x 2.13 millimetres [8]. This module is used widely because of the factors such as low power consumption (<50mA), small size and easy for mass production and integration.
Figure 6. Module chip TAU1302
Figure 7. Hardware Setup
In the above figure the experiment setup was done. The power supply for the receiver is given through the PC. Using the SATRACK software all the results is done. This experiment tells us about how much error occurs when the receiver in static state and when it is in dynamic state. We can find the exact position of the satellites which are rotating around the earth.
INTERNATIONAL JOURNAL OF SCIENTIFIC & TECHNOLOGY RESEARCH VOLUME 9, ISSUE 01, JANUARY 2020 ISSN 2277-8616
1937 IJSTR©2020
www.ijstr.org
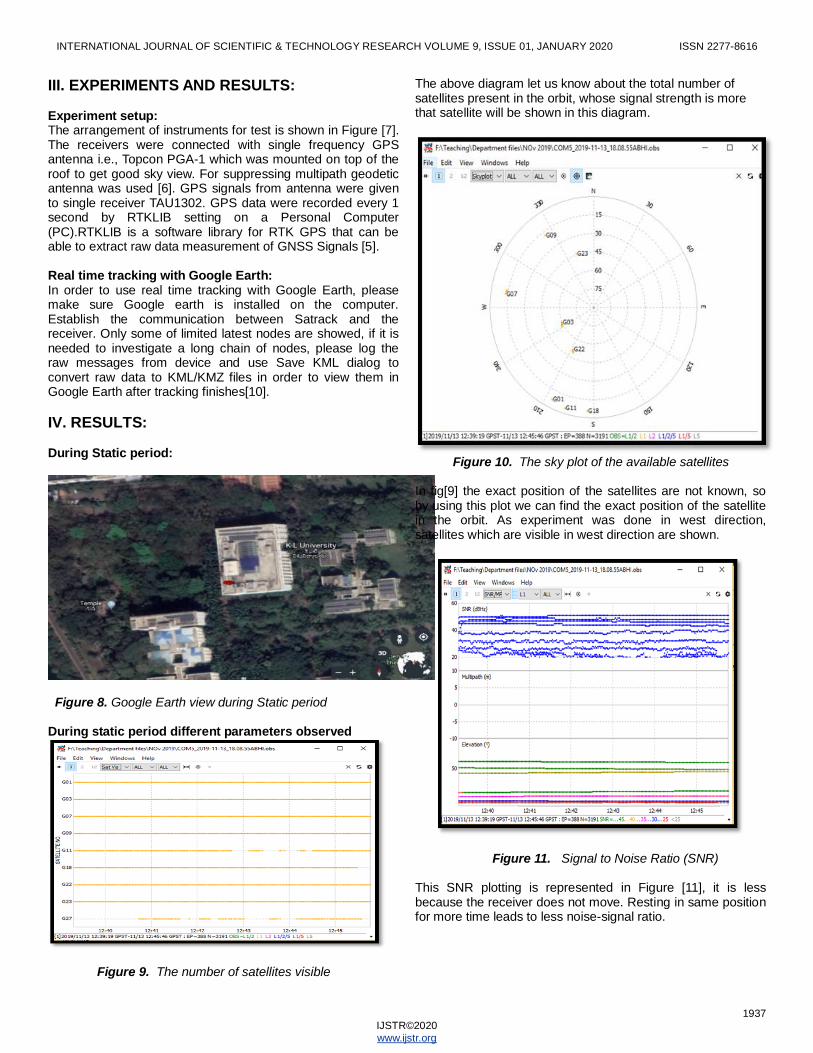
III. EXPERIMENTS AND RESULTS: Experiment setup: The arrangement of instruments for test is shown in Figure [7]. The receivers were connected with single frequency GPS antenna i.e., Topcon PGA-1 which was mounted on top of the roof to get good sky view. For suppressing multipath geodetic antenna was used [6]. GPS signals from antenna were given to single receiver TAU1302. GPS data were recorded every 1 second by RTKLIB setting on a Personal Computer (PC).RTKLIB is a software library for RTK GPS that can be able to extract raw data measurement of GNSS Signals [5]. Real time tracking with Google Earth: In order to use real time tracking with Google Earth, please make sure Google earth is installed on the computer. Establish the communication between Satrack and the receiver. Only some of limited latest nodes are showed, if it is needed to investigate a long chain of nodes, please log the raw messages from device and use Save KML dialog to convert raw data to KML/KMZ files in order to view them in Google Earth after tracking finishes[10].
IV. RESULTS: During Static period:
Figure 8. Google Earth view during Static period During static period different parameters observed
Figure 9. The number of satellites visible
The above diagram let us know about the total number of satellites present in the orbit, whose signal strength is more that satellite will be shown in this diagram.
Figure 10. The sky plot of the available satellites
In fig[9] the exact position of the satellites are not known, so by using this plot we can find the exact position of the satellite in the orbit. As experiment was done in west direction, satellites which are visible in west direction are shown.
Figure 11. Signal to Noise Ratio (SNR) This SNR plotting is represented in Figure [11], it is less because the receiver does not move. Resting in same position for more time leads to less noise-signal ratio.
INTERNATIONAL JOURNAL OF SCIENTIFIC & TECHNOLOGY RESEARCH VOLUME 9, ISSUE 01, JANUARY 2020 ISSN 2277-8616
1938 IJSTR©2020
www.ijstr.org
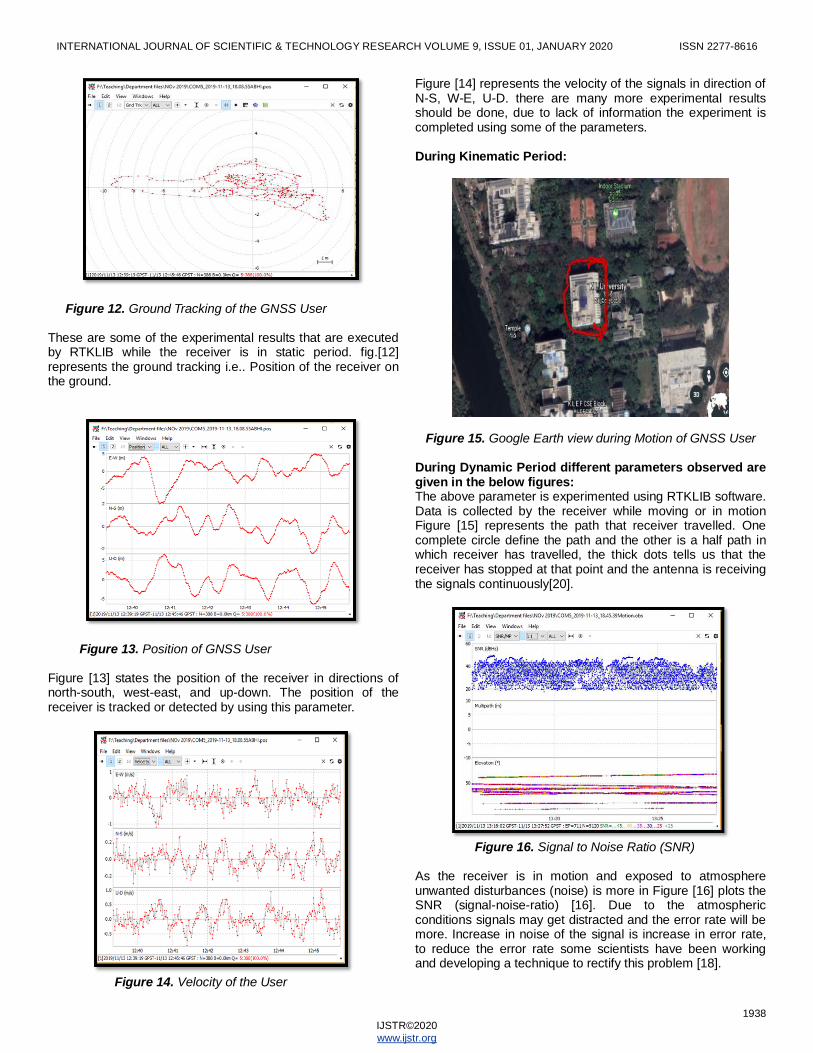
Figure 12. Ground Tracking of the GNSS User These are some of the experimental results that are executed by RTKLIB while the receiver is in static period. fig.[12] represents the ground tracking i.e.. Position of the receiver on the ground.
Figure 13. Position of GNSS User Figure [13] states the position of the receiver in directions of north-south, west-east, and up-down. The position of the receiver is tracked or detected by using this parameter.
Figure 14. Velocity of the User
Figure [14] represents the velocity of the signals in direction of N-S, W-E, U-D. there are many more experimental results should be done, due to lack of information the experiment is completed using some of the parameters. During Kinematic Period:
Figure 15. Google Earth view during Motion of GNSS User During Dynamic Period different parameters observed are given in the below figures: The above parameter is experimented using RTKLIB software. Data is collected by the receiver while moving or in motion Figure [15] represents the path that receiver travelled. One complete circle define the path and the other is a half path in which receiver has travelled, the thick dots tells us that the receiver has stopped at that point and the antenna is receiving the signals continuously[20].
Figure 16. Signal to Noise Ratio (SNR) As the receiver is in motion and exposed to atmosphere unwanted disturbances (noise) is more in Figure [16] plots the SNR (signal-noise-ratio) [16]. Due to the atmospheric conditions signals may get distracted and the error rate will be more. Increase in noise of the signal is increase in error rate, to reduce the error rate some scientists have been working and developing a technique to rectify this problem [18].

INTERNATIONAL JOURNAL OF SCIENTIFIC & TECHNOLOGY RESEARCH VOLUME 9, ISSUE 01, JANUARY 2020 ISSN 2277-8616
1939 IJSTR©2020
www.ijstr.org
Figure 17. Number of Satellites
Figure 18. Ground Tracking Of GNSS User The ground tracking of the receiver is plotted and shown in Figure [18]. Receiver is moving continuously in a path, ground tracking is shown in which the receiver has moved.
Figure 19. Velocity of the GNSS User The velocity and position of the signals is plotted in Figure [19, 20]. Receiver is in dynamic period velocity change occurs in all directions. The receiver is moving in all the directions at same
speed, therefore position also changes. Figure [17] define the DOP i.e. number of satellites in orbit [19].
Figure 20. Position of the GNSS User By comparing both the static and dynamic periods, we conclude that dynamic period exhibits more error rate than static period [15]. To reduce the error some techniques have been proposed by scientists such as DNN, DBN etc. By overcoming the error rate the system provides accurate position of the satellite.
5. CONCLUSION The general results are promising especially when we look at the inexpensiveness of the receiver and the results of both static and kinematic positioning. As the usage of ALLYSTAR
software in the real‐time is also possible so taking into consideration the time of computation (50 seconds in the combined mode) porting the RTKLIB to the mobile device or a Personal Computer (pc) and doing the computation in the field is even more attractive[17]. It is shown that in general, the low cost GPS receiver gives good results. Using RTK method, the precision can be lessened from meters to centimeters.
6 REFERENCES
[1] Leick A, Rapoport L and Tatarnikov D 2015 GPS Satellite Surveying, Fourth Edition: John Wiley and Sons Inc
[2] Hofmann-Wallenhof B, Lichteneger H and Collins J 2001 Global Positioning system - Theory and Practice: Springer-Verlag Wien
[3] Santerre R, Pan L, Cai C and Zhu J 2014 Single Point Positioning Using GPS, GLONASS and BeiDou Satellites Positioning 5 107-14
[4] Liu T and Li B 2017 Single-frequency BDS/GPS RTK With Low-cost Ublox Receivers. In: CPGPS 2017 Forum on Cooperative Positioning and Service, (Harbin, China: IEEE)
[5] Takasu T and Yusuda A 2009 Development of the low-cost RTK-GPS receiver with an open source program package RTKLIB. In: International Symposium on GPS/GNSS, Jeju, South Korea
[6] Kumar Dabbakuti J.R.K., Venkata Ratnam D., Characterization of ionospheric variability in TEC using EOF and wavelets over low-latitude GNSS stations ,2016, Advances in Space Research, Vol: 57, Issue: 12, pp: 2427 - 2443, ISSN 2731177

INTERNATIONAL JOURNAL OF SCIENTIFIC & TECHNOLOGY RESEARCH VOLUME 9, ISSUE 01, JANUARY 2020 ISSN 2277-8616
1940 IJSTR©2020
www.ijstr.org
[7] Raghunath S., Venkata Ratnam D., Detection of ionospheric spatial and temporal gradients for ground-based augmentation system applications, 2016, Indian Journal of Radio and Space Physics, Vol: 45, Issue: 1, pp: 11 - 19, ISSN 3678393
[8] Dabbakuti J.R.K.K., Ratnam D.V., Sunda S., Modelling of ionospheric time delays based on adjusted spherical harmonic analysis ,2016, Aviation, Vol: 20, Issue: 1, pp: 1 - 7, ISSN 16487788
[9] Sridhar M., Venkata Ratnam D., Uday Bhaskar T., Leela Prasanna A., Rohit B., Ramaraju A. , Analysis of fading effects due to ionospheric scintillations using modern GNSS signals observed at northern low latitude station ,2016 , ARPN Journal of Engineering and Applied Sciences ,Vol: 11 ,Issue: 15 ,pp: 9329 - 9334 ,ISSN 18196608
[10] Ratnam, D. V., Dabbakuti, J. R. K. K., & Sunda, S. (2017). Modeling of ionospheric time delays based on a multishell spherical harmonics function approach. IEEE Journal of Selected Topics in Applied Earth Observations and Remote Sensing, 10(12), 5784-5790. DOI:10.1109/JSTARS.2017.2743695
[11] Dabbakuti J.R.K.K., Venkata Ratnam D.,Modeling and analysis of GPS-TEC low latitude climatology during the 24th solar cycle using empirical orthogonal functions,2017 Advances in Space Research ,Vol: 60,Issue: 8, pp: 1751 -1764,DOI:10.1016/j.asr.2017.06.048,ISSN:2731177
[12] Sivavaraprasad G., Otsuka Y., Tripathi N.K., Chowdhary V.R., Ratnam D.V., Khan M.A. .," Spatial and temporal characteristics of ionospheric total electron content over Indian equatorial and low-latitude GNSS stations ―, 2018, International Journal of Engineering and Technology(UAE) ,Vol: 7 ,Issue: 1.1 ,pp: 534 to:: 538 ,DOI: ,ISSN: 2227524X
[13] I. Srivani, G. Sivavaraprasad, and D. Venkata Ratnam, ―A Deep Learning-Based Approach to Forecast Ionospheric Delays for GPS Signals‖ IEEE Geoscience and Remote Sensing Letters, March 2019. (Impact Factor: 2.9)
[14] Sahithi K., Sridhar M., Kotamraju S.K., Kavya K.C.S., Sr., Sivavaraprasad G., Ratnam D.V., Deepthi C., "Characteristics of ionospheric scintillation climatology over Indian low-latitude region during the 24th solar maximum period",Geodesy and Geodynamics, ISSN: 16749847, 2019, DOI: 10.1016/j.geog.2018.11.006
[15] RTKLIB, http://www.rtklib.com/, accessed 2017-04-104
[16] Odolinski R, Teunissen P J G, Odijk D. Combined BDS, Galileo, QZSS and GPS single-frequency RTK. GPS Solut, 2015, 19(1):151-163.
[17] Yang Y, He H, Xu G. Adaptively robust filtering for kinematic geodetic
[18] Biagi, L.; Grec, F.; Negretti, M. Low-Cost GNSS Receivers for Local Monitoring: Experimental Simulation, and Analysis of Displacements. Sensors 2016, 16, 2140.
[19] Du, C.H.; Gao, X.W.; Ma, Y.; Yang, S.X.; Chen, J.H.; Yang, K.Y. Performance analysis of RTK positioning for single-frequency combination of BDS and GPS. In Proceedings of the China Satellite Navigation Conference, Harbin, China, 23–25 May 2018.
[20] Zhou Z, Li B. GNSS windowing navigation with adaptively constructed dynamic model. GPS Solut, 2015, 19(1):37-48.